Abstract
Metaplasia can result when injury reactivates latent developmental signaling pathways that determine cell phenotype. Barrett’s esophagus is a squamous-to-columnar epithelial metaplasia caused by reflux esophagitis. Hedgehog (Hh) signaling is active in columnar-lined, embryonic esophagus and inactive in squamous-lined, adult esophagus. We showed previously that Hh signaling is reactivated in Barrett’s metaplasia and overexpression of Sonic hedgehog (SHH) in mouse esophageal squamous epithelium leads to a columnar phenotype. Here, our objective was to identify Hh target genes involved in Barrett’s pathogenesis. By microarray analysis, we found that the transcription factor Foxa2 is more highly expressed in murine embryonic esophagus compared with postnatal esophagus. Conditional activation of Shh in mouse esophageal epithelium induced FOXA2, while FOXA2 expression was reduced in Shh knockout embryos, establishing Foxa2 as an esophageal Hh target gene. Evaluation of patient samples revealed FOXA2 expression in Barrett’s metaplasia, dysplasia, and adenocarcinoma but not in esophageal squamous epithelium or squamous cell carcinoma. In esophageal squamous cell lines, Hh signaling upregulated FOXA2, which induced expression of MUC2, an intestinal mucin found in Barrett’s esophagus, and the MUC2-processing protein AGR2. Together, these data indicate that Hh signaling induces expression of genes that determine an intestinal phenotype in esophageal squamous epithelial cells and may contribute to the development of Barrett’s metaplasia.
Introduction
Metaplasia, the replacement of one fully differentiated cell type by another, is a response to chronic injury that often predisposes to cancer (1). For example, gastric intestinal metaplasia in response to H. pylori gastritis predisposes to gastric cancer (2), squamous metaplasia of respiratory epithelium in response to cigarette smoking predisposes to lung cancer (3), and columnar metaplasia of the esophagus (Barrett’s esophagus) in response to reflux esophagitis predisposes to esophageal adenocarcinoma (4). Tissue injury and repair can reactivate latent developmental signaling pathways (5), and, therefore, metaplasia frequently gives rise to a cell that is embryonically related to, albeit phenotypically different from, the cell it replaces (1). Reactivation of developmental signaling pathways also frequently accompanies cancer development (5). Thus, understanding the relationship between developmental pathway signaling and cell phenotype specification could provide insight into the molecular basis of cellular differentiation, tissue-specific metaplasia, and carcinogenesis.
A key developmental signaling pathway that is involved in cell fate specification, injury repair, and carcinogenesis is the Hedgehog (Hh) signaling pathway (6). In vertebrates, Hh signaling occurs when 1 of 3 Hh ligands (Sonic, Indian, or Desert) binds to the Hh receptor patched (PTCH). In the absence of ligand, PTCH inhibits the signal transducer protein smoothened (SMO) and leads to accumulation of repressor GLI transcription factors (6). Upon ligand binding, repression of SMO by PTCH is released and signal transduction occurs through activator GLI transcription factors that activate pathway targets, such as PTCH and GLI1. GLI1 positively regulates pathway target genes, while GLI2 can either activate or repress pathway targets and GLI3 generally represses pathway targets.
We chose as a disease model Barrett’s esophagus, the condition in which an intestinal-type columnar epithelium that predisposes to adenocarcinoma replaces esophageal stratified squamous epithelium that has been injured by chronic gastroesophageal reflux disease (GERD) (4). Since approximately 20% of adult Americans have GERD (7) and the frequency of esophageal adenocarcinoma in the United States has increased more than 7-fold over the past few decades (8), understanding the pathogenesis of Barrett’s metaplasia has become an area of intense study.
A number of signaling pathways and transcription factors have been implicated in the pathogenesis of Barrett’s metaplasia, based on their roles in the normal gastrointestinal tract (9). Conceivably, squamous epithelium might be induced to assume a columnar phenotype through decreased expression of squamous cell transcription factors, such as p63 (10, 11) or SOX2 (12, 13), or through increased expression of columnar cell transcription factors, such as CDX1 (14, 15), CDX2 (16, 17), SOX9 (18, 19), or MATH1 (20). Indeed, decreased expression of squamous transcription factors and increased expression of columnar transcription factors have been reported in biopsy specimens of metaplastic epithelia from patients with Barrett’s esophagus (19, 21–23).
Early in embryonic life, when the esophagus is lined by columnar epithelium, esophageal Hh signaling is active. Later, as the embryonic columnar lining differentiates into stratified squamous epithelium, Hh signaling is extinguished. In earlier studies, we showed that the surgical induction of gastroesophageal reflux in the mouse could reactivate esophageal Hh signaling (19). We also demonstrated that the Hh signaling pathway is reactivated in Barrett’s metaplasia, and we found evidence of epithelial-mesenchymal Hh signaling (with expression of Hh ligands by epithelial cells and BMP4 expression by mesenchymal cells) in Barrett’s tissue specimens but not in specimens of squamous-lined esophagus (19). We further showed that BMP4 could stimulate esophageal squamous cells to produce the transcription factor SOX9, which induces the squamous cells to express columnar cytokeratins (19).
Several types of columnar epithelia have been described in Barrett’s esophagus, including an atrophic gastric fundic-type epithelium, a junctional-type epithelium (also called cardiac epithelium), and an intestinal-type epithelium (also called specialized intestinal metaplasia) that has goblet cells and expresses the intestinal-type mucin MUC2 (24, 25). Only specialized intestinal metaplasia clearly predisposes to adenocarcinoma, which is why American gastroenterology societies require the demonstration of specialized intestinal metaplasia in esophageal biopsy specimens as a diagnostic criterion for Barrett’s esophagus (26). We have shown that reactivation of epithelial Hh signaling in the mouse esophagus might result in columnar metaplasia (19), but to establish a potential role for Hh signaling in the pathogenesis of human Barrett’s esophagus, it is important to demonstrate that this signaling can produce cells with intestinal features.
The objective of our current study was to identify additional Hh pathway target genes that participate in the phenotypic specification of epithelial cells during normal esophageal development and to determine whether those genes might contribute to the formation of Barrett’s specialized intestinal metaplasia. By microarray analysis of the developing mouse esophagus, we found that Foxa2 (also known as Hnf3b) is more highly expressed in the embryonic esophagus than in the postnatal esophagus. Foxa2 is known to be a Sonic hedgehog (SHH) target gene in the central nervous system and a required foregut endodermal transcription factor (27–29). We demonstrate that FOXA2 is a target of Hh signaling in the embryonic mouse esophageal epithelium as well as in human Barrett’s epithelial cells and esophageal squamous epithelial cells derived from patients with Barrett’s esophagus. Moreover, we found that overexpression of FOXA2 in human esophageal squamous epithelial cells induces expression of MUC2 and AGR2 (an endoplasmic reticulum protein involved in MUC2 processing) (25, 30–33). These studies suggest that the Hh target gene FOXA2 is involved in the pathogenesis of the specialized intestinal type of Barrett’s metaplasia.
Results
FOXA2 is expressed in columnar epithelial cells of the embryonic esophagus and the adult intestine.
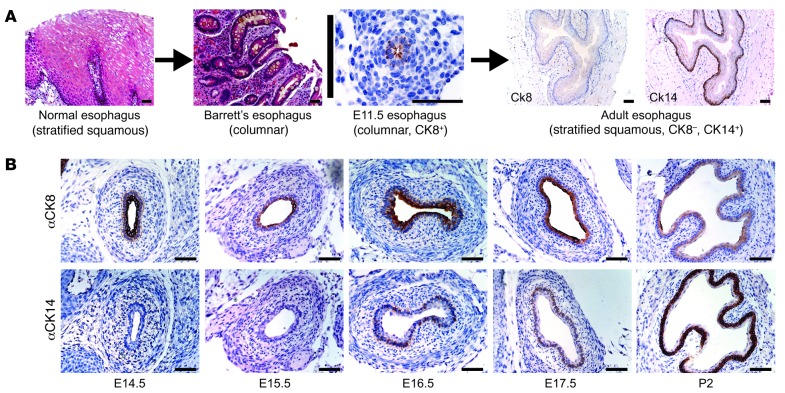
During normal development, the mouse embryonic esophagus initially is lined by a columnar epithelium that expresses cytokeratin 8 (CK8). Later, this differentiates into a stratified squamous epithelium that expresses CK14 (Figure 1A and ref. 34). Realizing that this pattern of epithelial replacement is the opposite of what occurs during the formation of columnar metaplasia in Barrett’s esophagus (Figure 1A), we began our studies by isolating whole C57BL/6 mouse esophagi from embryonic day 15.5 (E15.5) embryos and 2-day-old (P2) pups. These time points were chosen because the columnar-lined esophagus showed the earliest signs of squamous differentiation, with initial expression of CK14 in basal cells between E15.5 and E16.5, and because in the P2 esophagus the cytokeratin expression profile was markedly more squamous (Figure 1B).
Figure 1. Esophageal development and Barrett’s esophagus.
(A) In esophageal development, the normal process of epithelial maturation (columnar to stratified squamous) is opposite of what is seen in Barrett’s esophagus, in which the stratified squamous epithelium lining the adult esophagus undergoes columnar metaplasia. (B) Columnar CK8 and squamous CK14 immunohistochemistry in mouse E14.5–E17.5 esophagus and P2 esophagus. Scale bars: 50 μm.
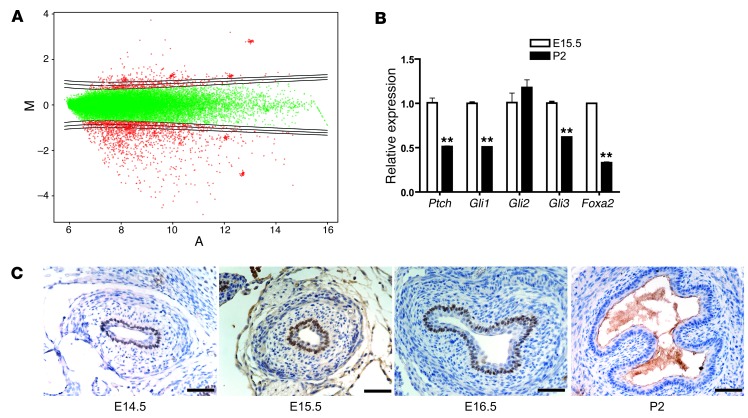
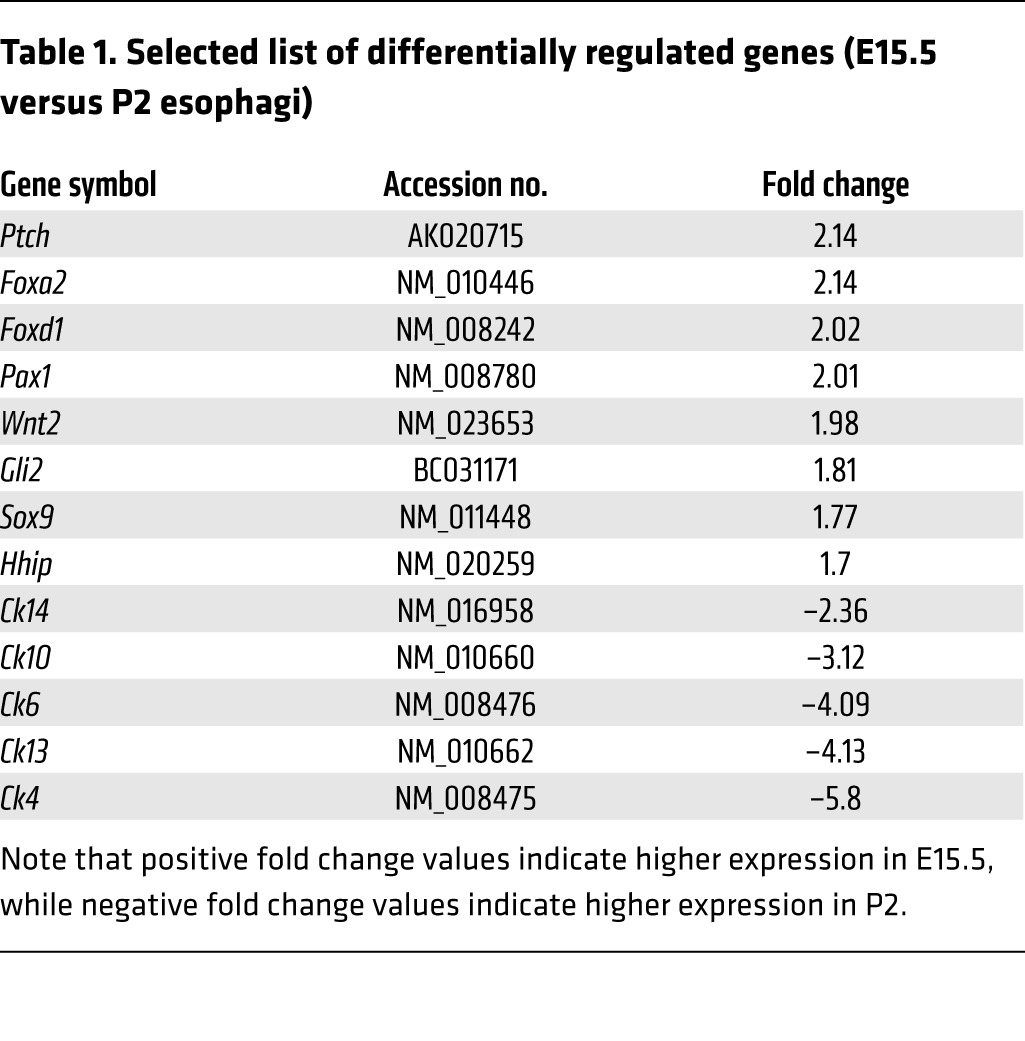
Total RNA from separately pooled E15.5 and P2 esophagi was reverse transcribed and hybridized to an Agilent Whole Mouse Genome 44k microarray (Figure 2A). Overall, we found a pattern of differentially regulated genes that was consistent with high Hh activity in the columnar esophageal epithelium at E15.5 and with low Hh activity in the stratified squamous epithelium at P2 (Table 1). For example, we found that Hh pathway components such as Ptch, Hh interacting protein (Hhip), and Gli2 were more highly expressed in the E15.5 esophagi, while the P2 esophagi exhibited higher expression of squamous cytokeratins (Ck4, Ck6, Ck10, Ck13, and Ck14). We also found that Sox9, a gene we implicated previously in the development of Barrett’s esophagus (19), was more highly expressed in the E15.5 esophagi. Although we identified a number of candidate columnar genes, we chose to focus on the transcription factor Foxa2, which was expressed at levels 2.14 times higher in the E15.5 esophagi than in the P2 esophagi. We chose Foxa2 because it is a putative SHH target gene in the developing neural tube, it is required for the proper differentiation of endoderm, and it can induce expression of the goblet cell mucin MUC2 (which is found in Barrett’s specialized intestinal metaplasia) in intestinal epithelium (35, 36). Quantitative real-time PCR (qRT-PCR) was used to validate the microarray results for expression of Hh pathway genes and Foxa2 (Figure 2B).
Figure 2. Microarray analysis identifies Foxa2.
(A) MvA plot of E15.5 esophagi versus P2 esophagi microarray experiment. (B) Validation of microarray results with qRT-PCR for Hh pathway/target genes and Foxa2. **P < 0.01 as compared with E15.5. (C) FOXA2 immunohistochemistry of E14.5 to E16.5 esophagus and P2 esophagus. Scale bars: 50 μm.
Table 1.
Selected list of differentially regulated genes (E15.5 versus P2 esophagi)
To confirm a previous report of FOXA2 expression in the E15.5 mouse esophagus (37), we next sought to determine FOXA2’s temporal expression pattern during mouse embryonic esophageal development. We found that nuclear FOXA2 was expressed as early as E11.5 in mouse esophageal epithelium (data not shown) and continued to be expressed in a subset of esophageal epithelial cells between E14.5 and E17.5 (Figure 2C and data not shown for E17.5), correlating with esophageal expression of cytoplasmic CK8 (Figure 1B), but disappeared by P2 (Figure 2C) when the esophageal epithelium was distinctively squamous (Figure 1B). Neither FOXA2 nor CK8 was expressed in adult mouse esophageal epithelium, but both were expressed in the adult mouse small intestine (Supplemental Figure 1, A–D; supplemental material available online with this article; doi:10.1172/JCI66603DS1). We next performed FOXA2 immunohistochemistry on adult human gut tissues and found FOXA2 expression in columnar epithelia of the stomach, small intestine, and colon but not in squamous esophageal epithelia (Supplemental Figure 1, E–H). These findings suggest that FOXA2 expression plays a role in columnar differentiation in both mouse and human gastrointestinal tract epithelia.
FOXA2 is induced by Hh signaling in mouse esophageal epithelial cells.
Since proper development of the mouse esophagus requires Hh signaling (38, 39) and since Foxa2 is a Hh target gene during neural tube formation (27), we postulated that FOXA2 expression in the mouse esophagus might be dependent on SHH. We previously developed an in vivo transplant culture system, which recapitulates the 3D structure of the mouse esophagus, with stratified squamous epithelium overlying fibroblasts (19). Cultures made with esophageal epithelia from conditionally activated Shh transgenic (ShhTg) mice expressed epithelial Shh and exhibited columnar phenotypic features, including nuclei oriented perpendicular to overlying stratified squamous epithelium (19). These columnar features were not seen in similar cultures made from wild-type esophageal epithelia. FOXA2 immunohistochemistry showed that in vivo transplant cultures made from conditionally activated ShhTg epithelial cells expressed nuclear FOXA2 (Figure 3B), while cultures made from wild-type esophageal epithelial cells did not (Figure 3A).
Figure 3. Foxa2 is an esophageal Hh target gene.
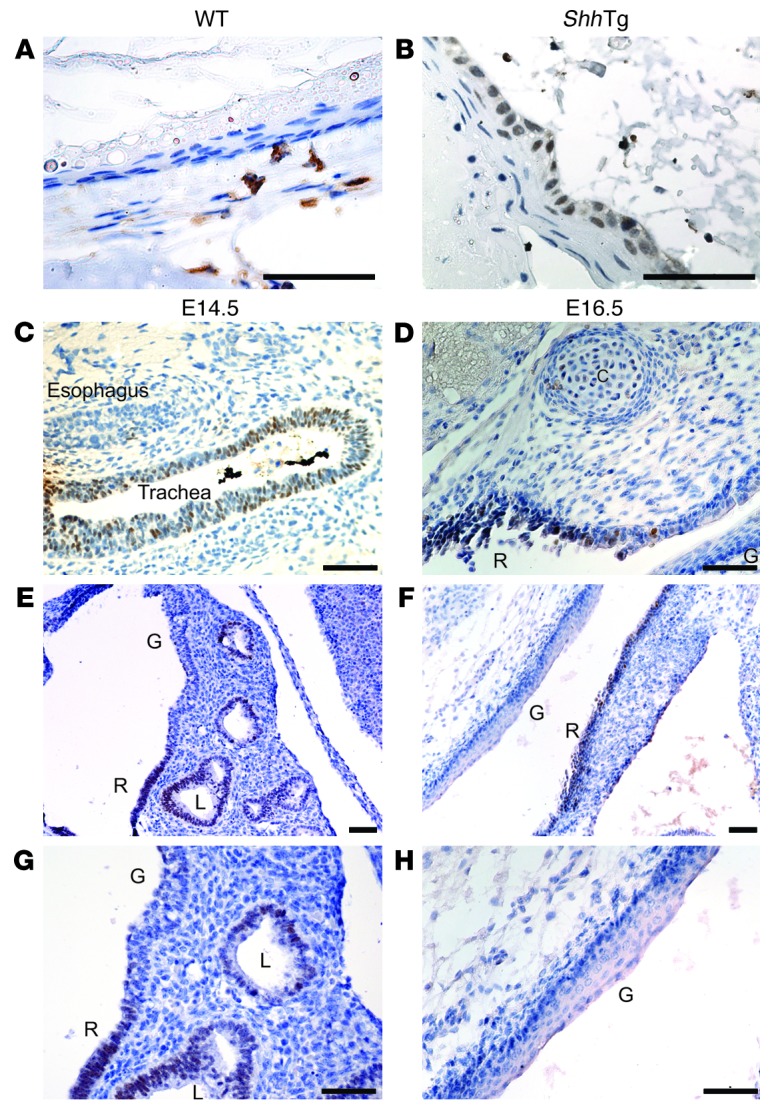
FOXA2 expression is upregulated in ShhTg mouse esophageal epithelium. FOXA2 immunohistochemistry in 3D in vivo transplant cultures made with (A) wild-type or (B) ShhTg esophageal epithelial cells. FOXA2 expression is downregulated in Shh–/– embryos. FOXA2 immunohistochemistry in E14.5 (C) esophagus and trachea and (E) distal foregut and E16.5 (D) proximal foregut and (F) distal foregut. (G and H) Higher magnification images of sections shown in E and F, respectively. Gastrointestinal (G) and respiratory (R) epithelium, cartilage (C), and cystic lung (L) are indicated. Scale bars: 50 μm.
FOXA2 induction by Hh signaling is independent of Sox9.
Since FOXA2 is regulated by SOX9 in the pancreas (40) and our ShhTg in vivo transplant cultures are induced to express epithelial SOX9, we next sought to determine whether FOXA2 expression in mouse esophageal epithelium was regulated by SOX9. Since global knockout of Sox9 (Sox9–/–) in mice leads to embryonic lethality at E11.5 (41), we generated mice with esophageal-specific deletion of Sox9 by crossing mice containing Cre recombinase knocked into the endogenous Shh locus (Shh-Cre+/–) mice (42) with mice homozygous for a conditional floxed allele of Sox9 (Sox9fl/fl) mice (ref. 43 and Supplemental Figure 2A). These Shh-Cre+/–Sox9fl/fl mice died perinatally. FOXA2 immunohistochemistry revealed similar FOXA2 expression in the esophageal epithelia of E17.5 Shh-Cre+/–Sox9fl/fl embryos and wild-type littermate embryos (Supplemental Figure 2B). This establishes that SOX9 is not required for FOXA2 expression in esophageal epithelium.
Differential regulation of FOXA2 by Hh signaling occurs in respiratory and gastrointestinal epithelia of the developing foregut.
Shh knockout (Shh–/–) embryos were then generated as previously described (44) or by crossing Shh-Cre+/– mice to Shh-Cre+/– mice. In contrast to Shh-Cre+/–Sox9fl/fl embryos, which express FOXA2 in the absence of SOX9, esophageal FOXA2 expression was lost in Shh–/– embryos (Figure 3, C–H). Shh–/– embryos are known to develop foregut abnormalities in which the trachea and esophagus do not separate properly, and the combined trachea/esophagus structure ends distally in both lungs and stomach (38). We found that, in E14.5 Shh–/– embryos, the epithelium lining the trachea expressed FOXA2, but the epithelium lining the esophagus did not (Figure 3C). More distally, we found a distinct boundary in FOXA2 expression between respiratory and gastrointestinal epithelia. The respiratory epithelium lining a cystic lung expressed FOXA2, while stratified squamous epithelium of the esophagus and forestomach did not (Figure 3, E and G). Further analysis of the E14.5 Shh–/– gastrointestinal epithelium revealed spotty expression of squamous CK14 in basal cells of the esophagus and forestomach (Figure 4, C and D) 1 day earlier than in wild-type gastrointestinal epithelium (Figure 1B and Figure 4, A and B). This suggests that Shh loss leads to premature squamous epithelial differentiation of the dorsal foregut. At E16.5, the ventral portion of the Shh–/– combined foregut structure lined by respiratory epithelium continued to express nuclear FOXA2, while the dorsal gastrointestinal epithelium did not (Figure 3, D, F, and H). These findings are consistent with previous reports that loss of Shh expression in the lungs does not affect FOXA2 expression by respiratory epithelium (38, 45). Moreover, the differential regulation of FOXA2 by Hh signaling in the ventral and dorsal foregut suggests that there is an early developmental commitment to either a respiratory or a gastrointestinal epithelial cell fate.
Figure 4. Squamous CK14 is prematurely expressed in Shh–/– embryos.
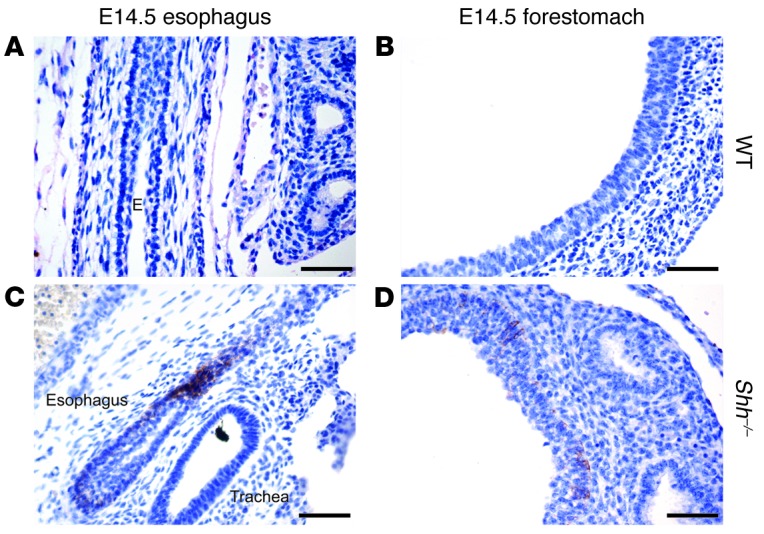
CK14 immunohistochemistry in E14.5 esophagus and forestomach from (A and B) wild-type littermate controls and (C and D) Shh–/– embryos. Esophagus (E) is indicated. Scale bars: 50 μm.
FOXA2 is expressed in Barrett’s esophagus and esophageal adenocarcinoma.
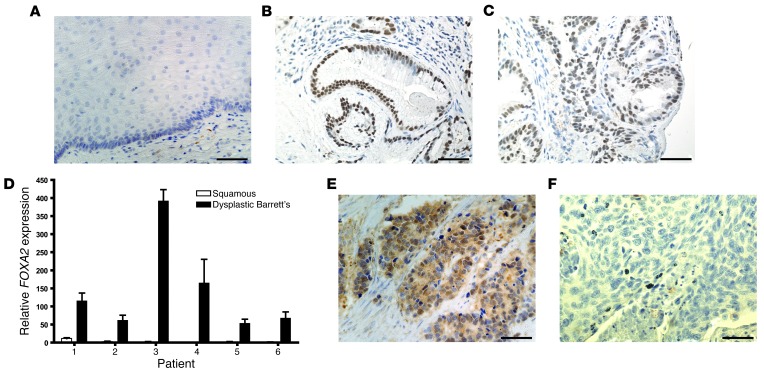
To explore the relevance of our findings in mouse esophageal development to human disease, we next examined FOXA2 expression in human esophageal tissue specimens. We performed FOXA2 immunohistochemistry on tissue microarrays of esophagectomy specimens from 37 patients who had Barrett’s esophagus with or without associated esophageal adenocarcinoma. Among the 37 esophagectomy specimens, we obtained samples of nondysplastic Barrett’s metaplasia from 15 patients, Barrett’s metaplasia with low-grade dysplasia from 7 patients, Barrett’s metaplasia with high-grade dysplasia from 14 patients, and esophageal adenocarcinoma from 27 patients. Nuclear FOXA2 expression was not present in any normal esophageal squamous epithelium but was seen in 80% of patients with nondysplastic Barrett’s metaplasia, 86% of patients with low-grade dysplasia, 93% of patients with high-grade dysplasia, and 78% of patients with esophageal adenocarcinoma (Figure 5, A–C, and E). We then performed qRT-PCR for FOXA2 on frozen tissues from 6 esophagectomy cases. Consistent with our immunohistochemical results, we found considerable expression of FOXA2 in the Barrett’s dysplasia of all 6 cases, but the accompanying squamous epithelium exhibited no FOXA2 expression in all but 1 case, which showed minimal expression (Figure 5D). We next performed FOXA2 immunohistochemistry on a tissue microarray containing 11 cases of esophageal squamous cell carcinoma and did not find FOXA2 expression in any patient (Figure 5F). Taken together, these data suggest that FOXA2 is expressed minimally if at all in normal esophageal squamous epithelium and in esophageal squamous cell carcinomas, but FOXA2 is expressed in Barrett’s metaplasia, dysplasia, and cancer.
Figure 5. FOXA2 expression in benign and malignant human esophageal tissue.
FOXA2 immunohistochemistry of (A) normal esophageal squamous epithelium, (B) nondysplastic Barrett’s metaplasia, and (C) dysplastic Barrett’s metaplasia. (D) FOXA2 qRT-PCR of normal esophageal squamous epithelium and Barrett’s dysplasia from esophagectomy specimens. FOXA2 immunohistochemistry of esophageal (E) adenocarcinoma and (F) squamous cell carcinoma. Scale bars: 50 μm.
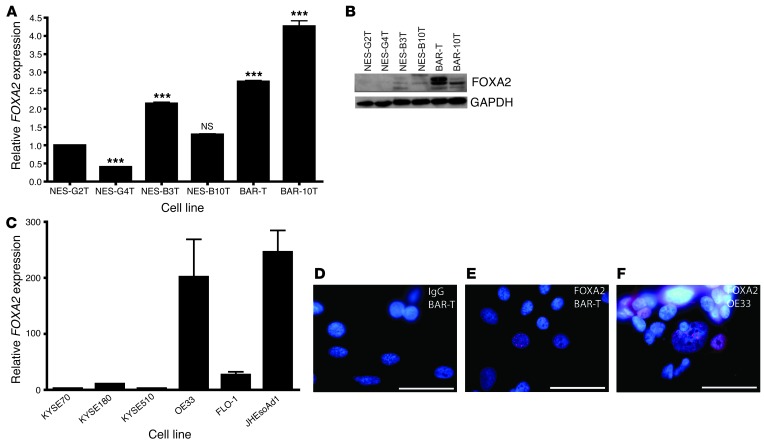
We then characterized FOXA2 expression by qRT-PCR and Western blot in 6 telomerase-immortalized human esophageal epithelial cell lines developed from endoscopic biopsies taken from patients who had GERD with and without Barrett’s esophagus (refs. 16, 46, 47, and Figure 6, A and B). In squamous epithelial cell lines derived from patients who had GERD without Barrett’s esophagus (NES-G2T, NES-G4T), minimal FOXA2 transcript was seen and no protein was detected by Western blot. In contrast, the squamous epithelial cells derived from patients who had GERD with Barrett’s esophagus (NES-B3T, NES-B10T) showed slightly increased FOXA2 transcript levels, with some expression of FOXA2 protein. Compared with the squamous cell lines, Barrett’s epithelial cell lines (BAR-T, BAR-10T) showed increased levels of both FOXA2 transcript and protein. We next performed qRT-PCR for FOXA2 on 3 esophageal squamous cell carcinoma cell lines (KYSE70, KYSE180, KYSE510) and 3 esophageal adenocarcinoma cell lines (OE33, FLO-1, JHEsoAd1) and found that FOXA2 was substantially higher in the adenocarcinoma lines (Figure 6C). To confirm nuclear localization of FOXA2 in our cell lines, we performed immunofluorescence with a FOXA2 antibody on BAR-T cells and OE33 adenocarcinoma cells (Figure 6, D–F). We found nuclear expression of FOXA2 in both cell lines, in agreement with our protein and qRT-PCR results.
Figure 6. FOXA2 expression in benign and malignant human esophageal cell lines.
(A) FOXA2 qRT-PCR and (B) FOXA2 Western blot of telomerase-immortalized esophageal cell lines. NS, not significant. ***P < 0.001 as compared with NES-G2T. (C) FOXA2 qRT-PCR of esophageal squamous cell carcinoma and adenocarcinoma cell lines. FOXA2 immunofluorescence in (D) BAR-T cells incubated with IgG control (red), (E) BAR-T cells incubated with FOXA2 (red) primary antibody, and (F) OE33 cells incubated with FOXA2 primary antibody (positive control). Scale bars: 50 μm.
FOXA2 is regulated by Hh signaling in Barrett’s epithelial cells and in esophageal squamous cells from patients who have GERD with Barrett’s esophagus.
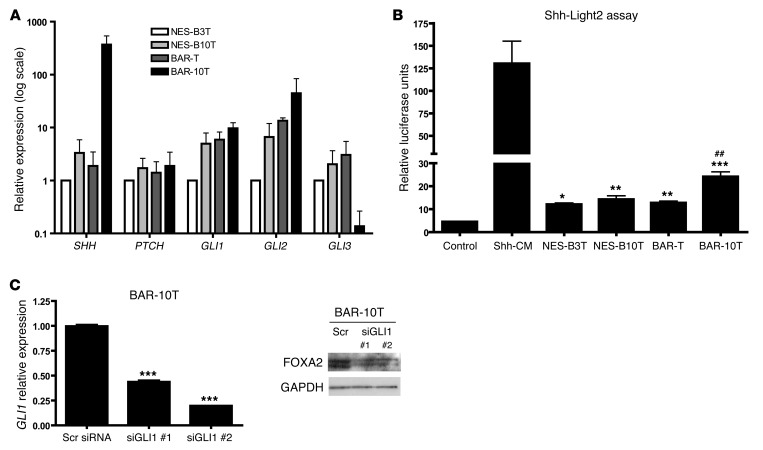
Given our findings of SHH regulation of FOXA2 in the esophageal epithelia of embryonic mice, we sought to determine whether FOXA2 is downstream of Hh signaling in adult human esophageal epithelial cells. We characterized Hh pathway status by performing qRT-PCR in NES-B3T, NES-B10T, BAR-T, and BAR-10T cells for Hh pathway components SHH, PTCH, GLI1, GLI2, and GLI3 (Figure 7A). We selected only the NES-B3T and NES-B10T esophageal squamous cell lines for use, because, unlike NES-G2T and NES-G4T cells that did not express FOXA2 protein, NES-B3T and NES-B10T expressed low baseline levels of FOXA2 protein (Figure 6B). All 4 cell lines expressed similar levels of PTCH. Compared with NES-B3T cells, the NES-B10T, BAR-T, and BAR-10T cells expressed increased GLI1 and GLI2 transcripts. Expression of SHH was highest and expression of GLI3 was lowest in BAR-10T cells, suggesting that BAR-10T cells have the highest active Hh signaling among our 4 esophageal cell lines. To determine whether our telomerase-immortalized cells could secrete active SHH, we cocultured the 4 benign esophageal epithelial cell lines with Shh-Light2 cells. Shh-Light2 cells are 3T3 cells stably transfected with a firefly luciferase reporter gene driven by 8 tandem GLI1 binding sites and a renilla luciferase reporter gene driven by the TK promoter (48). Dual-luciferase assay after 48 hours revealed that active SHH was secreted the most by the BAR-10T Barrett’s cell line (Figure 7B). We next sought to determine whether FOXA2 expression was dependent on Hh signaling in BAR-10T cells. Following GLI1 siRNA-mediated knockdown, we found that FOXA2 expression decreased (Figure 7C). This suggests that in Barrett’s epithelial cells, FOXA2 is dependent on Hh signaling.
Figure 7. Hh signaling in telomerase-immortalized esophageal cells.
(A) qRT-PCR analysis of Hh pathway status and (B) Shh-Light2 cell assay of telomerase-immortalized esophageal epithelial cells. Shh-conditioned medium (Shh-CM) served as a positive control. *P < 0.05, **P < 0.01, ***P < 0.001 as compared with control; ##P < 0.01 as compared with NES-B3T, NES-B10T, and BAR-T. (C) GLI1 qRT-PCR and FOXA2 Western blot 48 hours after transfection with 50 nM siRNA for GLI1 or scrambled (Scr) siRNA in BAR-10T cells. Two wells transfected with GLI1 siRNA are shown. ***P < 0.001 as compared with Scr siRNA.
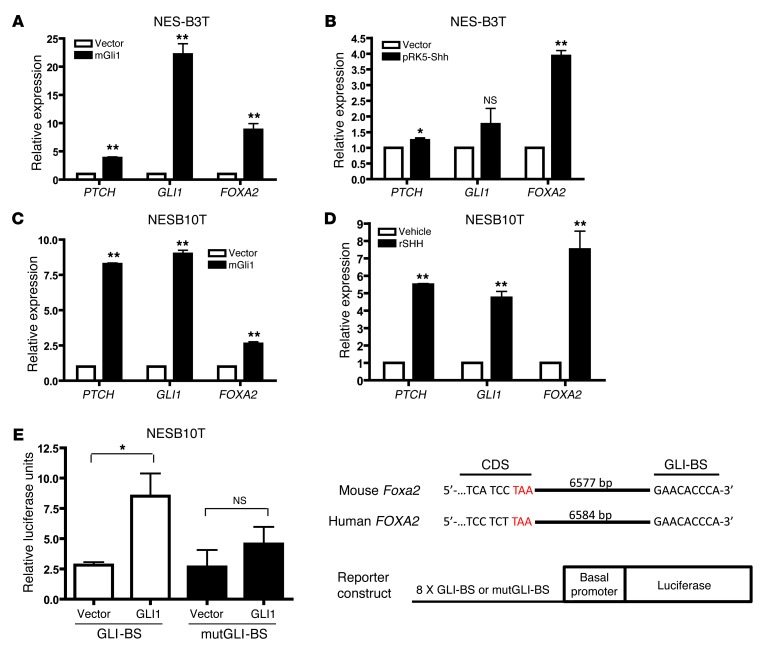
To determine whether FOXA2 expression can be activated by Hh signaling in esophageal squamous epithelial cells from patients who have GERD with Barrett’s esophagus, we used recombinant SHH and plasmids containing either mouse Shh or Gli1. We electroporated NES-B3T and NES-B10T cells with pSRα-FLAG-Gli1 and analyzed them by qRT-PCR 48 hours later. We found that GLI1, as expected, induced expression of Hh pathway targets PTCH and GLI1 itself (Figure 8, A and C). In both squamous cell lines, GLI1 overexpression also led to FOXA2 induction (Figure 8, A and C). Electroporation of NES-B3T cells with pRK5-Shh (Figure 8B) or treatment of NES-B10T cells with recombinant SHH (Figure 8D) led to increased PTCH, GLI1, and FOXA2 expression by qRT-PCR, suggesting that esophageal squamous epithelial cells from patients who have GERD with Barrett’s esophagus can respond to Hh signaling.
Figure 8. Hh signaling induces FOXA2 in telomerase-immortalized squamous esophageal cells.
FOXA2 qRT-PCR following GLI1 electroporation in (A) NES-B3T and (C) NES-B10T cells or following (B) electroporation of SHH in NES-B3T cells or (D) treatment with recombinant SHH in NES-B10T cells. (E) NES-B10T cells were electroporated with a firefly luciferase reporter gene driven by 8 tandem copies of the GLI-BS found within a 3′ enhancer of the Foxa2 gene or a mutGLI-BS with sequence 5′-GAAGTGGGA-3′ and either empty vector or GLI1. Data were normalized using TK-Renilla luciferase activity. Schematic of the genomic sequence of mouse Foxa2 and human FOXA2 with the GLI-BS 3′ to the coding sequence (CDS). Stop codon is shown in red. *P < 0.05, **P < 0.01 as compared with vector or vehicle control.
To further characterize how GLI1 mediates activation of FOXA2, we analyzed the promoter region of FOXA2 for putative GLI binding sites (GLI-BSs), but none were identified. In 1997, Sasaki and colleagues described a minimal enhancer 3′ of the mouse Foxa2 coding sequence, which contains an essential GLI-BS with the sequence 5′-GAACACCCA-3′ (27). This GLI-BS was found 6,577-bp downstream of the stop codon. We analyzed the human FOXA2 gene and found this same GLI-BS 6,584-bp from the stop codon (Figure 8E). We next obtained luciferase reporter constructs driven by a basal δ-crystalline promoter and 8 tandem copies of either the GLI-BS or a mutated GLI-BS (mutGLI-BS) with the sequence 5′-GAAGTGGGA-3′. We electroporated these constructs, along with mouse GLI1, into NES-B10T cells (in which we had shown that exogenous GLI1 upregulates FOXA2 expression). Luciferase activity increased significantly when GLI1 was coexpressed with GLI-BS but not when GLI1 was coexpressed with mutGLI-BS (Figure 8E). This demonstrates that GLI1 binds to this FOXA2 enhancer and that FOXA2 is a direct target of the Hh-GLI signaling cascade.
FOXA2 regulates AGR2 and MUC2 in Barrett’s epithelial cells and in esophageal squamous cells from patients who have GERD with Barrett’s esophagus.
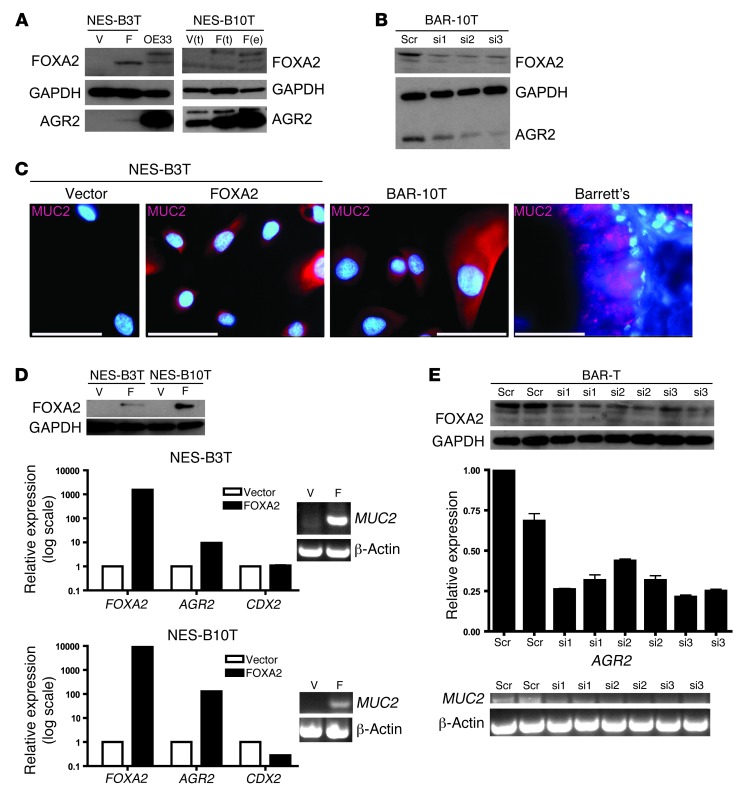
We next sought to identify FOXA2 target genes that are relevant to Barrett’s esophagus. Barrett’s specialized intestinal metaplasia is characterized by prominent goblet cells and other cells that express MUC2, a gene previously shown to be a FOXA2 target (35). Another candidate target gene is AGR2, a protein disulfide isomerase that is localized to the endoplasmic reticulum and required for proper MUC2 protein processing (49). Agr2–/– mice lack normal goblet cells and have decreased intestinal mucus (50). AGR2 has been shown to be expressed in tissue from Barrett’s metaplasia but not in normal esophageal squamous epithelium (30–32). The AGR2 promoter and upstream sequence contain 4 FOXA2 consensus binding sites [VA(A/T)TRTT(G/T)RYTY, where V = A, C, G; R = purine; and Y = pyrimidine] (51). Recognizing that Barrett’s epithelial cells express more FOXA2 than squamous cells from patients with Barrett’s esophagus, we sought to delineate FOXA2’s function through siRNA-mediated knockdown of FOXA2 in Barrett’s cells and through overexpression of FOXA2 in squamous cells. pIRES-FOXA2 was electroporated into NES-B3T and NES-B10T cells, and FOXA2 expression was confirmed by immunofluorescence, which demonstrated strong nuclear staining (data not shown). We then examined the effect of FOXA2 overexpression in NES-B3T and NES-B10T cells by Western blot and found that this led to increased expression of AGR2 protein (Figure 9A). siRNA-mediated knockdown of FOXA2 in BAR-10T and BAR-T cells led to decreased expression of AGR2 protein (Figure 9B; BAR-T data not shown). These findings suggest that AGR2 is a direct target gene of FOXA2. Since AGR2 is required for proper processing of mature MUC2 protein, we examined the effect of FOXA2 overexpression on MUC2 expression by performing immunofluorescence for MUC2 on NES-B3T and NES-B10T cells electroporated with FOXA2. We found that MUC2 protein expression increased in both squamous cell lines electroporated with FOXA2 (Figure 9C; NES-B10T data not shown). FOXA2 can regulate MUC2 expression either directly (via transcriptional activation) or indirectly (through AGR2 induction). Therefore, we performed qRT-PCR for AGR2 and RT-PCR for MUC2 in NES-B3T and NES-B10T cells that were electroporated with FOXA2 (Figure 9D) or in BAR-T cells, in which FOXA2 expression was knocked down with siRNA (Figure 9E). We found that AGR2 transcript increased in NES-B3T and NES-B10T cells and decreased in BAR-T cells; similarly, MUC2 transcript increased in NES-B3T and NES-B10T cells and decreased in BAR-T cells (Figure 9, D and E). This suggests that MUC2 is transcriptionally regulated by FOXA2 in esophageal squamous and Barrett’s epithelial cells. FOXA2-mediated transcriptional regulation of AGR2 would also affect MUC2 protein levels, because AGR2 is required for MUC2 processing. Finally, since MUC2 is a CDX2 target gene (16) and FOXA2 can transcriptionally upregulate CDX2 (52), we examined CDX2 transcript levels in NES-B3T and NES-B10T cells we had electroporated with FOXA2 and found that electroporation led to increased MUC2 expression (Figure 9D). We did not observe an associated increase in CDX2 transcript, suggesting that FOXA2 can regulate MUC2 independently of CDX2.
Figure 9. FOXA2 regulates AGR2 and MUC2.
(A) FOXA2 and AGR2 Western blot, following vector (V) or FOXA2 (F) electroporation in NES-B3T cells and electroporation (e) or transfection (t) in NES-B10T cells. OE33 cells served as a positive control. (B) FOXA2 and AGR2 Western blot, following FOXA2 knockdown by 25 nM scrambled or 3 separate FOXA2 siRNAs (si1–si3) in BAR-10T cells. (C) MUC2 immunofluorescence of NES-B3T cells electroporated with vector or FOXA2. BAR-10T cells and a Barrett’s tissue specimen served as positive controls. Scale bars: 50 μm. (D) FOXA2, AGR2, CDX2 qRT-PCR and MUC2 RT-PCR following electroporation of NES-B3T and NES-B10T cells with FOXA2 (Western blot). (E) AGR2 qRT-PCR and MUC2 RT-PCR following FOXA2 siRNA knockdown in BAR-T cells (Western blot).
Discussion
Using a developmental approach, we identified the transcription factor FOXA2 as being expressed by embryonic mouse esophageal columnar epithelium. Our studies performed with conditionally activated ShhTg mouse esophageal epithelium and Shh–/– mouse embryos established that Foxa2 is an esophageal Hh target gene. In humans, FOXA2 was expressed in Barrett’s metaplasia, dysplasia, and adenocarcinoma tissue specimens; in nonneoplastic Barrett’s epithelial cell lines; and in esophageal squamous cell lines derived from patients with Barrett’s metaplasia. In the squamous cell lines, FOXA2 was upregulated by Hh signaling, causing expression of MUC2, an intestinal mucin found in Barrett’s specialized intestinal metaplasia, and AGR2, an endoplasmic reticulum protein involved in MUC2 processing. This suggests that reactivation of Hh signaling in esophageal squamous epithelial cells can induce genes that determine an intestinal phenotype and may contribute to the development of the specialized intestinal type of Barrett’s metaplasia.
Our studies in embryonic mice demonstrate the early commitment of foregut epithelium to either a respiratory or gastrointestinal cell fate. Using Shh–/– embryos, we have shown that Hh regulation of FOXA2 differs between the gastrointestinal epithelium lining the esophagus and forestomach and the respiratory epithelium lining the lungs. Esophageal and forestomach expression of FOXA2 is SHH dependent, while FOXA2 expression in the lungs is SHH independent. This occurs despite the lungs and esophagus sharing a common foregut origin. These findings suggest that molecular mechanisms in respiratory epithelium cannot necessarily be extrapolated to those in the esophagus and underscore the importance of studies focused specifically on esophageal epithelium.
The origin of Barrett’s metaplasia is not known. One hypothesis holds that Barrett’s metaplasia develops from a unique population of embryonic columnar progenitor cells that reside at the gastroesophageal junction and that migrate proximally to repair the reflux-damaged esophagus (53, 54). An alternative hypothesis holds that Barrett’s metaplasia develops as a result of esophageal epithelial cell transcommitment, a category of transdifferentiation in which an individual cell changes phenotype without undergoing division (53, 55). Transcommitment is a process that is observed during normal esophageal epithelial development (34). The early embryonic esophagus is lined by simple columnar epithelium that eventually becomes stratified squamous epithelium. Cells found during an intermediate developmental phase simultaneously express both columnar and squamous cytokeratins, a finding supporting transcommitment (34). In earlier studies, we identified Hh signaling and SOX9 as potential mediators of esophageal columnar metaplasia, because they are expressed during the columnar phase but not during the squamous phase of mouse esophageal epithelial development (19). In this study, we found that FOXA2 also is expressed in esophageal epithelium during the columnar phase of epithelial development. Overexpression of Shh in mouse esophageal epithelium leads to a columnar phenotype and reexpression of FOXA2. Our observation that FOXA2 expression is lost in Shh–/– mouse embryos further demonstrates that Foxa2 is an esophageal Hh target gene.
In earlier reports, we proposed that differences among individuals in molecular pathways activated when esophageal squamous epithelium is exposed to gastroesophageal reflux may determine the development of Barrett’s metaplasia (16, 56, 57). In support of that contention, we found differences between esophageal squamous cell lines from patients who have GERD with and without Barrett’s esophagus in how acid activates ERK1/2, in baseline expression of an inhibitory form of MEK1, and in how acid and bile salts increase expression and activation of CDX2 (16, 56, 57). In the present study we have found expression of FOXA2, a key developmental transcription factor involved in specifying an intestinal-type columnar-lined esophagus, in esophageal squamous epithelial cells from patients with Barrett’s esophagus but not in esophageal squamous epithelial cells from patients who have GERD without Barrett’s esophagus. Such differences might underlie the development of Barrett’s metaplasia in some individuals with GERD.
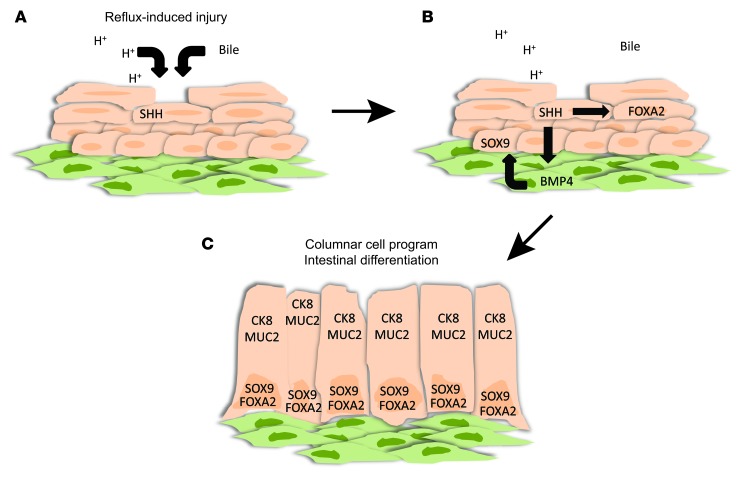
We have shown that FOXA2 is a direct Hh target gene in human esophageal squamous and Barrett’s epithelium. In squamous cells, FOXA2 can induce expression of MUC2, an intestinal mucin found in specialized intestinal metaplasia, and AGR2, an endoplasmic reticulum protein required for proper processing of MUC2. In earlier studies, we showed that the transcription factor SOX9, found in columnar mouse embryonic esophageal epithelium and in human Barrett’s metaplasia, is an indirect Hh target (indirect because SOX9 expression is upregulated by stromal BMP4 signaling induced by epithelial Hh signaling). Unlike SOX9, FOXA2 is a direct Hh target gene that regulates the expression of MUC2, a protein involved in the intestinal alterations characteristic of specialized intestinal metaplasia (25). Based on these findings, we now propose a molecular model of Barrett’s metaplasia in which Hh signaling, through direct and indirect pathways, induces separate transcription factors relevant to the columnar intestinal metaplasia of Barrett’s esophagus (Figure 10).
Figure 10. Proposed role of FOXA2 in a molecular model of transcommitment causing Barrett’s metaplasia.
(A) The components of gastroesophageal reflux, acid and bile acids, cause secretion of SHH by esophageal squamous cells. (B) SHH signals to stroma to induce expression of BMP4 by esophageal fibroblasts, which then signal back to the squamous epithelial cells to induce SOX9 expression (epithelial-mesenchymal crosstalk). SHH can also induce expression of FOXA2 in esophageal squamous epithelial cells. (C) Activation of SOX9 and FOXA2 leads to expression of genes involved in columnar and intestinal goblet cell differentiation, such as CK8 and MUC2.
Though our studies demonstrate that FOXA2 upregulates MUC2 transcript and protein expression in esophageal squamous epithelial cells from patients who have GERD with Barrett’s esophagus, we did not observe a switch to a full goblet cell phenotype. To our knowledge, direct nongoblet-to-goblet transition has not been demonstrated in esophageal epithelium in vitro. In vivo, treatment with γ-secretase inhibitors and resultant loss of Notch signaling in a surgical rat model of reflux esophagitis and Barrett’s metaplasia leads to esophageal goblet cell hyperplasia within the reflux-induced metaplasia (58). During mouse esophageal development, hypomorphic SOX2 or complete loss of expression of either p63 or Noggin causes the appearance of goblet-like cells within the epithelium (53, 59, 60). It is possible that FOXA2 overexpression combined with knockdown of SOX2 or p63, inhibition of Notch signaling, or activation of BMP signaling would lead to a full goblet cell phenotype in our esophageal squamous cell lines.
MUC2 regulation within Barrett’s metaplasia appears to be complex. CDX2 has been accepted as a major regulator of MUC2 expression, and CDX2 has been shown to be upregulated by acidic pH and bile acids in esophageal squamous epithelial cells (16). Another study suggests that Notch inhibition with γ-secretase inhibitors leads to loss of repression of ATOH1, which activates CDX2, which in turn leads to MUC2 expression (61). FOXA2 can also transcriptionally activate CDX2, but this appears to be repressed in normal squamous esophageal epithelium by the coexpression of the transcriptional repressor RFX1, which is lost in Barrett’s metaplasia (52). We now demonstrate in esophageal squamous epithelial cells that FOXA2 regulates MUC2 mRNA in a CDX2-independent fashion. In addition, we have shown that FOXA2 upregulates AGR2, a protein that has been associated with Barrett’s metaplasia and is required for MUC2 protein processing. Thus, the combinatorial effect of CDX2 and FOXA2 may act to increase expression of MUC2 in Barrett’s metaplasia.
In summary, using a developmental approach, we have identified Foxa2 as a Hh esophageal target gene. FOXA2 can be directly activated by Hh signaling in human esophageal squamous epithelium, and FOXA2 is expressed in Barrett’s metaplasia, in which we previously demonstrated active Hh signaling. FOXA2 can induce expression of MUC2 and AGR2, two genes that are important for acquisition of the intestinal cell phenotype characteristic of Barrett’s specialized intestinal metaplasia. These data suggest that FOXA2 regulates genes involved in the pathogenesis of specialized intestinal metaplasia, the type of columnar metaplasia associated with cancer risk in Barrett’s esophagus. Moreover, our findings provide a molecular rationale for future studies using Hh pathway inhibitors to prevent the development and neoplastic progression of Barrett’s metaplasia in patients who have GERD.
Methods
Mice.
Timed-pregnant C57BL/6 female mice were sacrificed, and whole embryos were harvested between E11.5 and E17.5. The day the presence of a vaginal plug was detected was designated as E0.5. Gastrointestinal organs were harvested from sacrificed P1 and P2 pups and adult C57BL/6 mice. Shh–/– mice were generated by replacing the second exon and surrounding introns with a PGK-neo selection cassette, as previously described (44), and were maintained in CD1 mice. Alternatively, Shh–/– mice were generated by crossing Shh-Cre+/– mice (JAX strain 005622) (42). Shh–/– embryos were harvested from timed-pregnant females at E14.5 and E16.5, and genotypes were confirmed. Esophageal-specific deletion of Sox9 was obtained by crossing male Shh-Cre+/– mice (42) with female Sox9fl/fl mice (JAX strain 013106) (43). N1 male Shh-Cre+/–Sox9fl/+ mice were then crossed with female Sox9fl/fl mice to generate the desired genotype. To confirm esophageal epithelium-specific expression of Shh-Cre, we crossed Shh-Cre+/– mice with Gt(ROSA)-LacZ mice (JAX strain 003309) (62) and stained tissue sections with X-gal to determine β-galactosidase activity. Wild-type control embryos were littermates of experimental animals.
Microarray.
Microarray analysis was performed as previously described (63). Total esophageal RNA from E15.5 and P2 C57BL/6 mice was isolated with Trizol (Invitrogen) and then further purified using RNeasy (Qiagen). RNA was quantitated with a NanoDrop ND-100, and the quality was determined using an Agilent 2100 Bioanalyzer. Sample amplification and labeling procedures were carried out according to the manufacturer’s protocol using the Low RNA Input Fluorescent Linear Amplification Kit (Agilent) and 0.3 μg total RNA as starting material. The Agilent Whole Mouse Genome microarray (G4122A), with 41,174 unique transcripts, was used. Following hybridization according to the Agilent microarray processing protocol, microarrays were scanned using an Agilent G2505B Scanner controlled by Agilent Scan Control 7.0 software. Data were extracted with Agilent Feature Extraction 9.1 software.
For analysis, the base 2 log ratios of the red (Cy5) and green (Cy3) signal intensities, M = log2 R/G (where M stands for signal intensity, R stands for Cy5 intensity, and G stands for Cy3 intensity), were calculated and used in the downstream analysis. Lowess normalization was performed on M = log2 R/G with the R package SMA (http://www.stat.berkeley.edu/~terry/zarray/Software/smacode.html) to remove systematic obscuring variation, such as the fluorescence dye-labeling bias effect, which arises from the microarray technology rather than from the differences of the biological conditions. The log posterior odds of the differential gene expression in mouse E15.5 esophagi as compared with P2 esophagi were computed with the stat.Newton function of SMA (64, 65) (http://www.stat.berkeley.edu/~terry/zarray/Software/smacode.html) according to a hierarchical gamma-gamma model. The criteria of the log odds > 1, which means the posterior odds favoring change were used to produce the differentially expressed gene list. The differential gene expression was visualized with an MvA plot, the intensity log–ratio M = log2 R/G vs. the mean log–intensity A = 1/2×[log2(R) + log2(G)]) plot. All computation was performed using the statistical computing software R (http://www.r-project.org). The microarray data have been deposited to the NCBI GEO database, with accession no. GSE56528.
In vivo transplant culture system.
Esophageal epithelial cells were isolated from wild-type and conditional ShhTg mice as previously described (19). The epithelial cells were infected with adenoviral-cre to activate the conditional transgene. Following this, the epithelial cells along with C57BL/6 esophageal fibroblasts were placed into a denuded rat trachea. The ends of the trachea were ligated, and this culture system was placed subcutaneously into a NOD/SCID mouse for 4 weeks.
Clinical samples.
Tissue microarrays containing esophageal squamous epithelium, Barrett’s esophagus, dysplastic Barrett’s esophagus, esophageal adenocarcinoma, stomach, and fibrous tissue from 37 patients were obtained from the Johns Hopkins Tissue Microarray facility. An additional tissue microarray containing normal esophagus and esophageal squamous carcinoma from 11 patients was purchased from US Biomax (ES242). These tissue microarrays were submitted for immunohistochemistry as described below. Six frozen esophagectomy cases containing normal squamous epithelium and dysplastic Barrett’s were obtained from the Johns Hopkins Tissue Bank. Tissue was cut from each case, and the diagnosis was confirmed by a gastrointestinal pathologist. RNA was isolated from the tissue as described below.
Immunohistochemistry and immunofluorescence.
Formalin-fixed paraffin-embedded sections were submitted to epitope retrieval with heated citrate buffer and quenching of endogenous peroxidase. Following incubation with primary antibody for 1 hour, immunohistochemistry was completed using the Vectastain ABC Kit (VectorLabs) and DAB reagent (Sigma-Aldrich). Primary antibodies used for immunohistochemistry include FOXA2 (Lifespan) at 1:2,000, CK8 (DSHB TROMA-I) at 1:100, and CK14 (Covance) at 1:10,000. Immunofluorescence was performed on cell lines plated on coated coverslips. Cells were fixed with fresh 4% paraformaldehyde and permeabilized with 0.1% Triton-X. Following incubation with primary antibody or isotype control for 1 hour, the species-specific fluorescent secondary antibody and DAPI counterstain were applied. Primary antibodies used for immunofluorescence include FOXA2 (Santa-Cruz) at 1:50 and MUC2 (Novocastra) at 1:100.
Cell lines.
Human esophageal epithelial cells were isolated from endoscopic biopsies of squamous and Barrett’s epithelium (defined as the presence of specialized intestinal metaplasia) and telomerase immortalized as previously described (46). Squamous cell lines from patients with GERD with (NES-B3T, NES-B10T) and without Barrett’s esophagus (NES-G2T, NES-G4T) and metaplastic Barrett’s esophagus cell lines (BAR-T, BAR-10T) were used in experiments. These benign cell lines were maintained, without a fibroblast feeder layer, on dishes precoated with 0.01 mg/ml fibronectin (Sigma-Aldrich), 0.03 mg/ml type I collagen (BD Biosciences), and 0.01 mg/ml bovine serum albumin (Sigma-Aldrich) in keratinocyte medium for 1 hour and then washed twice with PBS. Esophageal squamous carcinoma cell lines (KYSE70, KYSE180, KYSE510) were provided by John Harmon (Johns Hopkins University, Baltimore, Maryland, USA). Esophageal adenocarcinoma cell lines were purchased from ATCC (OE33) or provided by James Eshleman, (Johns Hopkins University) (JHEsoAd1) and David Beer (University of Michigan, Ann Arbor, Michigan, USA) (FLO-1). Esophageal epithelial cells were electroporated using Nucleofector 4 (Amaxa) or transfected using Lipofectamine LTX (Invitrogen) with the indicated plasmids. Reactions were performed in 6-well plates with a total 6 μg DNA for electroporations and 3 μg DNA for transfections. FOXA2 was PCR amplified from a full-length cDNA (Open Biosystems) and cloned into pIRES.
Hh signaling assays.
Untreated telomerase-immortalized epithelial cells were cocultured with Shh-Light2 cells (48) for 48 hours. Luciferase activity was then assayed by the Dual-Luciferase Reporter System (Promega). Esophageal squamous epithelial cells from patients with Barrett’s metaplasia were treated with 1 μg/ml rSHH (R&D Systems) or vehicle for 48 hours in serum-free medium and then RNA harvested for analysis.
Enhancer assay.
Reporter constructs 8x3’GLI-BS-delta51-LucII (GLI-BS) and 8xm3’GLI-BS-delta51-LucII (mutGLI-BS) (27), which had been previously deposited by Hiroshi Sasaki (Kumamoto University, Kumamoto, Japan), were obtained from the RIKEN BioResource Center, Tsukuba, Japan. NES-B10T cells were electroporated with TK-Renilla luciferase, either GLI-BS or mutGLI-BS reporter constructs, and either pcDNA3.1 (vector) or pSRα-FLAG-Gli1. Luciferase activity was then assayed by the Dual-Luciferase Reporter System (Promega) 48 hours later.
siRNA and Western blotting.
siRNA-mediated knockdown was performed as previously described (19) using individual FOXA2 or SMARTpool GLI1 siRNAs (Dharmacon). Protein lysates were harvested at 48 hours and electrophoresed on a Bis-Tris gel (Invitrogen). Following transfer to nitrocellulose and blocking with 5% milk in TBST, primary antibody was applied overnight. The following day, membranes were incubated with secondary antibody for 1 hour, followed by protein detection with chemoluminescence. Primary antibodies used for Western blotting include FOXA2 (Santa Cruz) at 1:100, AGR2 (Sigma-Aldrich) at 1:500, and GAPDH (Millipore) at 1:5,000.
RT-PCR and qRT-PCR.
Total RNA was isolated with Trizol (Invitrogen), and 1 μg RNA was reverse transcribed with Quantitect (Qiagen). cDNA was then used as a template to perform qualitative PCR on a Perkin Elmer GeneAmp 9700 and qRT-PCR with an Applied Biosystems StepOnePlus machine. ΔΔCt method was used to determine relative transcript levels on qRT-PCR. Ct values were normalized to β-actin. Primer sequences are provided in Supplemental Table 1.
Statistics.
Quantitative data are expressed as the mean ± SEM. Data with multiple comparisons were initially tested for normality. ANOVA followed by the Tukey honest significant difference post-hoc test was used to analyze normally distributed data, and the Kruskal-Wallis test was used to analyze nonnormally distributed data. Comparison of 2 means was analyzed using an unpaired 2-tailed Student’s t test. These tests for statistical significance were performed with GraphPad Prism version 4.00 for Windows, GraphPad Software (http://www.graphpad.com). A P value of less than 0.05 was considered significant.
Study approval.
All work with animals was approved by the Institutional Animal Care and Use Committees of Johns Hopkins University and the VA North Texas Health Care System and the Peter MacCallum Cancer Centre Animal Experimentation Ethics Committee. Research with deidentified human clinical specimens was granted an exemption from the requirement for informed consent and approved by the Johns Hopkins University Institutional Review Board.
Supplementary Material
Acknowledgments
We would like to thank Wayne Yu for technical assistance with the microarray experiment. The Jerry D’Amato Charity Foundation and the Roy L. Jeannotte Foundation supported construction of the esophageal tissue microarrays. The monoclonal antibody TROMA-I, developed by Philippe Brulet and Rolf Kemler, was obtained from the Developmental Studies Hybridoma Bank, developed under the auspices of the National Institute of Child Health and Human Development, and maintained by the University of Iowa, Department of Biology, Iowa City, Iowa, USA. 8x3’GLI-BS-delta51-LucII and 8xm3’GLI-BS-delta 51-LucII were provided by RIKEN BioResource Center, which is participating in the National Bio-Resources Project of the MEXT, Japan. This work was supported by the Office of Medical Research, Department of Veterans Affairs (to D.H. Wang, S.J. Spechler, and R.F. Souza), the American Cancer Society (ACS-IRG-02-196 to D.H. Wang), the Victorian Cancer Agency and the National Health and Medical Research Council of Australia (to N.J. Clemons and D.N. Watkins), the Victorian Government Operational Infrastructure Support Program (to D.N. Watkins), and the NIH (R01-DK097340 to D.H. Wang, R01-DK063621 and R01-CA134571 to S.J. Spechler and R.F. Souza).
Footnotes
Conflict of interest: The authors have declared that no conflict of interest exists.
Reference information:J Clin Invest. 2014;124(9):3767–3780. doi:10.1172/JCI66603.
References
- 1.Tosh D, Slack JM. How cells change their phenotype. Nat Rev Mol Cell Biol. 2002;3(3):187–194. doi: 10.1038/nrm761. [DOI] [PubMed] [Google Scholar]
- 2.Walker MM. Is intestinal metaplasia of the stomach reversible? Gut. 2003;52(1):1–4. doi: 10.1136/gut.52.1.1. [DOI] [PMC free article] [PubMed] [Google Scholar]
- 3.Auerbach O, Stout AP, Hammond EC, Garfinkel L. Changes in bronchial epithelium in relation to cigarette smoking and in relation to lung cancer. N Engl J Med. 1961;265:253–267. doi: 10.1056/NEJM196108102650601. [DOI] [PubMed] [Google Scholar]
- 4.Spechler SJ. Barrett esophagus and risk of esophageal cancer: a clinical review. JAMA. 2013;310(6):627–636. doi: 10.1001/jama.2013.226450. [DOI] [PubMed] [Google Scholar]
- 5.Beachy PA, Karhadkar SS, Berman DM. Tissue repair and stem cell renewal in carcinogenesis. Nature. 2004;432(7015):324–331. doi: 10.1038/nature03100. [DOI] [PubMed] [Google Scholar]
- 6.Katoh Y, Katoh M. Hedgehog target genes: mechanisms of carcinogenesis induced by aberrant hedgehog signaling activation. Curr Mol Med. 2009;9(7):873–886. doi: 10.2174/156652409789105570. [DOI] [PubMed] [Google Scholar]
- 7.Sandler RS, et al. The burden of selected digestive diseases in the United States. Gastroenterology. 2002;122(5):1500–1511. doi: 10.1053/gast.2002.32978. [DOI] [PubMed] [Google Scholar]
- 8.Pohl H, Sirovich B, Welch HG. Esophageal adenocarcinoma incidence: are we reaching the peak? Cancer Epidemiol Biomarkers Prev. 2010;19(6):1468–1470. doi: 10.1158/1055-9965.EPI-10-0012. [DOI] [PubMed] [Google Scholar]
- 9.Chen H, Fang Y, Tevebaugh W, Orlando RC, Shaheen NJ, Chen X. Molecular mechanisms of Barrett’s esophagus. Dig Dis Sci. 2011;56(12):3405–3420. doi: 10.1007/s10620-011-1885-6. [DOI] [PMC free article] [PubMed] [Google Scholar]
- 10.Yang A, et al. p63 is essential for regenerative proliferation in limb, craniofacial and epithelial development. Nature. 1999;398(6729):714–718. doi: 10.1038/19539. [DOI] [PubMed] [Google Scholar]
- 11.Daniely Y, et al. Critical role of p63 in the development of a normal esophageal and tracheobronchial epithelium. Am J Physiol Cell Physiol. 2004;287(1):C171–C181. doi: 10.1152/ajpcell.00226.2003. [DOI] [PubMed] [Google Scholar]
- 12.Bass AJ, et al. SOX2 is an amplified lineage-survival oncogene in lung and esophageal squamous cell carcinomas. Nat Genet. 2009;41(11):1238–1242. doi: 10.1038/ng.465. [DOI] [PMC free article] [PubMed] [Google Scholar]
- 13.Long KB, Hornick JL. SOX2 is highly expressed in squamous cell carcinomas of the gastrointestinal tract. Hum Pathol. 2009;40(12):1768–1773. doi: 10.1016/j.humpath.2009.06.006. [DOI] [PubMed] [Google Scholar]
- 14.Chan CW, et al. Gastrointestinal differentiation marker Cytokeratin 20 is regulated by homeobox gene CDX1. Proc Natl Acad Sci U S A. 2009;106(6):1936–1941. doi: 10.1073/pnas.0812904106. [DOI] [PMC free article] [PubMed] [Google Scholar]
- 15.Wong NA, et al. CDX1 is an important molecular mediator of Barrett’s metaplasia. Proc Natl Acad Sci U S A. 2005;102(21):7565–7570. doi: 10.1073/pnas.0502031102. [DOI] [PMC free article] [PubMed] [Google Scholar]
- 16.Huo X, et al. Acid and bile salt-induced CDX2 expression differs in esophageal squamous cells from patients with and without Barrett’s esophagus. Gastroenterology. 2010;139(1):194–203. doi: 10.1053/j.gastro.2010.03.035. [DOI] [PMC free article] [PubMed] [Google Scholar]
- 17.Gao N, White P, Kaestner KH. Establishment of intestinal identity and epithelial-mesenchymal signaling by Cdx2. Dev Cell. 2009;16(4):588–599. doi: 10.1016/j.devcel.2009.02.010. [DOI] [PMC free article] [PubMed] [Google Scholar]
- 18.Blache P, et al. SOX9 is an intestine crypt transcription factor, is regulated by the Wnt pathway, and represses the CDX2 and MUC2 genes. J Cell Biol. 2004;166(1):37–47. doi: 10.1083/jcb.200311021. [DOI] [PMC free article] [PubMed] [Google Scholar]
- 19.Wang DH, et al. Aberrant epithelial-mesenchymal Hedgehog signaling characterizes Barrett’s metaplasia. Gastroenterology. 2010;138(5):1810–1822. doi: 10.1053/j.gastro.2010.01.048. [DOI] [PMC free article] [PubMed] [Google Scholar]
- 20.Yang Q, Bermingham NA, Finegold MJ, Zoghbi HY. Requirement of Math1 for secretory cell lineage commitment in the mouse intestine. Science. 2001;294(5549):2155–2158. doi: 10.1126/science.1065718. [DOI] [PubMed] [Google Scholar]
- 21.Glickman JN, Yang A, Shahsafaei A, McKeon F, Odze RD. Expression of p53-related protein p63 in the gastrointestinal tract and in esophageal metaplastic and neoplastic disorders. Hum Pathol. 2001;32(11):1157–1165. doi: 10.1053/hupa.2001.28951. [DOI] [PubMed] [Google Scholar]
- 22.Chen X, et al. Multilayered epithelium in a rat model and human Barrett’s esophagus: similar expression patterns of transcription factors and differentiation markers. BMC Gastroenterol. 2008;8:1. doi: 10.1186/1471-230X-8-1. [DOI] [PMC free article] [PubMed] [Google Scholar]
- 23.Eda A, et al. Aberrant expression of CDX2 in Barrett’s epithelium and inflammatory esophageal mucosa. J Gastroenterol. 2003;38(1):14–22. doi: 10.1007/s005350300001. [DOI] [PubMed] [Google Scholar]
- 24.Paull A, Trier JS, Dalton MD, Camp RC, Loeb P, Goyal RK. The histologic spectrum of Barrett’s esophagus. N Engl J Med. 1976;295(9):476–480. doi: 10.1056/NEJM197608262950904. [DOI] [PubMed] [Google Scholar]
- 25.Hahn HP, et al. Intestinal differentiation in metaplastic, nongoblet columnar epithelium in the esophagus. Am J Surg Pathol. 2009;33(7):1006–1015. doi: 10.1097/PAS.0b013e31819f57e9. [DOI] [PMC free article] [PubMed] [Google Scholar]
- 26.Spechler SJ, Sharma P, Souza RF, Inadomi JM, Shaheen NJ. American Gastroenterological Association technical review on the management of Barrett’s esophagus. Gastroenterology. 2011;140(3):e18–e52. doi: 10.1053/j.gastro.2011.01.031. [DOI] [PMC free article] [PubMed] [Google Scholar]
- 27.Sasaki H, Hui C, Nakafuku M, Kondoh H. A binding site for Gli proteins is essential for HNF-3β floor plate enhancer activity in transgenics and can respond to Shh in vitro. Development. 1997;124(7):1313–1322. doi: 10.1242/dev.124.7.1313. [DOI] [PubMed] [Google Scholar]
- 28.Dufort D, Schwartz L, Harpal K, Rossant J. The transcription factor HNF3β is required in visceral endoderm for normal primitive streak morphogenesis. Development. 1998;125(16):3015–3025. doi: 10.1242/dev.125.16.3015. [DOI] [PubMed] [Google Scholar]
- 29.Ang SL, Rossant J. HNF-3β is essential for node and notochord formation in mouse development. Cell. 1994;78(4):561–574. doi: 10.1016/0092-8674(94)90522-3. [DOI] [PubMed] [Google Scholar]
- 30.Pohler E, et al. The Barrett’s antigen anterior gradient-2 silences the p53 transcriptional response to DNA damage. Mol Cell Proteomics. 2004;3(6):534–547. doi: 10.1074/mcp.M300089-MCP200. [DOI] [PubMed] [Google Scholar]
- 31.Wang J, et al. Differential gene expression in normal esophagus and Barrett’s esophagus. J Gastroenterol. 2009;44(9):897–911. doi: 10.1007/s00535-009-0082-2. [DOI] [PMC free article] [PubMed] [Google Scholar]
- 32.Hao Y, Triadafilopoulos G, Sahbaie P, Young HS, Omary MB, Lowe AW. Gene expression profiling reveals stromal genes expressed in common between Barrett’s esophagus and adenocarcinoma. Gastroenterology. 2006;131(3):925–933. doi: 10.1053/j.gastro.2006.04.026. [DOI] [PMC free article] [PubMed] [Google Scholar]
- 33.Steininger H, Pfofe DA, Muller H, Haag-Sunjic G, Fratianu V. Expression of CDX2 and MUC2 in Barrett’s mucosa. Pathol Res Pract. 2005;201(8–9):573–577. doi: 10.1016/j.prp.2005.03.010. [DOI] [PubMed] [Google Scholar]
- 34.Yu WY, Slack JM, Tosh D. Conversion of columnar to stratified squamous epithelium in the developing mouse oesophagus. Dev Biol. 2005;284(1):157–170. doi: 10.1016/j.ydbio.2005.04.042. [DOI] [PubMed] [Google Scholar]
- 35.van der Sluis M, et al. Forkhead box transcription factors Foxa1 and Foxa2 are important regulators of Muc2 mucin expression in intestinal epithelial cells. Biochem Biophys Res Commun. 2008;369(4):1108–1113. doi: 10.1016/j.bbrc.2008.02.158. [DOI] [PubMed] [Google Scholar]
- 36.Ye DZ, Kaestner KH. Foxa1 and Foxa2 control the differentiation of goblet and enteroendocrine L- and D-cells in mice. Gastroenterology. 2009;137(6):2052–2062. doi: 10.1053/j.gastro.2009.08.059. [DOI] [PMC free article] [PubMed] [Google Scholar]
- 37.Besnard V, Wert SE, Hull WM, Whitsett JA. Immunohistochemical localization of Foxa1 and Foxa2 in mouse embryos and adult tissues. Gene Expr Patterns. 2004;5(2):193–208. doi: 10.1016/j.modgep.2004.08.006. [DOI] [PubMed] [Google Scholar]
- 38.Litingtung Y, Lei L, Westphal H, Chiang C. Sonic hedgehog is essential to foregut development. Nat Genet. 1998;20(1):58–61. doi: 10.1038/1717. [DOI] [PubMed] [Google Scholar]
- 39.Motoyama J, Liu J, Mo R, Ding Q, Post M, Hui CC. Essential function of Gli2 and Gli3 in the formation of lung, trachea and oesophagus. Nat Genet. 1998;20(1):54–57. doi: 10.1038/1711. [DOI] [PubMed] [Google Scholar]
- 40.Lynn FC, Smith SB, Wilson ME, Yang KY, Nekrep N, German MS. Sox9 coordinates a transcriptional network in pancreatic progenitor cells. Proc Natl Acad Sci U S A. 2007;104(25):10500–10505. doi: 10.1073/pnas.0704054104. [DOI] [PMC free article] [PubMed] [Google Scholar]
- 41.Barrionuevo F, et al. Homozygous inactivation of Sox9 causes complete XY sex reversal in mice. Biol Reprod. 2006;74(1):195–201. doi: 10.1095/biolreprod.105.045930. [DOI] [PubMed] [Google Scholar]
- 42.Harfe BD, Scherz PJ, Nissim S, Tian H, McMahon AP, Tabin CJ. Evidence for an expansion-based temporal Shh gradient in specifying vertebrate digit identities. Cell. 2004;118(4):517–528. doi: 10.1016/j.cell.2004.07.024. [DOI] [PubMed] [Google Scholar]
- 43.Akiyama H, Chaboissier MC, Martin JF, Schedl A, de Crombrugghe B. The transcription factor Sox9 has essential roles in successive steps of the chondrocyte differentiation pathway and is required for expression of Sox5 and Sox6. Genes Dev. 2002;16(21):2813–2828. doi: 10.1101/gad.1017802. [DOI] [PMC free article] [PubMed] [Google Scholar]
- 44.Chiang C, et al. Cyclopia and defective axial patterning in mice lacking Sonic hedgehog gene function. Nature. 1996;383(6599):407–413. doi: 10.1038/383407a0. [DOI] [PubMed] [Google Scholar]
- 45.Wan H, et al. Compensatory roles of Foxa1 and Foxa2 during lung morphogenesis. J Biol Chem. 2005;280(14):13809–13816. doi: 10.1074/jbc.M414122200. [DOI] [PubMed] [Google Scholar]
- 46.Jaiswal KR, et al. Characterization of telomerase-immortalized, non-neoplastic, human Barrett’s cell line (BAR-T). Dis Esophagus. 2007;20(3):256–264. doi: 10.1111/j.1442-2050.2007.00683.x. [DOI] [PubMed] [Google Scholar]
- 47.Bajpai M, Liu J, Geng X, Souza RF, Amenta PS, Das KM. Repeated exposure to acid and bile selectively induces colonic phenotype expression in a heterogeneous Barrett’s epithelial cell line. Lab Invest. 2008;88(6):643–651. doi: 10.1038/labinvest.2008.34. [DOI] [PubMed] [Google Scholar]
- 48.Taipale J, et al. Effects of oncogenic mutations in Smoothened and Patched can be reversed by cyclopamine. Nature. 2000;406(6799):1005–1009. doi: 10.1038/35023008. [DOI] [PubMed] [Google Scholar]
- 49.Park SW, et al. The protein disulfide isomerase AGR2 is essential for production of intestinal mucus. Proc Natl Acad Sci U S A. 2009;106(17):6950–6955. doi: 10.1073/pnas.0808722106. [DOI] [PMC free article] [PubMed] [Google Scholar]
- 50.Zhao F, et al. Disruption of Paneth and goblet cell homeostasis and increased endoplasmic reticulum stress in Agr2–/– mice. Dev Biol. 2010;338(2):270–279. doi: 10.1016/j.ydbio.2009.12.008. [DOI] [PMC free article] [PubMed] [Google Scholar]
- 51.Sharma SK, et al. Characterization of a novel Foxa (hepatocyte nuclear factor-3) site in the glucagon promoter that is conserved between rodents and humans. Biochem J. 2005;389(pt 3):831–841. doi: 10.1042/BJ20050334. [DOI] [PMC free article] [PubMed] [Google Scholar]
- 52.Watts JA, et al. Study of FoxA pioneer factor at silent genes reveals Rfx-repressed enhancer at Cdx2 and a potential indicator of esophageal adenocarcinoma development. PLoS Genet. 2011;7(9):e1002277. doi: 10.1371/journal.pgen.1002277. [DOI] [PMC free article] [PubMed] [Google Scholar]
- 53.Wang X, et al. Residual embryonic cells as precursors of a Barrett’s-like metaplasia. Cell. 2011;145(7):1023–1035. doi: 10.1016/j.cell.2011.05.026. [DOI] [PMC free article] [PubMed] [Google Scholar]
- 54.Quante M, et al. Bile acid and inflammation activate gastric cardia stem cells in a mouse model of barrett-like metaplasia. Cancer Cell. 2012;21(1):36–51. doi: 10.1016/j.ccr.2011.12.004. [DOI] [PMC free article] [PubMed] [Google Scholar]
- 55.Shen CN, Burke ZD, Tosh D. Transdifferentiation, metaplasia and tissue regeneration. Organogenesis. 2004;1(2):36–44. doi: 10.4161/org.1.2.1409. [DOI] [PMC free article] [PubMed] [Google Scholar]
- 56.Zhang HY, et al. Differences in activity and phosphorylation of MAPK enzymes in esophageal squamous cells of GERD patients with and without Barrett’s esophagus. Am J Physiol Gastrointest Liver Physiol. 2008;295(3):G470–G478. doi: 10.1152/ajpgi.90262.2008. [DOI] [PMC free article] [PubMed] [Google Scholar]
- 57.Souza RF, et al. Differences in ERK activation in squamous mucosa in patients who have gastroesophageal reflux disease with and without Barrett’s esophagus. Am J Gastroenterol. 2005;100(3):551–559. doi: 10.1111/j.1572-0241.2005.41122.x. [DOI] [PubMed] [Google Scholar]
- 58.Menke V, et al. Conversion of metaplastic Barrett’s epithelium into post-mitotic goblet cells by gamma-secretase inhibition. Dis Model Mech. 2010;3(1–2):104–110. doi: 10.1242/dmm.003012. [DOI] [PubMed] [Google Scholar]
- 59.Que J, et al. Multiple dose-dependent roles for Sox2 in the patterning and differentiation of anterior foregut endoderm. Development. 2007;134(13):2521–2531. doi: 10.1242/dev.003855. [DOI] [PMC free article] [PubMed] [Google Scholar]
- 60.Rodriguez P, Da Silva S, Oxburgh L, Wang F, Hogan BL, Que J. BMP signaling in the development of the mouse esophagus and forestomach. Development. 2010;137(24):4171–4176. doi: 10.1242/dev.056077. [DOI] [PMC free article] [PubMed] [Google Scholar]
- 61.Tamagawa Y, et al. Notch signaling pathway and Cdx2 expression in the development of Barrett’s esophagus. Lab Invest. 2012;92(6):896–909. doi: 10.1038/labinvest.2012.56. [DOI] [PubMed] [Google Scholar]
- 62.Soriano P. Generalized lacZ expression with the ROSA26 Cre reporter strain. Nat Genet. 1999;21(1):70–71. doi: 10.1038/5007. [DOI] [PubMed] [Google Scholar]
- 63.Briggs KJ, et al. Cooperation between the Hic1 and Ptch1 tumor suppressors in medulloblastoma. Genes Dev. 2008;22(6):770–785. doi: 10.1101/gad.1640908. [DOI] [PMC free article] [PubMed] [Google Scholar]
- 64.Newton MA, Kendziorski CM, Richmond CS, Blattner FR, Tsui KW. On differential variability of expression ratios: improving statistical inference about gene expression changes from microarray data. J Comput Biol. 2001;8(1):37–52. doi: 10.1089/106652701300099074. [DOI] [PubMed] [Google Scholar]
- 65. Newton MA, Kendziorski CM. Parametric empirical Bayes methods for microarrays. In: Parmigiani G, Garrett ES, Irizarry R, Zeger SL, eds. The Analysis Of Gene Expression Data: Methods And Software. New York, New York, USA: Springer Verlag; 2003:254–271. [Google Scholar]
Associated Data
This section collects any data citations, data availability statements, or supplementary materials included in this article.


