

Summary
Purpose
It is commonly assumed that antiepileptic drugs (AEDs) act similarly in the various parts of the brain as long as their molecular targets are present. A few experimental studies on metabolic effects of vigabatrin, levetiracetam, valproate, and lamotrigine have shown that these drugs may act differently in different brain regions. We examined effects of chronic treatment with levetiracetam or phenytoin on mRNA levels to detect regional drug effects in a broad, nonbiased manner.
Methods
mRNA levels were monitored in three brain regions with oligonucleotide-based microarrays.
Results
Levetiracetam (150 mg/kg for 90 days) changed the expression of 65 genes in pons/medulla oblongata, two in hippocampus, and one in frontal cortex. Phenytoin (75 mg/kg), in contrast, changed the expression of only three genes in pons/medulla oblongata, but 64 genes in hippocampus, and 327 genes in frontal cortex. Very little overlap between regions or drug treatments was observed with respect to effects on gene expression.
Discussion
We conclude that chronic treatment with levetiracetam or phenytoin causes region-specific and highly differential effects on gene expression in the brain. Regional effects on gene expression could reflect regional differences in molecular targets of AEDs, and they could influence the clinical profiles of AEDs.
Keywords: Epilepsy, mRNA, Transcription, Antiepileptic drugs, Brain region
Identification of molecular targets in the brain has been a main focus of the research into mechanisms of action of antiepileptic drugs (AEDs). Much less effort has been put into investigating whether AEDs may have distinct regional effects in the brain. It appears to be a common assumption that AEDs act similarly in the various parts of the brain as long as their molecular targets are present. However, if AEDs have regional rather than global effects in the brain, such information could be useful in clinical decision-making. A few studies have shown that vigabatrin, levetiracetam, valproate, and lamotrigine may have regional, for example, hippocampal, rather than global effects in rat brain, as could be seen as changes in levels of proteins and amino acids involved in neurotransmission (Löscher & Hörstermann, 1994; Löscher et al., 1996; Hassel et al., 2001a,b).
We chose to study two AEDs with different molecular targets. Levetiracetam binds to the synaptic vesicle protein SV2A (Lynch et al., 2004), which may be involved in the filling of synaptic vesicles at glutamatergic synapses (Budzinski et al., 2009), to N-type calcium channels (Lukyanetz et al., 2002), and it has been shown to augment γ-aminobutyric acid receptor A (GABAA) and glycine receptor activity by inhibiting the binding of zinc and β-carbolines (Rigo et al., 2002). Phenytoin binds to the batrachotoxin site located on several of the sodium channel alpha subunits (Worley & Baraban, 1987; for reviews see Tunnicliff, 1996; Catterall et al., 2005), and it also inhibits binding of zinc and β-carbolines to GABAa and glycine receptors (Rigo et al., 2002). Furthermore, the two drugs have different clinical profiles. Levetiracetam is effective in myoclonus epilepsy (Krauss & Mathews, 2003; Kälviäinen et al., 2008), whereas phenytoin, which is effective in several types of epilepsy, is generally less effective or even detrimental in myoclonus epilepsy (Prasad et al., 2003; Kälviäinen et al., 2008).
To identify regional effects of chronic treatment with the two drugs, we monitored alterations in mRNA levels in frontal cortex, hippocampus, and pons/medulla oblongata by oligonucleotide-based microarrays. We used the microarray technique as a broad, nonbiased method to detect responses of the brain regions to chronic AED exposure, rather than to infer mechanisms of action of the AEDs from the identity of the genes whose expression was changed. Therefore, our goal was not to search for epilepsy-related genes per se. Previous studies have shown that changes in mRNA levels sometimes do not translate to the protein level (e.g., Bough et al., 2006). However, because gene expression is subject to regulation through intracellular signaling pathways, effects of AEDs on gene expression may reflect effects on intracellular signaling, either directly, or indirectly, for example, through action on neurotransmitter receptors or ion channels.
METHODS
Animal handling
The animals were female Wistar rats (Taconic, Ry, Denmark), 80 days old, and approximately 200 g at the start of the study. Ambient temperature was 21°C, humidity was 55%, the light/dark cycle was 12 h, and each cage was shared by three animals, which received levetiracetam, phenytoin, or control treatment (see subsequent text). Rats had free access to chow (Rat and mouse no. 3 breeding, SDS, Witham, UK) and tap water that had been rinsed by reverse osmosis and ionic exchange. The study adhered strictly to institutional and national ethical guidelines for animal research.
Levetiracetam and phenytoin were dissolved at 45 and 22.5 mg/ml, respectively, in sucrose 2 mol/L, with parabens 0.1% (weight/volume) as preservative. The control solution was 2 mol/L sucrose with parabenes only. The animals were fed perorally through a gastric tube with levetiracetam 150 mg/kg, phenytoin 75 mg/kg, or control solution (3.33 ml solution/kg) twice daily (6 a.m. and 4 p.m.) for 90 consecutive days to achieve chronic treatment. These doses produced clinically relevant serum concentrations in a pilot study. Although the antiepileptic effects of these drugs are evident upon acute treatment, we chose to study the steady-state effects on gene expression to reveal the effects of chronic exposure. A separate group of rats that received half the levetiracetam dose was included for measurement of serum levetiracetam levels. Four hours after the last dose of the AED, the animals were anesthetized deeply with phenobarbital, and blood was drawn from the inferior vena cava for determination of drug levels. Control animals were treated in the same way. The animals were decapitated within 1 min after administration of phenobarbital; the brains were removed and the frontal neocortical poles, the hippocampus, and the pons plus medulla oblongata were dissected rapidly on ice and stored at −70°C until analysis. The brainstem was isolated by cutting at the upper border immediately above the pons, with the lower border defined by the level of foramen magnum; therefore, the tissue sample included the entire medulla oblongata and pons but not the mesencephalon. The hippocampal specimen consisted of the entire hippocampal formation, including the dentate gyrus. Frontal cortex was dissected from the frontal pole without the underlying white matter.
Microarray analysis
Seven animals from each group were used for microarray analysis. Total RNA from each of the three regions was extracted with Trizol and subjected to on-column DNAse digestion over Qiagen RNeasy columns (Qiagen, Valencia, CA, U.S.A.). RNA was quantified by absorbance at 260 nm. For quality control a portion of each sample (100 ng RNA) was reverse transcribed. Real-time polymerase chain reaction (PCR) for neuronal enolase was performed on 5-ng RNA equivalent of each cDNA sample; cycle thresholds ranged between 18 and 22 cycles for the 63 samples. An additional 5-ng RNA equivalent was subjected to 35-cycle PCR for GluR2 transcripts; all samples produced intense single bands on an agarose gel. These tests indicated that the RNA samples were of sufficient quality. RNA samples (10 μg) were sent to the National Institute of Neurological Disorders and Stroke-National Institute of Mental Health (NINDS-NIMH) Affymetrix Microarray Consortium (TGEN, Phoenix, AZ, U.S.A.) for probe generation, hybridization to rat GeneChips (genome RA230.2 from Affymetrix, Santa Clara, CA, U.S.A.), and GeneChip scanning. Global scaling of the derived intensities brought the overall intensities of each cell to a similar target value of 190.
The relative abundance of each probe set and an evaluation of whether a particular transcript was expressed above background were calculated for each sample using Microarray suite (MAS 5.0; Affymetrix). We reassigned the original Affymetrix probe sets of the rat RA230.2 chip (>31,000 total probe pairs) to gene names according to Dai et al. (2005), who updated the probe assignments from the original UniGene build 99 used by Affymetrix to UniGene build 154 (http://brainarray.mbni.med.umich.edu/Brainarray/Database/CustomCDF/genomic_curated_CDF.asp). In this process, probe sets belonging to the same genes were pooled into one gene identifier, and probe sets targeting the noncoding strand were eliminated. Together with the new UniGene build, this reduced the number of apparently unique transcripts represented on the chip from 31,041 to 16,165.
Each spot on an individual chip was determined by discrimination scores of the signal intensities to be present, marginally present, or absent using a one-sided Wilcoxon signed rank test. We selected genes for subsequent analysis if signal intensities were significantly above background (i.e., called “present”) in at least all but one of the arrays tested in each group.
The hierarchical clustering routine of the GenePattern program (http://www.broad.mit.edu/cancer/software/gene-pattern/) was used to evaluate region-specific changes in gene expression in rats treated chronically with levetiracetam or phenytoin. The hierarchical clustering algorithm utilized Euclidean distance measures, with the mean of each row subtracted. Hierarchical clustering does not require preselection of transcripts that meet statistical significance for differential expression, but rather considers all transcripts that are expressed above background.
Sixty of 63 microarrays showed >95% correlation between the replicates within a group and met all other Affymetrix quality control standards. One microarray each from the frontal cortex control group, the pons/medulla phenytoin group, and the hippocampus phenytoin group were recommended by TGEN for omission from analysis based on low hybridization quality.
We compared two statistical methods to identify differentially expressed transcripts. First, the Significance Analysis of Microarrays (SAM) program (http://www-stat.stanford.edu/tibs/SAM) (Tusher et al., 2001) was used to determine differences in patterns of gene expression between vehicle and drug-treated groups at a 1% false discovery rate. Second, for a given brain region, genes expressed above background in at least all but one of the rats in at least one of the three treatment conditions (control, levetiracetam, and phenytoin) were selected. From this subgroup, genes were eliminated from consideration if they had <50% increase or 33% decrease in expression, as determined from the mean values. This criterion eliminated many transcripts that are evenly expressed throughout all nine groups, and thus increased the power with which differential expression could be detected. A oneway analysis of variance (ANOVA) parametric test was performed not assuming equal variances, with the false discovery rate set at 1% by the method of Benjamini and Hochberg (1995). Both approaches yielded similar patterns of differential expression across regions and drugs, although SAM typically identified a larger number of transcripts (some with small changes in expression). We decided to use the more stringent ANOVA approach for subsequent analysis.
AED analysis in plasma
The plasma level of phenytoin was analyzed by a radioimmunoassay (L’Estrange Orme et al., 1976). The plasma level of levetiracetam was measured by high performance lipid chromatography (HPLC) and ultraviolet (UV) detection (Ratnaraj et al., 1996).
RESULTS
Evaluation of microarray data
Approximately 60% of the 16,165 unique probe sets on the Rat 230.2 GeneChip were flagged present (MAS 5.0) in at least all but one of the samples for each condition (Table 1). Low variability was generally observed between animals within a group, with the coefficient of variation of the expression level about 15% in each of the nine groups. The complete dataset can be found on the Gene Expression Omnibus (GEO) website http://www.ncbi.nlm.nih.gov/geo/, dataset GSE2880. Plots of the mean control signal for above-background transcripts against the mean drug signal were linear with correlation >99% in all cases, indicating that the expression level for most transcripts was not changed by either drug. Likewise, histograms of the log2 expression ratios for all transcripts expressed above background were Gaussian with a mean log2 ratio = 0.0 ± 0.01 for each of the three treatment conditions examined in the three brain regions sampled.
Table 1.
Summary of microarray results in three regions of rat brain after chronic treatment with levetiracetam (Levet) or phenytoin (Phen)
| Drug | Region | No. expressed transcripts | No. transcripts with mean >150% or <67% of control |
No. transcripts >150%or <67% of control and FDR < 0.01 |
|---|---|---|---|---|
| Levet | Pons/medulla | 9,765 | 114 | 65 |
| Phen | Pons/medulla | 9,861 | 45 | 3 |
| Levet | Hippocampus | 9,507 | 48 | 2 |
| Phen | Hippocampus | 9,938 | 223 | 64 |
| Levet | Frontal cortex | 9,771 | 75 | 1 |
| Phen | Frontal cortex | 9,898 | 496 | 327 |
The rat 230.2 GeneChip was used, which contained probe sets representing 16,165 unique transcripts (Dai et al., 2005). Each row represents data from 6 to 7 control or drug-treated animals. The third column shows the number of expressed transcripts with above-background signals in all or all but one control or drug-treated animals. The fourth column shows the number of transcripts with expression >150% or <67% of control as calculated from mean values, whereas the fifth column shows the number of differentially expressed transcripts after controlling for a false discovery rate (FDR) of <0.01 [one-way analysis of variance (ANOVA) with Benjamini and Hochberg (1995) correction for multiple comparisons].
Drug- and region-specific changes in gene expression
Expressed transcripts were clustered into three broad categories corresponding to each of the three brain regions sampled (Fig. 1A). The two cortical regions (hippocampus and frontal cortex) clustered together expectedly against the pons/medulla. Within the two cortical regions, chronic phenytoin appeared to cause more extensive changes in expression than chronic levetiracetam, whereas the opposite was the case in pons/medulla (Fig. 1A). These results suggest that chronic treatment with phenytoin or levetiracetam causes distinct transcriptional changes in each of the three brain regions. We explored this in more detail by identifying the number of differentially expressed genes in each condition.
Figure 1.
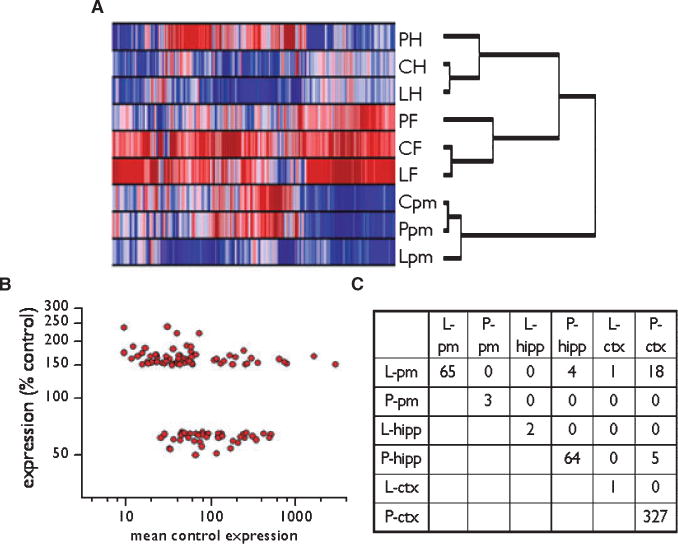
(A) Hierarchical clustering of transcript expression levels in three brain regions of rats chronically treated with levetiracetam or phenytoin. P, phenytoin; L, levetiracetam; C, control treatment; H, hippocampus; F, frontal cortex; and pm, pons/medulla. Red indicates relatively high expression compared with blue (low expression), for a given gene across all conditions. Each row represents the color-coded, row-subtracted mean expression of transcripts in 6–7 rats within one treatment group. Each column represents a different gene. For this analysis 5,400 expressed transcripts were expressed above-background in each of the 9 datasets and were subjected to clustering; only a minority of these were differentially expressed (ANOVA with false discovery rate (FDR) <.01, Table 1). Approximately half the expressed genes were excluded from this analysis because their expression levels were very similar across all conditions. (B) Differentially expressed transcripts occurred over a 100-fold range of control expression levels, indicating that the magnitude of expression change of significantly different transcripts was not dependent on mean control signal intensity. (C) Nearly nonoverlapping profiles of differentially expressed genes in pons/medulla (pm), hippocampus (hipp), and frontal cortex (ctx) of rats fed levetiracetam (L) or phenytoin (P). The number of common transcripts in each pair of conditions is shown. Epilepsia © ILAE
Only a minority of the expressed transcripts (between 0.5% and 5.0% in the different conditions) exhibited mean expression >150% of control or <67% of control after chronic drug treatment (Table 1). Of these genes, statistical evaluation of expression ratios by ANOVA showed that levetiracetam treatment changed the expression of 65 genes in the pons/medulla (Table 1). Differentially expressed transcripts occurred over a 100-fold range of control expression levels (see Fig. 1B, which illustrates this point with the effect of levetiracetam on gene expression in the pons/medulla), further confirming the unbiased nature of the microarray results. In contrast to levetiracetam, phenytoin treatment changed the expression of only three genes in pons/medulla, but had a much broader effect on frontal cortex than levetiracetam (327 genes vs. 1 gene, respectively, Table 1). Similarly, the response of the hippocampus to phenytoin treatment was much broader than that to levetiracetam (Table 1). No transcripts were affected by both lev-etiracetam and phenytoin in all three regions, and very few were affected in more than one brain region by either drug (Fig. 1C). These findings together demonstrate a regionally specific, transcriptionally distinct response to chronic treatment with either drug.
Categorical analysis of differential gene expression after chronic AED treatment
Chronic levetiracetam treatment caused a change in the expression of 65 genes in the pons/medulla, 41 of which are currently assigned formal gene symbols or could otherwise be identified. These were sorted into six broad functional categories (Table S1): (1) ion channels, transporters and extracellular signaling: (2) intracellular signal transduction; (3) transcription/translation; (4) replication/DNA repair; (5) cytoskeleton/cell adhesion; and (6) metabolism. Chronic phenytoin treatment altered expression of 153 identified genes in frontal cortex and 31 in hippocampus, which were sorted into functional categories as above (Tables S2 and S3). Chronic treatment with levetiracetam or phenytoin caused insignificant changes in expression level of SV2A or one prominent target of phenytoin in the brain, SCN1A; expression changes ranged from 91–115% of control in the three regions (data not shown).
Serum concentrations of AEDs, weight gain
Four hours after the last dose of levetiracetam, that is, at the time of death, serum levetiracetam was 259 ± 29 μM [mean ± standard error of the mean (SEM)]. In a group of animals that received half the dose of levetiracetam, 75 mg/kg twice daily, serum levetiracetam was 119 ± 20 μM. Serum phenytoin was 74 ± 12 μM 4 h after the last dose of phenytoin. These values are similar to therapeutic plasma concentrations reached in humans (Johannessen et al., 2003; Joerger et al., 2006).
There was no difference between the groups with respect to weight gain. At the beginning of the study levetiracetam-treated, phenytoin-treated, and vehicle-treated animals weighed 199 ± 10, 198 ± 9, and 196 ± 9 g, respectively. At the end of the 90-day study period they weighed 253 ± 20, 249 ± 10, and 248 ± 16 g, respectively. All animals tolerated the treatment and the gastric tube feeding without any signs of discomfort. There was no reduction in motor activity or any observed changes in thriving of the animals.
DISCUSSION
Treatment with levetiracetam or phenytoin leads to distinct regional patterns of changes in gene expression
We show here that chronic levetiracetam treatment causes regional changes in gene expression that are different from those caused by phenytoin treatment. Whereas phenytoin treatment influenced gene expression primarily in hippocampus and frontal cortex, levetiracetam treatment caused changes predominantly in pons/medulla oblongata. The latter finding confirms and extends that of Gu et al. (2004), who found very little effect of long-term levetiracetam treatment on gene expression in temporal cortex and hippocampus.
Pons and medulla oblongata contain several nuclei that might be of importance in epilepsy. Noradrenergic and serotonergic nuclei in pons and medulla oblongata project to the forebrain, including hippocampus (Walling & Harley, 2004; Hensler, 2006), and they have been shown to modulate seizure activity (Racine & Coscina, 1979; Bengzon et al., 1990; Noebels & Rutecki, 1990; Janumpalli et al., 1998; Raisinghani & Faingold, 2005). Although we do not know whether these nuclei responded to levetiracetam therapy with alterations in gene expression, and although the pons/medulla sample is heterogeneous with respect to neuronal populations, the present findings raise the question whether levetiracetam owes some of its antiepileptic or adverse effects to a primary action in the brainstem. The effect of phenytoin on gene expression in frontal cortex and hippocampus agrees with its therapeutic effect on epilepsies that originate from foci in these structures and on epilepsies with generalized onset (Tudur Smith et al., 2002). An effect of phenytoin on the firing pattern of cortical neurons could, for example, result in broad adjustments to synaptic activity that is reflected in the pattern of gene expression. With respect to adverse effects of chronic AED treatment one may speculate that the cognitive deficits more often commented upon after chronic treatment with therapeutic levels of phenytoin than with levetiracetam (Brunbech & Sabers, 2002; Shannon & Love, 2007) might be related to a broader influence of chronic phenytoin on gene expression in cortex and hippocampus. It must be emphasized, however, that our studies were done with normal rather than epileptic rats; the epileptic phenotype may entail a difference in the response to AEDs.
Does “region of action” correspond to localization of molecular targets?
The antiepileptic effects of phenytoin and levetiracetam are thought largely to be mediated through their actions on sodium channels and the synaptic vesicle protein SV2A, respectively (Worley & Baraban, 1987; Lynch et al., 2004); however, chronic treatment with levetiracetam or phenytoin caused no changes in expression levels of sodium channel subunits or of SV2A. Changes in mRNA levels after AED treatment reflect effects of AEDs on signaling pathways that regulate transcription or mRNA stability. Some of these changes could be a consequence of the interaction of the AEDs with their known molecular targets and the resultant change in neuronal excitability. Neuronal activity influences gene expression (e.g., Hong et al., 2004) and drugs that modify neuronal activity through interference with ion channels or neurotransmission would be expected to affect gene expression in ways related to their molecular targets. Phenytoin blocks sodium channels by binding to the batrachotoxin site located on several of the sodium channel alpha subunits (Worley & Baraban, 1987; for reviews see Tunnicliff, 1996; Catterall et al., 2005), a property that is not shared with levetiracetam (Zona et al., 2001; Niespodziany et al., 2004). The batrachotoxin binding site is abundant in cerebral cortex and in subregions of hippocampus, but it is scarce in pons and medulla oblongata (Worley & Baraban, 1987). Therefore, the regional effect of phenytoin on gene expression corresponded to the distribution of its molecular target.
The synaptic vesicle protein SV2A, which has been identified as a levetiracetam binding site (Lynch et al., 2004), binds levetiracetam in cerebral cortex, hippocampus, and pons (Fuks et al., 2003), but only in pons was gene expression broadly affected in our study. Levetiracetam has also been shown to augment GABAA and glycine receptor activity by inhibiting the binding of zinc and β-carbolines (Rigo et al., 2002). The glycine receptor is expressed at higher levels in medulla oblongata and pons than in cortex and hippocampus (for review, see Bechade et al., 1994). It is doubtful, however, that levetiracetam caused major changes in gene expression through modulation of glycine receptors, since phenytoin, which had very little effect on gene expression in pons/medulla oblongata, modulates the glycine receptor in the same way (Rigo et al., 2002). Finally, levetiracetam inhibits N-type calcium channels (Lukyanetz et al., 2002), but these are highly expressed in the hippocampus (Westenbroek et al., 1992), where levetiracetam had only marginal effects on gene expression. Therefore, levetiracetam-induced regional changes in gene expression are not closely associated with the distribution of known levetiracetam binding sites, a finding that suggests that levetiracetam may have additional molecular targets in the brain, or that the consequence of its binding to known molecular targets is regionally different.
The finding that neither of the drugs tended to affect expression of the same genes in multiple brain regions suggests that the drugs affected distinct intracellular pathways in different brain regions. Regional expression of drug-extruding proteins in the blood-brain barrier (P-glycoprotein) could theoretically influence the regional pattern of effect of AEDs. However, long-term treatment with phenytoin does not appear to induce P-glycoprotein in nonepileptic rats (Seegers et al., 2002), although phenytoin may be extruded from the brain in a region-specific manner in epileptic rats (van Vliet et al., 2007). Levetiracetam does not appear to be a substrate of P-glycoprotein (Potschka et al., 2004; van Vliet et al., 2008).
The present findings of regional effects of AEDs do not explain why levetiracetam is effective in myoclonus epilepsy while phenytoin is not (Krauss & Mathews, 2003; Prasad et al., 2003; Kälviäinen et al., 2008); however, the region-specific effects of the drugs on gene expression may contribute to the drugs’ clinical profiles. Knowledge about regional effects of AEDs in the brain may become important in the tailoring of antiepileptic therapy to treat focal epilepsies or to avoid side effects that are related to regional effects of AEDs.
Supplementary Material
Table S1. Changes in gene expression in pons/medulla after chronic levetiracetam treatment.
Table S2. Differentially expressed transcripts in hippocampus after chronic phenytoin.
Table S3. Differentially-expressed transcripts in frontal cortex after chronic phenytoin.
Acknowledgments
This study was supported by The Norwegian Chapter of The International League Against Epilepsy; The Department of Neurology, Division of Clinical Neuroscience, Rikshospitalet Medical Centre; and NINDS (RD).
Footnotes
Supporting Information
Additional Supporting Information may be found in the online version of this article:
Please note: Wiley-Blackwell is not responsible for the content or functionality of any supporting information supplied by the authors. Any queries (other than missing material) should be directed to the corresponding author for the article.
Disclosure
UCB, which sells levetiracetam, sponsored BH to attend the 2006 annual meeting of the American Epilepsy Society. LG received from UCB a travel grant and honorarium to chair a satellite meeting. The other authors have no potential conflicts of interest to disclose. We confirm that we have read the Journal’s position on issues involved in ethical publication and affirm that this report is consistent with those guidelines.
References
- Bechade C, Sur C, Triller A. The inhibitory neuronal glycine receptor. Bioessays. 1994;16:735–744. doi: 10.1002/bies.950161008. [DOI] [PubMed] [Google Scholar]
- Bengzon J, Kalen P, Lindvall O. Evidence for long-term reduction of noradrenaline release after kindling in the rat hippocampus. Brain Res. 1990;535:353–357. doi: 10.1016/0006-8993(90)91624-p. [DOI] [PubMed] [Google Scholar]
- Benjamini Y, Hochberg Y. Controlling the false discovery rate: a practical and powerful approach to multiple testing. J R Stat Soc Ser B. 1995;57:289–300. [Google Scholar]
- Bough KJ, Wetherington J, Hassel B, Pare JF, Gawryluk JW, Greene JG, Shaw R, Smith Y, Geiger JD, Dingledine RJ. Mitochondrial biogenesis in the anticonvulsant mechanism of the ketogenic diet. Ann Neurol. 2006;60:223–235. doi: 10.1002/ana.20899. [DOI] [PubMed] [Google Scholar]
- Brunbech L, Sabers A. Effect of antiepileptic drugs on cognitive function in individuals with epilepsy: a comparative review of newer versus older agents. Drugs. 2002;62:593–604. doi: 10.2165/00003495-200262040-00004. [DOI] [PubMed] [Google Scholar]
- Budzinski KL, Allen RW, Fujimoto BS, Kensel-Hammes P, Belnap DM, Bajjalieh SM, Chiu DT. Large structural change in isolated synaptic vesicles upon loading with neurotransmitter. Biophys J. 2009;97:2577–2584. doi: 10.1016/j.bpj.2009.08.032. [DOI] [PMC free article] [PubMed] [Google Scholar]
- Catterall WA, Goldin AL, Waxman SG. International Union of Pharmacology. XLVII. Nomenclature and structure-function relationships of voltage-gated sodium channels. Pharmacol Rev. 2005;57:397–409. doi: 10.1124/pr.57.4.4. [DOI] [PubMed] [Google Scholar]
- Dai M, Wang P, Boyd AD, Kostov G, Athey B, Jones EG, Bunney WE, Myers RM, Speed TP, Akil H, Watson SJ, Meng F. Evolving gene/transcript definitions significantly alter the interpretation of Gene-Chip data. Nucleic Acids Res. 2005;33:e175. doi: 10.1093/nar/gni179. [DOI] [PMC free article] [PubMed] [Google Scholar]
- Fuks B, Gillard M, Michel P, Lynch B, Vertongen P, Leprince P, Klitgaard H, Chatelain P. Localization and photoaffinity labelling of the levetiracetam binding site in rat brain and certain cell lines. Eur J Pharmacol. 2003;478:11–19. doi: 10.1016/j.ejphar.2003.08.033. [DOI] [PubMed] [Google Scholar]
- Gu J, Lynch BA, Anderson D, Klitgaard H, Lu S, Elashoff M, Ebert U, Potschka H, Löscher W. The antiepileptic drug levetiracetam selectively modifies kindling-induced alterations in gene expression in the temporal lobe of rats. Eur J Neurosci. 2004;19:334–345. doi: 10.1111/j.0953-816x.2003.03106.x. [DOI] [PubMed] [Google Scholar]
- Hassel B, Iversen EG, Gjerstad L, Taubøll E. Up-regulation of hippocampal glutamate transport during chronic treatment with sodium valproate. J Neurochem. 2001a;77:1285–1292. doi: 10.1046/j.1471-4159.2001.00349.x. [DOI] [PubMed] [Google Scholar]
- Hassel B, Taubøll E, Gjerstad L. Chronic lamotrigine treatment increases rat hippocampal GABA shunt activity and elevates cerebral taurine levels. Epilepsy Res. 2001b;43:153–163. doi: 10.1016/s0920-1211(00)00196-0. [DOI] [PubMed] [Google Scholar]
- Hensler JG. Serotonin. In: Siegel GJ, Albers RW, Brady ST, Price DL, editors. Basic neurochemistry. 7. Elsevier; Amsterdam: 2006. pp. 227–248. [Google Scholar]
- Hong SJ, Li H, Becker KG, Dawson VL, Dawson TM. Identification and analysis of plasticity-induced lateresponse genes. Proc Natl Acad SciUSA. 2004;101:2145–2150. doi: 10.1073/pnas.0305170101. [DOI] [PMC free article] [PubMed] [Google Scholar]
- Janumpalli S, Butler LS, MacMillan LB, Limbird LE, McNamara JO. A point mutation (D79N) of the alpha2A adrenergic receptor abolishes the antiepileptogenic action of endogenous norepinephrine. J Neurosci. 1998;18:2004–2008. doi: 10.1523/JNEUROSCI.18-06-02004.1998. [DOI] [PMC free article] [PubMed] [Google Scholar]
- Joerger M, Huitema AD, Boogerd W, van der Sande JJ, Schellens JH, Beijnen JH. Interactions of serum albumin, valproic acid and carbamazepine with the pharmacokinetics of phenytoin in cancer patients. Basic Clin Pharmacol Toxicol. 2006;99:133–140. doi: 10.1111/j.1742-7843.2006.pto_309.x. [DOI] [PubMed] [Google Scholar]
- Johannessen SI, Battino D, Berry DJ, Bialer M, Kramer G, Tomson T, Patsalos PN. Therapeutic drug monitoring of the newer antiepileptic drugs. Ther Drug Monit. 2003;25:347–363. doi: 10.1097/00007691-200306000-00016. [DOI] [PubMed] [Google Scholar]
- Kälviäinen R, Khyuppenen J, Koskenkorva P, Eriksson K, Vanninen R, Mervaala E. Clinical picture of EPM1-Unverricht-Lundborg disease. Epilepsia. 2008;49:549–556. doi: 10.1111/j.1528-1167.2008.01546.x. [DOI] [PubMed] [Google Scholar]
- Krauss GL, Mathews GC. Similarities in mechanisms and treatments for epileptic and nonepileptic myoclonus. Epilepsy Curr. 2003;3:19–21. doi: 10.1046/j.1535-7597.2003.03107.x. [DOI] [PMC free article] [PubMed] [Google Scholar]
- L’Estrange Orme M, Borga O, Cook CE, Sjoqvist F. Measurement of diphenylhydantoin in 0.1-ml plasma samples: gas chromatography and radioimmunoassay compared. Clin Chem. 1976;22:246–249. [PubMed] [Google Scholar]
- Löscher W, Hörstermann D. Differential effects of vigabatrin, gamma-acetylenic GABA, aminooxyacetic acid, and valproate on levels of various amino acids in rat brain regions and plasma. Naunyn Schmiedebergs Arch Pharmacol. 1994;349:270–278. doi: 10.1007/BF00169293. [DOI] [PubMed] [Google Scholar]
- Löscher W, Hönack D, Bloms-Funke P. The novel antiepileptic drug levetiracetam (ucb L059) induces alterations in GABA metabolism and turnover in discrete areas of rat brain and reduces neuronal activity in substantia nigra pars reticulata. Brain Res. 1996;735:208–216. doi: 10.1016/0006-8993(96)00587-2. [DOI] [PubMed] [Google Scholar]
- Lukyanetz EA, Shkryl VM, Kostyuk PG. Selective blockade of N-type calcium channels by levetiracetam. Epilepsia. 2002;43:9–18. doi: 10.1046/j.1528-1157.2002.24501.x. [DOI] [PubMed] [Google Scholar]
- Lynch BA, Lambeng N, Nocka K, Kensel-Hammes P, Bajjalieh SM, Matagne A, Fuks B. The synaptic vesicle protein SV2A is the binding site for the antiepileptic drug levetiracetam. Proc Natl Acad Sci USA. 2004;101:9861–9866. doi: 10.1073/pnas.0308208101. [DOI] [PMC free article] [PubMed] [Google Scholar]
- Niespodziany I, Klitgaard H, Margineanu DG. Is the persistent sodium current a specific target of anti-absence drugs? Neuroreport. 2004;15:1049–1052. doi: 10.1097/00001756-200404290-00023. [DOI] [PubMed] [Google Scholar]
- Noebels JL, Rutecki PA. Altered hippocampal network excitability in the hypernoradrenergic mutant mouse tottering. Brain Res. 1990;524:225–230. doi: 10.1016/0006-8993(90)90695-8. [DOI] [PubMed] [Google Scholar]
- Potschka H, Baltes S, Löscher W. Inhibition of multidrug transporters by verapamil or probenecid does not alter blood-brain barrier penetration of levetiracetam in rats. Epilepsy Res. 2004;58:85–91. doi: 10.1016/j.eplepsyres.2003.12.007. [DOI] [PubMed] [Google Scholar]
- Prasad A, Kuzniecky RI, Knowlton RC, Welty TE, Martin RC, Mendez M, Faught RE. Evolving antiepileptic drug treatment in juvenile myoclonic epilepsy. Arch Neurol. 2003;60:1100–1105. doi: 10.1001/archneur.60.8.1100. [DOI] [PubMed] [Google Scholar]
- Racine R, Coscina DV. Effects of midbrain raphe lesions or systemic p-chlorophenylalanine on the development of kindled seizures in rats. Brain Res Bull. 1979;4:1–7. doi: 10.1016/0361-9230(79)90050-9. [DOI] [PubMed] [Google Scholar]
- Raisinghani M, Faingold CL. Pontine reticular formation neurons are implicated in the neuronal network for generalized clonic seizures which is intensified by audiogenic kindling. Brain Res. 2005;1064:90–97. doi: 10.1016/j.brainres.2005.09.047. [DOI] [PubMed] [Google Scholar]
- Ratnaraj N, Doheny HC, Patsalos PN. A micromethod for the determination of the new antiepileptic drug levetiracetam (ucb LO59) in serum or plasma by high performance liquid chromatography. Ther Drug Monit. 1996;18:154–157. doi: 10.1097/00007691-199604000-00008. [DOI] [PubMed] [Google Scholar]
- Rigo JM, Hans G, Nguyen L, Rocher V, Belachew S, Malgrange B, Leprince P, Moonen G, Selak I, Matagne A, Klitgaard H. The anti-epileptic drug levetiracetam reverses the inhibition by negative allosteric modulators of neuronal GABA- and glycine-gated currents. Br J Pharmacol. 2002;136:659–672. doi: 10.1038/sj.bjp.0704766. [DOI] [PMC free article] [PubMed] [Google Scholar]
- Seegers U, Potschka H, Löscher W. Lack of effects of prolonged treatment with phenobarbital or phenytoin on the expression of P-glycoprotein in various rat brain regions. Eur J Pharmacol. 2002;451:149–155. doi: 10.1016/s0014-2999(02)02235-5. [DOI] [PubMed] [Google Scholar]
- Shannon HE, Love PL. Effects of antiepileptic drugs on learning as assessed by a repeated acquisition of response sequences task in rats. Epilepsy Behav. 2007;10:16–25. doi: 10.1016/j.yebeh.2006.11.004. [DOI] [PubMed] [Google Scholar]
- Tudur Smith C, Marson AG, Clough HE, Williamson PR. Carbamazepine versus phenytoin monotherapy for epilepsy. Cochrane Database Syst Rev. 2002:CD001911. doi: 10.1002/14651858.CD001911. [DOI] [PubMed] [Google Scholar]
- Tunnicliff G. Basis of the antiseizure action of phenytoin. Gen Pharmacol. 1996;27:1091–1097. doi: 10.1016/s0306-3623(96)00062-6. [DOI] [PubMed] [Google Scholar]
- Tusher VG, Tibshirani R, Chu G. Significance analysis of microarrays applied to the ionizing radiation response. Proc Natl Acad Sci USA. 2001;98:5116–5121. doi: 10.1073/pnas.091062498. [DOI] [PMC free article] [PubMed] [Google Scholar]
- van Vliet EA, van Schaik R, Edelbroek PM, Voskuyl RA, Redeker S, Aronica E, Wadman WJ, Gorter JA. Region-specific overexpression of P-glycoprotein at the blood-brain barrier affects brain uptake of phenytoin in epileptic rats. J Pharmacol Exp Ther. 2007;322:141–147. doi: 10.1124/jpet.107.121178. [DOI] [PubMed] [Google Scholar]
- van Vliet EA, van Schaik R, Edelbroek PM, Lopes da Silva FH, Wadman WJ, Gorter JA. Development of tolerance to levetiracetam in rats with chronic epilepsy. Epilepsia. 2008;49:1151–1159. doi: 10.1111/j.1528-1167.2007.01516.x. [DOI] [PubMed] [Google Scholar]
- Walling SG, Harley CW. Locus ceruleus activation initiates delayed synaptic potentiation of perforant path input to the dentate gyrus in awake rats: a novel betaadrenergic- and protein synthesis-dependent mammalian plasticity mechanism. J Neurosci. 2004;24:598–604. doi: 10.1523/JNEUROSCI.4426-03.2004. [DOI] [PMC free article] [PubMed] [Google Scholar]
- Westenbroek R, Hell JW, Warner C, Dubel SJ, Snutch TP, Catterall WA. Biochemical properties and subcellular distribution of an N-type calcium channel 1 subunit. Neuron. 1992;9(subunit):1099–1115. doi: 10.1016/0896-6273(92)90069-p. [DOI] [PubMed] [Google Scholar]
- Worley PF, Baraban JM. Site of anticonvulsant action on sodium channels: autoradiographic and electrophysiological studies in rat brain. Proc Natl Acad Sci USA. 1987;84:3051–3055. doi: 10.1073/pnas.84.9.3051. [DOI] [PMC free article] [PubMed] [Google Scholar]
- Zona C, Niespodziany I, Marchetti C, Klitgaard H, Bernardi G, Margineanu DG. Levetiracetam does not modulate neuronal voltage-gated Na+ and T-type Ca2+ currents. Seizure. 2001;10:279–286. doi: 10.1053/seiz.2000.0504. [DOI] [PubMed] [Google Scholar]
Associated Data
This section collects any data citations, data availability statements, or supplementary materials included in this article.
Supplementary Materials
Table S1. Changes in gene expression in pons/medulla after chronic levetiracetam treatment.
Table S2. Differentially expressed transcripts in hippocampus after chronic phenytoin.
Table S3. Differentially-expressed transcripts in frontal cortex after chronic phenytoin.