

Abstract
Uterine leiomyomas are prevalent estrogen-responsive clonal tumors, but the specific genetic alterations that contribute to their development have not been elucidated. To identify genes involved in the formation of leiomyomas, we used global expression profiling to compare clonal tumors with normal myometrium. Contrary to expectation, genes involved in estrogen action were not differentially expressed between leiomyoma and normal myometrium. Genes encoding extracellular-matrix proteins were prominently featured, suggesting their involvement in formation of a myofibroblast phenotype. Analysis of the extracellular matrix in the leiomyomas revealed a disordered collagen fibril orientation. Expression of the collagen-binding protein dermatopontin was found to be consistently decreased in leiomyoma by both reverse transcriptase-polymerase chain reaction (RT-PCR) and real-time RT-PCR (mean underexpression = 9.41-fold) regardless of leiomyoma size, leiomyoma location, patient race, and patient age. This expression pattern was observed in 11 subjects and a total of 23 leiomyoma: myometrium pairs. Decreased expression of dermatopontin was also associated with keloid formation, a fibrotic disease that shares epidemiologic similarities with leiomyoma. Immunohistochemical studies of leiomyomas and keloids demonstrated reduced levels of dermatopontin in both tissues. In addition, ultrastructural analysis revealed that the orientation of the collagen fibrils in the keloid tissues strongly resembled that in the leiomyomas. Reduction in dermatopontin was associated with an increase in transforming growth factor–β3 (TGFB3) mRNA levels in leiomyomas, whereas other genes involved in dermatopontin signaling were not differentially expressed. These findings suggest that leiomyoma development involves a myofibroblast cell phenotype characterized by dysregulation of genes encoding extracellular-matrix proteins. In particular, decreased expression of dermatopontin represents a molecular link between the leiomyoma and keloid phenotypes.
Introduction
The study of early neoplastic growth is often hampered by the difficulty in finding model systems that produce tumors of sufficient size for evaluation but do not exhibit metastatic potential. Leiomyomas are benign uterine tumors that when used as a model possess many advantages for the study of early neoplastic changes. These tumors are clonally derived (Nilbert and Heim, 1990), proliferate in a relatively uncontrolled fashion, and only rarely progress to leiomyosarcoma. Unfortunately, little is known about the genetic alterations that result in leiomyoma development.
A substantial body of evidence indicates that growth of leiomyomas is regulated in part by hormones, especially estrogen and progesterone (reviewed in Flake et al., 2003). There is ample evidence that leiomyomas are hormone dependent, but hormonal ablation does not eliminate these tumors, and they rapidly recur when reexposed to hormone (Friedman et al., 1992). These findings suggest that, whereas estrogen and progesterone may act as promoters of leiomyoma growth, they are not the sole agents responsible.
Although the specific genetic alterations that induce the development of “common,” or spontaneous, leiomyomas have not been elucidated, there is epidemiologic evidence that specific genetic alterations trigger leiomyoma formation. For example, there is an increased propensity for leiomyoma development in first-degree relatives of women who themselves have leiomyomas (Sato et al., 2002). In addition, leiomyoma development is a feature of Alport syndrome with leiomyomatosis, which is caused by deletion of COL4A5 and COL4A6 (Cochat et al., 1988). Leiomyomas are also observed in Reed Syndrome (Reed et al., 1973) and in hereditary leiomyomas and renal cell cancer (Kiuru et al., 2001; Launonen et al., 2001), genetic conditions that link leiomyoma development with phenotypic alterations associated with the specific syndrome. These conditions suggest that an alteration in gene expression may cause the leiomyoma phenotype.
To elucidate the genes responsible for leiomyoma development, we examined differential gene expression between leiomyomas and the surrounding normal myometrium by microarray analysis (Tsibris et al., 2002; Catherino et al., 2003). These initial studies (Tsibris et al., 2002), as well as others (Chegini et al., 2003; Skubitz and Skubitz, 2003; Wang et al., 2003), used relatively low density screening (6,000–12,000 genes), and as a result, much of the genetic framework that comprises the leiomyoma phenotype remained unstudied. In the present study, we report results of global expression profiling of up to 33,000 gene probes that make up the Affymetrix U133 platform. Given the known impact of hormones on leiomyoma growth, our expectation was that hormonally regulated genes might represent a major class of differentially expressed genes.
We observed differential expression of many genes involved in the production and regulation of the extracellular matrix but, contrary to expectations, found almost no differences in the expression of genes encoding hormone receptors or receptor cofactors. Our findings revealed that clonal expansion of leiomyoma cells consistently involved a myofibroblast cell phenotype characterized by disordered collagen fibril orientation and decreased expression of the protein dermatopontin. Furthermore, we found that decreased dermatopontin and a disordered collagen fibril structure were common to both leiomyomas and keloids, despite the fact that they arise from different progenitor tissues. Our results suggest that decreased expression of dermatopontin may be involved in the phenotypic similarities between leiomyomas and keloid tissues.
Materials and Methods
Tissue Procurement
After giving informed consent, 11 women underwent hysterectomy at the National Naval Medical Center in Bethesda, Maryland. The surgical indication was symptomatic leiomyomas. Investigational review board approval for tissue collection and analysis was obtained at both the National Institutes of Health and the National Naval Medical Center. Leiomyoma and myometrial tissue samples 3–10 mm3 in size were harvested. For some leiomyomas, this represented the entire specimen. From larger leiomyomas, tissue was taken at random from the center, middle, and peripheral locations.
Tissue destined for RNA isolation was minced and immediately placed in RNAlater (Ambion, Inc., Austin, TX). Samples were either processed immediately or were placed at 4 °C overnight and then stored at −70 °C. Tissues destined for light microscopy and immunohistochemistry were cut into 5-mm3 sections and stored in phosphate-buffered 10% formalin. Tissues intended for electron microscopy were cut into 1-mm3 pieces and fixed immediately in 3% glutaraldehyde and processed as described below.
The demographic information on the assessed subjects is presented in Table 1. Patient age ranged from 34 to 47 years, and many menstrual cycle patterns were represented. Menstrual stage was based on the first day of a patient's last menstrual period. Women with therapeutic interruption of menstrual cycles by continuous oral contraceptives are so designated (Table 1). Subjects who did not cycle regularly are designated as anovulatory. In each case, normal myometrial tissue was harvested as a control from an adjacent region of the uterus, but care was taken to avoid the leiomyoma pseudocapsule. The location and size of the fibroids evaluated (data not shown) are available from the authors upon request. Fibroid size ranged from 0.3 to 7.0 cm. The location was defined as subserosal, intramural, or submucosal and was assigned based on where the majority (>50%) of the fibroid resided (Bajekal and Li, 2000).
Table 1. Patient Characteristics.
| Patient | Age (yrs) | Race | Fibroid size (cm) | Location | Time of cycle |
|---|---|---|---|---|---|
| 1 | 34 | African-American | 6 × 7 × 4.5 | intramural | Not available |
| 2 | 43 | African-American | a) 3 × 3 × 3 | subserosal | Not available |
| b) 1 × 1 × 1 | subserosal | ||||
| c) 0.5 × 0.5 × 0.5 | subserosal | ||||
| d) 1 × 1 × 1 | intramural | ||||
| 3 | 45 | African-American | a) 2 × 1.5 × 1.5 | subserosal | Luteal |
| b) 1.2 × 0.9 × 0.5 | intramural | ||||
| 4 | 35 | Caucasian | a) 2 × 1.5 × 1.7 | submucosal | Follicular |
| b) 3 × 3.2 × 2.5 | intramural | ||||
| 5 | 47 | African-American | 4 × 3.5 | subserosal | Anovulatory |
| 6 | 39 | African-American | a) 7 × 7 | intramural | Periovulatory |
| b) 1 × 1 | subserosal | ||||
| c) 1 × 0.5 | intramural | ||||
| 7 | 37 | Caucasian | a) 5 × 4 | submucosal | Periovulatory |
| b) 2.5 × 2 | subserosal | ||||
| c) Not available | subserosal | ||||
| 8 | 36 | African-American | 6.5 × 7.5 | intramural | Luteal |
| 9 | 37 | African-American | a) 1.5 × 1 × 1.7 | intramural | Luteal |
| b) 1.5 × 1.5 × 1.7 | intramural | ||||
| 10 | 35 | African-American | 0.3 to 0.8 (6 total) | intramural | Continuous OCPs |
| 11 | 46 | African-American | a) 2 × 1.3 × 1.4 | submucosal | Follicular |
| b) 5.4 × 5.1 × 4 | intramural | ||||
| c) 3.8 × 3.5 × 2.8 | submucosal |
Cycle refers to phase of menstrual cycle. Leiomyoma location defined as previously described (Bajekal and Li, 2000).
Cadaveric liver specimens for immunohistochemistry from an African-American female patient were provided by the Cooperative Human Tissue Network (Cleveland, OH).
Fresh keloid and skin specimens were obtained from Dr. Janette Alexander (Rockville, MD). Tissues from African-American and Caucasian women were handled in the same manner as were the leiomyoma and myometrial samples.
RNA Isolation
RNA isolation was performed according to a standard protocol. Briefly, tissue (either fibroid or myometrial) was removed from the RNAlater (Ambion) solution and reminced. This tissue was then placed in 6 ml of TRIzol reagent (Invitrogen, Carlsbad, CA). Tissue homogenization was performed with a Tissue Tearor model 985-370 (Bio-spec Products, Inc., Bartlesville, OK). The tissue homogenate was left at room temperature for 5 min and then mixed with 1.2 ml of chloroform. This mixture was kept at room temperature for 15 min and then centrifuged at 8,500 rpm for 20 min. The aqueous layer was transferred and mixed with 3 ml of isopropanol. This mixture was left at room temperature for 10 min and then was centrifuged at 8,500 rpm for 20 min. The liquid was decanted, and the pellet dried and then washed with 10 ml of 75% ethanol and centrifuged at 8,500 rpm for 10 min. The liquid was decanted and the pellet resuspended in diethylpyrocarbonate (DEPC)-treated sterile water. RNA integrity and concentration were confirmed by agarose electrophoresis and A260/A280 ratio.
Microarray Analysis
Fifteen micrograms of total RNA from each leiomyoma and adjacent myometrium was provided to Neurologic, Inc. (Rockville, MD) for microarray analysis of the 33,000 genes on the U-133 Affymetrix gene chip. The total RNA was handled according to Affymetrix guidelines (Lipshutz et al., 1999). Double-stranded cDNA was synthesized by use of a Superscript Choice System (Invitrogen) containing oligo-dT primer (Genset, La Jolla, CA). After extraction and resuspension, the biotin-labeled cRNA was generated with a bioarray high-yield RNA transcript labeling kit (Enzo Diagnostics, Farmingdale, NY). Hybridization of purified, labeled cRNA was performed as described previously (Lipshutz et al., 1999) and then was stained with streptavidin-phycoerythrin (Molecular Probes, Eugene, OR). The hybridized chips were scanned with a Hewlett-Packard GeneArray Scanner (Palo Alto, CA). Data analysis was performed with GeneChip software (Expression Analysis, Inc., Durham, NC).
All microarray experiments were run simultaneously and at the same facility. Reference sites within each microarray chip were used for normalization between chips. These reference sites included 100 maintenance genes that were used for normalization before data analysis occurred. In addition, for the U133 gene chip set, the 33,000 sites were placed on two chips (Chip A and Chip B). These 100 maintenance genes were spotted on both chips so that normalization by the GeneChip Expression Analysis software was done prior to data analysis. Mills and Gordon (2001) have evaluated the statistical likelihood of twofold differences occurring by chance and determined that differences twofold or greater warrant further evaluation.
Reverse Transcriptase-PCR
Total RNA (either leiomyoma or myometrium) was first diluted to yield the following stock concentrations: 1 μg/μl, 100 ng/μl, 10 ng/μl, 1 ng/μl, 100 pg/μ1, and 10 pg/μl. Primers were designed using LASERGENE Navigator so as to amplify a 90- to 150-bp section close to the 3′ end of the translated region (within 500 bp). The primers were then generated on a 392 DNA/RNA Synthesizer (Applied Biosystems, Foster City, CA) and purified by high-performance liquid chromatography. These were added to the reaction mix at a 200 nM concentration. Superscript One-Step RT-PCR with Platinum Taq (Invitrogen, Carlsbad, CA) was used, as well as a Gene Amp PCR System 9700 (Applied Biosystems, Foster City, CA) for thermal cycling. Reverse transcription was performed at 50°C for 30 min, followed by 94°C for 2 min. The samples then underwent 40 cycles at the following temperatures: 94°C for 15 sec, 50–65°C (depending on optimal annealing temperatures for the designed primers) for 30 sec, and 72°C for 3 min. Primers for GAPDH were included as an internal control. After completion of cycling, samples were stored at 4°C. Leiomyomas and myometrial samples were then electrophoresed side by side at the same starting concentration on a 2% agarose gel stained with ethidium bromide.
Decorin splice variants A, B, and C were represented on the array, but primers used for the RT-PCR experiments for decorin were restricted to exon 6, the exon common to all decorin transcripts; thus, RT-PCR results for decorin may reflect all decorin transcripts.
Real-Time PCR
Total RNA (either from leiomyoma or myometrium) was diluted, and primers were designed and constructed as described above. The dermatopontin probe was designed with Primer Express software, version 1.5, and constructed by Applied Biosystems (Foster City, CA). Primers were added at a 300 nM concentration. Thermal cycling occurred as described above using an ABI Prism 7700 sequence detector (Applied Biosystems). An 18S RNA control was used for normalization. Each experiment was performed in triplicate. Data analysis was performed with Sequence Detector, version 1.7 (Applied Biosystems).
Microscopy and Immunohistochemistry
For light microscopy, the tissue was deparaffined and hydrated in graded ethanol and xylene solutions, followed by distilled water. Slides were placed in Bouin's solution for 1 h at 56 °C, cooled, and washed in running water until clear. Slides were then placed in Weigert's iron hematoxylin solution for 10 min followed by a 10-min wash in running water. The slides were placed in Biebrich scarlet-acid fuchsin solution for 4 min, rinsed, and placed in phosphomolybdic-phosphotungstic acid solution for 5 min, followed by glacial acetic acid for 5 min. Finally, the slides were dehydrated and mounted with Hypermount (Shandon, Pittsburgh, PA).
For polarized-light microscopy, deparaffinized slides were hydrated with deionized water and then washed for 10 min in tap water, followed by three changes of distilled water. Slides were then stained in picrosirius red solution for 30 min, dehydrated in three changes of absolute ethyl alcohol, followed by three changes of xylene, and mounted with Hypermount (Shandon). A Leica microscope (Leica, Northvale, NJ) with polarized light oriented in a west-to-east direction was used for observation of the slides (Yu et al., 1995).
For electron microscopy, tissues were fixed in 3% glutaraldehyde and postfixed in 1% osmium tetraoxide, followed by dehydration in an ethanol and propylene oxide gradient. The tissues were then embedded in epoxy resin (Epox 812, Electron Microscopy Sciences, Fort Washington, PA). Thin sections were cut on an ultramicrotome and then placed on 200-mesh grids. The tissues were stained with lead citrate and uranyl acetate and examined with a Philip CM10 transmission electron microscope (Eindhoven, The Netherlands).
For immunohistochemistry, tissue samples stored in 10% formalin were placed in paraffin and sectioned onto slides. Slides were then deparaffinized and hydrated as described above. The slides were then treated with methanol/3% hydrogen peroxide solution to block endogenous peroxidase and treated with chondroitin ABC lyase (0.15 U/ml) as described previously (Bianco et al., 1990). Blocking was done with normal goat serum. Slides were then treated with primary antisera directed against amino acids 11–24 and 5–17 in decorin (1:1000 dilution) as described and characterized previously (Bianco et al., 1990). Antiserum directed against dermatopontin, also known as TRAMP, was used at a 1:800 dilution and was the generous gift of Dr. D. Hulmes. Purification of antisera directed against TRAMP was described previously (Forbes et al., 1994). Secondary biotinylated antibody was used at 1:100 dilution, followed by avidin-linked peroxidase and DAB solution. Finally, slides were dehydrated and mounted with Hyper-mount (Frankfurt, Germany). No staining was observed on control slides of tissues that were exposed to peroxidase substrate without antibody treatment or on slides that were not exposed to either the primary or secondary antibodies for dermatopontin (TRAMP) or decorin (data not shown).
Statistical Analyses
Given the enormous number of genes assayed by the U133 Genechip array (33,000 genes), it is useful to report the method we used to minimize the likelihood of a type I error. Using standard statistical methods, with the assumption that α = 0.05, approximately 1,650 genes would be expected to be differentially expressed purely by chance. However, the Affymetrix system divides each RNA sequence into 11–16 separate pieces and identifies a 25-bp sequence within each piece that is unique. This method results in an internal control of 11–16 replicates of the same mRNA specimen. As a result, the likelihood that a specific identified gene would be identified by chance is less than 1 in 33,000 after four separate sections of the same gene are tested. By studying multiple patients in order to identify genes consistently differentially expressed among samples from different patients the risk of statistical error was reduced further. Finally, a background pixel intensity cutoff level of 250 pixel intensity units was selected to avoid spurious findings resulting from poor hybridization. This strategy was expected to identify genes more likely to be involved in leiomyoma development, rather than genes that may have been specific to one patient. Our combined microarray experience involved four patients and five leiomyoma:myometrium pairs.
Unfortunately, microarray analysis cannot be assumed to provide an absolute assessment of differential gene expression between samples; it is critical to use more specific tests to confirm the results of microarray studies (Catherino et al., 2003). Realtime RT-PCR was used as a quantitative measure of gene expression. Differential expression was evaluated by paired Student's t tests. The data are presented with one-tailed 95% confidence intervals. The midlogarithmic point was used for comparison between leiomyoma and myometrium, and the magnitude of differences at these points was compared for generating the confidence intervals. Confidence intervals that did not cross unity (e.g., leiomyoma concentration = myometrium concentration) were considered statistically significant.
Results
Microarray analysis comparing 33,000 genes between leiomyoma and myometrium indicated no striking differences in the expression of genes encoding hormone receptors or nuclear receptor co-factors, whereas the magnitude of the differences between transcripts encoding multiple extracellular-matrix proteins was significant (Table 2). Using a twofold magnitude of difference as the cutoff for significance, there were 408 genes with increased expression and 424 genes with decreased expression (representing about 1.2% of the gene sequences tested). A twofold or greater difference in gene expression between leiomyoma and myometrium suggested differences large enough to warrant further investigation (Mills and Gordon, 2001). Microarray results demonstrated decreased expression of transcripts encoding dermatopontin, caldesmon, tight-junction protein-1, and vascular endothelial growth factor. Versican, P311, and TGFB3 transcripts showed increased expression in leiomyoma compared with that in myometrium. Overall, the expression pattern suggested that leiomyomas were composed of cells of a myofibroblast phenotype.
Table 2. Microarray Analysis of Leiomyoma versus Myometrium.
| Gene | Fold expression Leiomyoma : Myometrium |
|---|---|
| Hormone-related genes | |
| Estrogen receptor β | 0.71 (− 1.41) |
| CREBBP | 0.74 (− 1.35) |
| Estrogen receptor α | 0.75 (− 1.33) |
| Growth Hormone Receptor | 0.83 (− 1.21) |
| Progesterone Receptor | 0.98 (− 1.02) |
| Prolactin Receptor | 1.02 |
| SRC1 | 1.47 |
| P300-CBP | 1.52 |
| Extracellular-matrix-related genes | |
| Caldesmon | 0.19 (−5.21) |
| Dermatopontin | 0.23 (−4.26) |
| Tight Junction Protein-1 | 0.36 (−2.78) |
| Decorin, Variant C | 0.44 (−2.25) |
| Desmin | 0.78 (− 1.29) |
| Decorin, Variant A | 0.85 (−1.17) |
| Decorin, Variant B | 1.43 |
| P311 | 3.68 |
| Versican | 5.79 |
| Cell signaling-related genes | |
| Vascular endothelial growth factor | 0.26 (−3.92) |
| Transforming growth factor β1 | 0.71 (− 1.4) |
| Interleukin-4 Receptor | 0.92 (− 1.09) |
| Transforming growth factor β3 | 3.00 |
Data presented as leiomyoma expression / myometrium expression. Data in parentheses represent the more common presentation of microarray data, with a negative sign attached to the inverse of leiomyoma expression / myometrium expression.
Because the microarray data suggested abnormal levels of transcripts involved in production and formation of extracellular matrix, we examined leiomyomas using three microscopic techniques (Fig. 1). Light microscopy confirmed that the leiomyomas exhibited increased levels of collagen (Fig. 1A,B). Polarized-light microscopy revealed that the collagen fiber orientation in the leiomyomas differed from that in normal myometrium. In the leiomyomas viewed under polarized light, collagen appeared red in color, whereas the collagen of myometria stained yellow and green, indicating that the leiomyoma collagen fibril orientation was at a 90° angle to that of myometrial collagen fibrils (Fig. 1C,D). The most striking findings were observed with electron microscopy of the extracellular matrix, which revealed collagen fibrils of normal appearance, yet in the leiomyomas, collagen fibers were disorganized rather than in the compact bundles observed in myometria (Fig. 1E,F).
Figure 1.
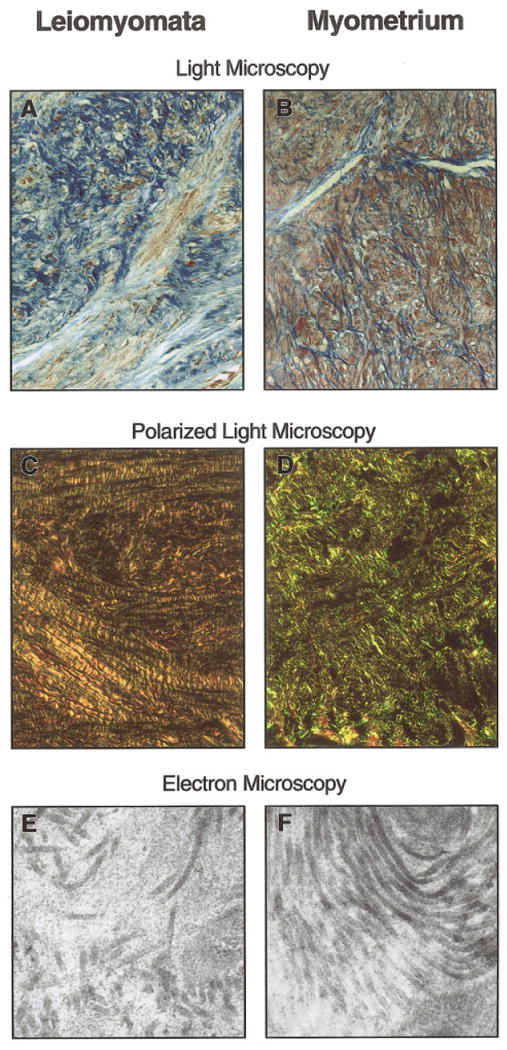
(A) Representative sample of leiomyoma tissue at 40× magnification predominantly showed collagen, which is stained blue, with only scant muscle tissue, which is stained red (Weigert's iron hematoxylin counterstained with Biebrich scarlet-acid fuchsin). (B) Representative sample of myometrium, adjacent to normal myometrium at 40× magnification, shows scant collagen between muscle fibers, stained red (Weigert's iron hematoxylin counterstained with Biebrich scarlet-acid fuschin). (C) Polarized-light microscopy at 20× magnification of representative sample. Leiomyoma tissue was observed as red, indicating that the collagen fibers were perpendicular to the plane of light. (D) Polarized-light microscopy at 20× magnification of representative sample. Myometrium collagen fibers appeared green and yellow. They were oriented parallel to the plane of polarized light, indicating that the leiomyoma collagen was oriented 90° from the collagen of the myometrial tissue. (E) Electron microscopy at 41,000× magnification of representative sample of the extracellular matrix of leiomyoma tissue, which revealed widely dispersed, disassociated collagen. Some fibrils appeared shorter than others. (F) Electron micrograph at 41,000× magnification of a representative sample of the collagen in the myometrium, which revealed packed, well-aligned collagen in a parallel configuration, consistent with polarized-light microscopy.
Among the extracellular-matrix genes, we focused on dermatopontin for three reasons: (1) dermatopontin is known to coat collagen fibrils; (2) hypertrophic scars composed of disordered collagen have demonstrated underexpression of dermatopontin mRNA (Kuroda et al., 1999); and (3) reduction in dermatopontin has been a common observation reported in microarray studies (Catherino et al., in press). If decreased expression of dermatopontin represented a key genetic alteration in the leiomyoma phenotype, we would expect to observe decreased expression in all leiomyomas. Reverse transcriptase–PCR experiments revealed that the expression of dermatopontin in leiomyoma was decreased compared to that in normal myometrium (Fig. 2), which was a consistent finding, observed in 21 of 23 leiomyoma:myometrium pairs tested (data not shown). There was no evidence of increased dermatopontin expression in any sample. In two samples, it was unclear whether there was a difference in leiomyoma and myometrium expression.
Figure 2.
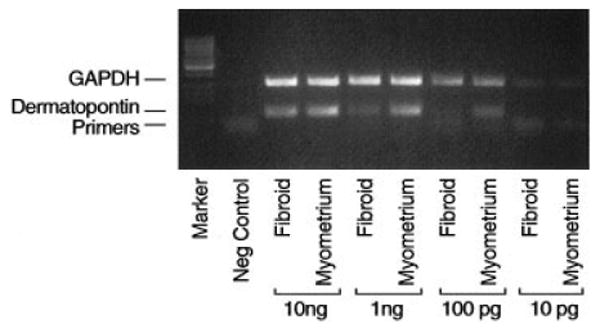
Representative gel of reverse transcriptase–PCR products for dermatopontin. Paired leiomyoma (fibroid) and myometrium RNA samples were as depicted. The negative control contained primers but lacked an RNA template. GAPDH was used as an internal control to confirm equal loading of lanes (leiomyoma/myometrium pairs are arranged in 10-fold dilutions; lane markers are at the far left of the gel).
To assess the two indeterminate samples, as well as to quantify the relative reduction in dermatopontin mRNA transcripts, we performed realtime PCR with all 23 leiomyoma:myometrium pairs. A representative experiment is illustrated in Figure 3. Each experiment was performed in triplicate. Table 3 presents the dermatopontin analysis for all sample pairs. As shown, the mean reduction was 9.41-fold (the median reduction was 7.05-fold). The findings were consistently observed among women regardless of differences in age, race, menstrual cycle day, or size or location of leiomyomas. Collectively, qualitative and quantitative assays (Figs. 2–3 and Table 3) confirmed that dermatopontin mRNA was consistently reduced in leiomyoma tissue relative to normal myometrium in all samples.
Figure 3.
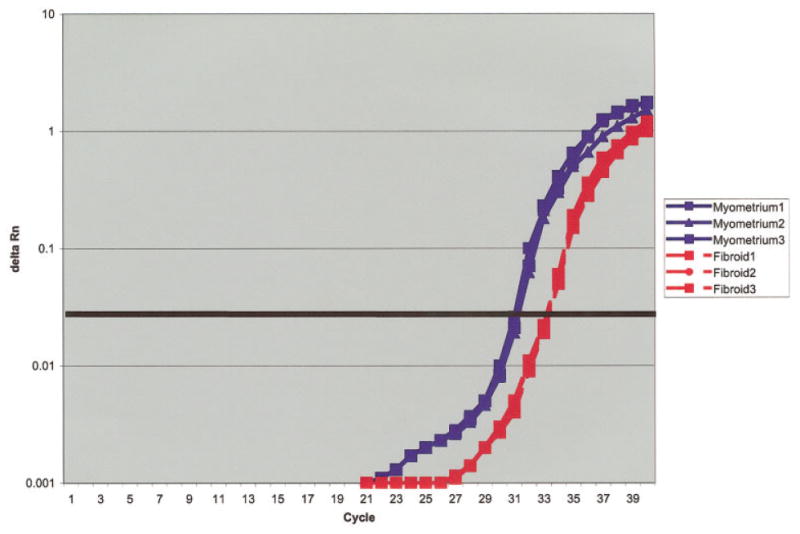
Representative real-time RT-PCR experiment comparing dermatopontin expression in leiomyoma tissue with that in myometrial tissue. Each experiment was done in triplicate, with 100 ng of total RNA per sample [dashed red line: leiomyoma RNA (labeled fibroid 1, fibroid 2, and fibroid 3); solid blue line: myometrium RNA (labeled myometrium 1, myometrium 2, and myometrium 3); X axis: cycle of amplification;, Y axis: luminescence (Delta Rn); heavy black horizontal line: midexponential point of the reaction].
TABLE 3. Real-time RT-PCR for Dermatopontin.
| Patient | Fold difference (F:M) | 95% CI |
|---|---|---|
| 1 | 0.43 (−2.33) | [0.24,0.50] |
| 2a | 0.14 (−6.92) | [0.09,0.46] |
| b | 0.15 (−6.71) | [0.10,0.32] |
| c | 0.94 (− 1.06) | [0.24,2.10]* |
| d | 0.09 (−11.14) | [0.06,0.15] |
| 3a | 0.13 (−7.97) | [0.06,0.97] |
| b | 0.03 (−28.6) | [0.03,0.05] |
| 4a | 0.37 (−2.72) | [0.32,0.42] |
| b | 0.30 (−3.38) | [0.17,0.70] |
| 5 | 0.04 (−24.90) | [0.04,0.05] |
| 6a | 0.14 (−7.04) | [0.09,0.36] |
| b | 0.21 (−4.67) | [0.16,0.27] |
| c | 0.08 (− 11.94) | [0.06,0.14] |
| 7a | 0.09 (− 11.30) | [0.07,0.12] |
| b | 0.14 (−7.05) | [0.12,0.17] |
| c | 0.15 (−6.78) | [0.09,0.34] |
| 8 | 0.10 (−9.53) | [0.07,0.18] |
| 9a | 0.68 (− 1.48) | [0.19,2.43]* |
| b | 0.17 (−5.74) | [0.10,0.76] |
| 10 | 0.05 (− 18.74) | [0.04,0.08] |
| 11a | 0.09 (− 11.54) | [0.05,0.28] |
| b | 0.07 (− 14.42) | [0.06,0.09] |
| c | 0.10 (− 10.41) | [0.06,0.21] |
| Mean | 0.11 (−9.41) | [0.09,0.13] |
Indicates leiomyoma : myometrium pairs that did not reach statistical significance.
Because the microarray, RT-PCR, and real-time RT-PCR data demonstrated reduced expression of dermatopontin transcripts in leiomyomas compared with that in myometrium, we tested for differences in protein expression. Immunohistochemical studies of dermatopontin (Fig. 4, Part 1) demonstrated decreased presence of dermatopontin protein in leiomyoma tissue compared to myometrium. Liver samples served as a negative control. By contrast, staining for the dermatopontin-binding protein decorin showed that the level of this protein did not differ appreciably between leiomyomas and myometria (Fig. 4, Part 2).
Figure 4.
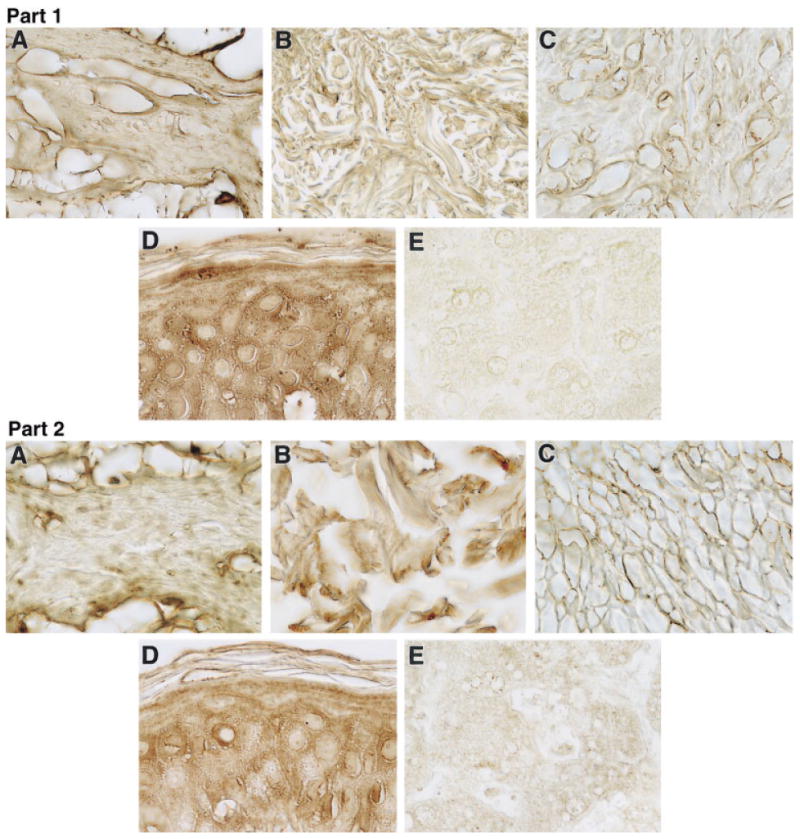
Part I—Representative immunohistochemistry of (A) myometrium, (B) keloid, (C) leiomyoma, (D) skin, and (E) liver with dermatopontin antibody. Samples (A) and (C) are from patient 11, samples (B) and (D) are from an African-American patient who underwent surgical extirpation of keloid tissue, and sample (E) is from cadaver tissue. Skin represents a positive control, whereas liver is a negative control. Staining of extracellular matrix was greater in the myometrium than in the leiomyoma samples. Staining of skin was greater than that of keloid (100× magnification for all samples). Results are representative of five subjects examined by immunohistochemistry. Part II—Representative immunohistochemistry of (A) myometrium, (B) keloid, (C) leiomyoma, (D) skin, and (E) liver with decorin antibody. Specimens originated from the same patients as in part I, above. Skin is shown as a positive control and liver a negative control. Staining of extracellular matrix was similar in the myometrium and the leiomyoma samples (100× magnification of representative samples).
Given the parallel between leiomyoma and hypertrophic scar in reduction in dermatopontin mRNA and the increased prevalence of both leiomyomas and keloids in patients of African descent (Allan and Keen, 1954; Cosman et al., 1961; Oluwasanmi, 1974), we suspected that molecular changes in keloid tissue might resemble those seen in leiomyomas. Prior studies have not specifically addressed the presence of dermatopontin in keloid tissue. Immunohistochemical analysis demonstrated reduced dermatopontin protein in keloid tissue compared with skin (Fig. 4). Decorin staining, by contrast, was comparable in skin and keloids. Because the expression of dermatopontin and decorin in the extracellular matrix of leiomyomas resembled that in keloids, we examined the extracellular matrix of keloids. Light and electron microscopy of the keloid matrix revealed a disordered collagen fibril orientation in keloids that was similar to that observed in leiomyomas (Fig. 5).
Figure 5.
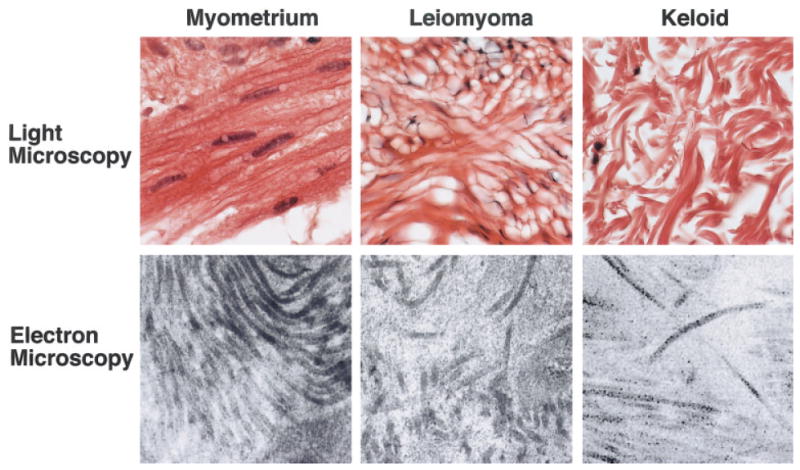
Representative light microscopy with hematoxylin/eosin staining (top row) and electron microscopy (bottom row) comparing myometrium, leiomyoma, and keloid. Myometrium and leiomyoma are from patient 11; keloid is from an African-American patient who underwent surgical extirpation of keloid tissue. Disordered collagen was present in leiomyoma and keloid matrix, whereas ordered collagen bundles were present in the extracellular matrix of the myometrium (light microscopy—63× magnification, electron microscopy— 41,000× magnification).
To explore the mechanism responsible for reduction of dermatopontin in leiomyomas, we tested genes reported to influence dermatopontin expression. For example, transforming growth factor–beta1 (TGFB1) increased dermatopontin mRNA levels in cultured skin fibroblasts, whereas IL4 decreased dermatopontin mRNA levels (Kuroda et al., 1999). In addition, interaction of der matopontin with decorin has been shown to influence TGFB1 action (Okamoto et al., 1999). Microarray data (Table 2) and confirmatory RT-PCR (Fig. 6) revealed that expression was no different between leiomyoma:myometrium pairs for transforming growth factor–β1 and IL4 mRNAs. Furthermore, there was no difference between detected transcripts for decorin in leiomyoma or myometrium.
Figure 6.
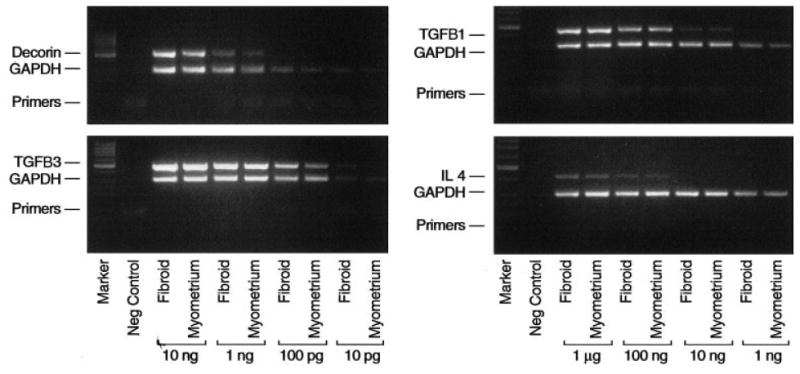
Representative gels of products from reverse transcriptase–PCR reactions for decorin, TGFB1, TGFB3, and interleukin-4. Paired leiomyoma (fibroid) and myometrium samples are as depicted. Leiomyoma–myometrium pairs are arranged in 10-fold dilutions of total RNA in each reaction. The negative control was a reaction containing primers but no RNA template. GAPDH was amplified as an internal control for assessment of amplification and similar amounts of RNA in samples. Lane markers are shown at the far left of the gel.
Because TGFB3 is the functional cytokine in gynecologic tissues (Das et al., 1992), we suspected that different TGF signaling pathways predominate in the uterus compared to the dermis. Providing support for this possibility, TGFB3 transcripts were found to be qualitatively increased in leiomyomas compared to myometria (Fig. 6). This observation was consistent in all leiomyoma:myometrium pairs tested (data not shown) and was consistent with prior reports of TGFB3 in leiomyomas (Arici and Sozen, 2000; Tsibris et al., 2002). Consistent with an increase in TGFB3, microarray analysis revealed a decrease in TJP-1 (Table 2) and TGFB RII (data not shown), two gene products that are negatively regulated by TGFB3. This observation suggests that in the uterus, TGFB3 rather than TGFB1 may contribute to dysregulated extracellular-matrix formation in leiomyomas.
Discussion
Our studies demonstrated that leiomyomas are neoplasms composed of cells with expression patterns notable for dysregulation of extracellular-matrix genes. Specifically, reduction in dermatopontin mRNA was a consistent characteristic of leiomyomas, as shown by microarray analysis, RT-PCR, and real-time RT-PCR. We also observed disorganization of extracellular-matrix formation characterized by disordered collagen fibers. Reduction in dermatopontin, or possibly the observed increase in other extracellular-matrix proteins such as versican (Table 2), could contribute to the structural abnormalities noted. When we compared leiomyoma and keloid dermatopontin protein expression, we observed that both tissues showed a decrease in dermatopontin protein. To our knowledge, this represents the first association between leiomyomas and keloid tissue.
Keloids are 3 times more prevalent in African-American women (Allan and Keen, 1954; Cosman et al., 1961; Oluwasanmi, 1974) than in Caucasian women, similar to the 3.3-fold greater prevalence of leiomyomas in African-American women (Marshall et al., 1997). Keloids are overgrown, disordered, and inflexible scars resulting from an overproduction of many extracellular-matrix proteins during healing. Although there had been no evaluation of dermatopontin expression in keloid tissue prior to our study, Kuroda and colleagues (1999) demonstrated decreased dermatopontin expression in hypertrophic scar tissue and suggested a role for dermatopontin in the pathogenesis of this type of scar formation.
Dermatopontin (also known as TRAMP) is a 22-kDa extracellular protein that binds small dermatan sulfate proteoglycans (Neame et al., 1989; Cronshaw et al., 1993; Superti-Furga et al., 1993). Dermatopontin promotes cell adhesion and cytoplasmic spreading of dermal fibroblasts and accelerates the assembly of collagen into fibrils (Lewandowski et al., 1991; Okamoto et al., 1996). Targeted disruption of dermatopontin in the mouse was associated with abnormal collagen structure (Takeda et al., 2002), although not in a manner exactly identical to that seen in keloids and leiomyomas (Fig. 5).
Dermatopontin binds to decorin (MacBeath et al., 1993), a small leucine-rich proteoglycan involved in collagen fibril formation (Vogel et al., 1984). Decorin functions as a tissue organizer by orienting and ordering collagen fibrils (Kokenyesi and Woessner, 1991; Iozzo, 1997), a phenomenon seen in wound healing (Beanes et al., 2001), tissue repair (Yamakawa et al., 2000), and tumor stroma formation (Harada et al., 1994). Furthermore, decorin is involved in normal tissue development and differentiation (Riquelme et al., 2001). Decorin activity also can regulate proteins associated with extracellular-matrix formation (Dudas et al., 2001; Costacurta et al., 2002). Dermatopontin competes with decorin for TGFB binding and also interacts with collagen directly (Kuroda et al., 1999; Okamoto et al., 1999). These findings suggest that altered dermatopontin expression could result in dysregulated decorin activity and abnormal extracellular-matrix formation.
It is possible that the decreased dermatopontin expression indirectly increases decorin function, thereby disrupting the orderly processing of collagen fibrils (Ichii et al., 2001). In addition, dermatopontin may interact with TGFB or integrins (Lewandowski et al., 1991; Superti-Furga et al., 1993), providing other mechanisms for altering the cellular phenotype. Finally, we cannot exclude the possibility that the disordered collagen structure itself might decrease dermatopontin expression (Kuroda et al., 1999). Based on our current understanding of these factors, it is possible that decreased dermatopontin expression contributes to abnormal collagen fiber formation and ultimately to the leiomyoma phenotype (Fig. 7).
Figure 7.
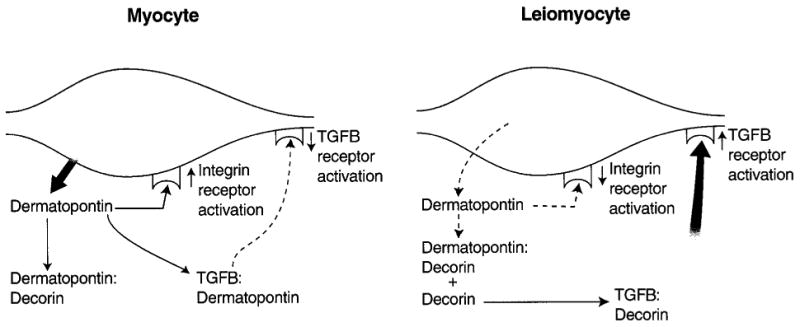
Possible model for the role of dermatopontin in leiomyogenesis. Dermatopontin in normal myometrium may act to coordinate and optimize collagen fibril formation by coating fibrils. Dermatopontin also may be involved with cellular communication either directly via the integrin receptor or indirectly through reducing the action of TGFB3. Thus, reduction in levels of dermatopontin could result in disordered growth by functionally up-regulating decorin activity, leading to an increase in TGF-β3 activity, or by altering cell–cell communication through integrin signaling.
Transforming growth factor–β3 overexpression may represent a link between dermatopontin and the leiomyoma phenotype. Transforming growth factors make up a family of extracellular cytokines that play roles in extracellular matrix formation, cell growth and differentiation, immunosuppression, and inflammation (Roberts and Sporn, 1993). TGFB activity was also identified in hamartomatous syndromes (Carethers, 2002), and leiomyomas may represent a uterine manifestation of this phenomenon. Studies of hypertrophic scar fibroblasts demonstrated a correlation between TGFB1 and dermatopontin (Kuroda et al., 1999). We did not find this association in leiomyoma. TGFB1 and TGFB3 show significant homology, and may represent complementary growth factors in scar formation. While evaluating scar development in fetal rat fibroblasts and skin, Hsu and colleagues (2001) found that, when TGFB1 levels were constant while TGFB3 levels rose, there was decreased scarring after skin trauma. These results suggest that TGFB3 plays a compensatory role in the setting of acute fibrosis rather than a causative one. Alternatively, TGFB1 and TGFB3 may play different roles in gynecologic tissues compared to dermis.
Leiomyomas have been studied for decades as hormone-responsive uterine tumors with characteristic chromosomal and genetic features (reviewed in Ligon and Morton, 2000). Leiomyoma growth is stimulated by estradiol and progesterone, and tumor growth can be reversed by gonadotropin releasing hormone agonists that inhibit estradiol and progesterone production. Given this finding, investigators assumed that hormonal dysregulation represented the key disturbance resulting in the leiomyoma phenotype. Our results suggest that there is no differential gene expression between leiomyomas and normal uterine tissue based on a comparison of genes expected to be altered in a hormone-driven neoplasm.
The impact of estradiol and progesterone on the growth of mature leiomyomas is well defined; however, our results suggest that the key features that define the leiomyoma phenotype are not directly related to hormone action. It is possible that reduction in estrogen results in altered expression of a subset of hormone-responsive genes, in turn resulting in a modest reduction in leiomyoma size but not in normalization of the extracellular matrix of the leiomyoma either in amount or characteristics. In fact, leiomyomas rapidly return to pretreatment sizes when hormone exposure resumes (Friedman et al., 1992). This observation is consistent with the persistence of altered extracellular matrix in leiomyomas and of the dysregulated cells secreting the abnormal matrix. We suggest that, whereas estradiol and progesterone may support and promote leiomyoma growth, the changes that result in the myofibroblast phenotype are related to fundamental alterations in the regulation of genes producing extracellular matrix.
Most intriguing were the striking similarities observed in the appearance of collagen in keloids and leiomyomas. This raises the possibility that a common molecular mechanism can explain the epidemiologic and molecular similarities between leiomyomas and keloids. As our present understanding of mechanisms leading to leiomyomas formation is limited, additional research is necessary for a full evaluation of this hypothesis. It is possible that research leading to a more thorough understanding of the molecular mechanism of leiomyoma development will provide unique strategies for controlling both leiomyoma and keloid diseases.
Acknowledgments
The authors acknowledge the expert input and assistance of Dr. John Tsibris, Department of Obstetrics and Gynecology, University of South Florida, and of Dr. John Wu, Department of Obstetrics and Gynecology, Uniformed Services University of the Health Sciences (USUHS). In addition, we appreciate the generous gifts of antibodies for dermatopontin (from Dr. David Hulmes) and for decorin (from Dr. Larry Fisher and Dr. Marian Young). We also thank Dr. Janette Alexander for her generous help in obtaining keloid tissue. We thank Mr. Thomas Baginski, of the BioImaging Center at USUHS, for his assistance with electron microscopy. Finally, we acknowledge the efforts of Ms. Cara Prupas, Ms. Chantal Mayers, and Ms. Melinda Sharkey for their support in leiomyoma- and myometrial-tissue procurement.
Supported by: National Institutes of Health; Grant number: HD-008737-02 PREB; National Institute of Child Health and Human Development.
References
- Allan JC, Keen P. The management of keloid in the South African Bantu. S Afr Med J. 1954;28:1034–1049. [PubMed] [Google Scholar]
- Arici A, Sozen I. Transforming growth factor-β3 is expressed at high levels in leiomyoma where it stimulates fibronectin expression and cell proliferation. Fertil Steril. 2000;73:1006–1011. doi: 10.1016/s0015-0282(00)00418-0. [DOI] [PubMed] [Google Scholar]
- Bajekal N, Li TC. Fibroids, infertility and pregnancy wastage. Hum Reprod Update. 2000;6:614–620. doi: 10.1093/humupd/6.6.614. [DOI] [PubMed] [Google Scholar]
- Beanes SR, Dang C, So C, Wang Y, Urata M, Ting K, Fonkalsrud EW, Benhaim P, Hedrick MH, Atkinson JB, Lorenz HP. Down-regulation of decorin, a transforming growth factor-beta modulator, is associated with scarless fetal wound healing. J Pediatr Surg. 2001;36:1666–1671. doi: 10.1053/jpsu.2001.27946. [DOI] [PubMed] [Google Scholar]
- Bianco P, Fisher LW, Young MF, Termine JD, Robey PG. Expression and localization of the two small proteoglycans biglycan and decorin in developing human skeletal and non-skeletal tissues. J Histochem Cytochem. 1990;38:1549–1563. doi: 10.1177/38.11.2212616. [DOI] [PubMed] [Google Scholar]
- Carethers JM. Hamartomatous polyposis syndromes: genetic pathways. Curr Opin Gastroenterol. 2002;18:60–67. doi: 10.1097/00001574-200201000-00011. [DOI] [PubMed] [Google Scholar]
- Catherino WH, Prupas C, Tsibris JCM, Leppert PC, Payson M, Nieman LK, Segars JH. Strategy for elucidating differentially expressed genes in leiomyoma identified by microarray technology. Fertil Steril. 2003;80:282–290. doi: 10.1016/s0015-0282(03)00953-1. [DOI] [PubMed] [Google Scholar]
- Catherino WH, Salama A, Potlog-Nahari C, Leppert P, Tsibris JCM, Segars JH. Gene expression studies in leiomyomas: New directions for research. Sem Reprod Endocrinol In press. 2004 doi: 10.1055/s-2004-828614. [DOI] [PubMed] [Google Scholar]
- Chegini N, Verala J, Luo X, Xu J, Williams RS. Gene expression profile of leiomyoma and myometrium and the effect of gonadotropin releasing hormone analogue therapy. J Soc Gynecol Investig. 2003;10:161–171. doi: 10.1016/s1071-5576(03)00004-2. [DOI] [PubMed] [Google Scholar]
- Cochat P, Guibaud P, Garcia Torres R, Roussel B, Guarner V, Larbre F. Diffuse leiomyomatosis in Alport syndrome. J Pediatr. 1988;113:339–343. doi: 10.1016/s0022-3476(88)80280-4. [DOI] [PubMed] [Google Scholar]
- Cosman B, Crickelair FG, Ju DMG, Gaulin JC, Lattes R. The surgical treatment of keloids. Plast Reconstr Surg. 1961;25:335–338. [Google Scholar]
- Costacurta A, Priante G, D'Angelo A, Chieco-Bianchi L, Cantaro S. Decorin transfection in human mesangial cells downregulates genes playing a role in the progression of fibrosis. J Clin Lab Anal. 2002;16:178–186. doi: 10.1002/jcla.10038. [DOI] [PMC free article] [PubMed] [Google Scholar]
- Cronshaw AD, MacBeath JR, Shackleton DR, Collins JF, Fothergill GL, Hulmes DJ. TRAMP (tyrosine rich acidic matrix protein), a protein that co-purifies with lysyl oxidase from porcine skin. Identification of TRAMP as the dermatan sulphate proteoglycan-associated 22K extracellular matrix protein. Matrix. 1993;13:255–266. doi: 10.1016/s0934-8832(11)80009-0. [DOI] [PubMed] [Google Scholar]
- Das SK, Flander KC, Andrews GK, Dey SK. Expression of transforming growth factor-β isoforms (β2 and β3) in the mouse uterus: analysis of the periimplantation period and effects of ovarian steroids. Endocrinology. 1992;130:3459–3466. doi: 10.1210/endo.130.6.1375903. [DOI] [PubMed] [Google Scholar]
- Dudas J, Kovalszky I, Gallai M, Nagy JO, Schaff Z, Knittel T, Mehde M, Neubauer K, Szalay F, Ramadori G. Expression of decorin, transforming growth factor-beta 1, tissue inhibitor metalloproteinase 1 and 2, and type IV collagenases in chronic hepatitis. Am J Clin Pathol. 2001;115:725–735. doi: 10.1309/J8CD-E9C8-X4NG-GTVG. [DOI] [PubMed] [Google Scholar]
- Flake GP, Andersen J, Dixon D. Etiology and pathogenesis of uterine leiomyomas: a review. Environ Health Perspect. 2003;111:1037–1054. doi: 10.1289/ehp.5787. [DOI] [PMC free article] [PubMed] [Google Scholar]
- Forbes EG, Cronshaw AD, MacBeath JRE, Hulmes DJS. Tyrosine-rich acidic matrix protein (TRAMP) is a tyrosine-sulphated and widely distributed protein of the extracellular matrix. FEBS Lett. 1994;351:433–436. doi: 10.1016/0014-5793(94)00907-4. [DOI] [PubMed] [Google Scholar]
- Friedman AJ, Daly M, Juneau-Norcross M, Fine C, Rein MS. Recurrence of myomas after myomectomy in women pretreated with leuprolide acetate depot or placebo. Fertil Steril. 1992;58:205–208. doi: 10.1016/s0015-0282(16)55164-4. [DOI] [PubMed] [Google Scholar]
- Harada T, Shinohara M, Nakamura S, Oka M. An immunohistochemical study of the extracellular matrix in oral squamous cell carcinoma and its association with invasive and metastatic potential. Virchows Arch. 1994;424:257–266. doi: 10.1007/BF00194609. [DOI] [PubMed] [Google Scholar]
- Hsu M, Peled ZM, Chin GS, Liu W, Longaker MT. Ontogeny of expression of transforming growth factor–β1 (TGF-β1), TGF-β3, and TGF-β receptors I and II in fetal rat fibroblasts and skin. Plastic Reconstruct Surg. 2001;107:1787–1794. doi: 10.1097/00006534-200106000-00023. [DOI] [PubMed] [Google Scholar]
- Ichii T, Koyama H, Tanaka S, Kim S, Shioi A, Okuno Y, Raines EW, Iwao H, Otani S, Nishizawa Y. Fibrillar collagen specifically regulates human vascular smooth muscle cell genes involved in cellular responses and pericellular matrix environment. Circ Res. 2001;88:460–467. doi: 10.1161/01.res.88.5.460. [DOI] [PubMed] [Google Scholar]
- Iozzo RV. The family of the small leucine-rich proteoglycans: key regulators of matrix assembly and cellular growth. Crit Rev Biochem Mol Biol. 1997;32:141–174. doi: 10.3109/10409239709108551. [DOI] [PubMed] [Google Scholar]
- Kiuru M, Launonen V, Hietala M, Aittomaki K, Vierimaa O, Salovaara R, Arola J, Pukkala E, Sistonen P, Herva R, Aaltonen LA. Familial cutaneous leiomyomatosis is a two-hit condition associated with renal cell cancer of characteristic histopathology. Am J Path. 2001;159:825–829. doi: 10.1016/S0002-9440(10)61757-9. [DOI] [PMC free article] [PubMed] [Google Scholar]
- Kokenyesi R, Woessner JF. Effects of hormonal perturbations on the small dermatan sulfate proteoglycan and mechanical properties of the uterine cervix of late pregnant rats. Connect Tissue Res. 1991;26:199–205. doi: 10.3109/03008209109152438. [DOI] [PubMed] [Google Scholar]
- Kuroda K, Okamoto O, Shinkai H. Dermatopontin expression is decreased in hypertrophic scar and system sclerosis skin fibroblasts and is regulated by transforming growth factor beta 1, interleukin-4, and matrix collagen. J Invest Dermatol. 1999;112:706–710. doi: 10.1046/j.1523-1747.1999.00563.x. [DOI] [PubMed] [Google Scholar]
- Launonen V, Vierimaa O, Kiuru M, Isola J, Roth S, Pukkala E, Sistonen P, Herva R, Aaltonen LA. Inherited susceptibility to uterine leiomyomas and renal cell cancer. Proc Nat Acad Sci USA. 2001;98:3387–3392. doi: 10.1073/pnas.051633798. [DOI] [PMC free article] [PubMed] [Google Scholar]
- Lewandowska K, Choi HU, Rosenberg LC, Sasse J, Neame PJ, Culp LA. Extracellular matrix adhesion-promoting activities of a dermatan sulfate proteoglycan-associated protein (22K) from bovine fetal skin. J Cell Sci. 1991;99:657–68. doi: 10.1242/jcs.99.3.657. [DOI] [PubMed] [Google Scholar]
- Ligon AH, Morton CC. Genetics of uterine leiomyomas. Genes Chromosomes Cancer. 2000;28:235–245. [PubMed] [Google Scholar]
- Lipshutz RJ, Fodor SP, Gingeras TR, Lockhart DJ. High density synthetic oligonucleotide arrays. Nat Genet. 1999;21:20–24. doi: 10.1038/4447. [DOI] [PubMed] [Google Scholar]
- MacBeath JR, Shackleton DR, Hulmes DJ. Tyrosine-rich acidic matrix protein (TRAMP) accelerates collagen fibril formation in vitro. J Biol Chem. 1993;268:19826–19832. [PubMed] [Google Scholar]
- Marshall LM, Spiegelman D, Barbieri RL, Goldman MB, Manson JE, Colditz GA, Willett WC, Hunter DJ. Variation in the incidence of uterine leiomyoma among premenopausal women by age and race. Obstet Gynecol. 1997;90:967–973. doi: 10.1016/s0029-7844(97)00534-6. [DOI] [PubMed] [Google Scholar]
- Mills JC, Gordon JI. A new approach for filtering noise from high-density oligonucleotide microarray datasets. Nucleic Acid Res. 2001;29:E72. doi: 10.1093/nar/29.15.e72. [DOI] [PMC free article] [PubMed] [Google Scholar]
- Neame PJ, Choi HU, Rosenberg LC. The isolation and primary structure of a 22 kDa extracellular matrix protein from bovine skin. J Biol Chem. 1989;264:5474–5479. [PubMed] [Google Scholar]
- Nilbert M, Heim S. Uterine leiomyoma cytogenetics. Genes Chromosomes Cancer. 1990;2:3–13. doi: 10.1002/gcc.2870020103. [DOI] [PubMed] [Google Scholar]
- Okamoto O, Suzuki Y, Kimura S, Shinkai H. Extracellular matrix 22-kDa protein interacts with decorin core protein and is expressed in cutaneous fibrosis. J Biochem. 1996;119:106–114. doi: 10.1093/oxfordjournals.jbchem.a021194. [DOI] [PubMed] [Google Scholar]
- Okamoto O, Fujiwara S, Abe M, Sato Y. Dermatopontin interacts with transforming growth factor beta and enhances its biological activity. Biochem J. 1999;337:537–541. [PMC free article] [PubMed] [Google Scholar]
- Oluwasanmi JO. Keloids in the African. Clin Plastic Surg. 1974;1:179–195. [PubMed] [Google Scholar]
- Reed WB, Walker R, Horowitz R. Cutaneous leiomyomas with uterine leiomyomas. Acta Derm Venereol. 1973;53:409–416. [PubMed] [Google Scholar]
- Riquelme C, Larrain J, Schonherr E, Henriquez JP, Kresse H, Brandan E. Antisense inhibition of decorin expression in myoblasts decreases cell responsiveness to transforming growth factor beta and accelerates skeletal muscle differentiation. J Biol Chem. 2001;276:3589–3596. doi: 10.1074/jbc.M004602200. [DOI] [PubMed] [Google Scholar]
- Roberts AB, Sporn MB. Physiological actions and clinical applications of transforming growth factor-beta (TGF-β) Growth Factors. 1993;8:1–9. doi: 10.3109/08977199309029129. [DOI] [PubMed] [Google Scholar]
- Sato F, Mori M, Nishi M, Kudo R, Miyake H. Familial aggregation of uterine myomas in Japanese women. J Epidemiol. 2002;12:249–253. doi: 10.2188/jea.12.249. [DOI] [PMC free article] [PubMed] [Google Scholar]
- Skubitz KM, Skubitz AP. Differential gene expression in leiomyoma. J Lab Clin Med. 2003;141:297–308. doi: 10.1016/S0022-2143(03)00007-6. [DOI] [PubMed] [Google Scholar]
- Superti-Furga A, Rocchi M, Schafer BW, Gitzelmann R. Complementary DNA sequence and chromosomal mapping of a human proteoglycan-binding cell-adhesion protein (dermatopontin) Genomics. 1993;17:463–467. doi: 10.1006/geno.1993.1348. [DOI] [PubMed] [Google Scholar]
- Takeda U, Utani A, Wu J, Adachi E, Koseki H, Taniguchi M, Matsumoto T, Ohashi T, Sato M, Shinkai H. Targeted disruption of dermatopontin causes abnormal collagen fibrillogenesis. J Invest Dermatol. 2002;119:678–683. doi: 10.1046/j.1523-1747.2002.01863.x. [DOI] [PubMed] [Google Scholar]
- Tsibris JCM, Segars JH, Coppola D, Mane S, Wilbanks GD, O'Brien WF, Spellacy WN. Insights from gene arrays on the development and growth regulation of uterine leiomyomas. Fertil Steril. 2002;78:114–121. doi: 10.1016/s0015-0282(02)03191-6. [DOI] [PMC free article] [PubMed] [Google Scholar]
- Vogel KG, Paulsson M, Heinegard D. Specific inhibition of type I and type II collagen fibrillogenesis by the small proteoglycan of tendon. Biochem J. 1984;223:587–597. doi: 10.1042/bj2230587. [DOI] [PMC free article] [PubMed] [Google Scholar]
- Wang H, Mahadevappa M, Yamamoto K, Wen Y, Chen B, Warrington JA, Lake Polan M. Distinctive proliferative phase differences in gene expression in human myometrium and leiomyomas. Fertil Steril. 2003;80:266–76. doi: 10.1016/s0015-0282(03)00730-1. [DOI] [PubMed] [Google Scholar]
- Yamakawa T, Bai HZ, Masuda J, Sawa Y, Shirakura R, Ogata J, Matsuda H. Differential expression of proteoglycans bigly-can and decorin during neointima formation after stent implantation in normal and atherosclerotic rabbit aortas. Atherosclerosis. 2000;152:287–297. doi: 10.1016/s0021-9150(99)00475-x. [DOI] [PubMed] [Google Scholar]
- Yu SY, Tozzi CA, Babiarz J, Leppert PC. Collagen changes in rat cervix in pregnancy-polarized light microscopic and electron microscopic studies. Proc Soc Exp Biol Med. 1995;209:360–368. doi: 10.3181/00379727-209-43908. [DOI] [PubMed] [Google Scholar]