

Abstract
Objective:
We sought to identify current US hospital practices for feeding tube placement in ischemic stroke.
Methods:
In a retrospective observational study, we examined the frequency of feeding tube placement among hospitals in the Nationwide Inpatient Sample with ≥30 adult ischemic stroke admissions annually with length of stay greater than 3 days. We examined trends from 2004 to 2011 and predictors using data from more recent years (2008–2011). We used multilevel multivariable regression models accounting for a hospital random effect, adjusted for patient-level and hospital-level factors to predict feeding tube placement.
Results:
Feeding tube insertion rates did not change from 2004 to 2011 (8.1 vs 8.4 per 100 admissions; p trend = 0.11). Among 1,540 hospitals with 164,408 stroke hospitalizations from 2008 to 2011, a feeding tube was placed 8.8% of the time (n = 14,480). Variation in the rate of feeding tube placement was high, from 0% to 26% between hospitals (interquartile range 4.8%–11.2%). In the subset with available race/ethnicity data (n = 88,385), after controlling for patient demographics, socioeconomics, and comorbidities, hospital factors associated with feeding tube placement included stroke volume (odds ratio [OR] 1.28 highest vs lowest quartile; 95% confidence interval [CI] 1.10–1.49), for-profit status (OR 1.13 vs nonprofit; 95% CI 1.01–1.25), and intubation use (OR 1.66 highest vs lowest quartile; 95% CI 1.47–1.87). In addition, hospitals with higher rates of black/Hispanic stroke admissions had increased risk of feeding tube placement (OR 1.28 highest vs lowest quartile; 95% CI 1.14–1.44).
Conclusions:
Variation in feeding tube insertion rates across hospitals is large. Differences across hospitals may be partly explained by external factors beyond the patient-centered decision to insert a feeding tube.
Stroke is the leading cause of serious long-term disability in the United States and ischemic events account for approximately 85% of all strokes.1 Dysphagia, or difficulty swallowing, is common after stroke, occurring in about one-quarter to half of all patients with acute stroke.2,3 Dysphagia may lead to aspiration pneumonia, malnutrition, impaired rehabilitation, prolonged stays, and increased mortality.4,5 About half of dysphagia in stroke patients improves within 2 weeks, and 15% of patients go on to have persistent dysphagia at 1 month. To date, limited data are available to predict dysphagia, and prediction of recovery has been unreliable.5,6 As a result, providers frequently employ time-limited trials of artificial nutrition, often by way of percutaneous gastrostomy.
Half of dysphagic stroke patients receiving artificial nutrition do not survive to 6 months and of those surviving, 65% have severe disability.7 Early nasogastric tube feeding in dysphagic stroke patients compared to avoiding artificial nutrition has no significant effect on death or disability, and may lead to increased rates of complications.8 In addition, early invasive methods of feeding, such as percutaneous gastrostomy, have been associated with increased risk of death and poor outcomes compared to nasogastric feeding.9 Therefore, the choice to place or decline a feeding tube following a stroke is a difficult and emotional decision that patients, family members, and health care professionals struggle with in the acute care setting.
A systematic method, aligned with patient-centered and family-centered care, may be needed across hospitals to assist with decision-making for feeding tube use. We sought to better understand recent trends and nationwide variations in practice among acute care hospitals, and to identify patient and hospital characteristics associated with feeding tube insertion in the US acute ischemic stroke population.
METHODS
Standard protocol approvals, registrations, and patient consents.
We designed a retrospective observational study of trends, hospital variation, and hospital characteristics associated with feeding tube placement in stroke patients among US acute care hospitals in the Nationwide Inpatient Sample (NIS) of the Agency for Healthcare Research and Quality (AHRQ).10 The Johns Hopkins Institutional Review Board approved the study.
Database.
The NIS is a cross-sectional, all-payer, inpatient care dataset in the United States, consolidated on an annual basis, containing information from more than 1,000 hospitals and approximately 8 million hospitalizations annually. The NIS represents a 20% stratified random sample of nonfederal US hospitals. Discharge data include demographics, socioeconomics, primary and secondary diagnoses, procedures, and length of stay.
Acute stroke selection.
We identified adult (age ≥18 years) acute ischemic stroke admissions from January 1, 2004, to December 31, 2011, using ICD-9 diagnosis codes 433.X1–occlusion and stenosis of cerebral artery with infarction, 434.X1–occlusion of cerebral artery with infarction, and 436–acute but ill-defined cerebrovascular disease.11–13 Observations with missing data for variables such as age, sex, and death were excluded. Elective admissions were excluded given that miscoding for acute stroke generally occurs for those with elective procedures (e.g., carotid endarterectomy).12 Over 99% of feeding tube placements among stroke patients took place in patients with hospital length of stay ≥4 days (figure e-1 on the Neurology® Web site at Neurology.org). Therefore, we selected hospitalizations with length of stay ≥4 days to include patients at greatest risk for feeding tube insertion. This selection may result in the exclusion of individuals with less severe stroke, fewer complications or comorbidities, expedited discharge, or early mortality.14 The frequency of feeding tube use was compared among hospitals with a minimum of 30 annual stroke admissions.15 This minimum admission volume ensures that 95% confidence intervals (CIs) were no wider than 10% for hospitals using feeding tubes at the mean rate (approximately 8%). Figure e-2 shows the sample selection method.
Feeding tube use.
Feeding tube insertion was defined as endoscopic or surgical insertion of a gastrostomy tube identified by AHRQ Clinical Classification Software code 71.
Hospital characteristics.
We identified individual hospitals within each year of the NIS. In addition to characteristics included in the dataset (e.g., teaching status), we calculated annual ischemic stroke volume, rate of intubation use, rate of hospice discharge, and proportion of black or Hispanic patients admitted among stroke hospitalizations. We categorized these variables into quartiles for analysis (table e-1). The proportion of black/Hispanic admissions was calculated for hospitals with complete data on race/ethnicity (935 hospitals; 61% of hospitals). We calculated quartiles for the rate of hospice discharge for stroke hospitalizations among 1,302 hospitals (85% of hospitals) with information on hospice disposition. Hospice discharge was excluded from the final model since it had substantial missingness and was not significant in regression analysis (table e-2).
Patient characteristics.
Demographic and socioeconomic factors were identified from the primary dataset. Race/ethnicity had a high degree of missing data compared to other variables due to state suppression or partial reporting by hospitals. Therefore, we conducted a sensitivity analysis without race variables (table e-3). We identified comorbidities using ICD-9 codes and accounted for 16 conditions within a modified Charlson Comorbidity Index tailored for stroke outcome studies.16 We identified individuals with cancer separately due to implications of end-of-life care in these patients. In addition, atrial fibrillation was identified due to its importance for risk of large cardioembolic stroke. IV tissue plasminogen activator use was not included in the model due to the lack of association with life-sustaining therapies in prior studies (e.g., feeding tubes).17
Statistical analysis.
Trends in feeding tube insertion rates were evaluated from 2004 to 2011 using the Cochran-Armitage test. The remainder of the analysis was conducted using data from 2008 to 2011, as for-profit/nonprofit hospital status was only available in these more recent years. Measures of variation in feeding tube insertion included range, interquartile range, coefficient of variation, intraclass correlation coefficient (ICC), proportional change in variance, and median odds ratio (MOR). The ICC is the ratio of between-hospital variance to total variance, which may have limited interpretation in a logistic model.17,18 We present the proportional change in variance as the percent change of between-hospital variance in comparison to a null model.19 The MOR is defined as the median of a set of odds ratios (ORs) that could be obtained when comparing 2 randomly chosen hospitals with different random effects. The MOR can be interpreted as the median increased risk by moving from a hospital with lower risk to a hospital with higher risk, assuming the same patient covariates.18–20 The ICC, proportional change in variance, and MOR are calculated from the multilevel multivariable regression models.21
We constructed 2 mixed-effects multilevel multivariable logistic regression models, adjusting for patient characteristics (model 1) and patient and hospital characteristics (model 2). The primary models were fitted on the subset of hospitals with complete data on race. Covariates were entered as fixed-effects variables with the hospital as a random effect in the multilevel models to assess the residual variation between hospitals. ORs and 95% CIs were calculated for univariate and multivariable analyses. Two-sided hypothesis testing was used with significance level set a priori at p < 0.05. The analysis was performed using Stata version 12.0 (StataCorp, College Station, TX) and MLwiN version 2.28 (University of Bristol, UK).
RESULTS
From 2004 to 2011, there were 332,907 total stroke admissions meeting the eligibility criteria across 3,270 hospitals. The average annual number of feeding tube insertions per hospital increased over the period examined (8.3 vs 9.9; p trend <0.01), although the average individual hospital rate per 100 stroke admissions did not substantially change (8.1 vs 8.4; p trend = 0.11) (table 1).
Table 1.
Trends in feeding tube insertion among US stroke admissions, 2004–2011

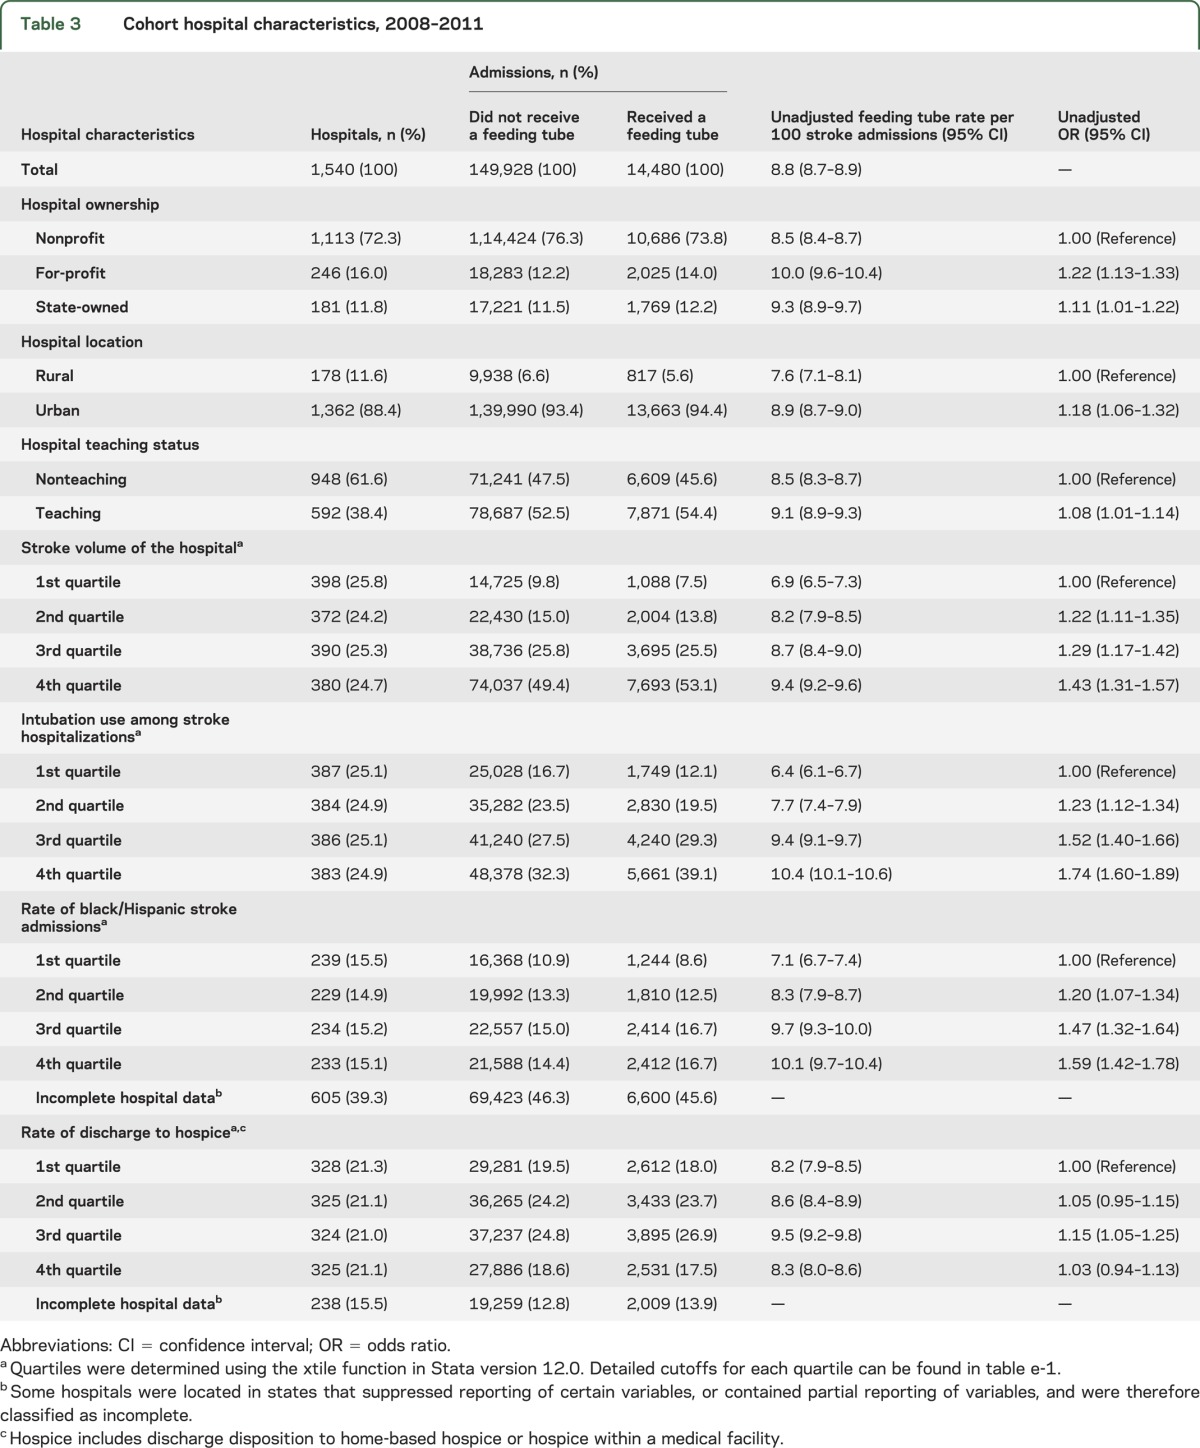
From 2008 to 2011, a total of 164,408 stroke admissions across 1,540 acute care hospitals were eligible for the analysis of variation. A description of patient and hospital characteristics in our study cohort can be found in tables 2 and 3, respectively. A feeding tube was inserted during 14,480 hospitalizations (8.8%). The frequency of feeding tube placement was greater in older patients, minorities, Medicare patients, and those with increased comorbidity. In addition, feeding tubes were used more frequently in for-profit hospitals, urban hospitals, teaching hospitals, and hospitals with the highest stroke volume, intubation use, and proportion of black/Hispanic admissions.
Table 2.
Cohort demographics, socioeconomics, and clinical characteristics, 2008–2011
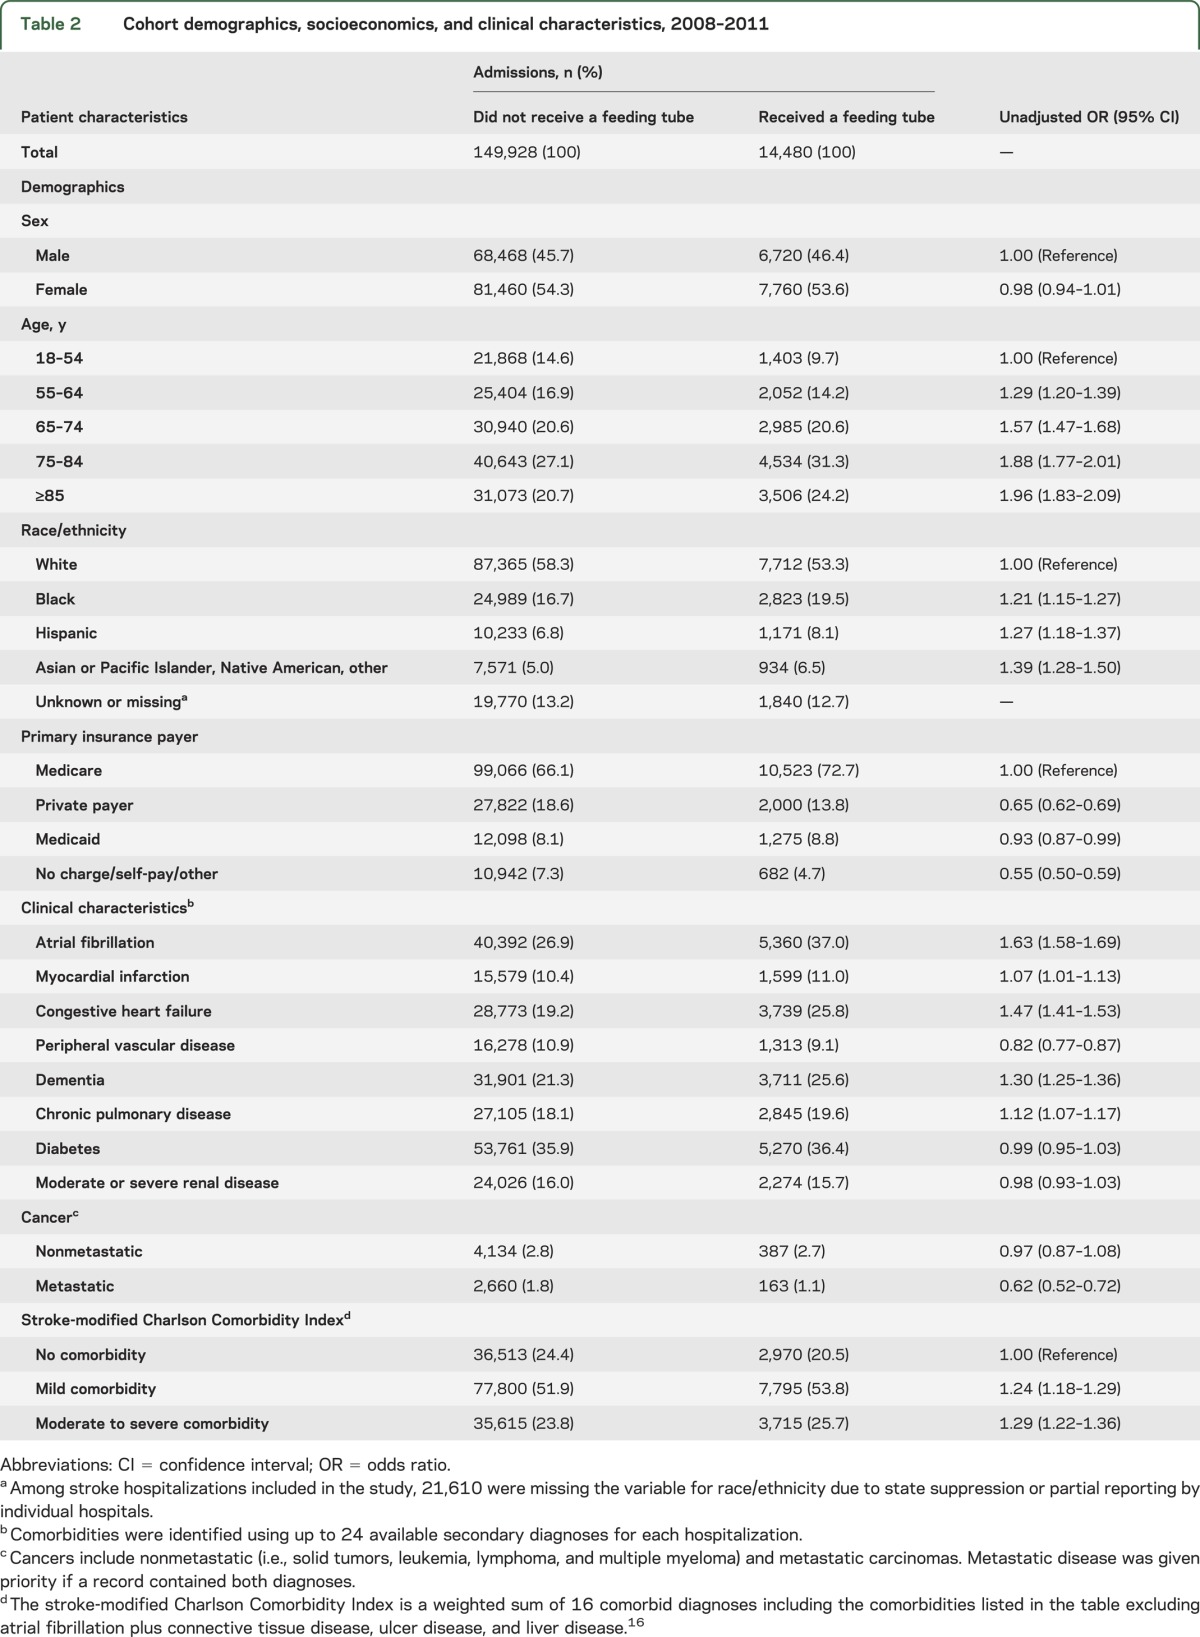
Table 3.
Cohort hospital characteristics, 2008–2011
The frequency distribution of feeding tube insertion among 1,540 hospitals with at least 30 ischemic stroke hospitalizations lasting greater than 3 days from 2008 to 2011 displayed in rank order from highest to lowest rate of use is shown in figure 1. Of the hospitals analyzed, 59 (3.8%) did not insert any feeding tubes and an additional 845 (54.9%) inserted fewer than the study mean. The range in insertion rates varied from 0% to 26.3%, with an interquartile range (IQR) of 4.8%–11.2%, and coefficient of variation of 0.58. After removing the highest and lowest 1% of hospitals (i.e., outliers) by feeding tube insertion rate (n = 81), the coefficient of variation was 0.51 (range 1.1%–21.7%; IQR 5.2%–11.3%). Rates of feeding tube placement within US region, state, and hospital referral region demonstrated consistently high variation with few exceptions (figure e-3).
Figure 1. Rank order of frequency of feeding tube placement in acute ischemic stroke hospitalizations, 2008–2011.

Hospitals include 1,540 hospitals with at least 30 acute ischemic stroke hospitalizations lasting greater than 3 days within each year of the nationwide inpatient sample, 2008–2011. In compliance with Healthcare Cost and Utilization Project guidelines, no individual hospital can be identified directly or by inference using these data.
The multilevel multivariable model (n = 88,385) examining factors associated with feeding tube placement among hospitals with complete reporting of race/ethnicity is shown in table 4. A model excluding race and the rate of black/Hispanic admissions conducted on a larger sample of hospitalizations demonstrated few differences in the effect size and significance of other variables (table e-3). Demographic factors associated with increased risk of feeding tube placement included older age and male sex. Black and Hispanic hospitalizations had a 1.34-fold and 1.39-fold increase in the odds of receiving a feeding tube vs white hospitalizations, respectively (adjusted OR [AOR] 1.34; 95% CI 1.25–1.43 for black vs white; AOR 1.39; 95% CI 1.27–1.53 for Hispanic vs white). In addition, Medicaid-insured hospitalizations had 1.2 times the odds compared to Medicare (AOR 1.20; 95% CI 1.08–1.33), while those with private pay were less likely to receive a feeding tube (AOR 0.90; 95% CI 0.83–0.98). Atrial fibrillation and elevated Charlson Comorbidity Index were independently associated with increased feeding tube insertion, and those with metastatic cancer had approximately 1.40-fold greater odds in feeding tube placement than those without cancer.
Table 4.
Multivariable model of patient and hospital characteristics associated with feeding tube insertion, 2008–2011 (n = 88,385)a
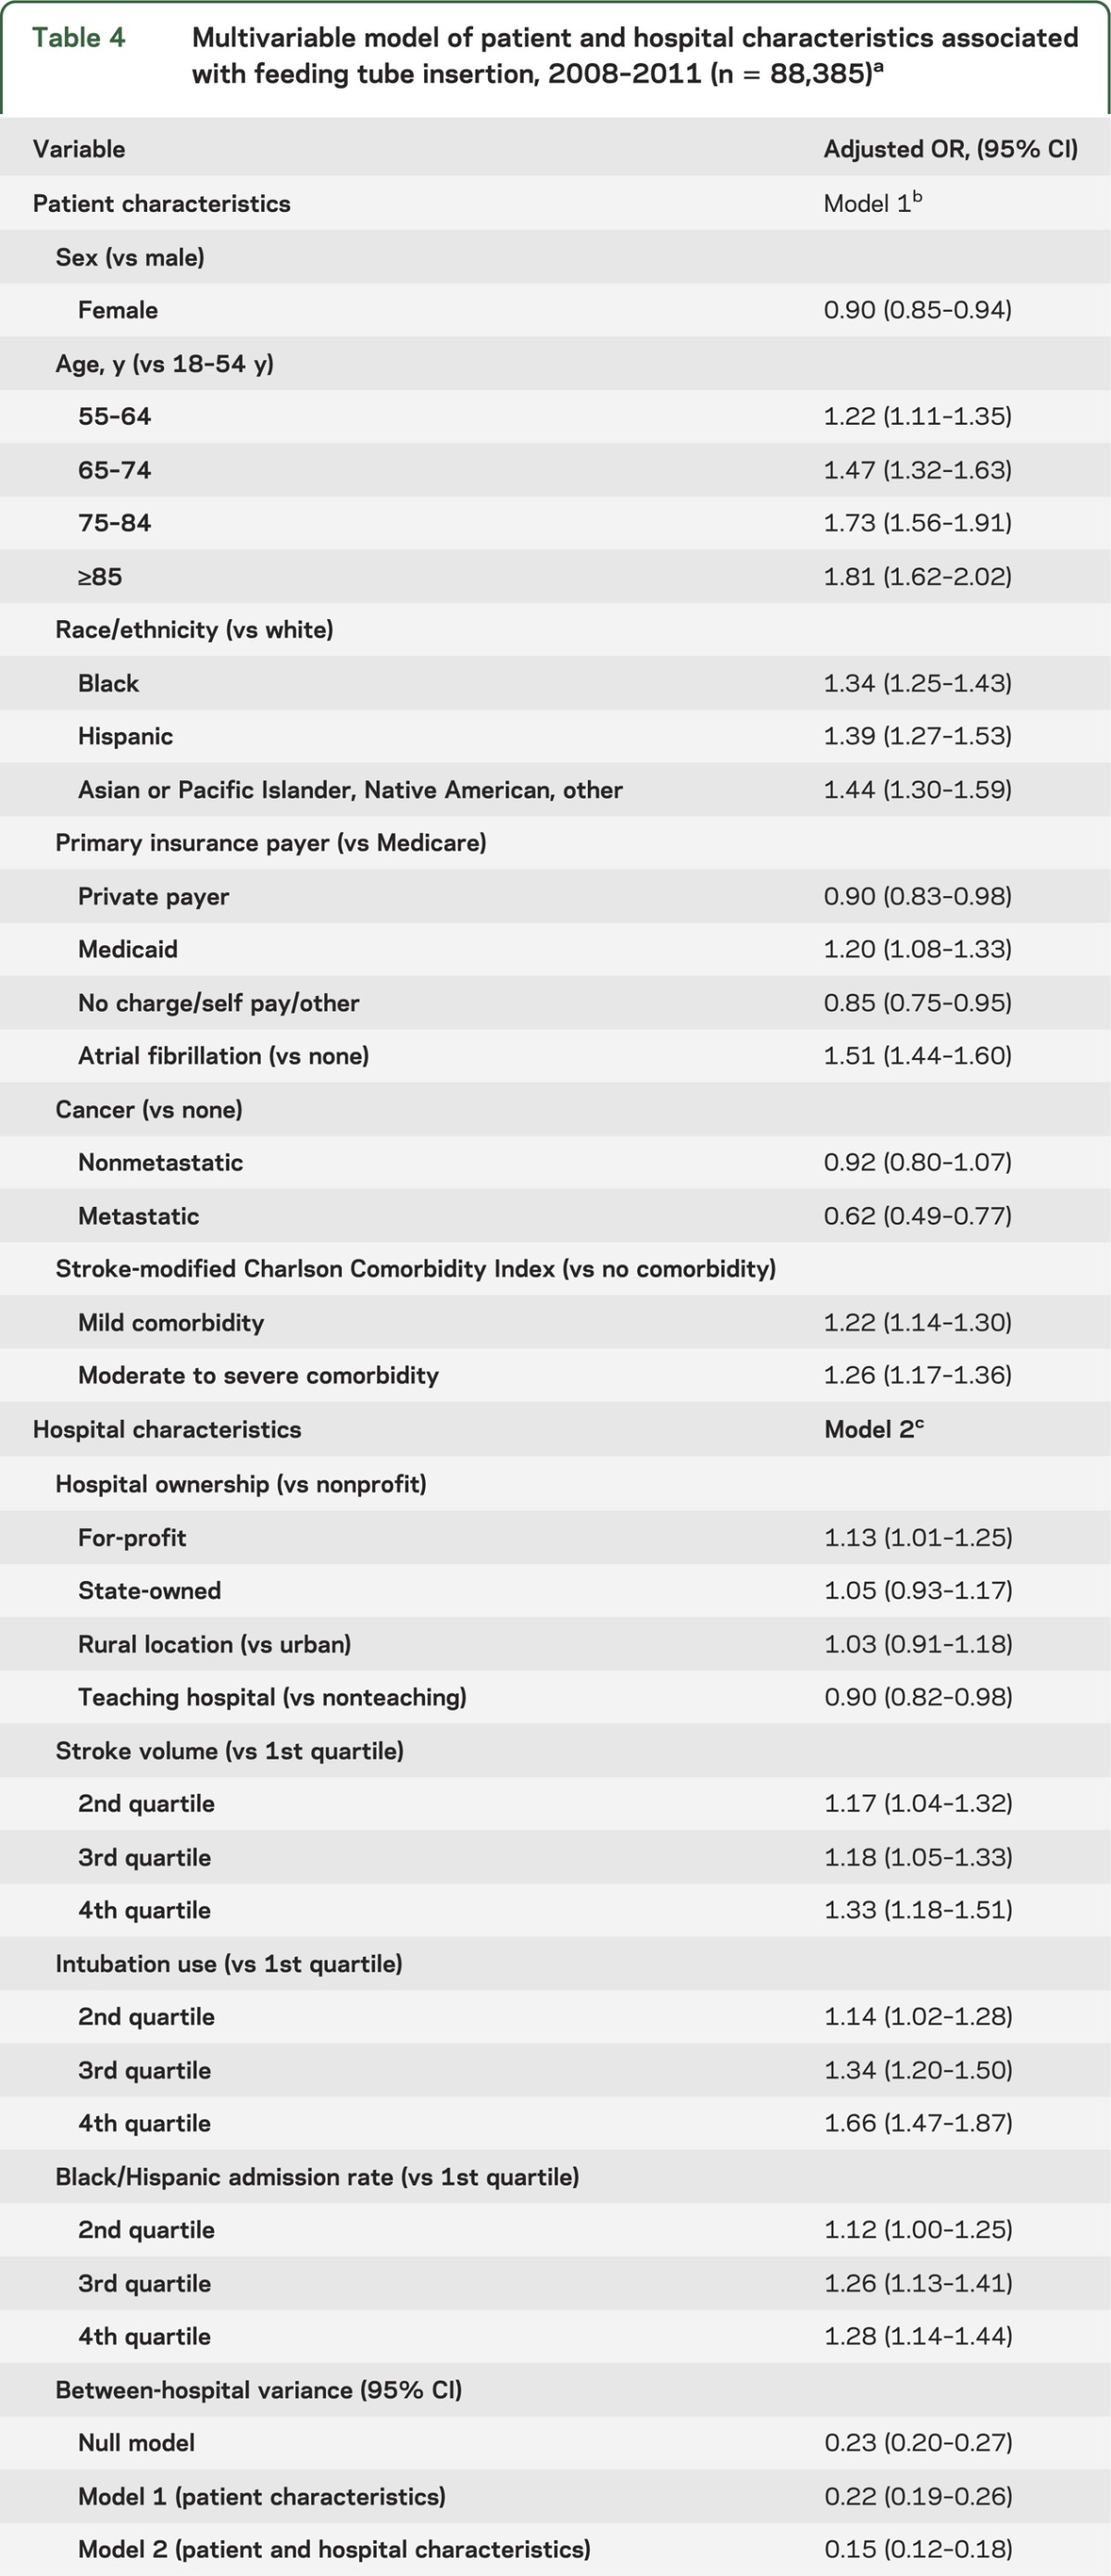
The absolute difference in adjusted feeding tube insertion rates between the highest and lowest quartile hospitals for intubation use was 4.8 per 100 stroke admissions (AOR 1.66; 95% CI 1.47–1.87). Hospitals in the highest quartile for stroke volume had approximately 1.30-fold greater odds of feeding tube insertion compared to the lowest quartile (AOR 1.33; 95% CI 1.18–1.51). In addition, hospitals with a greater proportion of black/Hispanic admissions also had higher rates of feeding tube insertion (4th quartile vs 1st quartile: AOR 1.28; 95% CI 1.14–1.44). For-profit hospitals were associated with increased risk of feeding tube insertion compared to nonprofits (AOR 1.13; 95% CI 1.01–1.25). Hospitals designated as teaching centers had a slightly lower rate of feeding tube insertion in the model, although this relationship was not significant after race variables were dropped from the model. No differences in adjusted feeding tube rates were found between urban and rural hospitals.
The ICC for a null model was 6.5%, and decreased to 4.4% in the model including patient and hospital covariates. The full model including both patient and hospital covariates accounted for 34.5% of between-hospital variance observed in the null (or empty) model, with 65.5% of between-hospital variance remaining unexplained. The MOR was 1.45 (95% CI 1.40–1.52) for the model accounting for both patient and hospital variables, indicating that if a patient moved from any 1 hospital to another hospital with a higher propensity of feeding tube placement, there was a 1.45-fold median increase in his or her odds of receiving a feeding tube. The magnitude of this hospital effect was comparable to other patient-level and hospital-level risk factors in the model and remained relatively unchanged with the exclusion of hospital outliers.
DISCUSSION
Among US acute care hospitals with at least 30 hospitalizations for acute ischemic stroke lasting greater than 3 days, the average rate of feeding tube insertions among hospitals did not change from 2004 to 2011, and rates varied widely from 0% to 26% in the more recent years of our study. We sought to understand why this variation occurs in current practice.
Differences in practice exist across a number of patient characteristics.15,18 For example, race has previously been described as a predictor in the use of all life-sustaining therapies following stroke.18 Our findings suggest that black and Hispanic ischemic stroke patients have over 30% increased odds in receiving a feeding tube compared with white patients after controlling for other patient and hospital characteristics. Also, hospitalizations primarily paid for by Medicaid (indicating lower socioeconomic status) demonstrated an increased adjusted risk of feeding tube insertion. These findings may be at least partly driven by greater stroke severity22,23 and a greater number of clinically eligible minority patients. However, these differences may also result from diversity in preferences or disparities in how providers and institutions interpret these preferences.24,25 Our study is limited in that it lacks data on patient or family preferences and understanding and the scope of provider discussions with patients and families.
Hospital characteristics associated with higher rates of feeding tube insertion included greater stroke volume, for-profit status, and higher intubation rates. Large hospitals, with a high rate of intensive care utilization, and for-profit status have previously been associated with high utilization in various aspects of care.15,26–28 In addition, for-profit hospitals and hospitals within areas of greater intensive care unit use were associated with decreased access to palliative care programs.29 Higher admission rates of black or Hispanic patients were also significantly associated with increased rates of feeding tube insertion after controlling for other hospital and patient characteristics. This may be driven by a disproportionate number of severe strokes from minority patients within these hospitals.22,23 However, our findings demonstrate that increased risks associated with these hospitals affect all racial and ethnic groups. For example, white patients treated in hospitals with the highest black/Hispanic admission rates have a 2% absolute increase in the adjusted probability of feeding tube placement compared to those treated in hospitals with the lowest rates. This association may be due to minorities seeking care within stressed health care environments,30 which could result in fewer resources devoted to optimizing patient and provider decision-making.
In the adjusted model, the effect of the hospital in which a patient was hospitalized represented a significant source of variation even after controlling for several patient and hospital characteristics. We found that unexplained heterogeneity between hospitals had a comparable effect to patient and hospital variables in understanding the propensity of feeding tube placement (median OR 1.45). Geographic factors (not accounted for in our model due to asymmetric representation of hospitals from various regions), including differences across regions or states, may play some role.31 However, significant variation exists even within US regions, states, and individual hospital referral regions, consistent with the recent Institute of Medicine report, which found substantial variation at all levels of care including individual providers.32 In the absence of a widely accepted evidence base for feeding tube placement, this variation may stem from differences in physician beliefs regarding indications or the extent to which patient preferences should be considered in treatment decisions.31
There is considerable variation that remains unexplained for feeding tube placement in ischemic stroke patients. Without clear evidence for use, patient and provider preference becomes a key component in decision-making. Differences in health care practices, such as those seen in our study, raise concern that these preference-sensitive decisions may be partly explained by factors external to the patient-centered decision to insert a feeding tube. Some have referred to this variation in preference-sensitive decisions and potential to misdiagnose patient preferences as a silent epidemic.33,34 Further research should seek to understand the reasons for this variation and ways to deconstruct and measure patient preferences, as well as ways to optimize the process of shared decision-making including the development and evaluation of decision aids as a way to deliver unbiased, evidence-based information regarding options and potential outcomes in dysphagic stroke patients.31,35,36 In addition, systematic methods in evaluation, family meetings, and time-limited trials across hospitals may help to decrease unwarranted variations and improve patient-centered and family-centered care.33
Our study has several limitations. The NIS does not have clinical data available to describe stroke severity, functional disability, and the size and location of the infarct, which may be predictors of feeding tube placement.37 We risk-adjusted using comorbidities to calculate a Charlson Comorbidity Index tailored for stroke outcomes studies,16 which may be a meaningful covariate for predicting mortality and poststroke feeding tube placement. We accounted for the presence of atrial fibrillation and cancer due to end-of-life care implications with late-stage carcinoma. Further, we identified only those stroke admissions with hospitalizations lasting greater than 3 days to select those patients at the greatest risk for feeding tube placement. Exclusion by length of hospital stay eliminated <1% of feeding tube placements and patients at 0.09% unadjusted risk of feeding tube placement. We were also limited in our reliance on ICD-9 codes, which lack granularity and may contain some inaccuracies, to identify diagnoses and procedures. Additionally, the inability to differentiate preexisting conditions from new events is another limitation of the dataset. Therefore, it is unclear whether complications such as intracranial hemorrhage, tracheostomy, and mechanical ventilation occurred before or after feeding tube placement, and thus we excluded these from the analysis.
We were unable to identify comprehensive and primary stroke centers in the NIS, which may have different feeding tube practices compared to hospitals without this distinction. The NIS also had incomplete data on race due to suppression by certain states or incomplete reporting by hospitals; therefore, we constructed 2 regression models with and without race variables that demonstrated few differences in other variables. However, incomplete data on race by hospital may still account for an important relationship that could explain some of the variability.
Despite these limitations, our study identifies current practices and hospital characteristics associated with feeding tube placement among acute ischemic stroke patients in a robust nationwide sample of US hospitals. Our findings underscore that accurately diagnosing patient preferences for feeding tubes after stroke may be more difficult than diagnosing stroke itself and we need to further understand and standardize the approach to ensure that the placement of a feeding tube after an acute stroke is in the patient's best interest.
Supplementary Material
GLOSSARY
- AHRQ
Agency for Healthcare Research and Quality
- AOR
adjusted odds ratio
- IQR
interquartile range
- CI
confidence interval
- ICC
intraclass correlation coefficient
- ICD-9
International Classification of Diseases, 9th Revision
- MOR
median odds ratio
- NIS
Nationwide Inpatient Sample
- OR
odds ratio
Footnotes
Editorial, page 870
Supplemental data at Neurology.org
AUTHOR CONTRIBUTIONS
B.P. George and Dr. Holloway had full access to all the data in the study and take responsibility for the integrity of the data and the accuracy of the data analysis. Drafting/revising the manuscript for content, including medical writing for content: B.P. George, Dr. Kelly, Dr. Schneider, Dr. Holloway. Study concept or design: Dr. George, Dr. Kelly, Dr. Schneider, Dr. Holloway. Analysis or interpretation of data: B.P. George, Dr. Kelly, Dr. Schneider, Dr. Holloway. Acquisition of data: B.P. George, Dr. Schneider. Statistical analysis: B.P. George. Study supervision or coordination: Dr. Holloway.
STUDY FUNDING
Supported by the American Heart Association/American Stroke Association 2013 Student Scholarship in Cerebrovascular Disease and Stroke.
DISCLOSURE
B.P. George conducts research funded by the American Heart Association/American Stroke Association, previously received funding from the Parkinson's Disease Foundation for research on teleneurology, and conducts health policy research in collaboration with the Boston Consulting Group and Alerion Institute. Dr. Kelly receives research funding from the Donald W. Reynolds Foundation. Dr. Schneider has pending patents in the area of CNS injury, is a member of Bergeim, LLC, and serves as a consultant to the WHO and to the Karolinska Institutet. Dr. Holloway is Associate Editor of Neurology Today® and is a consultant to Milliman Care Guidelines. Go to Neurology.org for full disclosures.
REFERENCES
- 1.Go AS, Mozaffarian D, Roger VL, et al. Heart disease and stroke statistics: 2013 update: a report from the American Heart Association. Circulation 2013;127:e6–e245 [DOI] [PMC free article] [PubMed] [Google Scholar]
- 2.Mann G, Hankey GJ, Cameron D. Swallowing function after stroke: prognosis and prognostic factors at 6 months. Stroke 1999;30:744–748 [DOI] [PubMed] [Google Scholar]
- 3.Geeganage C, Beavan J, Ellender S, Bath PM. Interventions for dysphagia and nutritional support in acute and subacute stroke. Cochrane Database Syst Rev 2012;10:CD000323. [DOI] [PubMed] [Google Scholar]
- 4.Collaboration FT. Poor nutritional status on admission predicts poor outcomes after stroke: observational data from the FOOD trial. Stroke 2003;34:1450–1456 [DOI] [PubMed] [Google Scholar]
- 5.Martino R, Foley N, Bhogal S, Diamant N, Speechley M, Teasell R. Dysphagia after stroke: incidence, diagnosis, and pulmonary complications. Stroke 2005;36:2756–2763 [DOI] [PubMed] [Google Scholar]
- 6.Flowers HL, Skoretz SA, Streiner DL, Silver FL, Martino R. MRI-based neuroanatomical predictors of dysphagia after acute ischemic stroke: a systematic review and meta-analysis. Cerebrovasc Dis 2011;32:1–10 [DOI] [PubMed] [Google Scholar]
- 7.Dennis MS, Lewis SC, Warlow C, Collaboration FT. Routine oral nutritional supplementation for stroke patients in hospital (FOOD): a multicentre randomised controlled trial. Lancet 2005;365:755–763 [DOI] [PubMed] [Google Scholar]
- 8.Dennis MS, Lewis SC, Warlow C; Collaboration FT. Effect of timing and method of enteral tube feeding for dysphagic stroke patients (FOOD): a multicentre randomised controlled trial. Lancet 2005;365:764–772 [DOI] [PubMed] [Google Scholar]
- 9.Gomes CA, Jr, Lustosa SA, Matos D, Andriolo RB, Waisberg DR, Waisberg J. Percutaneous endoscopic gastrostomy versus nasogastric tube feeding for adults with swallowing disturbances. Cochrane Database Syst Rev 2012;3:CD008096. [DOI] [PubMed] [Google Scholar]
- 10.Introduction to the HCUP Nationwide Inpatient Sample (NIS). Available at: http://www.hcup-us.ahrq.gov/db/nation/nis/NIS_Introduction_2011.jsp. Accessed December 15, 2013
- 11.Leibson CL, Naessens JM, Brown RD, Whisnant JP. Accuracy of hospital discharge abstracts for identifying stroke. Stroke 1994;25:2348–2355 [DOI] [PubMed] [Google Scholar]
- 12.Goldstein LB. Accuracy of ICD-9-CM coding for the identification of patients with acute ischemic stroke: effect of modifier codes. Stroke 1998;29:1602–1604 [DOI] [PubMed] [Google Scholar]
- 13.Johnston SC, Fung LH, Gillum LA, et al. Utilization of intravenous tissue-type plasminogen activator for ischemic stroke at academic medical centers: the influence of ethnicity. Stroke 2001;32:1061–1068 [DOI] [PubMed] [Google Scholar]
- 14.Appelros P. Prediction of length of stay for stroke patients. Acta Neurol Scand 2007;116:15–19 [DOI] [PubMed] [Google Scholar]
- 15.Teno JM, Mitchell SL, Gozalo PL, et al. Hospital characteristics associated with feeding tube placement in nursing home residents with advanced cognitive impairment. JAMA 2010;303:544–550 [DOI] [PMC free article] [PubMed] [Google Scholar]
- 16.Goldstein LB, Samsa GP, Matchar DB, Horner RD. Charlson Index comorbidity adjustment for ischemic stroke outcome studies. Stroke 2004;35:1941–1945 [DOI] [PubMed] [Google Scholar]
- 17.Xian Y, Holloway RG, Noyes K, Shah MN, Friedman B. Racial differences in mortality among patients with acute ischemic stroke: an observational study. Ann Intern Med 2011;154:152–159 [DOI] [PMC free article] [PubMed] [Google Scholar]
- 18.Merlo J, Chaix B, Ohlsson H, et al. A brief conceptual tutorial of multilevel analysis in social epidemiology: using measures of clustering in multilevel logistic regression to investigate contextual phenomena. J Epidemiol Community Health 2006;60:290–297 [DOI] [PMC free article] [PubMed] [Google Scholar]
- 19.Sanagou M, Wolfe R, Forbes A, Reid CM. Hospital-level associations with 30-day patient mortality after cardiac surgery: a tutorial on the application and interpretation of marginal and multilevel logistic regression. BMC Med Res Methodol 2012;12:28. [DOI] [PMC free article] [PubMed] [Google Scholar]
- 20.Larsen K, Merlo J. Appropriate assessment of neighborhood effects on individual health: integrating random and fixed effects in multilevel logistic regression. Am J Epidemiol 2005;161:81–88 [DOI] [PubMed] [Google Scholar]
- 21.Rabe-Hesketh S, Skrondal A. Multilevel and Longitudinal Modeling Using Stata: Categorical Responses, Counts, and Survival. College Station, TX: Stata Press Publication; 2012 [Google Scholar]
- 22.Jones MR, Horner RD, Edwards LJ, et al. Racial variation in initial stroke severity. Stroke 2000;31:563–567 [DOI] [PubMed] [Google Scholar]
- 23.Kuhlemeier KV, Stiens SA. Racial disparities in severity of cerebrovascular events. Stroke 1994;25:2126–2131 [DOI] [PubMed] [Google Scholar]
- 24.Kelly AG, Hoskins KD, Holloway RG. Early stroke mortality, patient preferences, and the withdrawal of care bias. Neurology 2012;79:941–944 [DOI] [PMC free article] [PubMed] [Google Scholar]
- 25.Kelly AG, Sahin B, Holloway RG. Ethical considerations in stroke patients. Curr Opin Neurol 2014;27:61–65 [DOI] [PubMed] [Google Scholar]
- 26.Taylor DH, Jr, Whellan DJ, Sloan FA. Effects of admission to a teaching hospital on the cost and quality of care for Medicare beneficiaries. N Engl J Med 1999;340:293–299 [DOI] [PubMed] [Google Scholar]
- 27.Mathias JS, Feinglass J, Baker DW. Variations in US hospital performance on imaging-use measures. Med Care 2012;50:808–814 [DOI] [PubMed] [Google Scholar]
- 28.White RH, Geraghty EM, Brunson A, et al. High variation between hospitals in vena cava filter use for venous thromboembolism. JAMA Intern Med 2013;173:506–512 [DOI] [PubMed] [Google Scholar]
- 29.Goldsmith B, Dietrich J, Du Q, Morrison RS. Variability in access to hospital palliative care in the United States. J Palliat Med 2008;11:1094–1102 [DOI] [PMC free article] [PubMed] [Google Scholar]
- 30.Rhodes R, Teno JM. What's race got to do with it? J Clin Oncol 2009;27:5496–5498 [DOI] [PubMed] [Google Scholar]
- 31.Birkmeyer JD, Reames BN, McCulloch P, Carr AJ, Campbell WB, Wennberg JE. Understanding of regional variation in the use of surgery. Lancet 2013;382:1121–1129 [DOI] [PMC free article] [PubMed] [Google Scholar]
- 32.Newhouse JP, Garber AM. Geographic variation in Medicare services. N Engl J Med 2013;368:1465–1468 [DOI] [PubMed] [Google Scholar]
- 33.Krumholz HM. Variations in health care, patient preferences, and high-quality decision making. JAMA 2013;310:151–152 [DOI] [PMC free article] [PubMed] [Google Scholar]
- 34.Mulley AG, Trimble C, Elwyn G. Stop the silent misdiagnosis: patients' preferences matter. BMJ 2012;345:e6572. [DOI] [PubMed] [Google Scholar]
- 35.Informed Medical Decisions Foundation. Foundation Decision Aids (Shared Decision-making® Programs). Available at: http://www.informedmedicaldecisions.org/shared-decision-making-in-practice/decision-aids/ Accessed December 26, 2013 [Google Scholar]
- 36.McCulloch P, Nagendran M, Campbell WB, et al. Strategies to reduce variation in the use of surgery. Lancet 2013;382:1130–1139 [DOI] [PubMed] [Google Scholar]
- 37.Dubin PH, Boehme AK, Siegler JE, et al. New model for predicting surgical feeding tube placement in patients with an acute stroke event. Stroke 2013;44:3232–3234 [DOI] [PMC free article] [PubMed] [Google Scholar]
Associated Data
This section collects any data citations, data availability statements, or supplementary materials included in this article.