

Abstract
Metabolic reprogramming is increasingly viewed as a hallmark of cancer. Accordingly, metabolic readouts can serve as biomarkers of response to therapy. The goal of this study was to investigate some of the magnetic resonance spectroscopy (MRS)-detectable metabolic consequences of MEK inhibition. We investigated PC3 prostate cancer, MCF-7 breast cancer and A375 melanoma cells and determined that, consistent with previous studies, MRS-detectable levels of phosphocholine dropped significantly in all cell lines (to 63%, 50% and 18% of control, respectively) following MEK inhibition with U0126. This effect was mediated by a drop in the expression of choline kinase α, the enzyme that catalyzed the phosphorylation of choline. In contrast, the impact of MEK inhibition on glycolysis was cell-line dependent. A375 cells, which express mutant BRAF demonstrated a significant drop in glucose uptake (to 36% of control) and a drop in lactate production (to 42% of control) in line with PET data. In contrast, in PC3 and MCF-7 cells an increase in glucose uptake (to 198 % and 192% of control, respectively) and an increase in lactate production (to 177% and to 212% of control, respectively) was observed, in line with a previous hyperpolarized 13C MRS study. This effect is likely mediated by activation of the PI3K pathway and AMPK. Our findings demonstrate the value of translatable non-invasive MRS methods for informing on cellular metabolism as a readout for activation of potential feedback loops following MEK inhibition.
Keywords: Magnetic resonance spectroscopy, MRS, MEK, U0126, metabolism
Introduction
Metabolic reprogramming is increasingly recognized as a key aspect of carcinogenesis and disease progression. It is mediated by signaling via key oncogenic signaling pathways and, conversely, response to therapies specifically aimed at targeting these signaling pathways, is associated with normalization of cell metabolism (1–3). These observations have fueled the development of imaging approaches that can monitor metabolism and can thus improve early detection of disease, timely and efficient evaluation of response to treatment, and identification of therapeutic resistance.
Specifically, the Warburg effect – elevated glucose uptake and its aerobic metabolism to lactate – is observed in most tumor types, and can be imaged in vivo by monitoring uptake of the glucose analogue [18F]-2-fluoro-2-deoxy-D-glucose (FDG) using positron emission tomography (PET). FDG-PET is routinely used in the clinic to detect the presence of tumor, and for evaluating early response and treatment outcome (4, 5). Methods based on magnetic resonance spectroscopy (MRS) and spectroscopic imaging (MRSI) can also be used to monitor the Warburg effect. 1H MRS, which detects steady state metabolite levels, can be used to probe the elevated levels of tumor lactate associated with increased glycolysis (6). In addition, 13C MRS can be used to monitor metabolic fluxes and probe the metabolic fate of 13C labeled metabolites, including glucose. However, the relatively low sensitivity of 13C MRS has limited its application in the clinic (7, 8). In recent years, with the development and optimization of dissolution dynamic nuclear polarization (DNP) methods, and the outstanding signal enhancement that can be achieved with hyperpolarization of 13C-labeled compounds, the use of 13C MRS for detection of in vivo metabolism has generated growing interest. In particular, hyperpolarized pyruvate has been used in cancer models in vitro and in vivo to detect the production of lactate at the end of the glycolytic pathway and to monitor response to therapy in a variety of cancers. A clinical trial recently performed at UCSF has also demonstrated the utility of this approach in the clinic (9–19).
Choline metabolism is another metabolic pathway that is altered in cancer and has been used to detect disease and monitor response to treatment (20). PET tracers based on 11C- and 18F-labelled choline and choline derivatives have been developed and evaluated for the in vivo radiological diagnosis of metastatic and recurrent tumors, as well as for the evaluation of tumor response to drug treatment (21–23). 1H MRS can be used to detect steady-state choline-containing metabolite levels (tCho, comprised of choline, phosphocholine (PC) and glycerophosphocholine (GPC)) and the concentration of PC and tCho metabolites was shown to be associated with malignancy in cancer models as well as in patients, including in breast, brain, prostate and other cancers. Conversly, these metabolites typically decrease in response to therapy (20, 24–27).
In the case of treatment aimed at inhibiting the Ras/MAPK pathway, inhibition of Ras signaling in fibroblasts, and response of breast and colorectal cancer models to MEK inhibition has been associated with a drop in PC levels (24, 26). However, its effect on the glycolytic pathway is more variable. In cells that harbor the BRAF mutation, treatment with BRAF and BRAF/VEGFR-2 inhibitors led to a drop in FDG-PET-detected glucose uptake in melanoma cells (28, 29) and a drop in extracellular lactate levels was also detected using 1H MRS following MEK inhibition (30). In contrast, we recently found that the production of lactate was increased in prostate and breast cancer cells treated with the MEK inhibitor U0126 (11). The goal of this work was therefore to perform a detailed investigation of the metabolic alterations associated with inhibition of the MAPK pathway, with a particular emphasis on the imageable glucose and choline metabolic pathways. To this end, we characterized the metabolic consequences of treatment with the MEK inhibitor U0126 in prostate cancer, breast cancer, and melanoma cells. We found that in MEK-inhibited mutant BRAF melanoma a decrease in glycolytic flux occurred. In contrast, MEK inhibition in prostate and breast cancer cells resulted in an increase in glucose uptake and lactate production, likely mediated by activation of the PI3K pathway and/or AMPK. However, in all cell lines, the levels of PC dropped following U0126 treatment, mediated by a drop in choline kinase α expression.
Experimental
Cell culture and treatments
PC3 (prostate), MCF-7 (breast), and A375 (melanoma) cancer cell lines were obtained from American Type Culture Collection via the UCSF Cell Culture Facility (San Francisco, CA, USA). All experiments were performed within 6–12 months of cell line authentication (using short tandem repeat (STR) analysis, PowerPlex 1.2 System, Promega) and mycoplasma testing (MycoAlert™ mycoplasma detection kit, Lonza). PC3 and MCF-7 cells were cultured in low glucose DMEM, A375 cells in high glucose DMEM. In all cases, medium was supplemented with 10% heat-inactivated fetal bovine serum, 2 mM L-glutamine, 100 units ml−1 of penicillin and 100 μg ml−1 of streptomycin and cells were cultured in a humidified chamber at 37 °C in 5% CO2 in air.
Cells were incubated with U0126 (LC Laboratories) at doses of 50 μM for PC3, and 25 μM for MCF-7 and A375 cells. All treatments were performed over 48 hours with matching DMSO solvent controls (1:1000 in the culture medium) and U0126 was replenished every 24 hours. Treatment doses were determined as previously described (31) using the WST-1 cell proliferation assay (Roche) and doses were selected such that they induced a 50% drop in cell viability after 48 hours of treatment. In all cases, inhibition of the target at the selected drug dose was confirmed by probing for p-ERK levels using Western blotting (see below).
Cell extraction and MRS data acquisition and analysis
Cell extracts were prepared using a dual-phase extraction as previously described (24, 31–33). For each sample a parallel flask was trypsinized and used to determine cell numbers. At the time of extraction, 1 ml of the extracellular medium was also collected, snap frozen and stored at −80 °C until the 1H MRS analysis.
MR spectra of cell extracts or growth medium were acquired on a 600 MHz scanner (Varian/Agilent, Palo Alto California). 1H MRS data were acquired using 90° pulse, 3 s relaxation delay, 8 kHz spectral width and either presat or excitation sculpting (34) for suppression of the water signal. Sodium 3-(trimethylsilyl)propionate-2,2,3,3-d4 (TMSP; Cambridge Isotope Laboratories) was used as reference. Fully relaxed spectra (90° pulse and 60 s relaxation delay) were also obtained in order to determine saturation correction factors. ACD/Spec Manager version 9.15 (Advanced Chemistry Development) software was used for the analysis of spectra and for peak area integration. Peak assignments were based on previous literature and available databases such as HMDB (http://www.hmdb.ca/) and BML (www.bml-nmr.org). Metabolites were quantified correcting for saturation and normalizing to reference and to cell number. Proton-decoupled (Waltz-16) 31P MR spectra were acquired using a 30° pulse, 3 s relaxation delay and 8 kHz spectral width following the addition of EDTA (pH 8; 10 mM final concentration). Methylenediphosphonic acid (MDPA; Sigma-Aldrich) was used as reference and metabolites were quantified as above.
Multivariate statistical analysis (principal component analysis, PCA) was used to identify the main treatment-induced metabolic changes in the 1H MR spectra, as previously described (31). Difference spectra were obtained by subtracting the average of all spectra acquired on control cells from the average spectrum of treated cells (N=8 in both conditions).
Cell perfusion system
For MRS studies of live cells, experiments were performed using a cell perfusion MR-compatible bioreactor system, previously described (11, 12, 32, 35). Briefly, cells were seeded, allowed to adhere and grow on Biosilon® microcarrier beads (Nunc) for approximately 24 hours, and then treated for approximately 48 hours prior to the MRS study. In addition to the cells required for the MRS studies, one extra aliquot of cells was seeded on microcarrier beads at the same density, treated in the same way and used, following trypsinization, to obtain a cell count. Immediately prior to MRS studies, the cell-bearing beads were loaded into the bioreactor system. A perfusion system consisting of one inflow and two outflow lines enabled circulation of growth medium to a 10-mm MR tube at the bottom of which the cells on beads were immobilized. The system was under a 5% CO2/95% air over-pressure and placed in the MR probe at 35 °C. Glucose and choline in the growth medium (100 ml, continuously circulated at 1.5 ml min−1) were completely replaced with 1-13C glucose and 1,2-13C choline. To maintain treatment either the appropriate dose of U0126 or DMSO was also added to the medium.
Live cell studies and MRS data acquisition and analysis
All MRS studies on live cells were performed on a 500 MHz spectrometer (Varian/Agilent Palo Alto, CA, USA). Proton-decoupled (Waltz 16) 13C MR spectra were acquired every hour for a period for up to 20 hours using a 60° pulse and 6 s relaxation delay. Cells were continuously perfused with 13C-labeled medium. Inverse-gated fully relaxed spectra (90° pulse and 60 s relaxation delay) were also obtained to determine the saturation correction factors for metabolite quantification. Prior to and at the end of each 13C MRS experiment, 31P MRS spectra were acquired to confirm cell viability using a pulse-acquire scheme with a 30° pulse, 3 s relaxation delay, 8 kHz spectral width and composite pulse 1H decoupling during acquisition. The ACD/Spec Manager version 9.15 software was used for peak area integration. Metabolite concentrations were determined as above by normalizing each metabolite level to a reference compound of known concentration (inorganic phosphate in the perfusion medium for 31P data and glucose at the onset of the experiment for 13C studies) correcting for saturation effects and normalizing to cell number.
Microarray analysis of gene expression
Total cellular RNA was isolated using the RNeasy Mini Kit (Qiagen), according to manufacturer’s instructions. RNA quality was determined by Bioanalyzer (Agilent), considering RNA Intergrity Numbers (RIN) values of ≥ 8.0 acceptable (for all samples: RIN=10). Microarray hybridization was performed at the UCSF Genomics Core Laboratories (UCSF/Gladstone, San Francisco, CA) using the Human Gene 1.0 ST and analysis by fluorescence detection using the Agilent GeneArray Scanner (Agilent). Data acquisition was performed using the Micro Array Suite 5.0 software (Affymetrix). Microarray experiments were performed with 4 repeats for each condition. Analysis of significance was performed using SAM (36). Microarray data is available through the ArrayExpress public repository (ArrayExpress accession number: E-MTAB-2142) in compliance with standards of the Microarray Data Gene Expression Society.
qRT-PCR analysis of gene expression
Total cellular RNA was isolated using the RNeasy Mini Kit and quantified using a NanoDrop ND1000 Fluorospectrometer (NanoDrop Technologies). Reverse transcription was performed using the QuantiTect Reverse Transcription kit (Qiagen). Real-Time PCR was performed on the resulting cDNA on a Taqman 7900 (Applied Biosystems). Expression of SLC2A1 (Hs00892681_m1), HK2 (Hs00606086_m1), PFKFB3 (Hs00998700_m1), CHKA (Hs03682798_m1) and SLC44A1 (Hs00223114_m1; all gene specific primer/probe sets from Applied Biosystems) was examined using Assays-on-Demand (Applied Biosystems) and normalized to the expression of GAPDH or the 18S ribosomal subunit (Integrated DNA Technologies).
Western Blotting
Whole cell extracts were obtained (RIPA buffer), separated on 4% to 20% SDS-PAGE gels (Bio-Rad) and probed with the following: rabbit antibodies against p44/42 MAPK (ERK1/2), phospho-p44/42 MAPK (p-ERK1/2), β-actin (as loading control), Akt, p-Akt, AMPK, p-AMPK (all from Cell Signaling), mouse antibodies against ChoKa (Sigma) and horseradish peroxidase-linked secondary antibodies (Cell Signaling or Abcam). Immunocomplexes were visualized using Pierce ECL Western Blotting Substrate (Pierce Biotechnology). Quantification of bands was performed using the gel analysis submenu in ImageJ (http://rsbweb.nih.gov/ij/index.html), normalized to loading control and reported as percent of control.
Statistics
All data are reported as mean±standard deviation. Statistical significance was determined using a Student’s t-test with p<0.05 considered significant.
Results
Untargeted metabolic profiling of MEK inhibition in PC3 prostate cancer cells
PC3 prostate cancer cells were treated with 50 μM U0126 for 48 hours, a treatment dose that was found to effectively inhibit MEK signaling as illustrated by the drop in ERK phosphorylation (Figure 1A, N=4) and which induced a drop in cell number to 54%±8% of untreated cells. To identify the metabolic changes associated with MEK inhibition in PC3 cells, we first performed an untargeted 1H MRS-based metabolomics study and analyzed the entire 1H MR-detectable metabolome using principal component analysis (PCA). The scores plot obtained from PCA is illustrated in Figure 1B and indicates very good separation of the treated and untreated samples. Because we had previously investigated the metabolomic consequences of treatment with PI3K and HSP90 inhibition (31), we also questioned whether inhibition of MAPK signaling in response to U0126 resulted in a specific metabolomics signature that could be clearly distinguished from response to other targeted therapies. Our findings clearly demonstrate that response to each of the three therapies leads to a distinct metabolic signature, although, when compared with other therapies, treatment with U0126 induced a more limited metabolic response (illustrated in Supplementary Figure 1 by the larger separation of the control group from the LY294002 and 17-AAG treatment groups compared to its separation from the U0126 treatment group).
Figure 1. Metabolic changes induced by MAPK inhibition with U0126 in PC3 prostate cancer cells.

(A) Inhibition of Erk phosphorylation as probed by Western blotting following 48-hour treatment with U0126; (B) Scores plot for the principal component analysis performed on the 1H MRS datasets acquired on cell extracts (N=8) of untreated and U0126-treated PC3 cells; (C) 1H MR spectrum (zoomed in section 0.8–4.2 ppm) and illustrating the difference between control and U0126-treated cells (average spectrum acquired on U0126-treated PC3 cells minus average spectrum of control cells). Colorbar indicates FDR-corrected p-value calculated at each point of the spectrum (fumarate which resonates at 6.5 ppm is not included in the represented spectral region); (D) Intracellular concentration (fmol/cell) of metabolites altered by treatment with U0126. *: p<0.01; **: p<10−4; ***: p<10−5.
We then performed an in depth analysis of the specific metabolic changes induced in PC3 prostate cancer cells by U0126-treatment (N=8). The difference spectrum between the average data of control and treated cells (Figure 1C) indicates that only a few metabolites change significantly following treatment (false discovery rate (FDR)-corrected p-values are shown). In particular, lactate and fumarate (signal resonates at 6.5 ppm and is not shown in Figure 1C) were found to accumulate intracellularly in U0126-treated PC3 cells, while PC, GPC, aspartate and succinate levels all dropped significantly (Figure 1D).
Treatment-induced metabolic flux changes in MEK-inhibited PC3 prostate cancer cells
Next, we focused on investigating the metabolic pathways that are associated with lactate and PC - two metabolites that showed significant changes with treatment and that are readily imageable in vivo. Since intracellular lactate was elevated in the U0126-treated cells, we investigated the treatment-induced modulation of glucose metabolism. Using 13C MRS, we longitudinally monitored glucose consumption and its metabolic fate in live PC3 cells (N=6). 13C MR spectra acquired sequentially showed progressive consumption of glucose from the medium and its conversion into lactate (Figure 2A). A significant increase in both glucose consumption (to 198% of control from 270±45 fmol/cell/h to 534±69 fmol/cell/h; p=0.01) and lactate production (to 177% of control from 208±39 fmol/cell/hour to 369±53 fmol/cell/h; p=0.003) were observed in cells undergoing treatment with U0126 when compared to controls (Figure 2B).
Figure 2. Effect of treatment with U0126 on glucose metabolism and glycolysis- related gene expression.

(A) Representative 13C MR spectra acquired sequentially over 16 hours in live PC3 cells continuously perfused with medium containing 1-13C glucose and 1,2-13C choline; (B) Metabolic rates (fmol/cell/hour) of glucose consumption and lactate production; (C) Changes in mRNA levels for selected genes related to glycolysis. *: p≤0.01; **: p < 0.001.
In an effort to understand the underlying mechanism for our observations, we investigated the expression of genes coding for proteins involved in regulation of the glycolytic pathway (37) using microarray analysis. Most notably, we found that hexokinase 2 (HK2) increased by 1.6 fold (q-value 0.001), 6-phosphofructo-2-kinase/fructose-2,6-biphosphatase 3 (PFKFB3) increased by 2 fold (q-value 0.001) and solute carrier family 2 (facilitated glucose transporter), member 1 (SLC2A1) increased by 1.95 fold (q-value 0.001). We further confirmed these findings by probing mRNA levels using qRT-PCR in control and U0126-treated PC3 cells (N=4). HK2 increased by 1.6 fold while PFKFB3 and SLC2A1 increased by over 2 fold (Figure 2C).
The increase in glycolysis observed in our cells can be mediated by several factors. In particular, signaling via the PI3K pathway impacts the expression of glycolytic enzymes (38) and it is well established that inhibition of the MAPK pathway can induce a compensatory effect that involves activation of PI3K signaling (39, 40). We therefore probed the Akt status in our cells (N=4) and observed a drug-induced increase in the levels of p-Akt to 150±19% of control (p=0.04; Figure 3A) providing a possible explanation for our findings. Activation of AMPK can also lead to an increase in glycolytic flux (41). Using 31P MRS we probed the levels of phosphorous-containing intracellular metabolites in control and U0126-treated PC3 cells (Figure 3B; N=4) and found that ATP levels dropped from 7.7±0.8 fmol/cell in controls to 5.7±0.6 fmol/cell (p=0.03) in treated cells, while ADP levels remained unchanged (AMP levels were below detection level). This resulted in an increase in the ADP-to-ATP ratio (ADP/ATP) in treated cells to 255±116% of control (p=0.04; Figure 3C), an effect that has been shown to promote activation of AMPK (42). We confirmed that AMPK was activated by probing p-AMPK levels (N=3) and observed an increase in p-AMPK in treated cells to 249±90% (p=0.009) of control (Figure 3A). This too could explain the increase in glycolytic flux observed in our treated cells.
Figure 3. Effect of treatment with U0126 on signaling and phosphorous-containing metabolites.
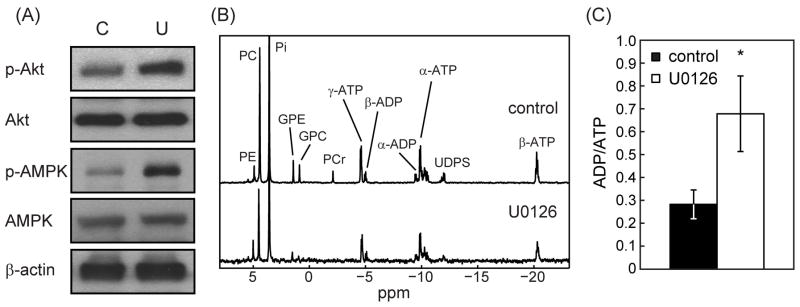
(A) Changes in p-Akt, Akt, p-AMPK and AMPK protein levels in untreated (C) and U0126-treated (U) PC3 cells (β-actin shown as loading control); (B) Representative 31P MR spectra of control and treated PC3 cells; (C) changes in ADP/ATP levels. *: p < 0.05.
In line with previous findings, the 1H MRS data (Figure 1D) also showed a drop in PC levels from 14.5±1.2 to 8.6±1.5 fmol/cell. 31P MRS (Figure 3B) confirmed these findings. PC levels dropped in U0126-treated cells from 12.8±1.8 fmol/cell to 8.4±1.0 fmol/cell (p=0.03). Similarly, GPC levels also dropped significantly after treatment, in line with the 1H MRS results, from 1.6±0.3 fmol/cell to 0.7±0.2 fmol/cell (p=0.03). To further investigate the underlying mechanism for the modulation in PC levels, we determined the rates of de novo PC synthesis by perfusing live PC3 cells with medium containing 1,2-13C choline and using 13C MRS to monitor the buildup of 1,2-13C PC (Figure 2A). In line with the drop in total PC levels, the initial rate of its de novo synthesis dropped to 60% of control (p=0.04) in U0126-treated PC3 cells from 1.04±0.18 to 0.62±0.12 fmol/cell/hour (Figure 4A). The accumulation of 1,2-13C PC reached a plateau after approximately 14 hours at which point the size of the labeled PC pool in untreated (12.8±2.2 fmol/cell) and treated (7.9±1.7 fmol/cell) cells were in line with the steady state total intracellular PC levels determined from the 1H and 31P MRS metabolic profiling.
Figure 4. Effect of treatment with U0126 on phosphocholine (PC) metabolism.

(A) Rate of de novo phosphocholine synthesis (fmol/cell/hour) in live PC3 cells; (B) Choline kinase α protein levels in control (C) and U0126-treated (U) cells (β-actin shown as loading control); (C) U0126-induced changes in mRNA levels of choline kinase α and the choline transporter SLC44A1. *: p < 0.05; **: p≤0.005.
Choline is actively transported to the cytoplasm from the extracellular space by choline transporters and is then intracellularly converted to PC by choline kinase (32). In an effort to understand the factors that lead to the reduction in PC synthesis, we monitored the expression of choline transporters and the expression of choline kinase α, the isoform that is typically overexpressed and active in cancer. A significant drop in the expression of choline kinase α, both at the level of protein (62±5% of control, p=0.002, N=3; Figure 4B) and at the level of mRNA (65±8% of control, p=0.005, Figure 4C) was observed in treated PC3 cells. In addition a drop in the mRNA levels of the SLC44A1 choline transporter was observed (74±3% of control, p=0.001, Figure 4C), although the change in SLC44A1 protein levels did not reach significance (data not shown).
Treatment-induced modulation of metabolism in MCF-7 cells
To further explore whether the metabolic modulations induced by treatment with U0126 in PC3 prostate cancer cells could be extended to other cancer models, we investigated the effects of drug treatment on metabolism in MCF-7 breast cancer cells. Cells were treated with 25 μM U0126, which induced a drop in cell number to 52±7% of control after 48 hours.
We have previously shown that following treatment with U0126 intracellular lactate accumulation increased to 206±42% of control (p=0.001, N=5) (11), in line with our findings in PC3 cells. Consistent with this observation, and similar to our findings in PC3 cells, 13C MRS of MCF-7 cells perfused with 1-13C glucose-containing medium, also showed elevated rates of glucose consumption (up to 192% of control from 362±125 to 696±239 fmol/cell/h, p=0.02, N=8) and lactate production (up to 212% of control from 295±99 to 625±230 fmol/cell/h, p=0.02) in cells receiving U0126 treatment (Figure 5A). When considering the mechanism through which this effect could be mediated, the mRNA levels of HK2 increased significantly (404±241% of control, p=0.006, N=4), but in contrast to our findings in the prostate cancer cells we did not observe any significant changes in p-Akt levels (N=4). However, similar to the results obtained in PC3 cells, profiling of 31P MRS-detectable metabolites indicated that the intracellular levels of ATP dropped following treatment (from 10.1±1.9 fmol/cell in control to 5.5±1.3 fmol/cell in treated cells, N=5) resulting in an increase in ADP/ATP (from 0.24±0.03 to 0.40±0.02, p=0.002; Figure 5B). Moreover, p-AMPK levels increased significantly to 178±42% of control (p=0.01) in treated MCF-7 cells (Figure 5C).
Figure 5. Effect of treatment with U0126 in MCF-7 cells.

(A) Metabolic rate of glucose consumption and lactate production in untreated (black) and U0126-treated (white) MCF-7 cells; (B) ADP/ATP levels; (C) p-AMPK and choline kinase α protein levels as probed by Western blotting; (D) Intracellular concentration of PC; (E) Rate of de novo PC synthesis in live cells. *: p < 0.05; **: p < 0.005.
Metabolic profiling using 1H and 31P MRS also indicated that intracellular PC levels dropped significantly following treatment to approximately 50% (p<0.05) of control (Figure 5D; PC dropped from 19.5±3.8 to 9.9±3.5 fmol/cell and from 21.0±4.7 to 10.4±4.6 fmol/cell based on the 1H and 31P spectra, respectively). The rate of de novo PC synthesis also dropped to 47% of control (from 1.8±0.8 to 0.8±0.3 fmol/cell/h, p=0.02) in U0126-treated MCF-7 cells (Figure 5E), as did protein levels of choline kinase α (63±12% of control, p=0.04; Figure 5C) although the change in choline kinase α mRNA levels was not significant. No significant change was observed in the expression of SLC44A1.
Treatment-induced modulation of metabolism in A375 cells
In the case of melanoma cells, inhibition of the MAPK pathway by treatment with B-Raf and B-Raf/VEGFR-2 inhibitors has been shown to induce a substantial drop in FDG-PET-detected glucose uptake in the A375 model which harbors the BRAFV600E mutation (28, 29). Furthermore, a 1H MRS study showed that extracellular lactate drops in BRAF-dependent cells, but not in BRAF-independent cells (30). We therefore decided to also investigate the melanoma cell line A375. Treatment with 25 μM U0126 for 48 hours induced a drop in A375 melanoma cell number to 49±5% of control. Using 1H MRS on A375 cellular extracts, we determined that intracellular lactate accumulation dropped dramatically to 27±4% of control (p=0.01, N=3) in cells treated with U0126 from 27.2±3.9 fmol/cell to 7.1±0.3 fmol/cell (Figure 6A). A treatment-induced drop in glucose uptake and lactate production was also confirmed using 1H MRS on the conditioned culture medium: glucose uptake from the medium dropped to 36.0±7.2% of control, while extracellular lactate accumulation dropped to 42.3±3.5% of control. Importantly, levels of AMPK, p-AMPK, Akt, and p-Akt remained unchanged (Figure 6B, N=3), highlighting the fact that the drop in glycolysis observed in the A375 cells, in contrast to the activation of glycolysis observed in PC3 and MCF-7 cells, reflects a range of different molecular consequences associated with MAPK signal inhibition in BRAF dependent cells, as previously described by others (30).
Figure 6. Effect of treatment with U0126 in A375 cells.

(A) Lactate peak intensity in 1H MR spectra acquired on untreated (black) and U0126-treated (grey) A375 cell extracts; (B) protein levels of AMPK, p-AMPK, Akt, p-Akt and choline kinase α (β-actin shown as loading control).
In the case of PC, a treatment-induced drop to 18% of control (from 10.0±1.1 to 1.8±0.1 fmol/cell, p=0.005) was observed, in line with our results in PC3 and MCF-7 cells, as well as previous reports in breast and colon cancer cells (26). The drop in PC was associated with a drop in choline kinase α protein levels to 46±7% (p=0.008) of control (Figure 6B).
Discussion
Deregulated cell metabolism is increasingly recognized as a hallmark of cancer. Consequently, novel metabolic biomarkers and methods to non-invasively image those biomarkers are being investigated and developed. A possible approach to identifying such novel MRS-detectable biomarkers is based on the comprehensive profiling of the metabolome to obtain broad-based metabolic signatures associated with the presence of disease or response to treatment. Such studies are typically performed on cell extracts or tissue biopsies (31, 33, 43, 44). Here, we used this approach and first investigated the 1H MRS detectable consequences of treatment with U0126 on cell extracts. When considering individual cell lines, the metabolomics signature associated with response to U0126 treatment differed from what we had previously observed in the same cells following response to treatment with the PI3K inhibitor LY294002 or the HSP90 inhibitor 17-AAG (31), highlighting the potential value of metabolomics to identify a metabolic signature that is specifically associated with response to a particular therapy. Such a signature could become useful as higher magnetic field strengths are increasingly used in the clinic, providing improved sensitivity and resolution for detection of a wide range of metabolites in vivo. However, currently, translation of metabolomics signatures to the clinical setting using non-invasive in vivo MRS is limited by the relatively low sensitivity of MRS. Nonetheless, the metabolomics approach can serve to identify translatable biomarker candidates. In our studies, because modulation of PC and lactate were observed, and because tCho and lactate are the most readily detectable metabolites in the 1H spectrum in vivo, we focused on the metabolic pathways associated with those metabolites, and investigated glycolysis and choline metabolism.
When considering glucose metabolism, the metabolic sequelae of MAPK inhibition that were associated with inhibition of cell proliferation in our cells varied depending on the cell line investigated. We observed an increase in steady-state intracellular lactate, and an increase in glycolytic flux and lactate production in PC3 prostate cancer and in MCF-7 breast cancer cells, but a drop in intracellular lactate, glucose uptake and lactate production in A375 melanoma cells. Our findings in melanoma cells are consistent with previous publications, which reported that following treatment with a BRAF inhibitor, FDG-PET-detectable glucose uptake dropped in melanoma cells and tumors harboring the V600E BRAF mutation (28, 29). Similarly, an MRS-detectable drop in lactate levels was observed following MEK inhibition in cells that are BRAF dependent (30). Our observations in PC3 and MCF-7 cells are consistent with a previous study in which we showed a 13C-MRS detectable increase in the amount of hyperpolarized lactate produced from exogenous pyruvate in treated PC3 cells compared to controls. Furthermore, PC3 and MCF-7 cells investigated in this study are wild-type for BRAF, thus our findings in those cells are also consistent with previous work showing a drop in FDG uptake and lactate production following MAPK pathway inhibition in BRAF mutant cells, but not in BRAF wild type cells (independent of RAS status), and the finding that FDG uptake increased in a BRAF-mutant tumor that had developed resistance to treatment (28, 30).
AMPK and PI3K are known to play a significant role in controlling glucose homeostasis (45). Our findings indicate that in the case of PC3 and MCF-7 cells, PI3K and/or AMPK were activated following MAPK inhibition. Activation of the PI3K pathway following MAPK inhibition is well established as a feedback pathway that likely contributes to the lack of clinical response in patients treated with MAPK inhibitors, particularly when their tumors do not harbor a BRAF mutation (40). Activation of the PI3K pathway downstream of MAPK inhibition would be expected to increase glycolytic flux, as observed in our studies. Activation of AMPK following MAPK inhibition is less established. However, depletion of ATP following ERK inhibition has been reported in macrophages and astrocytes (46, 47) and AMPK activation could also be mediated by IKK, which is upregulated following MEK inhibition (48, 49). Importantly however, in the A375 melanoma cell line in which we saw a drop in glycolysis, activation of neither PI3K nor AMPK signaling was observed. Thus an increase in glycolysis could potentially serve as an indicator of the activation of feedback pathways that limit the efficacy of MAPK inhibitors.
In contrast to our findings regarding glycolysis, a drop in intracellular PC levels was consistently associated with MEK inhibition and was observed in all three cell lines investigated here (PC3, MCF-7 and A375). Our studies demonstrate that this effect was mediated by a drop in de novo PC synthesis. PC synthesis involves transport of choline into the cell via choline transporters, and choline phosphorylation by choline kinase (20). The drop in choline transporter expression observed in PC3 cells could be contributing to the drop in PC. PC levels could also be lower due to a drop in choline kinase activity, since the activity of this enzyme depends on ATP levels, and ATP dropped in our treated cells (50). Furthermore, in PC3 and MCF-7 cells, the drop in the PC level is similar to the drop in choline kinase α, but in A375 cells the drop in PC is much greater than the treatment-induced modulation of choline kinase α, suggesting that other factors are affected by U0126. However, when considering the data in all three cell lines, the consistent finding was a drop in the expression of choline kinase α, and this is likely the most significant factor contribution to our findings. Our findings are also consistent with previous reports showing an MRS-detectable drop in PC levels following treatment with U0126 in other breast and colon cancer models (26), and following treatment with Ras inhibitors in mouse fibroblasts (24), as well as other studies linking MAPK signaling to choline metabolism (20).
Further studies are needed to confirm our findings in vivo. Nonetheless, imaging of PC could serve to inform on the inhibition of MAPK signaling. Choline containing metabolites (mainly PC, choline and GPC) are readily detectable in vivo by 1H MRS as the so-called total choline (tCho) peak (20) and, whereas a drop in PC has also been reported in response to other therapeutic approaches, tCho could serve as a nonspecific indicator of drug delivery and drug target inhibition following treatment with MAPK pathway inhibitors. More significant, however, might be the imaging of glycolysis. In BRAF-dependent melanoma, inhibition of MAPK signaling has been particularly successful and FDG-PET has proved a useful tool for assessing response. In other cancer types, clinical response has been more limited, likely due to multiple active feedback pathways requiring combination therapies (40, 48). Our observations, combined with previous studies, suggest that imaging glycolysis, be it by FDG-PET, 1H MRS or hyperpolarized 13C MRS of pyruvate (11, 12, 28–30) could serve to detect the activation of such feedback pathways, predicting therapeutic resistance and potentially providing an important tool for improving the implementation of personalized cancer care.
Supplementary Material
Acknowledgments
Funding Sources: NIH grants R01 CA130819 and R01 CA154915.
The authors acknowledge NIH funding R01 CA130819 and R01 CA154915.
Abbreviations
- MRS
magnetic resonance spectroscopy
- MEK
mitogen-activated protein kinase kinase
- PI3K
phosphoinositide 3-kinase
- AMPK
AMP-activated protein kinase
- FDG
[18F]-2-fluoro-2-deoxy-D-glucose
- PET
positron emission tomography
- DNP
dynamic nuclear polarization
- GPC
glycerophosphocholine
- PC
phosphocholine
- MAPK
mitogen-activated protein kinase
- VEGFR
vascular endothelial growth factor receptor
- STR
short tandem repeat
- DMEM
Dulbecco’s Modified Eagle Medium
- DMSO
Dimethyl sulfoxide
- ERK
extracellular-signal-regulated kinases
- TMSP
Sodium 3-(trimethylsilyl)propionate-2,2,3,3-d4
- EDTA
Ethylenediaminetetraacetic acid
- MDPA
methylenediphosphonic acid
- PCA
principal component analysis
- RIN
RNA Intergrity Numbers
- HSP90
heat shock protein 90
- FDR
false discovery rate
- HK2
hexokinase 2
- PFKFB3
6-phosphofructo-2-kinase/fructose-2,6-biphosphatase 3
- IKK
I kappa beta kinase
References
- 1.Ward PS, Thompson CB. Metabolic reprogramming: a cancer hallmark even warburg did not anticipate. Cancer Cell. 2012;21:297–308. doi: 10.1016/j.ccr.2012.02.014. [DOI] [PMC free article] [PubMed] [Google Scholar]
- 2.Schulze A, Harris AL. How cancer metabolism is tuned for proliferation and vulnerable to disruption. Nature. 2012;491:364–373. doi: 10.1038/nature11706. [DOI] [PubMed] [Google Scholar]
- 3.Mullen AR, DeBerardinis RJ. Genetically-defined metabolic reprogramming in cancer. Trends Endocrinol Metab. 2012;23:552–559. doi: 10.1016/j.tem.2012.06.009. [DOI] [PMC free article] [PubMed] [Google Scholar]
- 4.Juweid ME, Cheson BD. Positron-emission tomography and assessment of cancer therapy. N Engl J Med. 2006;354:496–507. doi: 10.1056/NEJMra050276. [DOI] [PubMed] [Google Scholar]
- 5.Rohren EM, Turkington TG, Coleman RE. Clinical applications of PET in oncology. Radiology. 2004;231:305–332. doi: 10.1148/radiol.2312021185. [DOI] [PubMed] [Google Scholar]
- 6.Mellon EA, Lee SC, Pickup S, Kim S, Goldstein SC, Floyd TF, et al. Detection of lactate with a hadamard slice selected, selective multiple quantum coherence, chemical shift imaging sequence (HDMD-SelMQC-CSI) on a clinical MRI scanner: Application to tumors and muscle ischemia. Magn Reson Med. 2009;62:1404–1413. doi: 10.1002/mrm.22141. [DOI] [PMC free article] [PubMed] [Google Scholar]
- 7.Wijnen JP, Van der Graaf M, Scheenen TW, Klomp DW, de Galan BE, Idema AJ, et al. In vivo 13C magnetic resonance spectroscopy of a human brain tumor after application of 13C-1-enriched glucose. Magn Reson Imaging. 2010;28:690–697. doi: 10.1016/j.mri.2010.03.006. [DOI] [PubMed] [Google Scholar]
- 8.de Graaf RA, Mason GF, Patel AB, Behar KL, Rothman DL. In vivo 1H-[13C]-NMR spectroscopy of cerebral metabolism. NMR Biomed. 2003;16:339–357. doi: 10.1002/nbm.847. [DOI] [PubMed] [Google Scholar]
- 9.Chaumeil MM, Ozawa T, Park I, Scott K, James CD, Nelson SJ, et al. Hyperpolarized 13C MR spectroscopic imaging can be used to monitor Everolimus treatment in vivo in an orthotopic rodent model of glioblastoma. Neuroimage. 2012;59:193–201. doi: 10.1016/j.neuroimage.2011.07.034. [DOI] [PMC free article] [PubMed] [Google Scholar]
- 10.Dafni H, Larson PEZ, Hu S, Yoshihara HAI, Ward CS, Venkatesh HS, et al. Hyperpolarized 13C spectroscopic imaging informs on hypoxia-inducible factor-1 and Myc activity downstream of platelet-derived growth factor receptor. Cancer Res. 2010;70:7400–7410. doi: 10.1158/0008-5472.CAN-10-0883. [DOI] [PMC free article] [PubMed] [Google Scholar]
- 11.Lodi A, Woods SM, Ronen SM. Treatment with the MEK inhibitor U0126 induces decreased hyperpolarized pyruvate to lactate conversion in breast but not in prostate cancer cells. NMR Biomed. 2013;26:299–306. doi: 10.1002/nbm.2848. [DOI] [PMC free article] [PubMed] [Google Scholar]
- 12.Ward CS, Venkatesh HS, Chaumeil MM, Brandes AH, VanCriekinge M, Dafni H, et al. Noninvasive detection of target modulation following phosphatidylinositol 3-kinase inhibition using hyperpolarized 13C magnetic resonance spectroscopy. Cancer Res. 2010;70:1296–1305. doi: 10.1158/0008-5472.CAN-09-2251. [DOI] [PMC free article] [PubMed] [Google Scholar]
- 13.Brindle K. Watching tumours gasp and die with MRI: the promise of hyperpolarised 13C MR spectroscopic imaging. Br J Radiol. 2012;85:697–708. doi: 10.1259/bjr/81120511. [DOI] [PMC free article] [PubMed] [Google Scholar]
- 14.Nelson S, Kurhanewicz J, Vigneron D, Larson P, Harzstarck A, Ferrone M, et al. Proof of concept clinical trial of hyperpolarized C-13 pyruvate in patients with prostate cancer. ISMRM 20th annual meeting and exhibition; Melbourne, Australia. 2012; p. 274. [Google Scholar]
- 15.Day S, Kettunen M, Gallagher F, Hu DE, Lerche M, Wolber J, et al. Detecting tumor response to treatment using hyperpolarized 13C magnetic resonance imaging and spectroscopy. Nat Med. 2007;13:1382–1387. doi: 10.1038/nm1650. [DOI] [PubMed] [Google Scholar]
- 16.Kohler S, Yen Y, Wolber J, Chen A, Albers M, Bok R, et al. In vivo 13 carbon metabolic imaging at 3T with hyperpolarized 13C-1-pyruvate. Magn Reson Med. 2007;58:65–69. doi: 10.1002/mrm.21253. [DOI] [PubMed] [Google Scholar]
- 17.Witney T, Kettunen M, Day S, Hu D, Neves A, Gallagher F, et al. A comparison between radiolabeled fluorodeoxyglucose uptake and hyperpolarized 13C-labeled pyruvate utilization as methods for detecting tumor response to treatment. Neoplasia. 2009;11:574–582. doi: 10.1593/neo.09254. [DOI] [PMC free article] [PubMed] [Google Scholar]
- 18.Day S, Kettunen M, Krishna M, Mitchell J, Lizak M, Morris H, et al. Detecting response of rat C6 glioma tumors to radiotherapy using hyperpolarized [1–13C] pyruvate and 13C magnetic resonance spectroscopic imaging. Magn Reson Med. 2011;65:557–563. doi: 10.1002/mrm.22698. [DOI] [PMC free article] [PubMed] [Google Scholar]
- 19.Park I, Bok R, Ozawa T, Phillips J, James C, Vigneron D, et al. Detection of early response to temozolomide treatment in brain tumors using hyperpolarized 13C MR metabolic imaging. J Magn Reson Imaging. 2011;33:1284–1290. doi: 10.1002/jmri.22563. [DOI] [PMC free article] [PubMed] [Google Scholar]
- 20.Glunde K, Bhujwalla Z, Ronen S. Choline metabolism in malignant transformation. Nat Rev Cancer. 2011;11:835–848. doi: 10.1038/nrc3162. [DOI] [PMC free article] [PubMed] [Google Scholar]
- 21.Rice SL, Roney CA, Daumar P, Lewis J. The next generation of positron emission tomography radiopharmaceuticals in oncology. Semin Nucl Med. 2011;41:265–282. doi: 10.1053/j.semnuclmed.2011.02.002. [DOI] [PMC free article] [PubMed] [Google Scholar]
- 22.Monazzam A, Razifar P, Ide S, Rugaard Jensen M, Josephsson R, Blomqvist C, et al. Evaluation of the Hsp90 inhibitor NVP-AUY922 in multicellular tumour spheroids with respect to effects on growth and PET tracer uptake. Nucl Med Biol. 2009;36:335–342. doi: 10.1016/j.nucmedbio.2008.12.009. [DOI] [PubMed] [Google Scholar]
- 23.Nimmagadda S, Glunde K, Pomper M, Bhujwalla Z. Pharmacodynamic markers for choline kinase down-regulation in breast cancer cells. Neoplasia. 2009;11:477–484. doi: 10.1593/neo.81430. [DOI] [PMC free article] [PubMed] [Google Scholar]
- 24.Ronen SM, Jackson LE, Beloueche M, Leach MO. Magnetic resonance detects changes in phosphocholine associated with Ras activation and inhibition in NIH 3T3 cells. Br J Cancer. 2001;84:691–696. doi: 10.1054/bjoc.2000.1663. [DOI] [PMC free article] [PubMed] [Google Scholar]
- 25.Beloueche-Babari M, Jackson LE, Al-Saffar NM, Eccles SA, Raynaud FI, Workman P, et al. Identification of magnetic resonance detectable metabolic changes associated with inhibition of phosphoinositide 3-kinase signaling in human breast cancer cells. Mol Cancer Ther. 2006;5:187–196. doi: 10.1158/1535-7163.MCT-03-0220. [DOI] [PubMed] [Google Scholar]
- 26.Beloueche-Babari M, Jackson LE, Al-Saffar NM, Workman P, Leach MO, Ronen SM. Magnetic resonance spectroscopy monitoring of mitogen-activated protein kinase signaling inhibition. Cancer Res. 2005;65:3356–3363. doi: 10.1158/10.1158/0008-5472.CAN-03-2981. [DOI] [PubMed] [Google Scholar]
- 27.Venkatesh HS, Chaumeil MM, Ward CS, Haas-Kogan DA, James CD, Ronen SM. Reduced phosphocholine and hyperpolarized lactate provide magnetic resonance biomarkers of PI3K/Akt/mTOR inhibition in glioblastoma. Neuro Oncol. 2012;14:315–325. doi: 10.1093/neuonc/nor209. [DOI] [PMC free article] [PubMed] [Google Scholar]
- 28.Baudy A, Dogan T, Flores-Mercado J, Hoeflich K, Su F, van Bruggen N, et al. FDG-PET is a good biomarker of both early response and acquired resistance in BRAFV600 mutant melanomas treated with vemurafenib and the MEK inhibitor GDC-0973. EJNMMI Res. 2012;2:22. doi: 10.1186/2191-219X-2-22. [DOI] [PMC free article] [PubMed] [Google Scholar]
- 29.Tseng J, Stuart D, Aardalen K, Kaplan A, Aziz N, Hughes NP, et al. Use of DNA microarray and small animal positron emission tomography in preclinical drug evaluation of RAF265, a novel B-Raf/VEGFR-2 inhibitor. Neoplasia. 2011;13:266–275. doi: 10.1593/neo.101466. [DOI] [PMC free article] [PubMed] [Google Scholar]
- 30.Falck Miniotis M, Arunan V, Eykyn TR, Marais R, Workman P, Leach MO, et al. MEK1/2 Inhibition Decreases Lactate in BRAF-Driven Human Cancer Cells. Cancer Res. 2013;73:4039–4049. doi: 10.1158/0008-5472.CAN-12-1969. [DOI] [PubMed] [Google Scholar]
- 31.Lodi A, Ronen SM. Magnetic resonance spectroscopy detectable metabolomic fingerprint of response to antineoplastic treatment. PLoS ONE. 2011;6:e26155. doi: 10.1371/journal.pone.0026155. [DOI] [PMC free article] [PubMed] [Google Scholar]
- 32.Brandes A, Ward C, Ronen SM. 17-allyamino-17-demethoxygeldanamycin treatment results in a magnetic resonance spectroscopy-detectable elevation in choline-containing metabolites associated with increased expression of choline transporter SLC44A1 and phospholipase A2. Breast Cancer Res. 2010;12:R84. doi: 10.1186/bcr2729. [DOI] [PMC free article] [PubMed] [Google Scholar]
- 33.Su JS, Woods SM, Ronen SM. Metabolic Consequences of Treatment with AKT Inhibitor Perifosine in Breast Cancer Cells. NMR Biomed. 2012;25:379–388. doi: 10.1002/nbm.1764. [DOI] [PMC free article] [PubMed] [Google Scholar]
- 34.Hwang TL, Shaka AJ. Water suppression that works - Excitation sculpting using arbitrary wave-forms and pulsed-field gradients. J Magn Reson. 1995;112:275–279. [Google Scholar]
- 35.Ronen SM, Rushkin E, Degani H. Lipid metabolism in T47D human breast cancer cells: 31P and 13C-NMR studies of choline and ethanolamine uptake. Biochim Biophys Acta. 1991;1095:5–16. doi: 10.1016/0167-4889(91)90038-y. [DOI] [PubMed] [Google Scholar]
- 36.Tusher VG, Tibshirani R, Chu G. Significance analysis of microarrays applied to the ionizing radiation response. PNAS. 2001;98:5116–5121. doi: 10.1073/pnas.091062498. [DOI] [PMC free article] [PubMed] [Google Scholar]
- 37.Dang CV. Role of aerobic glycolysis in genetically engineered mouse models of cancer. BMC Biol. 2013;11:3. doi: 10.1186/1741-7007-11-3. [DOI] [PMC free article] [PubMed] [Google Scholar]
- 38.Plas D, Thompson C. Akt-dependent transformation: there is more to growth than just surviving. Oncogene. 2005;24:7435–7442. doi: 10.1038/sj.onc.1209097. [DOI] [PubMed] [Google Scholar]
- 39.Hoeflich KP, O’Brien C, Boyd Z, Cavet G, Guerrero S, Jung K, et al. In vivo Antitumor Activity of MEK and Phosphatidylinositol 3-Kinase Inhibitors in Basal-Like Breast Cancer Models. Clin Cancer Res. 2009;15:4649–4664. doi: 10.1158/1078-0432.CCR-09-0317. [DOI] [PubMed] [Google Scholar]
- 40.Pratilas CA, Solit DB. Targeting the mitogen-activated protein kinase pathway: physiological feedback and drug response. Clin Cancer Res. 2010;16:3329–3334. doi: 10.1158/1078-0432.CCR-09-3064. [DOI] [PMC free article] [PubMed] [Google Scholar]
- 41.Hardie DG. AMP-activated/SNF1 protein kinases: conserved guardians of cellular energy. Nat Rev Mol Cell Biol. 2007;8:774–785. doi: 10.1038/nrm2249. [DOI] [PubMed] [Google Scholar]
- 42.Mihaylova MM, Shaw RJ. The AMPK signalling pathway coordinates cell growth, autophagy and metabolism. Nat Cell Biol. 2011;13:1016–1023. doi: 10.1038/ncb2329. [DOI] [PMC free article] [PubMed] [Google Scholar]
- 43.Bathen TF, Sitter B, Sjøbakk TE, Tessem MB, Gribbestad IS. Magnetic Resonance Metabolomics of Intact Tissue: A Biotechnological Tool in Cancer Diagnostics and Treatment Evaluation. Cancer Res. 2010;70:6692–6696. doi: 10.1158/0008-5472.CAN-10-0437. [DOI] [PubMed] [Google Scholar]
- 44.Swanson M, Zektzer A, Tabatabai Z, Simko J, Jarso S, Keshari K, et al. Quantitative analysis of prostate metabolites using 1H HR-MAS spectroscopy. Magn Res Med. 2006;55:1257–1264. doi: 10.1002/mrm.20909. [DOI] [PubMed] [Google Scholar]
- 45.Schultze SM, Hemmings BA, Niessen M, Tschopp O. PI3K/AKT, MAPK and AMPK signalling: protein kinases in glucose homeostasis. Expert Rev Mol Med. 2012;14:e1. doi: 10.1017/S1462399411002109. [DOI] [PubMed] [Google Scholar]
- 46.Yung HW, Wyttenbach A, Tolkovsky AM. Aggravation of necrotic death of glucose-deprived cells by the MEK1 inhibitors U0126 and PD184161 through depletion of ATP. Biochem Pharmacol. 2004;68:351–360. doi: 10.1016/j.bcp.2004.03.030. [DOI] [PubMed] [Google Scholar]
- 47.Monick MM, Powers LS, Barrett CW, Hinde S, Ashare A, Groskreutz DJ, et al. Constitutive ERK MAPK activity regulates macrophage ATP production and mitochondrial integrity. J Immunol. 2008;180:7485–7496. doi: 10.4049/jimmunol.180.11.7485. [DOI] [PMC free article] [PubMed] [Google Scholar]
- 48.Gioeli D, Wunderlich W, Sebolt-Leopold J, Bekiranov S, Wulfkuhle JD, Petricoin EF, 3rd, et al. Compensatory pathways induced by MEK inhibition are effective drug targets for combination therapy against castration-resistant prostate cancer. Mol Cancer Ther. 2011;10:1581–1590. doi: 10.1158/1535-7163.MCT-10-1033. [DOI] [PMC free article] [PubMed] [Google Scholar]
- 49.Criollo A, Senovilla L, Authier H, Maiuri MC, Morselli E, Vitale I, et al. The IKK complex contributes to the induction of autophagy. EMBO J. 2010;29:619–631. doi: 10.1038/emboj.2009.364. [DOI] [PMC free article] [PubMed] [Google Scholar]
- 50.Jacobs R, Lingrell S, Dyck J, Vance D. Inhibition of hepatic phosphatidylcholine synthesis by 5-aminoimidazole-4-carboxamide-1-b-4-ribofuranoside is independent of AMP-activated protein kinase activation. J Biol Chem. 2007;282:4516–4523. doi: 10.1074/jbc.M605702200. [DOI] [PubMed] [Google Scholar]
Associated Data
This section collects any data citations, data availability statements, or supplementary materials included in this article.