

Abstract
Purpose
Predictive biomarkers are required to identify patients who may benefit from the use of BH3 mimetics such as ABT-263. This study investigated the efficacy of ABT-263 against a panel of patient-derived pediatric acute lymphoblastic leukemia (ALL) xenografts and utilized cell and molecular approaches to identify biomarkers that predict in vivo ABT-263 sensitivity.
Experimental Design
The in vivo efficacy of ABT-263 was tested against a panel of 31 patient-derived ALL xenografts comprised of MLL-, BCP- and T-ALL subtypes. Basal gene expression profiles of ALL xenografts were analyzed and confirmed by quantitative RT-PCR, protein expression and BH3 profiling. An in vitro co-culture assay with immortalized human mesenchymal cells was utilized to build a predictive model of in vivo ABT-263 sensitivity.
Results
ABT-263 demonstrated impressive activity against pediatric ALL xenografts, with 19 of 31 achieving objective responses. Among BCL2 family members, in vivo ABT-263 sensitivity correlated best with low MCL1 mRNA expression levels. BH3 profiling revealed that resistance to ABT-263 correlated with mitochondrial priming by NOXA peptide, suggesting a functional role for MCL1 protein. Using an in vitro co-culture assay, a predictive model of in vivo ABT-263 sensitivity was built. Testing this model against 11 xenografts predicted in vivo ABT-263 responses with high sensitivity (50%) and specificity (100%).
Conclusion
These results highlight the in vivo efficacy of ABT-263 against a broad range of pediatric ALL subtypes and shows that a combination of in vitro functional assays can be used to predict its in vivo efficacy.
Keywords: ABT-263, Xenografts, Leukemia, Pediatric Cancer, BH-3 Mimetic
Introduction
Despite significant improvements in the treatment of childhood acute lymphoblastic leukemia (ALL) over the past 5 decades, curing those patients who relapse with this most common pediatric malignancy remains a significant challenge (1). These relapse cases are often associated with broad-range drug resistance (2), which remains a significant problem, thus highlighting the need to develop new therapies. Since evasion of apoptosis is recognized as one of the hallmarks of cancer (3), recent drug development has focused on targeting key components of the apoptosis signaling pathway (4). The BCL2 family of proteins includes key regulators of the intrinsic apoptosis pathway, with cell fate being determined by the balance of pro-survival (e.g. BCL2 and MCL1) and pro-apoptotic (e.g. PUMA, NOXA) members (5, 6).
BH3-mimetic drugs, such as ABT-737 and its orally available analog ABT-263, were specifically designed to inhibit pro-survival BCL2 family proteins (7). While these drugs bind with high affinity to BCL2, BCLW and BCLXL, they exhibit lower affinity for MCL1 and A1 (7, 8). ABT-737 and ABT-263 have shown significant in vivo efficacy in preclinical xenograft models of hematolymphoid and solid malignancies (9, 10). While clinical trials of ABT-263 in adults have shown promising results (11-13), the main dose-limiting toxicity of thrombocytopenia has hindered its progression into pediatric patients.
Consistent with the low affinity of ABT-737 and ABT-263 for MCL1, several reports have shown an inverse correlation of MCL1 expression with sensitivity to these drugs (14-16). Other proteins in the BCL2 family have also been implicated in determining sensitivity or resistance. For example, high BCL2 expression was associated with increased ABT-737 sensitivity in Non-Hodgkin's lymphoma (NHL) cell lines and in murine fetal liver cells (15). However, recent studies provided evidence that MCL1 or pro-survival protein expression levels contribute to, but are not sufficient determinants of, resistance (17-20). Disruption of the interaction between MCL1 and BAK increased drug sensitivity (17, 18) suggesting that protein-protein interactions, rather than absolute levels, play a critical role in determining the sensitivity to BH3 mimetics. This interpretation was reinforced by “mitochondrial BH3 profiling”, which utilizes a panel of peptides derived from BH3-domains and their binding to anti-apoptotic proteins, to predict a cell's susceptibility to apoptosis induction (19, 20). Mitochondrial sensitivity to the BAD BH3 peptide, which has a pattern of interaction with anti-apoptotic proteins similar to ABT-737 and ABT-263, was shown to predict in vitro ABT-737 sensitivity in small cell lung cancer, lymphoma, ALL and acute myelogenous leukemia cell lines (19). Clinical responses to conventional chemotherapy in acute leukemia, multiple myeloma and ovarian cancer instead were found to correlate with mitochondrial sensitivity with promiscuous interacting BH3 peptides such as Puma BH3 (20).
The Pediatric Preclinical Testing Program previously reported that ABT-263 was effective as a single agent against in vivo models of childhood cancer, and in particular pediatric ALL xenografts (10). The results suggested preferential efficacy against 2 T-cell ALL (T-ALL) in comparison to B-cell Precursor (BCP)-ALL xenografts, albeit testing against a small panel of xenografts. In the current study we tested the in vivo efficacy of ABT-263 against a diverse panel of 31 molecularly characterized xenografts derived from T-ALL, BCP-ALL and infant ALL with translocations of the Mixed Lineage Leukemia (MLL) gene (infant MLL-ALL), as well as the efficacy of ABT-263 in combination with established drugs. In order to identify determinants of in vivo ABT-263 response, we then correlated gene expression profiles, mitochondrial BH3 profiling and in vitro ABT-263 sensitivity with single-agent ABT-263 efficacy. This powerful approach can be used as proof-of-principle to identify determinants of in vivo responses to other novel anti-leukemic drugs.
Materials and Methods
Xenografts and in vivo drug treatments
All experimental studies were conducted with approval from the Animal Care and Ethics Committee of the University of New South Wales (Sydney, Australia). Procedures by which we established continuous xenografts from childhood ALL biopsies in immune-deficient NOD/SCID (NOD.CB17-Prkdcscid/SzJ) or NOD/SCID, IL-2 receptor gamma negative (NOD.Cg-Prkdcscid Il2rgtm1Wjl/SzJ, NSG) mice, and tested their in vivo ABT-263 responses, have been described in detail previously (10, 21, 22). ALL subtypes were categorized at biopsy by their immunophenotype. Xenografts are available from the corresponding author upon request. ABT-263 (obtained from AbbVie under a standard Material Transfer Agreement) was administered orally at a dose of 100 mg/kg, daily for 21 days, as previously described (10). ABT-263 was also administered in combination with the conventional chemotherapeutic drugs vincristine (Baxter Healthcare, Toongabie, NSW, Australia; 1 mg/kg, Days 0 and 7), dexamethasone (Sigma-Aldrich, Castle Hill, NSW, Australia, 15 mg/kg, Mon-Fri × 2 weeks) or L-asparaginase (Aventis, Lane Cove, NSW, Australia; 1,500 U/kg, Mon-Fri × 2 weeks) on a Mon-Fri × 2 week schedule at least 1 hour following administration of the established drug. It was necessary to attenuate the dose of ABT-263 to 25 mg/kg when combined with vincristine, and to 50 mg/kg when combined with dexamethasone and L-asparaginase in order to achieve a tolerable dose.
Leukemia engraftment and progression were assessed in groups of 6-10 female mice each of 20-25 g by weekly enumeration of the proportion of human CD45+ cells in the peripheral blood (%huCD45+)(22). Individual mouse event-free survival (EFS) was calculated as the days from treatment initiation until the %huCD45+ reached 25%. EFS was represented graphically by Kaplan-Meier analysis. The efficacy of drug treatment was evaluated by leukemia growth delay (LGD), calculated as the difference between the median EFS of vehicle control and drug-treated cohorts, as well as an Objective Response Measure (ORM), modeled after stringent clinical criteria as described previously (21). Detailed methodology is presented in the Supplementary Methods and Supplementary Table S1. Responses were also expressed in a “COMPARE-like” format, which combines EFS and ORMs around the midpoint (0) representative of SD. Bars to the right or left of the midpoint represent Objective Responses or non-Objective Responses, respectively. Significant and non-significant differences in EFS distribution between control and treated cohorts are represented by solid or dotted bars, respectively. Xenografts were excluded from analysis if >25% of mice within a cohort experienced non-leukemia-related toxicity or morbidity. Mice were excluded from the study if they developed spontaneous murine lymphomas.
To evaluate interactions between drugs in vivo, Therapeutic Enhancement was considered if the EFS of mice treated with the drug combination was significantly greater than those induced by both single agents used at their maximum tolerated doses (23, 24).
Protein expression
Preparation of extracts from xenograft cells previously harvested from the spleens of engrafted mice, determination of protein concentrations, and analysis of cellular proteins by immunoblotting have been described in detail elsewhere (25). Membranes were probed with anti-MCL1 (Genesearch, Danvers, MA) and anti-actin antibodies (Sigma-Aldrich) followed by horseradish peroxidase–conjugated secondary antibody (GE Healthcare, Buckingham, UK). Signal was detected by Immobilon Western Chemiluminescent HRP Substrate (Merck Millipore, Billerica, MA) and visualized using a VersaDoc 5000 Imaging System (Bio-Rad, Hercules, CA). Data were analyzed with QuantityOne software (Version 4.00; Bio-Rad).
RNA extraction, real-time quantitative reverse transcription PCR (RT-qPCR) and gene expression analysis
Total RNA was extracted from xenograft cells, previously harvested from the spleens of engrafted mice and cryopreserved, using a combination of Trizol (Invitrogen, Carlsbad, CA) and Qiagen (Germantown, MD) RNeasy kit. RNA was purified with QIAGEN RNeasy spin columns according to the manufacturer's protocol. RNA purity was considered acceptable if the ratio of OD260/280 was between 1.8 and 2.0. For use in microarrays, the RNA integrity number was determined using an Agilent Bioanalyzer (Walbronn, Germany) and considered acceptable if >7.
RT-qPCR was carried out using standard techniques. First-strand cDNA was synthesized using 2 μg of total RNA, random primers (Roche, Mannheim, Baden-Württemberg, Germany), and M-MLV Reverse Transcriptase (Invitrogen). Primers and probes for MCL1 were purchased from Life Technologies (Carlsbad, CA) (Hs03043899_m1). Quantitative real-time PCR analysis was carried out in triplicate under the following cycling conditions: 50°C for 2 min and 95°C for 10 min, followed by 40 cycles of 95°C for 15 s and 60°C for 1 min. Elongation factor-1α (EF1α) was used as an internal normalization standard in each reaction (primers EF-1αF, 5′-CTGAACCATCCAGGCCAAAT-3′; EF-1αR, 5′-GCCGTGTGGCAATCCAAT-3′; Probe, 5′-VIC-AGCGCCGGCTATGCCCCTG-TAMRA-3′).
RNA samples were used to prepare cRNA with Illumina TotalPrep RNA Amplification Kit (Life Technologies). cRNA was then hybridized to Illumina Human Beadchip HT12 Arrays. Gene expression data sets were analyzed using GenePattern v3.2.3 as we have previously described (26). Gene expression data sets can be accessed at www.ncbi.nlm.nih.gov/geo (accession no. GSE52991; reviewer's access: http://www.ncbi.nlm.nih.gov/geo/query/acc.cgi?token=glwjgwusrnadfsr&acc=GSE52991). Benjamini and Hochberg's False Discovery Rate (FDR) (27) measurement and Smyth's unadjusted p-value (28) were used for evaluation of differential gene expression. Gene expression heatmaps were generated using GenePattern, whereby the range of color coding extends from minimum to maximum values per gene (per row). In each case red indicates high, and blue low, level of expression. Unsupervised hierarchical clustering was performed using the Hierarchical Clustering module in GenePattern using the entire 47,323 probes representative of 34,694 genes present in the Illumina Human Beadchip HT-12 Arrays.
Assessment of mitochondrial priming by BH3 profiling
Xenograft cells permeabilized by digitonin were exposed to BH3 peptides derived from BAD, NOXA and PUMA proteins, and mitochondrial depolarization measured using the fluorescent dye JC-1, as we have previously described(20). Comparison of mitochondrial depolarization of Non-Responders versus Responders was performed using a t-test (unpaired, 2-tailed).
In vitro cytotoxicity assays
The in vitro sensitivity of xenograft cells to ABT-263 was assessed by co-culture using hTERT-immortalized primary bone marrow mesenchymal stromal cells (hTERT-MSCs), as described previously (29) and detailed in the Supplementary Methods. Briefly, hTERT-MSCs were seeded at 2,000 cells/well in a 384-well plate (Greiner) in serum-free medium (AIM-V®, Life Technologies). After 24 h, 20,000 viable leukemia cells and ABT-263 were added to final concentrations of 1, 2.5, 5, 10, 25, 50, 100 and 1000 nM in duplicate. After 72 h of incubation live cell numbers were determined using 7-AAD analyses by flow cytometry (BD FACSCanto™II). Data were normalized using SPHERO™ AccuCount Particles (Spherotech, IL). Examples of flow cytometry analysis are included in Supplementary Figure S1. To build a predictive model of in vivo ABT-263 sensitivity we used upper and lower limits of the 95% confidence intervals of the proportion of live cells following exposure to 10 nM ABT-263 in vitro.
Statistical analysis
EFS curves were compared by logrank test. Differences in responses to single-agent ABT-263 in vivo between MLL-ALL, BCP-ALL and T-ALL xenografts were evaluated using one-way ANOVA and Tukey's multiple comparison analysis as well as Chi square test. Pearson's correlation test was utilized for all datasets with normal distribution, which included gene expression analysis versus LGD, and MCL1 Illumina mRNA versus MCL1 RT-qPCR mRNA levels. Spearman's correlation test was used to compare MCL1 RT-qPCR mRNA versus protein expression. Comparison of MCL1 RT-qPCR mRNA and protein levels between Non-Responders and Responders was performed using a Mann-Whitney test. Significance was inferred from tests with P-values lower than 0.05.
Results
Gene expression profiles of ALL xenografts reflect the primary disease
In order to identify cell and molecular determinants of in vivo ABT-263 responses in pediatric ALL, panels of a total of 31 xenografts were established from direct patient explants representative of MLL-ALL (8 infant MLL-ALLs, and one pediatric MLL-ALL, ALL-3), BCP-ALL (n=7) and T-ALL (n=15) and were characterized by gene expression profiling. The patient demographics focused on high-risk or poor outcome cases: infant MLL-ALL is a known high-risk ALL subtype; the T-ALL panel included three xenografts derived from Early T-cell Precursor (ETP) ALL patients (ETP-1, ETP-2 and ETP-3), a very high-risk subgroup (30); the BCP-ALL and non-ETP T-ALL panels included 4/7 and 9/12 patients, respectively, who had relapsed and/or died from their disease (22, 30, 31). More detailed descriptions of the infant MLL-ALL and expanded T-ALL xenograft panels will be reported elsewhere. Chromosomal translocations in the original biopsy sample, where known, are summarized in Supplementary Table S2.
Unsupervised hierarchical clustering of xenograft basal gene expression profiles revealed three distinct branches reflecting each leukemia subtype (Figure 1A). The MLL-ALL and BCP-ALL panels appeared more closely related and distinct from the T-ALL xenografts. Xenograft ALL-3 was originally classified by immunophenotype as a BCP-ALL but clustered with the MLL-ALLs. Upon further investigation it was confirmed that ALL-3 harbors an MLL gene rearrangement (Supplementary Table S2). The 4 MLL-ALLs with translocations involving chromosome 19 (MLL-6, -8, -14 and ALL-3) clustered separately from 2 MLL-ALLs with chromosome 4 translocations (MLL-2 and -7) (Figure 1A and Supplementary Table S2). The three ETP-ALLs, while not clustering as a separate branch, did cluster within the T-ALL panel (Figure 1A).
Figure 1. Comparison of MLL-ALL, BCP-ALL and T-ALL xenografts by gene expression profiling.
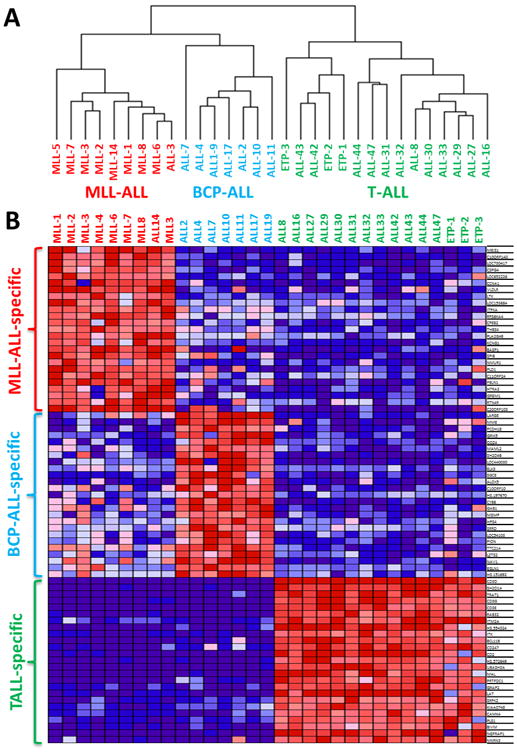
A total of 31 ALL xenografts (MLL-ALL, n=9; BCP-ALL, n=7; T-ALL, n=15) were profiled on Illumina Human HT-12 Beadchip arrays. (A) Non-supervised hierarchical clustering of all xenografts. (B) Heatmap of the top 25 up-regulated genes that were specific to MLL-ALL, BCP-ALL and T-ALL subtypes, ordered according to their P-value. The colours in the heatmaps represent the relative expression per gene across all samples. Red indicates relative high expression and blue indicates relative low expression.
We next identified subtype-specific differentially expressed genes using the LimmaGP (Cowley et al, manuscript in preparation) module in GenePattern, whereby each subtype was compared to the remaining two ALL subtypes (1-vs-rest comparison). Subtype specific genes were determined with a cut-off value of FDR<0.05 At this level of stringency there were 2,141 MLL-ALL specific genes, 643 BCP-ALL specific genes and 18,692 T-ALL specific genes (Supplementary Table S3). The top 25 differentially expressed probesets between each xenograft panel included previously identified subtype-specific genes, such as MEIS1, ZNF827 and CCNA1 in MLL-ALL (32), MME (CD10) in BCP-ALL, and components of the CD3 receptor (CD3D, CD3E, CD3G and CD247), CD2 and SH2D1A in T-ALL (33) (Figure 1B). ALL subtype specific genesets were identified using GSEApreranked module in GenePattern with FDR<0.05 (Supplementary Table S4). For MLL-ALL, the top 4 genesets reflected MLL-specific genesets, for BCP-ALL, 9 B-cell specific genesets were identified within the top 30 genesets and for T-ALL, 6 T-cell specific genesets were identified within the top 10 genesets. Therefore, these analyses confirmed the xenograft subtype classification according to the primary disease.
ABT-263 exhibits single-agent in vivo efficacy against a broad range of pediatric ALL subtypes
We previously reported the results of in vivo ABT-263 testing against a panel of 6 ALL xenografts, with higher sensitivity observed in 2 T-ALL compared with 4 BCP-ALL xenografts (10). In order to further investigate this possible subtype-specific in vivo efficacy of ABT-263 against pediatric ALL we expanded the analysis to the 31 xenografts described above. ABT-263 significantly delayed the progression of 29/31 xenografts tested (Table 1, Figure 2A-C and Supplementary Figures S2–S4). LGDs ranged from 0.5 (ALL-2; P=0.46) to 78 (ALL-31; P=0.0008) days. When stratified according to ALL subtype the median LGDs were 17.9 days for MLL (range 3.1–53.7), 25.8 days for BCP-ALL (range 0.5->37.9) and 29.6 days for T-ALL (range 4.0-78) (Figure 2D and Table 1). There was no significant differential efficacy of ABT-263 against any of the three ALL subtypes.
Table 1. In vivo responses of pediatric ALL xenografts to ABT-263.
| ALL lineage | Xenograft ID | EFS (days) | LGD (days) | P value (logrank) | Median ORM | ORM Heatmap | |
|---|---|---|---|---|---|---|---|
|
| |||||||
| Vehicle Control | ABT-263 | ||||||
| MLL-ALL | MLL-1 | 19.2 | 39.7 | 20.5 | 0.0003 | 6 | PR |
| MLL-2 | 14.8 | 26.8 | 12.0 | 0.002 | 6 | PR | |
| MLL-3 | 8.3 | 34.1 | 25.8 | 0.0002 | 8 | CR | |
| MLL-5 | 8.7 | 14.6 | 5.9 | 0.0006 | 2 | PD2 | |
| MLL-6 | 6.3 | 29.1 | 22.8 | 0.0002 | 2 | PD2 | |
| MLL-7 | 12.7 | 30.6 | 17.9 | 0.0002 | 6 | PR | |
| MLL-8 | 13.7 | 16.8 | 3.1 | 0.0002 | 0 | PD1 | |
| MLL-14 | 8.7 | 24.9 | 16.2 | 0.0006 | 2 | PD2 | |
| ALL-3 | 9.6 | 63.3 | 53.7 | 0.008 | 8 | CR | |
|
| |||||||
| BCP-ALL | ALL-2# | 4.7 | 5.2 | 0.5 | 0.46 | 0 | PD1 |
| ALL-4# | 1.5 | 28.6 | 27.1 | 0.029 | 2 | PD2 | |
| ALL-7 | 6.8 | 31.4 | 24.6 | 0.0003 | 8 | CR | |
| ALL-10 | 7.5 | 33.3 | 25.8 | 0.008 | 8 | CR | |
| ALL-11 | 20.2 | 56.3 | 36.1 | 0.008 | 8 | CR | |
| ALL-17# | 2.5 | 24.2 | 21.7 | 0.0001 | 2 | PD2 | |
| ALL-19# | 5.0 | >43 | >37.9 | 0.002 | 8 | CR | |
|
| |||||||
| T-ALL | ALL8# | 11.8 | 62.8 | 51.0 | 0.004 | 10 | MCR |
| ALL-16# | 18.2 | 85.5 | 67.3 | 0.0002 | 10 | MCR | |
| ALL-27 | 3.3 | 19.6 | 16.3 | 0.30 | 2 | PD2 | |
| ALL-29 | 4.4 | 48.8 | 44.0 | 0.0002 | 8 | CR | |
| ALL-30 | 5.3 | 16.2 | 10.9 | 0.004 | 2 | PD2 | |
| ALL-31 | 13.9 | 91.9 | 78.0 | 0.0008 | 10 | MCR | |
| ALL-32* | 6.7 | 18.9 | 12.2 | 0.0002 | 2 | PD2 | |
| ALL-33* | 6.0 | 37.8 | 31.8 | 0.0003 | 8 | CR | |
| ALL-42 | 1.9 | 5.9 | 4.0 | 0.0002 | 2 | PD2 | |
| ALL-43 | 14.0 | 43.9 | 29.9 | 0.0002 | 8 | CR | |
| ALL-44 | 11.4 | 27.2 | 15.8 | 0.0005 | 2 | PD2 | |
| ALL-47 | 11.9 | 41.5 | 29.6 | <0.0001 | 8 | CR | |
|
|
|||||||
| ETP-ALL | ETP-1 | 7.8 | 23.8 | 16.0 | 0.0002 | 6 | PR |
| ETP-2 | 14.2 | 44.7 | 30.5 | 0.0002 | 8 | CR | |
| ETP-3 | 20.0 | 32.5 | 12.5 | 0.0002 | 6 | PR | |
dose of ABT-263 reduced to 75mg/kg on day 9 (ALL-32) or day 13 (ALL-33) due to toxicity
in vivo ABT-263 sensitivity data previously reported(10).
Figure 2. In vivo single-agent ABT-263 responses of pediatric ALL xenografts.
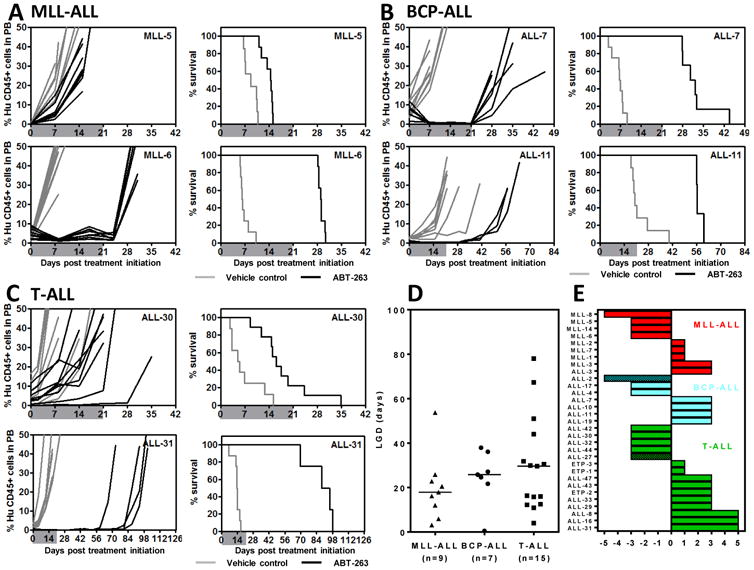
Responses of representative xenografts from the (A) MLL-ALL, (B) BCP-ALL and (C) T-ALL sub-panels treated with ABT-263 (100 mg/kg for 21 days, black lines) or vehicle control (gray lines). In each case the left panels represent the %huCD45+ of individual mice over time, while the right panels the proportion of mice remaining event-free. Shaded areas indicate the treatment period. (D) Comparison of the Leukemia Growth Delay (LGD) of ALL xenograft subtypes in response to ABT-263 treatment. Each data point represents a single xenograft; the horizontal bar represents the median. (E) “COMPARE-like” plot of the midpoint difference representing the median ORM of xenografts shown in Table 1.
ABT-263 elicited objective responses in 19/31 xenografts, with 3 MCRs, 11 CRs and 5 PRs (Table 1 and Figure 2). Figure 2E represents the in vivo ABT-263 responses of each xenograft panel in a “COMPARE-like” format. In agreement with the LGD data, no significant differences were observed between the ALL subtypes.
We previously showed that the in vivo sensitivity of a subset of these xenografts to an induction-type regiment of vincristine, dexamethasone and L-asparaginase (VXL) correlated with the clinical outcome of the patients from whom the xenografts were derived (34). However, the in vivo ABT-263 sensitivity of the same subset of xenografts did not correlate with their VXL responses (R=0.46, P=0.18; Supplementary Figure S5), indicating that ABT-263 can exert significant in vivo efficacy against ALL xenografts that are resistant to established drugs.
A complete summary of results is provided in Supplementary Figures S2–S4 and Supplementary Table S5, including total numbers of mice, number of mice that died (or were otherwise excluded), numbers of mice with events and average times to events, LGD values, as well as numbers in each of the ORM categories and “treated over controls” (T/C) values.
MCL1 gene expression correlates with in vivo ABT-263 sensitivity in ALL xenografts
We next analyzed basal BCL2 family gene expression levels in relation to in vivo ABT-263 sensitivity across the 31 xenografts using 2 approaches. Both approaches were applied to the entire xenograft cohort as well as all three subtypes separately. The first approach assessed the correlation between gene expression and progression delay (LGD) (Pearson product moment correlation coefficient), with a positive correlation denoting genes whose higher expression was associated with ABT-263 sensitivity, and vice versa. Using this approach, MCL1 expression correlated significantly with in vivo ABT-263 sensitivity across the entire xenograft panel (R=-0.43, P=0.015, Figure 3A), indicating that high MCL1 expression was associated with in vivo resistance. BCLXL/XS (R=0.79, P=0.01) and BCLW (R=0.69, P=0.039) showed significant positive correlations between expression and drug sensitivity in the MLL-ALL panel (Supplementary Figure S6, Supplementary Table S6). In contrast, no significant correlations were observed in the BCP-ALL panel (Supplementary Figure S7, Supplementary Table S6) while BID levels were negatively correlated with sensitivity in the T-ALL xenografts (R=-0.52, P=0.046) (Supplementary Figure S8, Supplementary Table S6).
Figure 3. Cell and molecular determinants of the in vivo sensitivity of pediatric ALL xenografts to ABT-263.
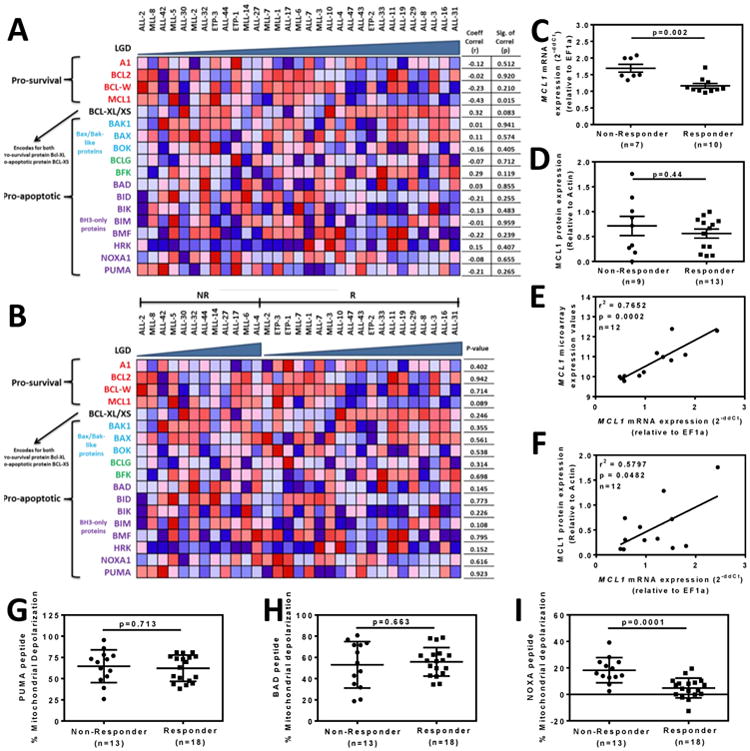
(A) Xenografts (columns) were ordered by increasing Leukemia Growth Delay (LGD) from left to right, with each row representing a BCL2 family member. (B) Xenografts were stratified into Non-Responders (NR) and Responders (R) then ordered by increasing LGD from left to right within each category. The colours in the heatmaps represent the relative expression per gene across all samples. Red indicates relative high expression and blue indicates relative low expression. (C) Comparison of MCL1 mRNA expression between Non-Responders and Responders by RT-qPCR. (D) Comparison of MCL1 protein expression between Non-Responders and Responders by immunoblot. (E) Correlation between MCL1 mRNA expression by microarray and RT-qPCR. (F) Correlation between MCL1 protein expression by immunoblot and MCL1 mRNA expression by RT-qPCR. In C-F each data point represents a single xenograft. (G-I) The percentage of mitochondrial depolarization induced by BH3 peptides derived from (G) PUMA, (H) BAD and (I) NOXA peptides in xenograft cells was plotted for individual xenografts stratified as Non-Responders or Responders according to Table 1.
In the second approach xenografts were stratified according to their ORM into Responders (PRs, CRs and MCRs) and Non-Responders (PDs and SDs) and differentially expressed genes were identified using an unadjusted P-value of ≤0.05 from an empirical Bayes moderated t-test (28). MCL1 was the BCL2 family member with the strongest differential expression among the entire xenograft panel between Responders and Non-Responders (Figure 3B and Supplementary Table S6). This was also the case for the MLL-ALL (P=0.027) and BCP-ALL (P=0.008) subtypes (Supplementary Figures S6 and S7, Supplementary Table S6). Among the MLL-ALL xenografts, differential expression of BIM (P=0.044); also reached statistical significance, being paradoxically lower in the Responders compared to Non-Responders (Supplementary Figure S6 and Supplementary Table S6). Similarly, HRK (P=0.005) was significantly increased in the BCP-ALL Responders (Supplementary Figure S7 and Supplementary Table S6), while BAK (P=0.03) and NOXA (P=0.049) were significantly increased in the T-ALL Non-Responders and Responders, respectively (Supplementary Figure S8 and Supplementary Table S6).
Both of the above analysis approaches had also been applied to the entire 34,694 genes represented on the Illumina Beadchip HT-12 Arrays, although no genes satisfied the significance or FDR cutoff criteria (data not shown).
Since MCL1 expression was the strongest overall predictor of in vivo ABT-263 response across the entire panel of 31 xenografts, we next assessed MCL1 expression at the mRNA and protein levels. While RT-qPCR analysis showed a significantly higher MCL1 expression in the Non-Responders (Figure 3C), this difference was not confirmed by increased MCL1 protein levels (Figure 3D, Supplementary Figure S9). Despite no significant difference in MCL1 protein levels between Non-Responders and Responders, MCL1 mRNA levels correlated between qRT-PCR and microarray (Figure 3E), and MCL1 protein levels significantly correlated with MCL1 mRNA expression measured by qRT-PCR (Figure 3F). MCL1 protein expression was also investigated after exposure of 2 Non-Responders and 2 Responders to ABT-263 in vitro, however no consistent differences were observed (data not shown). Due to these discrepancies in MCL1 protein expression, we next assessed BCL2 family protein function with respect to in vivo ABT-263 sensitivity using BH3 profiling of the entire xenograft panel
BH3 profiling identifies MCL1 function as a determinant of in vivo ABT-263 sensitivity
The mitochondrial priming assay measures mitochondrial sensitivity to peptides derived from the BH3 domains of pro-apoptotic BCL2 family proteins. The in vivo ABT-263 responses of the xenografts were then compared with the status of mitochondrial priming by the ability of BH3 peptides derived from PUMA, BAD and NOXA to cause mitochondrial depolarization in xenograft cells. PUMA BH3 interacts promiscuously with all 5 anti-apoptotic proteins, BAD BH3 interacts with BCL2, BCLXL and BCLW (like ABT-263), while NOXA BH3 interacts only with MCL1. Out of the three peptides only NOXA-induced mitochondrial depolarization significantly discriminated between Non-Responder and Responder groups (Figure 3G-I), implicating MCL1 protein function as a major determinant of in vivo ABT-263 response. The extent of mitochondrial depolarization did not correlate with leukemia progression (LGD) for any of the peptides tested (data not shown).
In vitro ABT-263 sensitivity of ALL xenografts predicts their in vivo responses
We next tested whether the in vitro ABT-263 responses of ALL xenografts predicted their in vivo sensitivity. Using a co-culture method (29) a predictive model was built using a training subset of 17 xenografts (Figure 4A). Exposure of xenograft cells to a range of ABT-263 concentrations (1 μM–1 nM) revealed that 10 nM gave the best discrimination between in vivo Non-Responders and Responders (Figure 4B and Supplementary Figure S10). Using the 95% confidence intervals of both Responder and Non-Responder groups, a three-tier classification was created. It was established that >14.9% live cells after drug treatment (lower limit of confidence interval of Non-Responders) stratified xenografts as Non-Responders, <8.0% (upper limit of confidence interval of Responders) as Responders, and those in between were considered as unclassified. Three xenografts (MLL-1, MLL-7 and ETP-3) were excluded from the analysis since their survival was not supported by the co-culture assay.
Figure 4. In vitro sensitivity of pediatric ALL xenograft cells to ABT-263 predicts their in vivo responses.

(A) Xenografts were sub-grouped into a Training Set to build a predictive model, and a Test Set to test the model. (B) Percentages of live leukemia cells after exposure to ABT263 (10 nM, 72 h). Each data point represents an individual xenograft. Lines indicate the geometric mean with 95% confidence interval indicated by the bars. (C) Actual and predicted in vivo ABT-263 responses of the test xenografts.
The in vivo ABT-263 responses of the remaining 11 xenografts, constituting the test set, were initially blinded. When the test set was classified using the predictive model 7 xenografts were correctly classified according to their in vivo ABT-263 responses (Figure 4C), 2 were incorrectly classified and 2 were unclassified., The sensitivity and specificity of the predictive method (Supplementary Figure S11) were 50% and 100%, respectively (leaving out of this assessment the two unclassified xenografts).
Live and dead cell analysis at 72 h for each xenograft is shown in Supplementary Figure S12, which includes the % live/dead cells, the absolute numbers of live/dead cells, and the number of live cells seeded and harvested. In addition, a comparison of the co-culture system versus single cell suspension was performed with 5 xenograft samples, and revealed the importance of the co-culture assay to assess ALL xenograft cell sensitivity to ABT-263 in vitro (Supplementary Figure S13).
In vivo efficacy of ABT-263 in combination with established chemotherapeutic drugs
We next sought to test the efficacy of ABT-263 in paired combinations with established drugs against xenografts representative of the two most common pediatric ALL subtypes, BCP-ALL and T-ALL. Three xenografts were selected based on their range of single-agent ABT-263 responses (ALL-2, resistant; ALL-19, intermediate; ALL-31, sensitive) (Table 1). Preliminary tolerability experiments showed that it was necessary to attenuate the dose of ABT-263 to 25 mg/kg when combined with vincristine, and to 50 mg/kg when combined with dexamethasone and L-asparaginase. Out of the three xenografts tested, the combination of ABT-263 with vincristine caused Therapeutic Enhancement only in ALL-31 and although for ALL-19 it induced an LGD of >73.7 days, due to variation among individual mice it did not reach statistical significance versus ABT-263 alone (Supplementary Tables S7 and S8 and Supplementary Figure S14). The dexamethasone/ABT-263 combination did not exert Therapeutic Enhancement for any xenografts, while ABT-263 in combination with L-asparaginase exerted Therapeutic Enhancement in ALL-31, and the P value approached significance for ALL-19. Thus, the expectation that ABT-263 would broadly enhance the in vivo efficacy of established chemotherapeutic drugs was not met.
Discussion
We report the utilization of a large panel of ALL xenografts to define the cell and molecular determinants of in vivo ABT-263 responses using gene expression profiling, BH3 profiling, and in vitro co-culture cytotoxicity assays. The principal findings of this study are: (1) ABT-263 is effective in vivo as a single agent against pediatric ALL xenografts; (2) MCL1 gene expression and MCL1 protein function correlate with in vivo ABT-263 sensitivity; and (3) an in vitro co-culture cytotoxicity assay is able to predict in vivo ABT-263 responses of ALL xenografts with a high level of sensitivity and specificity.
Xenograft models of pediatric ALL are recognized to accurately recapitulate several cellular and molecular features of the original disease, including blast morphology, immunophenotype, clonal selection, gene expression profiles and genetic lesions (22, 31, 35-37). Our results describe the subtype classification of a large panel of xenografts, which were appropriately clustered into MLL-ALL, BCP- and T-ALL subtypes by gene expression profiling. Differentially expressed genes and GSEA analysis within each subtype were consistent with the primary disease state, and a BCP-ALL xenograft previously established from a teenage female (31) was re-classified as an MLL-ALL based in this analysis. Sub-clusters within each xenograft subtype were also consistent with specific chromosomal translocations. For example, all 4 of the MLL-ALL xenografts harboring a translocation involving chromosome 19 co-clustered in 1 sub-branch of MLL-ALL, while the 3 ETP-ALLs appeared under 1 sub-branch of T-ALL.
Despite our previous report of ABT-263 efficacy testing against 6 ALL xenografts indicating a preferential effect against 2 T-ALL xenografts (10), in this study ABT-263 exhibited a broad spectrum of in vivo efficacy with no apparent subtype specificity, and induced regressions in 19 of 31 xenografts. However, all 3 xenografts that achieved MCRs were T-ALL, suggesting that ABT-263 may be particularly useful for the treatment of aggressive T-ALL cases. ABT-263 also induced regressions (2 PRs and 1 CR) in the 3 ETP-ALL xenografts. ETP-ALL arises from a subset of thymocytes that are recent emigrants from the bone marrow to the thymus, retaining stem-cell-like features and multilineage differential potential, and is a particularly aggressive and refractory T-ALL subtype (30).
In this study we also attempted to identify cell and molecular signatures that could be used to predict in vivo responsiveness to single-agent ABT-263. Studies primarily carried out using cultured cell lines have consistently identified elevated MCL1 expression to be associated with resistance to ABT-737 and ABT-263 (14-16, 38). While our study is no exception, we believe this to be the first report to strongly implicate MCL1 in resistance to ABT-263 in vivo using a large panel of direct-patient explants established as continuous xenografts. This relationship only became apparent when we restricted the gene expression analysis to the BCL2 gene family, a finding that we attribute to the heterogeneity in gene expression profiles between and within each xenograft subtype. Nevertheless, the molecular determinants of in vivo ABT-263 sensitivity in pediatric ALL are complex since additional, and occasionally paradoxically, BCL2 family genes were significantly associated with ABT-263 responses within individual xenograft subtypes.
A confounding factor in our analysis was that, while MCL1 mRNA expression determined by RT-qPCR correlated with MCL1 protein expression and microarray data, MCL1 protein expression did not reach statistical significance between the ABT-263 Responders and Non-Responders despite a higher trend in the Non-Responders (Figure 3D). Technical issues associated with the harvesting, purifying and cryopreservation of spleen-derived cells and the very short half-life of MCL1 (< 1 h) (39, 40) may have contributed to this lack of correlation due to MCL1 protein degradation (Supplementary Figure S15). Moreover, Gao and Koide reported that there are 2 MCL1 splice variants regulated by SF3B1, one with pro- and another with anti-apoptotic functions (41). However, we found no correlation between SF3B1 levels and drug sensitivity (data not shown). Similarly, Boiani et al. showed that the HSP70 protein BAG3 stabilizes MCL1, thereby extending its half-life (42). Similarly, we found no correlation between BAG3 expression and in vivo ABT-263 efficacy (data not shown). Due to the aforementioned complexity associated with correlating gene expression profiles and MCL1 protein expression with in vivo ABT-263 sensitivity, we next tested the established functional readouts of mitochondrial priming status by BH3 profiling and in vitro chemosensitivity testing. Mitochondrial depolarization induced by NOXA peptide correlated with in vivo ABT-263 sensitivity (Figure 3I), thereby strongly implicating MCL1 function. However, this finding differs from a previous report that identified a correlation between BIM, but not NOXA, peptide-induced mitochondrial depolarization and clinical complete response to conventional therapy using pediatric ALL biopsy samples (20).
Murine or human bone marrow-derived stromal cells improve the ex vivo survival of pediatric ALL cells (29, 43) while both co-culture and tetrazolium dye-based assays have been used for chemosensitivity testing in this disease (44-46). In our study ABT-263 sensitivity of pediatric ALL xenograft cells co-cultured with MSC-hTERT cells provided a sensitive (50%) and highly specific (100%) prediction of in vivo response. This model accurately predicted resistance, since all 5 of the in vivo Non-Responders were correctly identified. However, while both of the xenografts predicted to be Responders were correct, the model incorrectly predicted no response in 2 of the in vivo Responders. Therefore, this model could be further refined, since while it might accurately predict which patients are unlikely to respond, it can potentially fail to identify a subset of patients who may benefit from such treatment. Nevertheless, we believe this to be the first report of a functional assay that is able to accurately predict in vivo single-agent ABT-263 responses.
Despite substantial evidence, primarily using cultured cell lines, that ABT-737 and ABT-263 can potentiate the effects of standard chemotherapeutic drugs both in vitro and in vivo (9, 16, 47, 48), using stringent criteria we only observed Therapeutic Enhancement in 2 instances in which ABT-263 was combined with 3 established drugs against 3 xenografts. While our results are not sufficient to make broad conclusions for combining ABT-263 with these established drugs for patient management, we reason that this divergence from previous reports is due to the necessity to attenuate the ABT-263 dose in all of the combinations (down to 25 mg/kg in the case of vincristine), while maintaining the maximal ABT-263 dose (100 mg/kg) in the single-agent arms. Future investigations in which small molecule BCL2 inhibitors with reduced thrombocytopenic effects, such as ABT-199 (49, 50), are combined with established drugs in pediatric ALL may prove more beneficial.
In summary, BCL2-targeted agents appear as a promising class of anti-cancer drugs for the treatment of pediatric ALL, with no apparent specificity across MLL-ALL, BCP-ALL or T-ALL subtypes. MCL1 expression and function appear to be important determinants of in vivo ABT-263 sensitivity, while an in vitro co-culture assay predicted in vivo ABT-263 responses with high sensitivity and specificity. This combined cell and molecular analysis provides a proof-of-concept approach for prioritizing other novel drugs for pediatric ALL clinical trials, and for the identification of biomarkers predictive of in vivo response.
Supplementary Material
Statement of translational relevance.
Manipulation of the apoptosis pathway is an appealing strategy for cancer treatment using BH3 mimetics such as ABT-263, although predictive biomarkers are required to identify patients who may benefit from their use. This study showed that ABT-263 exhibited broad in vivo efficacy against preclinical xenograft models of pediatric acute lymphoblastic leukemia (ALL). High MCL1 expression, at the mRNA and protein level, correlated with in vivo ABT-263 resistance, which was confirmed functionally by BH3 profiling. In addition, in vitro co-culture assays predicted in vivo ABT-263 responses with high sensitivity and specificity. Therefore, a combination of functional assays could be used to predict ABT-263 activity in vivo. Given the strong efficacy of ABT-263 against a significant proportion of xenografts tested, these in-principle approaches could be included in the design of prospective clinical trials to determine if they can identify patients who may respond to treatment with this class of therapeutic agents.
Acknowledgments
Financial Support: This research was funded by grants from: the National Cancer Institute (NOI-CM-42216 and NOI-CM-91001-03); the Leukaemia Foundation of Australia; the Cancer Council New South Wales; the Krebsliga Zurich to BB; and the Foundation Kind und Krebs, the Hanne Liebermann Stiftung, and the Swiss National Research Foundation to JPB. SS is supported by Postdoctoral Fellowships from the Leukaemia Foundation of Australia and the Cure Cancer Australia Foundation, and an Early Career Fellowship from the Cancer Institute NSW. RBL is supported by a Fellowship from the National Health and Medical Research Council. The authors thank AbbVie Inc for providing ABT-263, the Tissue Resources Core Facility of St Jude Children's Research Hospital (Memphis, TN) for the provision of primary ETP-ALL samples, and Dr Dario Campana (St Jude Children's Research Hospital, Memphis, TN) for providing hTERT-immortalized MSCs. Children's Cancer Institute Australia for Medical Research is affiliated with the University of New South Wales and The Sydney Children's Hospitals Network.
Footnotes
Disclosure of conflict of interest: The authors declare no actual or perceived conflicts of interest.
Authorship Contributions: Contributions: HC, WK, AL, JPB, PJH, MAS, and RBL designed the study; SS, HC, LH, BS, KE, IB, ET, LJ and DMM performed the xenograft experiments; TNC carried out the BH3 profiling; VF performed the in vitro drug sensitivity testing; CB carried out biostatistics analysis on the in vivo experiments; SS, CS, MJC and WK carried out bioinformatics analysis; SS, HC, BB, RTK, AL, JPB, PJH, MAS and RBL interpreted the data and wrote the manuscript.
References
- 1.Hunger SP, Lu X, Devidas M, Camitta BM, Gaynon PS, Winick NJ, et al. Improved survival for children and adolescents with acute lymphoblastic leukemia between 1990 and 2005: a report from the children's oncology group. J Clin Oncol. 2012;30:1663–9. doi: 10.1200/JCO.2011.37.8018. [DOI] [PMC free article] [PubMed] [Google Scholar]
- 2.Ko RH, Ji L, Barnette P, Bostrom B, Hutchinson R, Raetz E, et al. Outcome of patients treated for relapsed or refractory acute lymphoblastic leukemia: a Therapeutic Advances in Childhood Leukemia Consortium study. J Clin Oncol. 2010;28:648–54. doi: 10.1200/JCO.2009.22.2950. [DOI] [PMC free article] [PubMed] [Google Scholar]
- 3.Hanahan D, Weinberg RA. Hallmarks of cancer: the next generation. Cell. 2011;144:646–74. doi: 10.1016/j.cell.2011.02.013. [DOI] [PubMed] [Google Scholar]
- 4.Cragg MS, Harris C, Strasser A, Scott CL. Unleashing the power of inhibitors of oncogenic kinases through BH3 mimetics. Nat Rev Cancer. 2009;9:321–6. doi: 10.1038/nrc2615. [DOI] [PubMed] [Google Scholar]
- 5.Chen L, Willis SN, Wei A, Smith BJ, Fletcher JI, Hinds MG, et al. Differential targeting of prosurvival Bcl-2 proteins by their BH3-only ligands allows complementary apoptotic function. Mol Cell. 2005;17:393–403. doi: 10.1016/j.molcel.2004.12.030. [DOI] [PubMed] [Google Scholar]
- 6.Kelly PN, Strasser A. The role of Bcl-2 and its pro-survival relatives in tumourigenesis and cancer therapy. Cell Death Differ. 2011;18:1414–24. doi: 10.1038/cdd.2011.17. [DOI] [PMC free article] [PubMed] [Google Scholar]
- 7.Oltersdorf T, Elmore SW, Shoemaker AR, Armstrong RC, Augeri DJ, Belli BA, et al. An inhibitor of Bcl-2 family proteins induces regression of solid tumours. Nature. 2005;435:677–81. doi: 10.1038/nature03579. [DOI] [PubMed] [Google Scholar]
- 8.Tse C, Shoemaker AR, Adickes J, Anderson MG, Chen J, Jin S, et al. ABT-263: a potent and orally bioavailable Bcl-2 family inhibitor. Cancer Res. 2008;68:3421–8. doi: 10.1158/0008-5472.CAN-07-5836. [DOI] [PubMed] [Google Scholar]
- 9.High LM, Szymanska B, Wilczynska-Kalak U, Barber N, O'Brien R, Khaw SL, et al. The Bcl-2 homology domain 3 mimetic ABT-737 targets the apoptotic machinery in acute lymphoblastic leukemia resulting in synergistic in vitro and in vivo interactions with established drugs. Mol Pharmacol. 2010;77:483–94. doi: 10.1124/mol.109.060780. [DOI] [PubMed] [Google Scholar]
- 10.Lock R, Carol H, Houghton PJ, Morton CL, Kolb EA, Gorlick R, et al. Initial testing (stage 1) of the BH3 mimetic ABT-263 by the pediatric preclinical testing program. Pediatr Blood Cancer. 2008;50:1181–9. doi: 10.1002/pbc.21433. [DOI] [PubMed] [Google Scholar]
- 11.Gandhi L, Camidge DR, Ribeiro de Oliveira M, Bonomi P, Gandara D, Khaira D, et al. Phase I study of Navitoclax (ABT-263), a novel Bcl-2 family inhibitor, in patients with small-cell lung cancer and other solid tumors. J Clin Oncol. 2011;29:909–16. doi: 10.1200/JCO.2010.31.6208. [DOI] [PMC free article] [PubMed] [Google Scholar]
- 12.Wilson WH, O'Connor OA, Czuczman MS, LaCasce AS, Gerecitano JF, Leonard JP, et al. Navitoclax, a targeted high-affinity inhibitor of BCL-2, in lymphoid malignancies: a phase 1 dose-escalation study of safety, pharmacokinetics, pharmacodynamics, and antitumour activity. Lancet Oncol. 2010;11:1149–59. doi: 10.1016/S1470-2045(10)70261-8. [DOI] [PMC free article] [PubMed] [Google Scholar]
- 13.Rudin CM, Hann CL, Garon EB, Ribeiro de Oliveira M, Bonomi PD, Camidge DR, et al. Phase II study of single-agent navitoclax (ABT-263) and biomarker correlates in patients with relapsed small cell lung cancer. Clin Cancer Res. 2012;18:3163–9. doi: 10.1158/1078-0432.CCR-11-3090. [DOI] [PMC free article] [PubMed] [Google Scholar]
- 14.Doi K, Li R, Sung SS, Wu H, Liu Y, Manieri W, et al. Discovery of marinopyrrole A (maritoclax) as a selective Mcl-1 antagonist that overcomes ABT-737 resistance by binding to and targeting Mcl-1 for proteasomal degradation. J Biol Chem. 2012;287:10224–35. doi: 10.1074/jbc.M111.334532. [DOI] [PMC free article] [PubMed] [Google Scholar]
- 15.Merino D, Khaw SL, Glaser SP, Anderson DJ, Belmont LD, Wong C, et al. Bcl-2, Bcl-x(L), and Bcl-w are not equivalent targets of ABT-737 and navitoclax (ABT-263) in lymphoid and leukemic cells. Blood. 2012;119:5807–16. doi: 10.1182/blood-2011-12-400929. [DOI] [PMC free article] [PubMed] [Google Scholar]
- 16.van Delft MF, Wei AH, Mason KD, Vandenberg CJ, Chen L, Czabotar PE, et al. The BH3 mimetic ABT-737 targets selective Bcl-2 proteins and efficiently induces apoptosis via Bak/Bax if Mcl-1 is neutralized. Cancer Cell. 2006;10:389–99. doi: 10.1016/j.ccr.2006.08.027. [DOI] [PMC free article] [PubMed] [Google Scholar]
- 17.Yamaguchi R, Janssen E, Perkins G, Ellisman M, Kitada S, Reed JC. Efficient elimination of cancer cells by deoxyglucose-ABT-263/737 combination therapy. PLoS One. 2011;6:e24102. doi: 10.1371/journal.pone.0024102. [DOI] [PMC free article] [PubMed] [Google Scholar]
- 18.Yamaguchi R, Perkins G. Mcl-1 levels need not be lowered for cells to be sensitized for ABT-263/737-induced apoptosis. Cell Death Diff. 2011;2:e227. doi: 10.1038/cddis.2011.109. [DOI] [PMC free article] [PubMed] [Google Scholar]
- 19.Certo M, Del Gaizo Moore V, Nishino M, Wei G, Korsmeyer S, Armstrong SA, et al. Mitochondria primed by death signals determine cellular addiction to antiapoptotic BCL-2 family members. Cancer Cell. 2006;9:351–65. doi: 10.1016/j.ccr.2006.03.027. [DOI] [PubMed] [Google Scholar]
- 20.Ni Chonghaile T, Sarosiek KA, Vo TT, Ryan JA, Tammareddi A, Moore Vdel G, et al. Pretreatment mitochondrial priming correlates with clinical response to cytotoxic chemotherapy. Science. 2011;334:1129–33. doi: 10.1126/science.1206727. [DOI] [PMC free article] [PubMed] [Google Scholar]
- 21.Houghton PJ, Morton CL, Tucker C, Payne D, Favours E, Cole C, et al. The pediatric preclinical testing program: description of models and early testing results. Pediatr Blood Cancer. 2007;49:928–40. doi: 10.1002/pbc.21078. [DOI] [PubMed] [Google Scholar]
- 22.Liem NL, Papa RA, Milross CG, Schmid MA, Tajbakhsh M, Choi S, et al. Characterization of childhood acute lymphoblastic leukemia xenograft models for the preclinical evaluation of new therapies. Blood. 2004;103:3905–14. doi: 10.1182/blood-2003-08-2911. [DOI] [PubMed] [Google Scholar]
- 23.Houghton PJ, Morton CL, Gorlick R, Lock RB, Carol H, Reynolds CP, et al. Stage 2 combination testing of rapamycin with cytotoxic agents by the Pediatric Preclinical Testing Program. Mol Cancer Ther. 2010;9:101–12. doi: 10.1158/1535-7163.MCT-09-0952. [DOI] [PMC free article] [PubMed] [Google Scholar]
- 24.Rose WC, Wild R. Therapeutic synergy of oral taxane BMS-275183 and cetuximab versus human tumor xenografts. Clin Cancer Res. 2004;10:7413–7. doi: 10.1158/1078-0432.CCR-04-1045. [DOI] [PubMed] [Google Scholar]
- 25.Bachmann PS, Gorman R, Papa RA, Bardell JE, Ford J, Kees UR, et al. Divergent mechanisms of glucocorticoid resistance in experimental models of pediatric acute lymphoblastic leukemia. Cancer Res. 2007;67:4482–90. doi: 10.1158/0008-5472.CAN-06-4244. [DOI] [PubMed] [Google Scholar]
- 26.Bhadri VA, Cowley MJ, Kaplan W, Trahair TN, Lock RB. Evaluation of the NOD/SCID xenograft model for glucocorticoid-regulated gene expression in childhood B-cell precursor acute lymphoblastic leukemia. BMC Genomics. 2011;12:565. doi: 10.1186/1471-2164-12-565. [DOI] [PMC free article] [PubMed] [Google Scholar]
- 27.Benjamini Y, Hochberg Y. Controlling the false discovery rate: a practical and powerful approach to multiple testing. J R Statist Soc. 1995;57:289–300. [Google Scholar]
- 28.Smyth GK. Linear models and empirical bayes methods for assessing differential expression in microarray experiments. Stat Appl Genet Mol Biol. 2004;3 doi: 10.2202/1544-6115.1027. Article3. [DOI] [PubMed] [Google Scholar]
- 29.Bonapace L, Bornhauser BC, Schmitz M, Cario G, Ziegler U, Niggli FK, et al. Induction of autophagy-dependent necroptosis is required for childhood acute lymphoblastic leukemia cells to overcome glucocorticoid resistance. J Clin Invest. 2010;120:1310–23. doi: 10.1172/JCI39987. [DOI] [PMC free article] [PubMed] [Google Scholar]
- 30.Coustan-Smith E, Mullighan CG, Onciu M, Behm FG, Raimondi SC, Pei D, et al. Early T-cell precursor leukaemia: a subtype of very high-risk acute lymphoblastic leukaemia. Lancet Oncol. 2009;10:147–56. doi: 10.1016/S1470-2045(08)70314-0. [DOI] [PMC free article] [PubMed] [Google Scholar]
- 31.Lock RB, Liem N, Farnsworth ML, Milross CG, Xue C, Tajbakhsh M, et al. The nonobese diabetic/severe combined immunodeficient (NOD/SCID) mouse model of childhood acute lymphoblastic leukemia reveals intrinsic differences in biologic characteristics at diagnosis and relapse. Blood. 2002;99:4100–8. doi: 10.1182/blood.v99.11.4100. [DOI] [PubMed] [Google Scholar]
- 32.Armstrong SA, Staunton JE, Silverman LB, Pieters R, den Boer ML, Minden MD, et al. MLL translocations specify a distinct gene expression profile that distinguishes a unique leukemia. Nat Genet. 2002;30:41–7. doi: 10.1038/ng765. [DOI] [PubMed] [Google Scholar]
- 33.Nordlund J, Kiialainen A, Karlberg O, Berglund EC, Goransson-Kultima H, Sonderkaer M, et al. Digital gene expression profiling of primary acute lymphoblastic leukemia cells. Leukemia. 2012;26:1218–27. doi: 10.1038/leu.2011.358. [DOI] [PMC free article] [PubMed] [Google Scholar]
- 34.Szymanska B, Wilczynska-Kalak U, Kang MH, Liem NL, Carol H, Boehm I, et al. Pharmacokinetic modeling of an induction regimen for in vivo combined testing of novel drugs against pediatric acute lymphoblastic leukemia xenografts. PLoS One. 2012;7:e33894. doi: 10.1371/journal.pone.0033894. [DOI] [PMC free article] [PubMed] [Google Scholar]
- 35.Anderson K, Lutz C, van Delft FW, Bateman CM, Guo Y, Colman SM, et al. Genetic variegation of clonal architecture and propagating cells in leukaemia. Nature. 2011;469:356–61. doi: 10.1038/nature09650. [DOI] [PubMed] [Google Scholar]
- 36.Clappier E, Gerby B, Sigaux F, Delord M, Touzri F, Hernandez L, et al. Clonal selection in xenografted human T cell acute lymphoblastic leukemia recapitulates gain of malignancy at relapse. The Journal of experimental medicine. 2011;208:653–61. doi: 10.1084/jem.20110105. [DOI] [PMC free article] [PubMed] [Google Scholar]
- 37.Schmitz M, Breithaupt P, Scheidegger N, Cario G, Bonapace L, Meissner B, et al. Xenografts of highly resistant leukemia recapitulate the clonal composition of the leukemogenic compartment. Blood. 2011;118:1854–64. doi: 10.1182/blood-2010-11-320309. [DOI] [PubMed] [Google Scholar]
- 38.Tahir SK, Wass J, Joseph MK, Devanarayan V, Hessler P, Zhang H, et al. Identification of expression signatures predictive of sensitivity to the Bcl-2 family member inhibitor ABT-263 in small cell lung carcinoma and leukemia/lymphoma cell lines. Mol Cancer Ther. 2010;9:545–57. doi: 10.1158/1535-7163.MCT-09-0651. [DOI] [PubMed] [Google Scholar]
- 39.Maurer U, Charvet C, Wagman AS, Dejardin E, Green DR. Glycogen synthase kinase-3 regulates mitochondrial outer membrane permeabilization and apoptosis by destabilization of MCL-1. Mol Cell. 2006;21:749–60. doi: 10.1016/j.molcel.2006.02.009. [DOI] [PubMed] [Google Scholar]
- 40.Nijhawan D, Fang M, Traer E, Zhong Q, Gao W, Du F, et al. Elimination of Mcl-1 is required for the initiation of apoptosis following ultraviolet irradiation. Genes Dev. 2003;17:1475–86. doi: 10.1101/gad.1093903. [DOI] [PMC free article] [PubMed] [Google Scholar]
- 41.Gao Y, Koide K. Chemical perturbation of Mcl-1 pre-mRNA splicing to induce apoptosis in cancer cells. ACS Chem Biol. 2013;8:895–900. doi: 10.1021/cb300602j. [DOI] [PMC free article] [PubMed] [Google Scholar]
- 42.Boiani M, Daniel C, Liu X, Hogarty MD, Marnett LJ. The stress protein BAG3 stabilizes Mcl-1 protein and promotes survival of cancer cells and resistance to antagonist ABT-737. J Biol Chem. 2013;288:6980–90. doi: 10.1074/jbc.M112.414177. [DOI] [PMC free article] [PubMed] [Google Scholar]
- 43.Manabe A, Coustan-Smith E, Behm FG, Raimondi SC, Campana D. Bone marrow-derived stromal cells prevent apoptotic cell death in B-lineage acute lymphoblastic leukemia. Blood. 1992;79:2370–7. [PubMed] [Google Scholar]
- 44.Klumper E, Pieters R, Veerman AJP, Huismans DR, Loonen AH, Hahlen K, et al. In vitro cellular drug resistance in children with relapsed/refractory acute lymphoblastic leukemia. Blood. 1995;86:3861–8. [PubMed] [Google Scholar]
- 45.Kumagai M, Manabe A, Pui CH, Behm FG, Raimondi SC, Hancock ML, et al. Stroma-supported culture of childhood B-lineage acute lymphoblastic leukaemia cells predicts treatment outcome. J Clin Invest. 1996;97:755–60. doi: 10.1172/JCI118474. [DOI] [PMC free article] [PubMed] [Google Scholar]
- 46.Pieters R, Loonen AH, Huismans DR, Broekema GJ, Dirven MWJ, Heyenbrok MW, et al. In vitro drug sensitivity of cells from children with leukemia using the MTT assay with improved culture conditions. Blood. 1990;76:2327–36. [PubMed] [Google Scholar]
- 47.Ackler S, Mitten MJ, Foster K, Oleksijew A, Refici M, Tahir SK, et al. The Bcl-2 inhibitor ABT-263 enhances the response of multiple chemotherapeutic regimens in hematologic tumors in vivo. Cancer Chemother Pharmacol. 2010;66:869–80. doi: 10.1007/s00280-009-1232-1. [DOI] [PubMed] [Google Scholar]
- 48.Kang MH, Kang YH, Szymanska B, Wilczynska-Kalak U, Sheard MA, Harned TM, et al. Activity of vincristine, L-ASP, and dexamethasone against acute lymphoblastic leukemia is enhanced by the BH3-mimetic ABT-737 in vitro and in vivo. Blood. 2007;110:2057–66. doi: 10.1182/blood-2007-03-080325. [DOI] [PubMed] [Google Scholar]
- 49.Souers AJ, Leverson JD, Boghaert ER, Ackler SL, Catron ND, Chen J, et al. ABT-199, a potent and selective BCL-2 inhibitor, achieves antitumor activity while sparing platelets. Nat Med. 2013;19:202–8. doi: 10.1038/nm.3048. [DOI] [PubMed] [Google Scholar]
- 50.Vandenberg CJ, Cory S. ABT-199, a new Bcl-2-specific BH3 mimetic, has in vivo efficacy against aggressive Myc-driven mouse lymphomas without provoking thrombocytopenia. Blood. 2013;121:2285–8. doi: 10.1182/blood-2013-01-475855. [DOI] [PMC free article] [PubMed] [Google Scholar]
Associated Data
This section collects any data citations, data availability statements, or supplementary materials included in this article.