

Significance
This research, for the first time to our knowledge, elucidates patterns of mRNA, protein, and microRNA expression uniquely associated with STAT3 signaling in basal-like but not other subtypes of breast cancer, indicating STAT3 as a potential subtype-specific regulator of breast cancer malignancy.
Abstract
Signal transducer and activator of transcription 3 (STAT3), a latent transcription factor associated with inflammatory signaling and innate and adaptive immune responses, is known to be aberrantly activated in a wide variety of cancers. In vitro analysis of STAT3 in human cancer cell lines has elucidated a number of specific targets associated with poor prognosis in breast cancer. However, to date, no comparison of cancer subtype and gene expression associated with STAT3 signaling in human patients has been reported. In silico analysis of human breast cancer microarray and reverse-phase protein array data was performed to identify expression patterns associated with STAT3 in basal-like and luminal breast cancers. Results indicate clearly identifiable STAT3-regulated signatures common to basal-like breast cancers but not to luminal A or luminal B cancers. Furthermore, these differentially expressed genes are associated with immune signaling and inflammation, a known phenotype of basal-like cancers. These findings demonstrate a distinct role for STAT3 signaling in basal breast cancers, and underscore the importance of considering subtype-specific molecular pathways that contribute to tissue-specific cancers.
Breast cancer (BC) is one of the most common causes of morbidity and mortality in the United States. In women, it is both the most prevalent form of cancer and the greatest killer (1). Through advances in treatment, detection, and phenotyping, deaths due to breast cancer have fallen significantly over the last several decades (2). However, there is one class of BC, basal-like, that continues to elude the treatment advances seen in other forms of BC (3). Although there continues to exist some debate over the classification of basal-like breast cancers (BLBCs), it is largely agreed-upon that the expression of basal cytokeratins along with negative estrogen receptor and human epidermal growth factor receptor 2 (HER2) receptor status separate this cancer from other breast cancer subtypes (4). Furthermore, recent microarray profiling techniques have classified the basal subtype further based on unique expression signatures compared with the six other breast cancer subtypes (luminal A, luminal B, basal-like, HER2-positive, normal breast-like, and claudin-low) (5, 6). BLBC is associated with poor prognosis due to both its highly aggressive nature and resistance to many modern chemotherapeutics (3). Furthermore, 15–20% of diagnosed BCs are classified as basal-like, resulting in a malignancy that affects a significant fraction of the population. Of these diagnoses, BLBC almost invariably presents as high-grade invasive ductal carcinoma, indicating both aggression and high likelihood of recurrence (3). Because of these factors, advances in BLBC treatment are critical in lessening the impact of this devastating disease.
Recent data have come to light indicating that BLBC tends to express high levels of the protein signal transducer and activator of transcription 3 (STAT3). Furthermore, STAT3 tends to be constitutively phosphorylated in these cancers (7). STAT3 signaling has been associated with poor prognosis in a wide variety of malignancies, being known to activate targets associated with invasion, proliferation, and angiogenesis (8). First discovered to be deleterious in head and neck squamous cell carcinoma, STAT3 has been shown to be a bad actor activated by both the epidermal growth factor receptor (EGFR) pathway and in response to constitutive interleukin 6 secretion found in many cancers (9, 10). Consequently, significant research has been aimed at inhibiting STAT3 activation and activity or inhibiting known downstream targets of STAT3. Despite these efforts, very few advances have been made in the clinical application of compounds against STAT3 or STAT3 target genes (8). Although much effort has been spent on therapeutic targeting of STAT3, many STAT3 downstream targets in cancer remain unknown. The majority of anti-STAT3 drugs attempt to either block dimerization or block STAT3 phosphorylation (8). Although effective from a mechanistic standpoint, this form of inhibition may only result in meager if detectable attenuation in a live system.
With the publication of The Cancer Genome Atlas (TCGA) datasets, a wealth of patient data containing many breast cancer samples has become available (11). Included in this database are data on protein expression and phosphorylation, along with microarray data for hundreds of human breast cancers. With these data it is possible to use computational techniques to analyze a wide range of expression patterns and their associated phenotypes and/or molecular signatures. Specifically, analysis of mRNA expression patterns associated with differences in STAT3 signaling among and between the patients of different cancer subtypes was undertaken. Through this process, a number of novel signatures associated with STAT3 in BLBC have come to light. These patterns were not seen in other subtypes of breast cancer, indicating gene expression activity that is uniquely correlated with STAT3 signaling in BLBC. Because STAT3 is known to be important for BLBC malignancy (7), elucidating its most highly affected downstream targets is of great importance to cancer diagnosis and therapy.
Results
Identification of STAT3 Target Genes Differentially Expressed in Basal-Like but Not Luminal A or Luminal B Breast Cancers.
Patients were selected and subdivided based on their STAT3 phosphoprotein levels (Materials and Methods and Fig. 1A), and regression analysis was performed on available microarray data (12) to detect differentially enriched genes. Patients were selected for tyrosine 705-phosphorylated STAT3 (pY-STAT3) levels with a z score of greater than 1 or less than −1 among the distribution of STAT3 phosphorylation levels for all patients studied (Fig. 1 E and F). Based on these criteria, from a pool of 170 luminal A patients, 32 were selected as pY-STAT3 high whereas 15 were selected as pY-STAT3 low. Among the luminal B patients, there were 6 pY-STAT3 high patients selected and 21 pY-STAT3 low patients selected. Finally in basal-like cancers, 6 pY-STAT3 high and 10 pY-STAT3 low patients were selected from the total of 67 patients (Dataset S1).
Fig. 1.
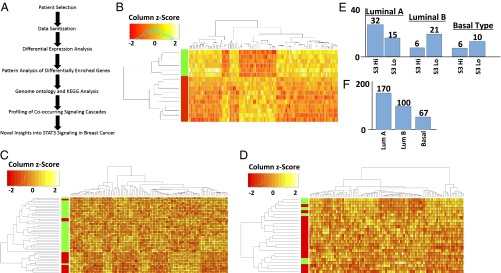
Selection and analysis of breast cancer patients with differential STAT3 signaling and cross-group comparison between cancer subtypes reveal a unique pattern of gene expression associated with the basal-like subtype of breast cancer. (A) Data pipeline and selection criteria used for the analysis of STAT3 signaling in human breast cancer patients. (B) Hierarchical cluster analysis and heatmap of the top 100 most significantly enriched genes in basal-like breast cancer patients selected for either high (green) or low (red) levels of STAT3 phosphorylation. (C) Cluster analysis of the top 100 most significantly enriched genes in luminal A breast cancer patients comparing high (green) and low (red) levels of STAT3 phosphorylation. (D) Hierarchical cluster analysis of the top 100 most significantly enriched genes in luminal B breast cancer patients associated with either high (green) or low (red) levels of STAT3 phosphorylation. (E) Graph of patients selected for each specified breast cancer subtype; 47 luminal A-type patients were selected, 27 luminal B-type patients were selected, and 16 basal-like patients were selected. Patients were selected by STAT3 levels with a z score of at least 1 over or −1 under the mean level of STAT3 phosphorylation for all analyzed breast cancer samples. (F) The total number of breast cancer patients available for analysis using RPPA phosphoprotein analysis.
Following patient selection, differential expression analysis was carried out via moderated t test on patient microarray data to determine which genes were most differentially expressed in each subtype. Following analysis, genes were ranked by false discovery rate (FDR)-adjusted P value and a cutoff of 0.1 was imposed on the group. Upon selection of genes with an FDR-adjusted P value of 0.1 or lower, it was determined that only those genes found in the basal-like patients are significantly differentially enriched between the two groups. Specifically, 438 basal-like genes were found to pass the statistical threshold in BLBC, whereas 0 luminal A genes and 3 luminal B genes pass this statistical cutoff (Dataset S2). This potentially indicates a more significant role for STAT3 signaling in basal-like compared with luminal A and luminal B cancers.
The differential enrichment of genes between groups was then visualized to classify emergent patterns. To this end, unsupervised hierarchical clustering was used. The top 100 differentially expressed genes for basal-type (Fig. 1B), luminal A (Fig. 1C), and luminal B (Fig. 1D) as determined by FDR-adjusted P value (13) are displayed from each group. Notable is that there is very little overlap between the most differentially expressed genes in each group, and although there are differentially expressed genes in luminal A and luminal B patients, very few pass the imposed statistical significance threshold. This analysis resulted in clearly coherent patterns of gene expression being readily visible in the basal-like condition (Fig. 1 B–D) but few discernable patterns were observed in luminal A or luminal B patients. Principal components analysis was applied to the differentially expressed genes in basal-like patients (Fig. S1), further illustrating the divide between the two groups on their highest variance components displayed on the x axis. A similar analysis of luminal A and luminal B cancers was not undertaken because so few genes managed to pass statistical cutoff and thus could not be meaningfully analyzed.
These data indicate a clear role for STAT3 signaling in basal-like breast cancers that is not evident in luminal A or luminal B cancers. This gives rise to the possibility of cancer subtype-specific signaling driven by the phosphorylation and activation of STAT3.
Identification of Differentially Regulated Genes Associated with STAT3 Signaling.
To select for genes most closely associated with STAT3 signaling, comparisons were performed between regression analyses. Regression analysis between basal-like STAT3 high and basal-like STAT3 low (blue) was compared against basal-like STAT3 high and luminal A STAT3 high (yellow) (Fig. 2A). Comparing the two resulted in 262 genes specifically associated with the STAT3 high phenotype. Next, the 438 genes differentially expressed between basal-like subclasses were compared against those differentially regulated in luminal B STAT3 high versus basal-type STAT3 high (green) (Fig. 2C). Finally, those genes differentially regulated in Fig. 2A were compared against those differentially regulated in Fig. 2C so as to select against genes that may be differentially regulated purely based on cancer subtype (luminal A/B vs. basal). This led to 84 genes being differentially expressed and specifically associated with the STAT3 high phenotype. These differentially regulated genes are listed in Dataset S2.
Fig. 2.

Comparative expression analysis, Gene Ontology analysis, and Kyoto Encyclopedia of Genes and Genomes (KEGG) protein interaction network analysis of human breast cancer data in BLBC. (A) Comparative analysis of differential gene expression comparing basal-like STAT3 high and basal-like STAT3 low patients (blue) with differential gene expression in basal-like STAT3 high and luminal A STAT3 high patients (yellow). (B) Comparative analysis of differential gene expression comparing basal-like STAT3 high and basal-like STAT3 low patients (blue) with luminal A STAT3 high and luminal B STAT3 high patients (red). (C) Comparative analysis of differential gene expression comparing basal-like STAT3 high and basal-like STAT3 low patients (blue) with basal-like STAT3 high and luminal B STAT3 high patients (green). (D) Comparative analysis of differential gene expression comparing basal-like STAT3 high and luminal A STAT3 high patients (yellow) with luminal A STAT3 high and luminal B STAT3 high patients (red). (E) Comparative analysis of differential gene expression comparing basal-like STAT3 high and luminal A STAT3 high patients (yellow) with basal-like STAT3 high and luminal B STAT3 high patients (green). (F) Comparative analysis of differential gene expression comparing the results from A with the results from C to select for genes uniquely regulated in basal-like cancers by STAT3 signaling. (G) Protein interaction network from differentially expressed genes detected when comparing basal-like STAT3 high with STAT3 low cancers. (H) Gene Ontology analysis using REVIGO of all 438 differentially expressed genes. (I) Gene Ontology analysis of only those genes selected in F as being uniquely STAT3-regulated in basal-like cancers.
To determine the effects of pY-STAT3 enrichment in basal-like cancers, interactome analysis was carried out (Fig. 2G and Fig. S2) (14). Direct interaction between multiple factors was apparent via both first- and second-order connections. Furthermore, the interactive net spread between a wide array of specifically cancer-associated factors. Next, Gene Ontology (GO) analysis was carried out against all 438 genes determined to be differentially regulated in the basal-like subtype (15) and then plotted (Fig. 2H) (16). Subsequently, the same analysis was carried out for the 84 genes specifically selected to be differentially regulated in all cases (Fig. 2I). Hypergeometric tests were carried out for each enriched GO term, and significant enrichments (adjusted P value of 0.1 or less) are indicated as bold text in Table S1. In both groups the highest-scoring ontologies are those associated with immunological signaling and innate immune response. Basal-like cancers are known for their aberrant immunological signaling and associated proinflammatory conditions (17). Not only does STAT3 signaling differentially affect a wide array of genes in basal-like cancers but many of these genes are specifically known to be cancer-associated factors. Most critically, many of these genes are associated with inflammatory signaling and the immune response, a process intimately linked with cancer invasion, proliferation, and metastasis.
STAT3 Phosphorylation Is Closely Associated with JNK and p70S6K Phosphorylation in Basal-Like Cancers.
To elucidate signaling pathways closely tied to STAT3 signaling in the different cancer subtypes, reverse-phase protein array (RPPA) data from TCGA were analyzed (Fig. 3). Hierarchical cluster analysis was performed on STAT3 high and STAT3 low patients selected as previously described in all three cancer subtypes (Fig. 3 A–E). In each subtype, STAT3 phosphorylation was most closely correlated with signaling cascades known to be associated with human cancers. In basal-like cancers (Fig. 3 A and B), STAT3 signaling was most closely associated with p70S6K phosphorylation and JNK signaling. Plotting the quantified phosphoprotein levels between STAT3 Y705 phosphorylation, p70S6K T389 phosphorylation, and JNK T183 and T185 phosphorylation clearly indicated a positive correlation between these signaling systems. Although p70S6K is mostly associated with ribosomal phosphorylation, it has also been shown to have a role in transcription of downstream targets (18), indicating some potential synergies with STAT3. JNK, on the other hand, is well-known to be an upstream activator of STAT3 (19). JNK signaling in breast cancer is known to phosphorylate STAT3 at serine 727 and leads to increased transcriptional activity within the nucleus (20).
Fig. 3.
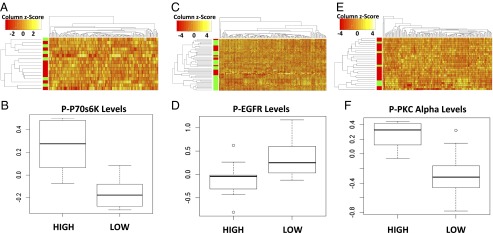
Analysis of phosphoprotein data in different cancer subtypes reveals that STAT3 most closely correlates with significantly different signaling pathways based on subtype. (A) Hierarchical cluster analysis of RPPA data comparing STAT3 high (green) with STAT3 low (red) patients in basal-like cancers. (B) Boxplot of normalized phospho-STAT3 levels and its most closely clustering phosphoprotein p70S6K. (C) Hierarchical cluster analysis of RPPA data comparing STAT3 high (green) with STAT3 low (red) patients in luminal A cancers. (D) Boxplot of normalized STAT3 levels and its next most closely correlated partner phospho-EGFR in luminal A patients. (E) Hierarchical cluster analysis of RPPA data comparing STAT3 high (green) with STAT3 low (red) patients in luminal B breast cancer patients. (F) Boxplot of normalized STAT3 levels and its most closely correlated protein, phospho-PKCα. Box plots represent data quartiles with whiskers indicating variability no more than 1.5 times the interquartile range.
Conversely, patients classified as luminal A or luminal B displayed phosphoprotein-level correlation notably different from that of the basal-like patients. STAT3 phosphorylation in luminal A patients (Fig. 3 C and D) was most closely associated with SRC Y527 and EGFR Y1068 phosphorylation, whereas in luminal B-type breast cancers PKC α S657 and YB-1 S102 phosphorylation most closely correlated with STAT3 phosphorylation (Fig. 3 E and F).
Through this analysis, it was clear that different breast cancer subtypes activate the STAT3 signaling pathway through disparate mechanisms. This is consistent with previous work indicating that STAT3 is phosphorylated by a wide variety of upstream proteins, but uniquely demonstrates that specific upstream STAT3 activators are separated by cancer subtype in human patients.
Distinctive Expression Patterns of Cancer-Specific MicroRNAs Are Associated with STAT3 Signaling in Different Breast Cancer Subtypes.
In addition to protein-coding genes, it is clear that short noncoding RNAs are critical modulators of cancer malignancy (21). To determine whether microRNA (miRNA) expression correlated with STAT3 signaling, available miRNA data were analyzed for unique patterns associated with different human patient subtypes (Fig. 4). MicroRNA profiles were divided into pY-STAT3 high and pY-STAT3 low patient groups in each cancer subtype, and negative binomial regression was used to detect significantly differentially expressed miRNA-specific transcripts. Subsequent to analysis, an FDR-adjusted P-value threshold of 0.1 was used to select only transcripts of highest statistical significance (Table S2). In basal-type cancers, 13 miRNAs were determined to be differentially expressed between the STAT3 high and STAT3 low subgroups (Table S2). In luminal A breast cancers, 10 miRNAs were determined to be differentially expressed. Finally, in luminal B cancers, only 5 miRNAs were differentially expressed to the significance threshold. Furthermore, global regulation differences were analyzed via regularized log transformation followed by hierarchical cluster analysis (Fig. 4 D–F). Global changes in miRNA expression were not readily detectable in any analyzed group, indicating that, although STAT3 does affect a small population of miRNAs, this signaling mechanism has little effect on overall miRNA abundance in human patients. In both luminal A and B subtypes, there was no readily detectable difference in miRNAs between STAT3 high and STAT3 low groups, further supporting the conclusion that STAT3 signaling does not have a widespread effect on miRNA regulation in human patients. Furthermore, miRNAs in each case were specifically associated with cancer (Table S2), and those in basal-like malignancies (Fig. 4G) were highly associated with invasion, metastasis, and epithelial–mesenchymal transition (EMT).
Fig. 4.
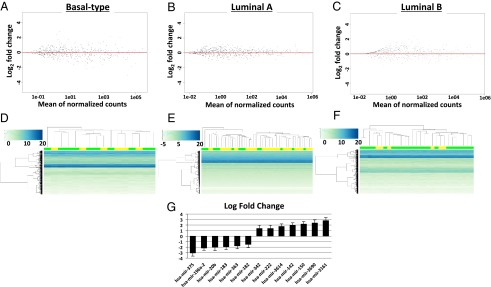
Analysis of human patient miRNA expression data based on negative binomial distribution. (A) Plot of mean normalized counts compared against log2 fold change of total miRNA data in STAT3 high versus STAT3 low basal-like breast cancer patients. (B) Similar analysis of STAT3 high versus STAT3 low miRNA expression in luminal A breast cancer patients. (C) Log2 fold change versus mean normalized count value for luminal B breast cancers comparing STAT3 high with STAT3 low patients. (D) Histogram for the top 500 most abundantly expressed miRNAs in basal-like patients. (E) Histogram for the top 500 most abundantly expressed miRNAs in luminal A breast cancer patients. (F) Histogram for the top 500 most abundantly expressed miRNAs in luminal B breast cancer patients. For all histograms: STAT3 high, yellow; STAT3 low, green. (G) Graph of log2 fold change in significantly differentially expressed miRNAs detected in basal-like breast cancer patients. Bars indicate standard of error.
Discussion
Despite the extensive investigation into STAT3 signaling in human cancers, there has been little research to date on how STAT3 activation affects different breast cancer subtypes. Although a plethora of STAT3’s downstream targets have been identified, little is known regarding how STAT3 signaling affects cancer progression as a whole. Through unbiased analysis of up-regulated genes and miRNAs specifically correlated with STAT3 phosphorylation in a large population of human breast cancer patients, targets specifically associated with STAT3 signaling in vivo were identified and their contributions to mRNA expression in different breast cancer subtypes were quantified.
Herein for the first time, to our knowledge, large-scale analysis of human breast cancer patients and the effects of STAT3 signaling based on BC subtype have been analyzed and categorized. Although the importance of analyzing subtype-specific molecular pathways in cancer has long been understood, this phenomenon has never been analyzed in relation to STAT3 signaling. From this analysis, pY-STAT3 has been shown to have wide-reaching effects in basal-like cancers, controlling an array of genes associated with immune signaling, innate defense response, and inflammatory signaling (Fig. 2I). Moreover, STAT3 signaling in luminal A or luminal B cancers does not correlate significantly with any widespread changes in gene regulation. Although we must note that this may be due to a greater heterogeneity in the definition of what constitutes luminal A or luminal B cancers, it is clear that basal-like cancers fit into their own class with regard to STAT3 signaling.
It is interesting to note the disparity in relative numbers of STAT3 high and STAT3 low cases between the different tumor subtypes. Patients in the luminal A population were much more likely to possess a pY-STAT3 high phenotype, whereas those in the luminal B population were much more likely to have a pY-STAT3 low phenotype. Despite this difference, very few genes were identified as expressed differentially between these groups. This may indicate that although STAT3 is activated variably between tumor subtypes, the overall mechanisms by which STAT3 affects gene expression are multifactorial and may not be entirely correlated with STAT3 phosphorylation. This concept is further reinforced by the high levels of differential gene expression in the basal-like population despite not having significant differences in the total amount of STAT3 phosphorylation.
Importantly, this analysis elucidates that STAT3 signaling may in fact be intricately linked with inflammatory processes in basal-like cancers, which are commonly associated with poor prognosis (22). This pattern is not apparent in epithelial breast malignancies. Because the aberrant immunological processes in basal-like cancers are so commonly associated with difficulty in treatment and increased mortality, STAT3 signaling may be a promising target for subtype-specific breast cancer treatment. With the increasing number of therapeutic molecules specifically targeted toward STAT3 coming through clinical trials (23–25), the inclusion of these compounds in subtype-specific breast cancer treatment may be a promising avenue. This analysis yields a far-reaching protein interaction network and potential associations with inflammation and aberrant immunological cell recruitment, a common problem associated with many basal-like cancers and a prognostic factor when assessing patient survival (17).
Furthermore, protein and phosphoprotein data indicate distinct synergies between STAT3 and the p70S6K and JNK pathways in basal-like cancers. This is distinguished from the P-SRC and P-EGFR pathways enriched in luminal A patients, and the P-PKC α and P-YB-1 pathways seen in luminal B patients. The JNK pathway has a wide array of downstream targets and has been previously shown to phosphorylate STAT3 at serine 727, an important step in its activation of downstream targets (20). In this case, hyperactivation of the JNK pathway combined with high levels of STAT3 tyrosine 705 phosphorylation may lead to more efficient transcriptional activation of STAT3 target genes. Along with JNK, p70S6K is a protein that has been previously studied for its deleterious effects in cancer (26). Although no previous connection with STAT3 signaling has been made, p70S6K is known to up-regulate hypoxia inducible factor 1 α (HIF1α) protein expression, a known STAT3 binding partner, associated with increased angiogenesis and metastatic capacity (27–29). In breast cancer cells specifically, it has been shown that both STAT3 phosphorylation and HIF1α expression are required for the optimal transcription of a wide array of cancer-promoting factors, as these proteins bind cooperatively at many genomic loci (29). Through the synergistic activation of these distinct targets, STAT3 may be more optimally able to initiate transcription of metastasis and survival-promoting proteins.
Along with the phosphoprotein and mRNA expression data, miRNA data analysis yielded a significant number of cancer-associated miRNAs in each subgroup (Table S2). Despite the oncogenic nature of many of these miRNAs, there is no overlap between their expression and cancer subtype. Basal-like cancers had both the highest incidence of differentially expressed miRNAs as well as the highest percentage of cancer-associated miRNAs (Table S2). The most interesting of these are mir-222 and mir-20b. mir-222 is a known oncomir, thought to be critically associated with EMT (30). It is more highly expressed in basal-like breast cancers compared with luminal cancers, and potentially targets adiponectin receptor 1 along with a number of other critical targets (31). Furthermore, mir-222 knockdown has been shown to induce apoptosis and alter E-cadherin expression, limiting EMT in breast cancer cells (32). This miRNA was determined to be significantly up-regulated during our analysis and is clearly associated with basal-like breast cancer as well as increased proliferation, invasion, and potentially metastasis.
Along with mir-222, another promising target, mir-20b, was discovered to be significantly down-regulated in STAT3 high basal-like cancer patients (Fig. 4G). mir-20b is very interesting because it has a previous association with HIF1α (33). Recent findings indicate that mir-20b reduces vascular endothelial growth factor (VEGF) expression in MCF7 breast cancer cells by affecting HIF1α and STAT3 levels, which bind cooperatively to the VEGF promoter (33). Intriguingly, this screen detected multiple miRNAs regulating the expression of HIF1α and HIF1α/STAT3-activated targets. In each case, miRNA expression follows the pattern of increasing overall HIF1α expression and increasing the possibility of cooperative binding with STAT3.
This analysis has revealed a number of striking conclusions about the nature of STAT3 in human breast cancers, specifically the following. (i) STAT3 signaling is associated with the expression of a large number of genes in basal-like but not luminal A or B breast cancers. (ii) Targets of STAT3 signaling in basal-like breast cancers are largely classified as immunological and inflammatory mediators. (iii) STAT3 phosphorylation levels correlate with different cancer-associated signaling molecules in different human cancer subtypes. (iv) Whereas STAT3 does not have a significant effect on global miRNA levels, distinct miRNA expression patterns are observed to be correlated with STAT3 signaling in each different cancer subtype. With these findings, the goal of pharmacologically inhibiting STAT3 becomes ever-more pressing with regard to breast cancer, and specifically would be indicated for BLBCs. The data herein indicate a clear correlation between STAT3 signaling and a wide array of downstream targets known to be deleterious in cancer, and this connection is only seen in basal-like tumors. It is anticipated that BLBC patients may benefit most significantly from chemotherapeutic intervention targeted directly toward STAT3. Because basal-like cancers do not respond to frontline breast cancer chemotherapies as effectively as the other subtypes, it becomes critical to find a novel tool in the oncologist’s toolbox to fight this disease. These data indicate that anti-STAT3 agents may prove an excellent therapy in basal-like breast cancers.
Materials and Methods
Selection of Patient Data from TCGA.
First, breast cancer patients for each analyzed subtype (luminal A, luminal B, and basal-like) were selected based on pY-STAT3 levels. Patients with a z score greater than +1 (STAT3 high) or less than −1 (STAT3 low) compared with the overall distribution were selected for comparison as plotted using the cBioPortal web application (www.cbioportal.org/public-portal/index.do) from Memorial Sloan Kettering Cancer Center (34). All data used in this study are derived from TCGA Nature 2012 dataset (11) comprising 825 total samples. All phosphoprotein and expression data for the previously selected patients were then downloaded from the data portal on TCGA website (https://tcga-data.nci.nih.gov/tcga). In all cases, downloaded data were TCGA level 3, the most highly processed data (https://tcga-data.nci.nih.gov/tcga/tcgaDataType.jsp) from each experimental type.
Expression Analysis of Human Patient Microarray Data.
Following download, human mRNA expression data were loaded from each patient into a single spreadsheet and uploaded to the GenePattern web software suite run by the Broad Institute at Harvard University (12). Patient data were analyzed for differential gene expression using the ComparativeMarkerSelection tool comparing STAT3 high and STAT3 low genes for each subtype. This tool uses a moderated t test to make pairwise comparisons within the dataset and select for differentially enriched targets. All results were subsequently downloaded from GenePattern and the top 100 differentially expressed genes were selected and hierarchically clustered via the complete linkage method using the R hclust function (35). Clusters were then mapped for pattern visualization for each patient subtype using the Gplots R package.
Gene Ontology and KEGG Pathway Analysis of Differentially Expressed Genes in Basal-Like Breast Cancer Patients.
Subsequent to expression analysis, differentially expressed genes were subjected to Gene Ontology analysis using the StRAnGER Gene Ontology tool (www.grissom.gr/stranger/home) (15). Concomitantly, the same genes were explored for potential protein interaction networks and visualized using the g:Profiler tool (http://biit.cs.ut.ee/gprofiler) (14). Following ontology analysis, enriched gene ontologies were selected and visualized using the REVIGO ontology visualizer (http://revigo.irb.hr) (16). This process was repeated both for all differentially expressed genes in the basal-like condition as well as for those determined to be differentially expressed when selecting for universally differentially expressed genes in basal-like cancers correlated with STAT3 signaling and compared with all subgroups (Fig. 2).
Analysis of Human Patient RPPA Data from TCGA.
Subsequent to data download as previously described, all available protein data were hierarchically clustered via a complete clustering method (14). Data were visualized via the Gplots R package, and proteins most closely associating with phosphorylated STAT3 were selected for further comparative analysis for each patient subtype. The selected proteins were mapped for correlation between all selected patients in the subgroup, and only those with the highest correlation determined via Pearson value were plotted and compared between each sample subgroup.
Analysis of Human Patient MicroRNA Data from TCGA.
MicroRNA data generated via human patient RNA sequencing (11) were subjected to differential expression analysis using the DESeq2 R package (36). DESeq2 uses a negative binomial distribution to select out highly differentially enriched genes from an overdispersed dataset, as is often the case in biological count data. Dispersion data generated from the differential expression analysis were plotted as mean log2 fold change versus the mean normalized count for each analyzed miRNA. Following the selection of differentially expressed genes via raw count data, a regularized log transformation was applied and all expression data were clustered via a complete method using the R hclust function. Concomitant with clustering, data were plotted using the Gplots package with colorization from the RColorBrewer package (http://cran.r-project.org/web/packages/RColorBrewer/index.html).
Supplementary Material
Footnotes
The authors declare no conflict of interest.
This article is a PNAS Direct Submission.
This article contains supporting information online at www.pnas.org/lookup/suppl/doi:10.1073/pnas.1404881111/-/DCSupplemental.
References
- 1.Key TJ, Verkasalo PK, Banks E. Epidemiology of breast cancer. Lancet Oncol. 2001;2(3):133–140. doi: 10.1016/S1470-2045(00)00254-0. [DOI] [PubMed] [Google Scholar]
- 2.Foulkes WD, Smith IE, Reis-Filho JS. Triple-negative breast cancer. N Engl J Med. 2010;363(20):1938–1948. doi: 10.1056/NEJMra1001389. [DOI] [PubMed] [Google Scholar]
- 3.Griffiths CL, Olin JL. Triple negative breast cancer: A brief review of its characteristics and treatment options. J Pharm Pract. 2012;25(3):319–323. doi: 10.1177/0897190012442062. [DOI] [PubMed] [Google Scholar]
- 4.Livasy CA, et al. Phenotypic evaluation of the basal-like subtype of invasive breast carcinoma. Mod Pathol. 2006;19(2):264–271. doi: 10.1038/modpathol.3800528. [DOI] [PubMed] [Google Scholar]
- 5.Badve S, et al. Basal-like and triple-negative breast cancers: A critical review with an emphasis on the implications for pathologists and oncologists. Mod Pathol. 2011;24(2):157–167. doi: 10.1038/modpathol.2010.200. [DOI] [PubMed] [Google Scholar]
- 6.Prat A, Ellis MJ, Perou CM. Practical implications of gene-expression-based assays for breast oncologists. Nat Rev Clin Oncol. 2012;9(1):48–57. doi: 10.1038/nrclinonc.2011.178. [DOI] [PMC free article] [PubMed] [Google Scholar]
- 7.Marotta LL, et al. The JAK2/STAT3 signaling pathway is required for growth of CD44+CD24− stem cell-like breast cancer cells in human tumors. J Clin Invest. 2011;121(7):2723–2735. doi: 10.1172/JCI44745. [DOI] [PMC free article] [PubMed] [Google Scholar]
- 8.Yue P, Turkson J. Targeting STAT3 in cancer: How successful are we? Expert Opin Investig Drugs. 2009;18(1):45–56. doi: 10.1517/13543780802565791. [DOI] [PMC free article] [PubMed] [Google Scholar]
- 9.Baba Y, Fujii M, Tokumaru Y, Kato Y. Present and future of EGFR inhibitors for head and neck squamous cell cancer. J Oncol. 2012;2012:986725. doi: 10.1155/2012/986725. [DOI] [PMC free article] [PubMed] [Google Scholar]
- 10.Hong DS, Angelo LS, Kurzrock R. Interleukin-6 and its receptor in cancer: Implications for translational therapeutics. Cancer. 2007;110(9):1911–1928. doi: 10.1002/cncr.22999. [DOI] [PubMed] [Google Scholar]
- 11.The Cancer Genome Atlas Network Comprehensive molecular portraits of human breast tumours. Nature. 2012;490(7418):61–70. doi: 10.1038/nature11412. [DOI] [PMC free article] [PubMed] [Google Scholar]
- 12.Reich M, et al. GenePattern 2.0. Nat Genet. 2006;38(5):500–501. doi: 10.1038/ng0506-500. [DOI] [PubMed] [Google Scholar]
- 13.Benjamini Y, Hochberg Y. Controlling the false discovery rate: A practical and powerful approach to multiple testing. J R Stat Soc Series B Stat Methodol. 1995;57(1):289–300. [Google Scholar]
- 14.Reimand J, Kull M, Peterson H, Hansen J, Vilo J. g:Profiler—A web-based toolset for functional profiling of gene lists from large-scale experiments. Nucleic Acids Res. 2007;35(Web Server issue):W193–W200. doi: 10.1093/nar/gkm226. [DOI] [PMC free article] [PubMed] [Google Scholar]
- 15.Chatziioannou AA, Moulos P. Exploiting statistical methodologies and controlled vocabularies for prioritized functional analysis of genomic experiments: The StRAnGER web application. Front Neurosci. 2011;5:8. doi: 10.3389/fnins.2011.00008. [DOI] [PMC free article] [PubMed] [Google Scholar]
- 16.Supek F, Bošnjak M, Škunca N, Šmuc T. REVIGO summarizes and visualizes long lists of Gene Ontology terms. PLoS ONE. 2011;6(7):e21800. doi: 10.1371/journal.pone.0021800. [DOI] [PMC free article] [PubMed] [Google Scholar]
- 17.Slaney CY, Rautela J, Parker BS. The emerging role of immunosurveillance in dictating metastatic spread in breast cancer. Cancer Res. 2013;73(19):5852–5857. doi: 10.1158/0008-5472.CAN-13-1642. [DOI] [PubMed] [Google Scholar]
- 18.Bian CX, et al. P70S6K 1 regulation of angiogenesis through VEGF and HIF-1alpha expression. Biochem Biophys Res Commun. 2010;398(3):395–399. doi: 10.1016/j.bbrc.2010.06.080. [DOI] [PMC free article] [PubMed] [Google Scholar]
- 19.Kim JH, et al. Jnk signaling pathway-mediated regulation of Stat3 activation is linked to the development of doxorubicin resistance in cancer cell lines. Biochem Pharmacol. 2010;79(3):373–380. doi: 10.1016/j.bcp.2009.09.008. [DOI] [PubMed] [Google Scholar]
- 20.Decker T, Kovarik P. Serine phosphorylation of STATs. Oncogene. 2000;19(21):2628–2637. doi: 10.1038/sj.onc.1203481. [DOI] [PubMed] [Google Scholar]
- 21.Garzon R, Calin GA, Croce CM. MicroRNAs in cancer. Annu Rev Med. 2009;60:167–179. doi: 10.1146/annurev.med.59.053006.104707. [DOI] [PubMed] [Google Scholar]
- 22.Coussens LM, Werb Z. Inflammation and cancer. Nature. 2002;420(6917):860–867. doi: 10.1038/nature01322. [DOI] [PMC free article] [PubMed] [Google Scholar]
- 23.Hedvat M, et al. The JAK2 inhibitor AZD1480 potently blocks Stat3 signaling and oncogenesis in solid tumors. Cancer Cell. 2009;16(6):487–497. doi: 10.1016/j.ccr.2009.10.015. [DOI] [PMC free article] [PubMed] [Google Scholar]
- 24.Looyenga BD, et al. STAT3 is activated by JAK2 independent of key oncogenic driver mutations in non-small cell lung carcinoma. PLoS ONE. 2012;7(2):e30820. doi: 10.1371/journal.pone.0030820. [DOI] [PMC free article] [PubMed] [Google Scholar]
- 25.Mandal PK, et al. Potent and selective phosphopeptide mimetic prodrugs targeted to the Src homology 2 (SH2) domain of signal transducer and activator of transcription 3. J Med Chem. 2011;54(10):3549–3563. doi: 10.1021/jm2000882. [DOI] [PMC free article] [PubMed] [Google Scholar]
- 26.Kwon HK, et al. Constitutive activation of p70S6k in cancer cells. Arch Pharm Res. 2002;25(5):685–690. doi: 10.1007/BF02976945. [DOI] [PubMed] [Google Scholar]
- 27.Cho KH, et al. STAT3 mediates TGF-β1-induced TWIST1 expression and prostate cancer invasion. Cancer Lett. 2013;336(1):167–173. doi: 10.1016/j.canlet.2013.04.024. [DOI] [PubMed] [Google Scholar]
- 28.Semenza GL. Targeting HIF-1 for cancer therapy. Nat Rev Cancer. 2003;3(10):721–732. doi: 10.1038/nrc1187. [DOI] [PubMed] [Google Scholar]
- 29.Pawlus MR, Wang L, Murakami A, Dai G, Hu CJ. STAT3 or USF2 contributes to HIF target gene specificity. PLoS ONE. 2013;8(8):e72358. doi: 10.1371/journal.pone.0072358. [DOI] [PMC free article] [PubMed] [Google Scholar]
- 30.Chen WX, et al. miR-221/222: Promising biomarkers for breast cancer. Tumour Biol. 2013;34(3):1361–1370. doi: 10.1007/s13277-013-0750-y. [DOI] [PubMed] [Google Scholar]
- 31.Hwang MS, et al. miR-221/222 targets adiponectin receptor 1 to promote the epithelial-to-mesenchymal transition in breast cancer. PLoS ONE. 2013;8(6):e66502. doi: 10.1371/journal.pone.0066502. [DOI] [PMC free article] [PubMed] [Google Scholar]
- 32.Shah MY, Calin GA. MicroRNAs miR-221 and miR-222: A new level of regulation in aggressive breast cancer. Genome Med. 2011;3(8):56. doi: 10.1186/gm272. [DOI] [PMC free article] [PubMed] [Google Scholar]
- 33.Cascio S, et al. miR-20b modulates VEGF expression by targeting HIF-1 alpha and STAT3 in MCF-7 breast cancer cells. J Cell Physiol. 2010;224(1):242–249. doi: 10.1002/jcp.22126. [DOI] [PubMed] [Google Scholar]
- 34.Cerami E, et al. The cBio Cancer Genomics Portal: An open platform for exploring multidimensional cancer genomics data. Cancer Discov. 2012;2(5):401–404. doi: 10.1158/2159-8290.CD-12-0095. [DOI] [PMC free article] [PubMed] [Google Scholar]
- 35. R Core Team (2013) R: A Language and Environment for Statistical Computing (R Found Stat Comput, Vienna). www.R-project.org.
- 36.Anders S, Huber W. Differential expression analysis for sequence count data. Genome Biol. 2010;11(10):R106. doi: 10.1186/gb-2010-11-10-r106. [DOI] [PMC free article] [PubMed] [Google Scholar]
Associated Data
This section collects any data citations, data availability statements, or supplementary materials included in this article.