

Abstract
Calcium is believed to regulate mitochondrial oxidative phosphorylation, thereby contributing to the maintenance of cellular energy homeostasis. Skeletal muscle, with an energy conversion dynamic range of up to 100-fold, is an extreme case for evaluating the cellular balance of ATP production and consumption. This study examined the role of Ca2+ on the entire oxidative phosphorylation reaction network in isolated skeletal muscle mitochondria and attempted to extrapolate these results back to the muscle, in vivo. Kinetic analysis was conducted to evaluate the dose response effect of Ca2+ on the maximum velocity of oxidative phosphorylation (VmaxO) and the ADP affinity. Force-flow analysis evaluated the interplay between energetic driving forces and flux to determine the conductance, or effective activity, of individual steps within oxidative phosphorylation. Measured driving forces (extramitochondrial phosphorylation potential (ΔGATP), membrane potential, and redox states of NADH and cytochromes bH, bL, c1, c, and a,a3) were compared with flux (oxygen consumption) at 37°C. 840 nM Ca2+ generated a ∼2 fold increase in VmaxO with no change in ADP affinity (∼43 μM). Force-flow analysis revealed that Ca2+ activation of VmaxO was distributed throughout the oxidative phosphorylation reaction sequence. Specifically, Ca2+ increased the conductance of Complex IV (2.3-fold), Complexes I+III (2.2-fold), ATP production/transport (2.4-fold), and fuel transport/dehydrogenases (1.7-fold). These data support the notion that Ca2+ activates the entire muscle oxidative phosphorylation cascade, while extrapolation of these data to the exercising muscle predicts a significant role of Ca2+ in maintaining cellular energy homeostasis.
Keywords: metabolic homeostasis, bioenergetics, electron transport chain, cytochrome oxidase, thermodynamic stoichiometry
Exercise presents a severe challenge to energetic homeostasis in skeletal muscle as tissue-specific oxygen consumption rates can increase over 100-fold from rest to maximal aerobic exercise (1). Increases in skeletal muscle work rate are associated with modest decreases in the cytosolic ATP free energy (ΔGATP) primarily through increases in [ADP] and [Pi] (2-4). Since both muscle contraction and ion transport processes are dependent on ΔGATP, minimizing the reduction in ΔGATP during increases in energy demand is critical to the maintenance of normal cellular functions, such as ion gradients for signaling, as well as allowing peak muscle performance. Calcium (Ca2+) release from the sarcoplasmic reticulum (SR) and subsequent binding to troponin C allows muscle contraction and the associated energy utilization to occur, while Ca2+ influx into mitochondria has been shown to result in increased energy conversion potential (5-9). This balanced activation of both energy conversion and utilization pathways has been proposed to play a key role in the maintenance of energetic homeostasis in contracting muscle (10-13).
Ca2+ has long been known to stimulate flux through the citric acid cycle by activation of pyruvate, isocitrate, and 2-oxoglutarate dehydrogenases (14). More recently, Ca2+ has also been shown to directly stimulate ATP production through activation of the F1Fo-ATP synthase (9), and flux through Complex III of the electron transport chain (ETC) may also be stimulated by Ca2+ (15). Despite the importance of Ca2+ for both skeletal muscle contraction and activation of oxidative phosphorylation, few studies have examined the effects of Ca2+ on skeletal muscle mitochondrial energy conversion. Martin et al. (16) found that increasing Ca2+ lowered the respiratory control (RCR) and ADP/O ratios in isolated skeletal muscle mitochondria, though the free Ca2+ concentrations used in that study (0.4 – 19.1 μM) were tailored to answer questions about aging and apoptosis and not resting and exercising muscle (<0.05 – 1.5 μM) (17-19). Kavanagh et al. (6) reported that skeletal muscle mitochondria in the presence of Ca2+ have an increase in flux through the substrate oxidation pathway for NAD-linked fuels as well as the phosphorylation pathway regardless of fuel. However, the inhibitor titrations used by Kavanagh et al. (6) make it difficult to discern Ca2+ effects on the ETC from those on the substrate dehydrogenases and/or the ATP producing/transporting enzymes.
The purpose of this study was to determine the role of Ca2+ in modulating oxidative phosphorylation in isolated porcine skeletal muscle mitochondria. We hypothesized that Ca2+ would increase the maximum velocity of oxidative phosphorylation, as seen in other systems (8, 9, 15, 20), and that this effect would be the result of a distributed activation of reactions within the oxidative phosphorylation network. This was evaluated by establishing the dose response effect of Ca2+ on oxidative phosphorylation and performing force-flow analyses of the oxidative phosphorylation network using concurrent measures of the redox states of NADH and the cytochromes, the extramitochondrial free energy of ATP (ΔGATP), and mitochondrial membrane potential (ΔΨ) to estimate the effective conductance of several of the reaction steps of oxidative phosphorylation in the presence and absence of Ca2+.
Experimental Procedures
Mitochondrial Isolation and Normalization
All procedures were approved by the National Heart, Lung, and Blood Institute Animal Care and Use Committee and performed in accordance with the guidelines described in the Animal Care and Welfare Act (7 USC 2142 § 13). Skeletal muscle mitochondria from the oxidative, porcine vastus intermedius were isolated using a Percoll gradient as described previously (21). Mitochondria were normalized to the optically-determined cytochrome a,a3 (cyt a) content since this assay was very fast, did not require a standard curve, and provided the actual amount of mitochondrial oxidative phosphorylation complex in the sample independent of cytosolic contaminates. Cyt a content was measured as described previously (22), typically yielding a final mitochondrial suspension of 20 – 35 nmol cyt a/ml. Purified porcine skeletal muscle mitochondria contain ∼1.0 nmol cyt a/mg protein (21).
Mitochondrial Respiration, NADH, and Membrane Potential
Mitochondrial oxygen consumption (Jo), NADH fluorescence, and membrane potential (ΔΨ) were measured simultaneously and continuously in a water-jacketed chamber maintained at 37°C as described previously (9, 23). Experiments were carried out with mitochondria (375 pmol cyt a) in a 1.5-ml final volume of respiration medium (RM) containing (in mM) 100 KCl, 50 MOPS, 20 glucose, 15 NaCl, 10 MgCl2, 1 EGTA, and 0.2% w/v BSA, pH 7.0. Jo was measured using a Clark electrode and an oxygen solubility of 199 nmol/ml at 37°C (24).
NADH reduction level was calculated relative to the fully oxidized (Ca2+-depleted mitochondria, no added substrates, with ADP and Pi) and fully reduced (mitochondria with added substrates and Ca2+ at anoxia) states. ΔΨ was determined based on the distribution of the lipophillic cation TPP+ across the inner mitochondrial membrane using a TPP+ sensitive microelectrode (KWIKTPP, World Precision Instruments). TPP+ binding to mitochondria was accounted for as described previously (9). With 10 mM Pi in the RM for all experiments along with sodium in the medium, the contribution of the pH gradient (ΔpH) to the protonmotive force (ΔpH + ΔΨ) was assumed to be insignificant (25).
Experimental Conditions
For all respiration experiments, mitochondria were incubated in RM at 37°C in the presence of sodium and in the absence of exogenous substrates or energy phosphates in order to deplete endogenous Ca2+ from the mitochondrial matrix (5, 6, 9). After the depletion step, 10 mM Pi and 0.13 mM ADP were added, followed by glutamate (G, 10 mM) and malate (M, 1 mM) ± Ca2+. Addition of fuel (G+M) initiated a submaximal increase in Jo followed by a subsequent transition to State 4 Jo. For experiments designed to measure maximal Jo, State 3 was then elicited with a bolus of 1.3 mM ADP which resulted in consumption of all the oxygen in the chamber providing the fully reduced state (anoxia). Free Ca2+ concentrations were made using the calculator programs of Fabiato and Fabiato (26) translated to Labview VIs (National Instruments Corp, Austin, TX) by Reitz and Pollack (27).
Steady-state, intermediate Jo was attained using a progressive creatine kinase (CK) energetic clamp (28), we have recently modified (29). Briefly, by utilizing a large total creatine pool, excess CK, a known [ATP], and the CK equilibrium constant (KCK, 150 (30)), the extramitochondrial ATP/ADP ratio, and thus, free energy of ATP hydrolysis (ΔGATPe) can be calculated from the added phosphocreatine (PCr)/creatine (Cr) ratio:
| (1) |
where ΔGATP° is the standard ΔGATP (-7.592 kcal/mol), R is the gas constant (1.987 cal·K-1·mol-1), and T is temperature (310°K). Mitochondria oxidizing G+M at State 4 were given 2.5 mM PCr, 5 mM Cr, 5 mM ATP, and 75 U/ml CK, resulting in a Jo of ∼2/3 of State 3. Subsequent additions of PCr (to 3.75, 5, 7.5, and 10 mM) were made to slow Jo to ∼1/3 of State 3.
Additional experiments with pyruvate were conducted similar to those from Messer et al. (28). Briefly, mitochondria in the presence of saturating M were exposed to the CK clamp as described above with a PCr/Cr ratio of 0.25. Pyruvate was then titrated in stepwise at 10, 25, 50, 100, and 500 μM to increase respiration. The novel aspect of this experiment was that upon reaching a steady state with 500 μM pyruvate, stepwise additions of PCr were then made to slow Jo. Thus, in a single experiment, Jo was changed by both “Push” (pyruvate titration) and “Pull” (CK clamp) mechanisms.
Mitochondrial Optical Absorption
A system was developed from our earlier work with an integrating sphere to minimize the effects of light scattering on the visible spectrum of mitochondrial suspensions (23). Our current implementation permits studies on well-mixed samples at physiological temperatures with a complete linear regression analysis of the chromophores of oxidative phosphorylation (31). Briefly, a 6-inch integrating sphere (model RTC-060-SF, LabSphere, Inc., North Sutton, NH, USA) was used with a custom-designed, 1.2-cm diameter, cylindrical, water-jacketed, center-mounted chamber to hold the mitochondrial suspension. The volume used in this chamber was 2 ml. The sample was uncapped and oxygen consumption measurements in the chamber were not attempted due to the optical interference of electrodes. All oxygen consumption data was collected in parallel in a dedicated polarography chamber at the same temperature. All experiments were conducted at 37°C. White light (model CS-16-500, Jobin-Yvon, Inc., Spex® Forensics Division, Edison, NJ, USA) was impinged on the sample and the absorbed light was collected via a fiber optic using the sampling port on the sphere. Rapid-scanning optical spectra (1 spectrum/100 msec) were collected using a photodiode array (model QE-65000, Ocean Optics, Inc.) from ∼300 to 800nm. Analysis was conducted on the β and α bands of the cytochromes from the 466 to 630nm region since this provided the best discrimination of the absorbance bands (31).
Data analysis was performed by completely fitting the absorbance difference spectra to 7 reference difference spectra for FAD, cytochrome bH, cytochrome bL, cytochrome c1, cytochrome c, cytochrome a3 peroxy form (a607), cytochrome a3 ferryl form (a580), and a simple linear term for baseline corrections as previously described using linear regression fitting (31). The fully oxidized state was taken as mitochondria in the absence of carbon substrates and the addition of ADP and Pi. The fully reduced state for FAD and cytochromes bH, c1, c, and a607 was obtained by adding a small amount of sodium hydrosulfite at the end of the experiment. Cytochromes bL and a580 were most reduced under State 4 conditions, thus, State 4 was considered as full reduction for these two species. Cytochrome a580 reduction level was then normalized to total cyt a content assuming a 1:2 extinction coefficient ratio for a580 and a607, respectively (32, 33).
Driving Forces and Pathway Conductances
In this study, the force-flow behavior for different regions of the oxidative phosphorylation network was used to estimate the effective conductance (or resistance) of each region during active oxidative phosphorylation. This is in contrast to studies on isolated protein complexes in native gels or which alter the pathway using inhibitor titrations where oxidative phosphorylation is not proceeding under normal conditions. To accomplish this task, the oxidation/reduction (redox) potentials (Eh) of the products and reactants of a reaction segment, as well as ΔΨ when appropriate, must be determined for the driving force, while Jo provides the flux for all of the elements. Mitochondrial Complex Eh for redox pairs was calculated as:
| (2) |
where Em is the midpoint potential (-320 mV for NAD/NADH, +230 for cyt c1, +270 mV for cyt c, +280 mV for cyt a607, and +820 mV for O2/H2O (34-37)), n is the number of electrons to be transferred, and F is the Faraday constant (23.062 cal·mV-1·mol-1). Free energies (ΔG) were calculated assuming that a single NADH donates 2 electrons (n) to the ETC resulting in 10 protons pumped (m) which, in turn, yields 2.7 ATP (p):
| (3) |
| (4) |
| (5) |
where Eq. 3 is used for the free energy driving electron transfer with ΔEh as the redox potential difference and z as the relative distance across the mitochondrial inner membrane relative to the matrix side between two redox pairs, Eq. 4 is used for the free energy associated with pumping protons across the mitochondrial inner membrane, and Eq. 5 is used for the stoichiometric free energy of ATP hydrolysis. For electron transfer steps within the ETC, m was varied according to the number of protons moved across the mitochondrial inner membrane between the respective electron donors and acceptors, and z was assumed to be 1, 0, 0, and -1 for electron transfer between NADH and cyt c1, cyt c1 and cyt c, cyt c and cyt a607, and cyt a607 and O2, respectively, yielding a value of 0 for electron flow down the entire ETC.
Flux down an oxidative phosphorylation pathway was assumed to vary according to the thermodynamic driving forces acting on it using classical irreversible thermodynamic approaches (38, 39):
| (6) |
where J is the flux down the pathway, L is the phenomenological transport coefficient of the reaction, and ΔG1 and ΔG2 are the driving forces acting on the front and back ends of the pathway, respectively. For the purposes of this discussion we will refer to the transport coefficient, L, as a “conductance” since many of the reactions we are evaluating involve the displacement of charged species. Simultaneous measurement of oxygen flux (Jo) and the thermodynamic driving forces for oxidative phosphorylation (ΔGredox, ΔGΔΨ, and ΔGATP) thus allows for the calculation of the conductances of the ETC (ΔGredox - ΔGΔΨ), ATP synthesis/transport (ΔGΔΨ - ΔGATP), and complete oxidative phosphorylation pathways (ΔGredox - ΔGATP). Under conditions of saturating oxidative substrates, we considered the free energy associated with the added fuel to be constant. As such, we were also able to calculate the conductance of the fuel transport/dehydrogenase pathway (ΔGFuel – ΔGNADH) and of the complete mitochondrial energy conversion process (ΔGFuel – ΔGATP) using the ΔGNADH and ΔGATP relationships with Jo, respectively.
Stoichiometries
The ratios of protons pumped across the inner membrane per electron passed (H+/e-) were measured using the force ratio (40-42). Briefly, the ratio of the respective thermodynamic forces was plotted against Jo, and from the resultant linear relationship, the force ratio at zero flux (x-intercept) could be extrapolated. Under equilibrium conditions, plugging Equations 3 and 4 into Equation 5 and rearranging arrives at the following:
| (7) |
where m/n is the H+/e- ratio. The experimentally-determined stoichiometries were then compared to those used in the ΔG calculations to provide a measure of validity.
Statistical Analysis
For the Ca2+ titration experiments, significant differences were assessed using a repeated measures ANOVA with a Tukey-Kramer multiple comparisons post-hoc test. Differences in slopes between Ca2+ and no Ca2+ conditions were assessed using a two-tailed, paired Student's t-test. A P-value of 0.05 was used to determine statistical significance.
Results
Maximal Respiration
State 3 Jo as well as State 3 and 4 NADH levels rose with increasing [Ca2+] up to 840 nM, beyond which a plateau occurred (Figure 1). The initial increase in State 3 with Ca2+ was linear with a slope of 0.33 nmol O2/min/nmol cyt a/nM Ca2+. The optimal Ca2+ dose (840 nM) for respiration resulted in a 1.8-fold increase in State 3 Jo (405.9 ± 12.6 nmol O2/min/nmol cyt a) compared to that with no Ca2+ (226.8 ± 17.5 nmol O2/min/nmol cyt a). Surprisingly, the optimal Ca2+ dose had no effect on ΔΨ at State 3 and State 4 despite the large increase in NADH and Jo. This result implies that the effects of Ca2+ cannot be through alterations in ΔΨ alone as other processes must be affected.
Figure 1.

Calcium titration. A: State 3 and 4 Jo at added free calcium concentrations from 0 to 1500 nM. B: State 3 and 4 NADH at added free calcium concentrations from 0 to 1500 nM. C: State 3 and 4 ΔΨ at added free calcium concentrations from 0 to 1500 nM. Filled squares – State 4, open diamonds – State 3. Error bars signify standard error. * denotes significance difference from no calcium condition. n = 4.
The mitochondrial isolation process typically results in mitochondria with high endogenous levels of Ca2+ (43, 44). Depletion of endogenous calcium for these experiments was achieved through a 6 minute mitochondrial incubation period at 37°C without added substrates and in the presence of 15 mM sodium (to stimulate Na+/Ca2+ exchange) which we have previously shown to remove nearly all Ca2+ from the mitochondrial matrix (45). This incubation step resulted in a State 3 Jo that was 49% of the rate without incubation or NaCl (Table 1). Addition of Ca2+ after the incubation period resulted in a State 3 Jo that was 88% of the rate without incubation which is consistent with the notion that the effects of the incubation period are primarily due to a depletion of Ca2+.
Table 1. Oxygen Consumption, NADH % Reduction, and Membrane Potential at Maximal and Resting Respiration.
| Incubation Conditions | Jo | NADH | ΔΨ | |||
|---|---|---|---|---|---|---|
| State 4 | State 3 | State 4 | State 3 | State 4 | State 3 | |
| No Calcium (n=9) | 31.0 ± 3.2 | 226.8 ± 17.5+ | 59.9 ± 5.1 | 17.8 ± 1.3 | -202.1 ± 2.6 | -171.5 ± 4.1 |
| Calcium (n=9) | 39.8 ± 3.1* | 405.9 ± 12.6*+ | 72.4 ± 2.9* | 30.0 ± 1.3* | -203.1 ± 1.5 | -174.9 ± 2.2 |
| No NaCl, | ||||||
| No Depletion, | 29.3 ± 3.7 | 463.2 ± 19.0 | ||||
| No Calcium (n=12) | ||||||
Skeletal muscle mitochondria oxidizing 10 mM glutamate and 1 mM malate. Values are means ± SE.
denotes significant difference between Calcium and No Calcium.
denotes significant difference from No Depletion condition. Jo values are in nmol O2/min/nmol cyt a. NADH values are % reduced. ΔΨ values are in mV.
Steady-State, Intermediate Respiration
A representative trace of a CK clamp experiment is shown in Figure 2, and the resultant linear relationship between ΔGATPe and Jo is presented in Figure 3A (3, 46, 47). A roughly two-fold increase in respiration was observed with calcium at each clamped ΔGATPe value (Figure 3 A). Therefore, the ability to produce ATP with fixed substrate and product concentrations was increased by Ca2+. This result implied that the Vmax of the mitochondria for producing ATP was increased by Ca2+. To confirm this notion, these data were reformulated to extract the affinity of oxidative phosphorylation for ADP. In Figure 3B, the dose response curve of [ADP] versus Jo reveals typical saturating kinetics. The Eadie- Hofstee plot in Figure 3C demonstrates that the increase in Jo with Ca2+ was not due to a change in ADP affinity, ∼43 μM, but rather, due to a doubling of the Vmax from ∼200 to ∼425 nmol/min/nmol cyt a, consistent with the data presented in Figure 1. It is important to note that combining the increase in Vmax due to Ca2+ with the change in ADP from resting muscle (∼5 μM) to that during modest concentric exercise (∼25 μM) in humans (48) can explain an ∼7-fold increase in respiration rate. These physiological points are highlighted in Figure 3B and the combined effects of Ca2+ and ADP are further developed in the Discussion.
Figure 2.

Representative CK energetic clamp experiment. A: ΔΨ and NADH during stepwise PCr additions and at anoxia. B: Jo and [O2] during stepwise PCr additions and at anoxia.
Figure 3.

Kinetic effect of calcium on oxidative phosphorylation intermediate respiration. A: Relationship between ΔGATPe and Jo with and without calcium. B: Michaelis-Menten relationship between Jo and ADP with and without calcium. The open square and open circle signify the ADP values reported for human skeletal muscle at rest and during moderate exercise, respectively. C: Eadie-Hofstee plot for the relationship between Jo and ADP where y= -(KmADP)x + Vmax. Filled squares – calcium, open diamonds – no calcium. Error bars signify standard error. n = 12. Slopes, regression analyses, and the resultant p-values for A and C are reported in Table 2 under ΔGATPe and KmADP, respectively.
The remaining studies focused on isolating the elements within oxidative phosphorylation responsible for the increase in Vmax by Ca2+. To evaluate the contribution of different steps in the oxidative phosphorylation network, the phenomenological conductance was determined for each step where the net driving forces could be measured. The primary potential energy for oxidative phosphorylation, especially with the substrates we utilized, is the free energy in NADH which is then converted into ΔΨ. The force:flow relationships for these parameters are presented in Figure 4 where the convention of the force, net NADH or ΔΨ, is plotted on the X-axis, and flow, Jo, is plotted on the Y-axis. The force:flow relationships for NADH and ΔΨ were linear for both the control and Ca2+ conditions. Ca2+ increased the force:flow slopes by ∼0.7- and 2.1-fold for NADH and ΔΨ, respectively (Table 2). These data are consistent with previous observations in porcine heart mitochondria (9). The relationships in Figure 4 provide only a measure of the balance between production and utilization of the respective free energies, NADH or the resulting ΔΨ, thus, many different parameters could contribute to the Ca2+-induced changes in total velocity and slope, including dehydrogenase activity, ADP kinetics on F1FoATPase velocity, or any alterations within the ETC. Thus, to determine the specific locations of Ca2+ sensitivity, we used the free energy differences measured across various spans of the mitochondrial energy conversion pathway along with Jo to determine the conductance, or reciprocally, the resistance to energy flow of each span. Figure 5 depicts the thermodynamic driving forces measured and the energy conversion steps for which conductances were calculated.
Figure 4.
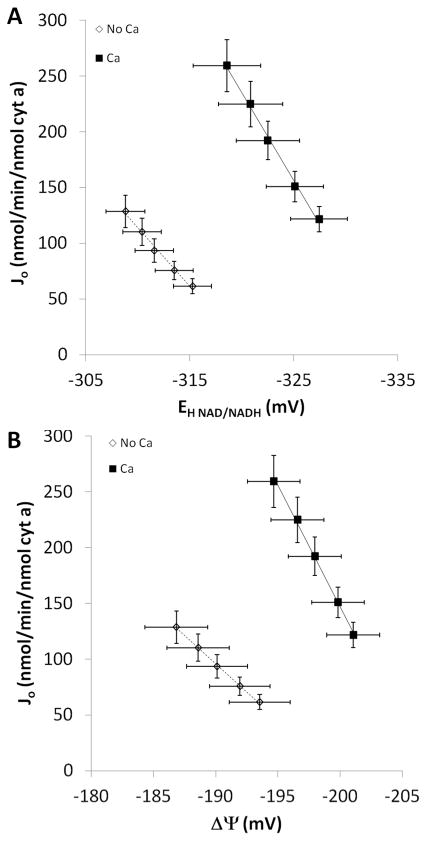
Effect of calcium on oxidative phosphorylation energetic driving forces and Jo during intermediate respiration. A: Relationship between NADH and Jo with and without calcium. B: Relationship between ΔΨ and Jo with and without calcium. Filled squares – calcium, open diamonds – no calcium. Error bars signify standard error. n = 12. Slopes, regression analyses, and the resultant p-values are reported in Table 2.
Table 2. Mean Values for Force:Flow Relationships in Figures 3, 4, 6, 8, and 9.
| Slope | r2 | ||||
|---|---|---|---|---|---|
| No Calcium | Calcium | No Calcium | Calcium | p-value | |
| NADH (mV) | 12.2 ±2.6 | 20.5 ±4.0* | 0.981 ±0.004 | 0.960 ±0.013 | 0.010 |
| Cyt bH (% reduced) | 16.0 ±2.9 | -75.6 ±40.5 | 0.518 ±0.192 | 0.558 ±0.200 | 0.108 |
| Cyt bL (% reduced) | -3.0 ±0.2 | -8.2 ±1.1* | 0.961 ± 0.006 | 0.937 ±0.018 | 0.021 |
| Cyt c1 (% reduced) | -15.9 ±27.7 | -31.8±21.2 | 0.527 ±0.168 | 0.268 ±0.139 | 0.587 |
| Cyt c (% reduced) | -53.6 ±10.5 | -16.1 ±53.0 | 0.568 ±0.119 | 0.498 ±0.109 | 0.518 |
| Cyt a607 (% total cyt a) | 67.9 ± 17.9 | 87.8 ±32.5 | 0.937 ±0.022 | 0.893 ±0.053 | 0.678 |
| Cyt a580 (% total cyt a) | 4.6± 13.1 | 95.2 ±24.4 | 0.528 ±0.235 | 0.799 ±0.055 | 0.073 |
| ΔΨ (mV) | 10.3± 1.4 | 22.1 ±2.5* | 0.989 ±0.004 | 0.989 ±0.002 | 0.000 |
| ΔGATPe (kcal/mol) | 80.0 ± 11.3 | 163.2 ±17.9* | 0.991 ±0.002 | 0.990 ±0.002 | 0.000 |
| KmADp(μM) | 42.3 ±6.6 | 44.4 ±6.3 | 0.963 ±0.010 | 0.942 ± 0.023 | 0.687 |
| LFuel/DH | -263.5 ± 57.3 | -445.3 ±87.1* | 0.981 ±0.004 | 0.960 ±0.013 | 0.010 |
| Lcl+iii | -101.9 ±20.9 | -224.7 ± 17.0* | 0.992 ±0.001 | 0.927 ±0.043 | 0.012 |
| Lc1c | -91.0 ±116.2 | 269.3 ±191.7 | 0.228 ± 0.078 | 0.122 ±0.081 | 0.266 |
| LCIVa | 226.4 ± 56.0 | 543.7 ±46.3* | 0.935 ±0.016 | 0.856 ± 0.064 | 0.043 |
| LCIVb | -55.8 ±13.5 | -123.8 ±25.9* | 0.989 ±0.004 | 0.970 ±0.021 | 0.036 |
| LETC | -39.3 ±5.6 | -96.0 ±11.1* | 0.988 ±0.005 | 0.980 ±0.008 | 0.000 |
| LATPase | -79.5 ±37.1 | -192.5 ±33.7* | 0.889 ±0.035 | 0.969 ±0.010 | 0.005 |
| LOxphos | -29.8 ±4.8 | -60.9 ±7.9* | 0.989 ±0.003 | 0.990 ±0.003 | 0.000 |
| LMito | -29.6 ±4.2 | -60.4 ± 6.6* | 0.991 ± 0.002 | 0.990 ±0.002 | 0.000 |
Values are means ± SE.
denotes significantly different from No Calcium condition.
P-value compares No Calcium and Calcium slopes.
Figure 5.

Simple model of the mitochondrial energy conversion cascade. The path of energy flow is depicted in the top half of the figure while the measured energetic driving forces and how they relate to the calculation of conductances or resistances is depicted in the lower portion of the figure.
The conductance of the entire oxidative phosphorylation cascade, LOxphos, was determined by plotting Jo versus ((ΔGNADH - ΔGO2) - ΔGATP), the potential energy across the oxidative phosphorylation process. It is important to note that since the ΔGNADH is included in this calculation, the effects of dehydrogenase activation are eliminated from this force:flow relationship which is presented in Figure 6A. The overall LOxphos increased 2.0-fold in the presence of Ca2+. These data are consistent with the notion that the ability of oxidative phosphorylation to generate ATP at a given free energy is improved in the presence of Ca2+.
Figure 6.
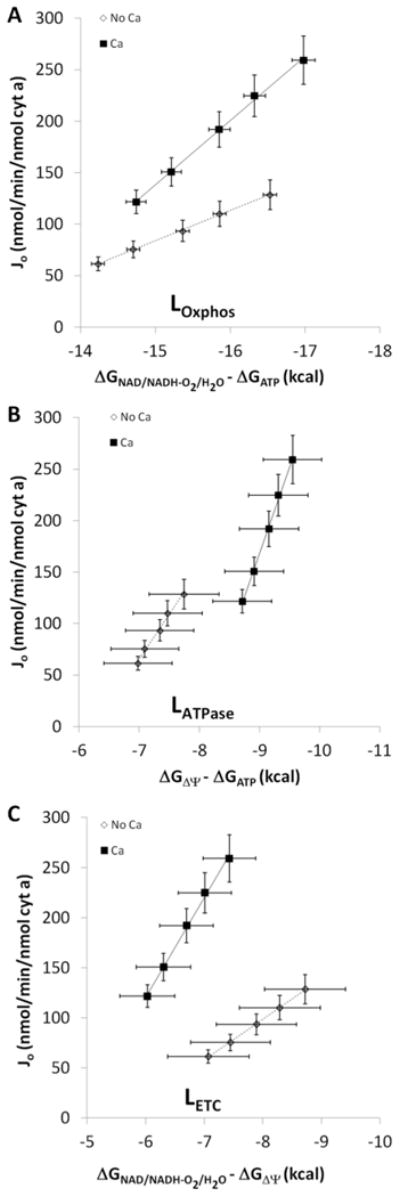
Effect of calcium on mitochondrial conductances. A: Relationship between Jo and the free energy difference between NADH and ΔGATP with and without calcium. B: Relationship between Jo and the free energy difference between ΔΨ and ΔGATP with and without calcium. C: Relationship between Jo and the free energy difference between NADH and ΔΨ with and without calcium. Filled squares – calcium, open diamonds – no calcium. Error bars signify standard error. n = 12. Slopes, regression analyses, and the resultant p-values for A, B, and C are reported in Table 2 under LOxphos, LATPase, and LETC, respectively.
It has been previously established that Complex V maximal activity is increased by Ca2+ (9). We confirmed that the ATP synthesis mechanism, LATPase, which includes both Complex V and the adenylate nucleotide translocase (ANT), was activated by Ca2+ by plotting Jo versus ΔΨ-ΔGATP in Figure 6B. The calculated LATPase increased by a factor of 2.4 in the presence of Ca2+ (Table 2) consistent with previous results in the porcine heart (9) and recent biochemical analysis (49).
To eliminate LATPase from the conductance calculation, we determined the conductance of the electron transport chain, LETC, using ((ΔGNADH - ΔGO2) - ΔGΔΨ) to take into account only the free energy driving the ejection of charge and not ATP synthesis. As seen in Figure 6C, LETC was increased 2.4-fold in the presence of Ca2+. These data suggest that Ca2+ is activating the ETC independent of effects on Complex V or dehydrogenases.
Using the cytochrome spectra as shown in Figure 7, we could isolate different regions of the ETC to examine whether Ca2+ was altering the reaction kinetics. Force:flow relationships for cytochromes bH, bL, c1, c, and a peroxy (a607) and ferryl (a580) with and without Ca2+ are shown in Figure 8A-F. Ca2+ caused a greater reduction of all cytochromes with the exception of bL. However, the slope of the relationship between bL and Jo was increased 2.7-fold by Ca2+. The thermodynamic relationships and the chromophores detected provided the differential driving forces for the flux between NADH and cyt c1 (for calculating LCI+III), cyt c1 to cyt c (for calculating Lc1c), cyt c and cyt a607 (for calculating LCIVa) as well as cyt a607 with oxygen (for calculating LCIVb). The use of cyt b redox forms for calculating a driving force was complicated by the Q cycle, thus, Complex III was lumped with Complex I in LCI+III.
Figure 7.

Representative spectra and fits for mitochondrial cytochromes. A: Representative raw, fit, and error residual spectra of a transition from State 4 to intermediate respiration. B: Individual cytochrome components of the fit spectrum from A. C: Representative fit spectra from a CK clamp experiment without calcium. D: Representative fit spectra from a CK clamp experiment with calcium.
Figure 8.
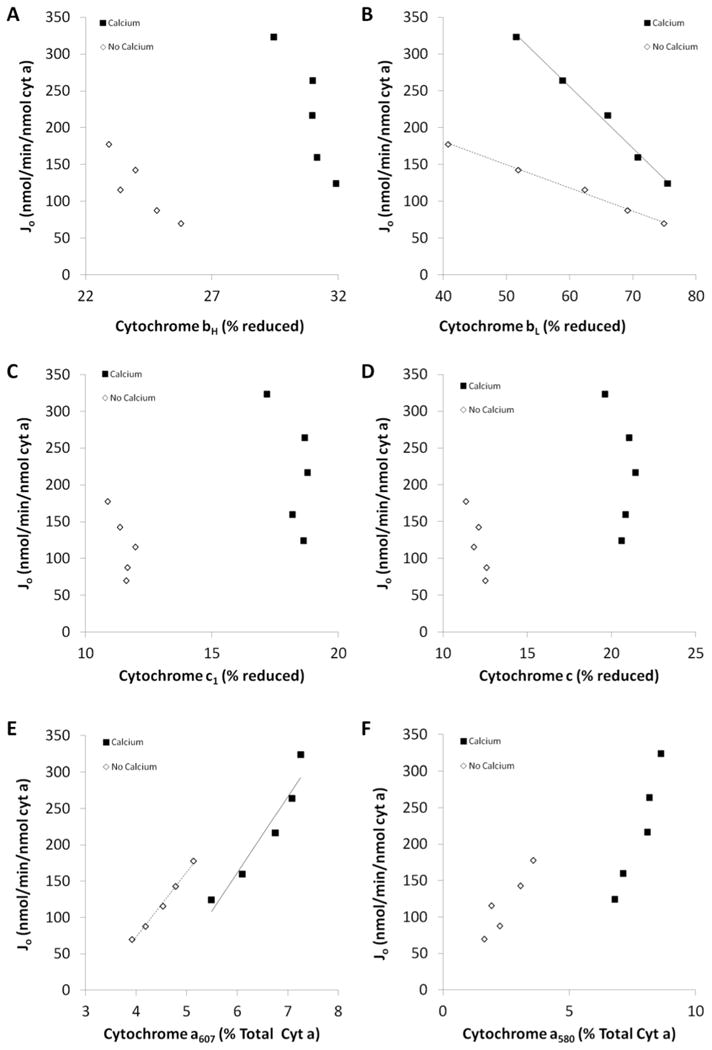
Effect of calcium on the kinetic relationship between cytochrome redox state and flux. A: Relationship between cytochrome bH and Jo with and without calcium. B: Relationship between cytochrome bL and Jo with and without calcium. C: Relationship between cytochrome c1 and Jo with and without calcium. D: Relationship between cytochrome c and Jo with and without calcium. E: Relationship between cytochrome a607 and Jo with and without calcium. F: Relationship between cytochrome a580 and Jo with and without calcium. Filled squares – calcium, open diamonds – no calcium. Trendlines are included for relationships with R2 values above 0.8. n = 4. Slopes, regression analyses, and the resultant p-values are reported in Table 2.
The calculations of the conductance of the different portions of the ETC are presented in Figure 9A-D. All of the Complexes of the ETC were activated by Ca2+ with LCI+III increasing 2.2-fold (Figure 9A), LCIVa increasing 2.4-fold (Figure 9C) and the terminal reaction with oxygen, LCIVb, increasing 2.2-fold (Figure 9D). These calculations suggest that Ca2+ had a ubiquitous effect on the activity of the electron transport system consistent with activation within Complex I/Complex III and the interactions within Complex IV.
Figure 9.

Conductances within the electron transport chain. A: Conductance of electron flux between NADH and cytochrome c1 with and without calcium. B: Conductance of electron flux between cytochromes c1 and c with and without calcium. C: Conductance of electron flux between cytochromes c and a607 with and without calcium. D: Conductance of electron flux between cytochrome a607 and O2 with and without calcium. Filled squares – calcium, open diamonds – no calcium. Trendlines are included for relationships with R2 values above 0.8. n = 4. Slopes, regression analyses, and the resultant p-values are reported in Table 2 for A-D as LCI+III, Lc1c, LCIVa, and LCIVb, respectively.
Resistance to Mitochondrial Energy Conversion
By considering mitochondrial energy conversion as flux across a series of resistors (see Figure 5), we were able to calculate the contribution of each span of the energy conversion process to the total resistance to energetic flux. These results are shown in Table 3 where, in the absence of Ca2+, Complex IV was determined to provide the most resistance to flux followed by Complex I+III, ATP production/transport, and fuel transport/dehydrogenases. Note that the resistance from cyt c to cyt a607 was considered negligible as ΔGcyt c - cyt a607 became more positive as Jo increased (Figure 9C) suggesting this reaction provides no flux control. Resistance between cyt c1 and cyt c was also omitted from this analysis as there was little change in this free energy difference with neither a positive or negative relationship to flux (Table 2). Despite increasing conductances throughout the entire mitochondrial energy conversion pathway, Ca2+ addition caused a shift in the relative contribution to resistance away from the ETC (both Complex I+III and Complex IV).
Table 3. Contribution of Each Pathway to the Total Mitochondrial Resistance to Energy Transfer.
| Fuel Transport/Dehydrogenases | Complex I+III | Complex IV | ATP Production/Transport | Total Resistance (Ohms/nmol cyt a) | |
|---|---|---|---|---|---|
| No Calcium | 10.4 ± 0.8% (467) | 27.1 ± 2.4% (1211) | 37.7 ± 3.3% (1685) | 24.7 ± 4.0% (1106) | 4471 ± 558 |
| Calcium | 14.8 ± 3.2% (345) | 21.2 ± 2.5%* (495) | 30.5 ± 3.6%* (711) | 29.1 ± 4.1%* (678) | 2332 ± 441* |
The mitochondrial energy conversion process was considered as a series of resistors where the total resistance is the sum of the individual parts. Resistance was calculated as the reciprocal of conductance and assuming 1 nmol O2 = 4 × 6.02e14 electrons, 6.24e18 electrons = 1 coulomb and 23.062 V = 1 kcal/mol. N = 8.
denotes significantly different from No Calcium. Values are means ± SE with mean resistance in Ohms/nmol cyt a in parentheses.
Stoichiometries
Measuring the force ratios for the spans of the ETC provided validation for the stoichiometries chosen for making the free energy, and thus, conductance calculations described above. The ∼10% difference between measured and used values in Table 4 suggest that the numbers of electrons (n) and protons (m) were correctly assigned when using Equations 3 and 4 for the relationships depicted in Figures 6 and 9 and Tables 2 and 3.
Table 4. Thermodynamic Stoichiometries for Individual Spans of the Electron Transport Chain.
| Stoichiometry | Ox Phos Span | Measured | Used | % Difference | ||
|---|---|---|---|---|---|---|
| No Ca | Ca | No Ca | Ca | |||
| H+/e- | NADH to cyt c1 | 3.9 ± 0.0 | 3.8 ± 0.0 | 4.0 | -2.5 | -5.0 |
| Cyt c1 to cyt c | 0.1 ±0.0 | 0.1 ±0.1 | 0.0 | - | - | |
| Cyt c to cyt a607 | 0.3 ±0.0 | 0.3 ±0.0 | 0.0 | - | - | |
| Cyt a607 to O2 | 1.1 ±0.1 | 1.1 ±0.0 | 1.0 | 10.0 | 10.0 | |
| NADH to O2# | 5.4 ±0.1 | 5.2 ±0.1 | 5.0 | 8.0 | 4.0 | |
| NADH to O2* | 5.4 ±0.1 | 5.3 ±0.0 | 5.0 | 8.0 | 6.0 | |
Measured values are the sum of NADH to cyt c1, cyt c1 to cyt c, cyt c to cyt a607, and cyt a607 to O2.
Measured values are from NADH to O2 directly. N = 4.
Discussion
Steady-state Kinetic Analysis
Skeletal muscle free Ca2+ levels are typically less than 50 nM at rest and, at the onset of exercise, can transiently rise to 0.5 – 1.5 μM, depending on both intensity and modality (17, 18, 50). Using the reported skeletal muscle values as a guide, Ca2+- depleted skeletal muscle mitochondria were incubated with concentrations up to 1.5 μM to determine the steady-state kinetic relationship between Ca2+ and State 3 and State 4 Jo, NADH, and ΔΨ, as well as the optimal Ca2+ dose to stimulate oxidative phosphorylation (Figure 1). The kinetic relationship to Ca2+ was similar between Jo and NADH, with both being maximally stimulated at 840 nM Ca2+. Thus, the optimal Ca2+ dose for oxidative phosphorylation in isolated mitochondria is similar to that in exercising muscle, and, as a result, the Ca2+ levels used in this study may offer some insight into the Ca2+ activation of mitochondria in the transition from rest to exercise. It should be noted that temporal kinetics of Ca2+ exposure to the mitochondria in these studies with constant step changes is much different than the transient nature of cytosolic Ca2+, in vivo. Thus, these steady state, in vitro kinetics can only be estimates of the in vivo conditions. Further kinetic analysis revealed that the increase in State 3 Jo with Ca2+ was the result of an increase in the apparent Vmax of oxidative phosphorylation and not due to changes in ADP affinity (Figure 3C) as previously shown by Scaduto's group in heart mitochondria (8). However, since we used saturating concentrations of carbon substrates and a limited number of substrates, we cannot reach conclusions regarding carbon substrate affinity changes to Ca2+. The remainder of the study focused on unraveling the mechanism of the Ca2+-induced Vmax increase in skeletal muscle mitochondria under these conditions.
Force:Flow Analysis
Simultaneous measurement of Jo, ΔΨ, and the NADH and cytochrome redox states at several different respiration rates allows for a novel evaluation of the impact of Ca2+ on metabolic flux and thermodynamic driving forces. The CK clamp provides mitochondria with extramitochondrial ΔGATP and [ADPf] values similar to those observed in human skeletal muscle in vivo (48, 51, 52). Thus, we were able to examine the effects of Ca2+ in an environment which may more closely approximate in vivo conditions compared to experiments using inhibitors and/or excess ADP.
Initial force:flow analyses examined the effect of Ca2+ on the conductance of the overall mitochondrial energy conversion cascade (LMito) by measuring the slope of the relationship between flux (Jo) and the difference between the forward (ΔGFuel) and reverse (ΔGATP) driving forces (Eq. 6 and Figure 5). Since ΔGFuel is assumed to be constant at the high substrate concentrations used, (ΔGFuel - ΔGATP) reduces to ΔGATP for this analysis. Using this simplification, the 2.0-fold increase in the Jo/ΔGATP slope shown in Figure 3A represents a 2.0-fold increase in LMito, nearly identical to the Ca2+-induced increase in State 3 Jo discussed above. However, LMito, much like State 3 Jo, gives only a global view of the effect of Ca2+ on oxidative phosphorylation with no information on the specific sites that are affected. To remove the influence of fuel transportation and substrate dehydrogenases on LMito, we used the NADH redox status along with ΔGATP to calculate LOxphos, or the conductance of the oxidative phosphorylation reactions. Just as with LMito, Ca2+ caused a 2.0-fold increase in LOxphos (Figure 6A). Thus, oxidative phosphorylation was activated by Ca2+ independent of the well known effects of Ca2+ on dehydrogenases and substrate transport (53). We then split LOxphos into two separate elements, the combination of Complex V and ANT (ATP production/transport, LATPase) and the ETC (LETC), by using the measured intermediate, ΔΨ. LATPase was increased 2.4-fold by Ca2+ (Figure 6B) similar to previous reports demonstrating that Ca2+ activates cardiac Complex V (9, 49) and in skeletal muscle where Ca2+ activated the phosphorylation subsystem (6).
The conductance of the ETC, LETC, was also increased 2.4-fold by Ca2+ (Figure 6C). Since a pathway with greater conductance necessitates lower driving forces to achieve a given flux, and reactive oxygen species (ROS) production has been correlated with ETC driving forces (54), the increased conductance of the ETC with Ca2+ levels typical of exercising muscle may suggest a role for Ca2+ in minimizing ROS production upon the onset of exercise. Indeed, though Ca2+ given to inhibited mitochondria or in supraphysiologic doses causes an increase in ROS production (55), control mitochondria produce less ROS from Complexes I and III when given physiological levels of Ca2+ (56, 57).
Recent advancements in optical absorbance spectroscopy (31) have allowed for measurement of the status of individual complexes of the ETC without the use of artificial electron donors/acceptors or inhibitors and under conditions similar to those typically used in mitochondrial respiration studies. We employed these methods together with the force:flow analyses described above to determine the conductances of individual elements within the ETC. Surprisingly, we found that Ca2+ activated nearly every step within the ETC (Figure 9) with a 2.2-fold effect on LCI+III, a 2.4-fold effect on LCIVa, and a 2.2-fold effect on LCIVb. Unfortunately, we were unable to measure the redox status of ubiquinone which precluded the separation of Complexes I and III. However, based on our measurements of the redox status of cytochrome bH and the proposed equilibrium between bH and ubiquinone (58-60), we can predict that the Ca2+ effect on LCI+III would be shared by both Complex I and Complex III. There have been few other reports on a Ca2+ stimulation of the ETC. Bender and Kadenbach (61) showed that Ca2+ recovered the inhibition of Complex IV activity by cAMP in bovine liver mitochondria, however, Ca2+ had no effect when cAMP was not present nor did it directly activate the isolated enzyme. Murphy et al. (15) suggested that the Ca2+ sensitivity of rat liver mitochondria was largely due to activation of flow through Complex III, but not Complex IV. However, Murphy et al. (15) reported a Ca2+-stimulated maximal flux through Complexes III and IV (from ubiquinone to O2) that was more than twice as high as the flux through Complex IV alone (from TMPD + ascorbate to O2), suggesting that maximal Complex IV flux was not attained with TMPD + ascorbate as substrate in that study.
To our knowledge, the current broadband, spectroscopic approach is the first report of Ca2+ activation of multiple steps within the ETC. This activation of the ETC by Ca2+ may significantly contribute to the Ca2+ stimulation of ATP production during exercise. Hogan's lab recently found that a ‘priming’ bout of contractions removed an apparent limitation to flux caused by the ETC at the onset of contractions in an isolated single muscle fiber (62). These authors speculated that an increase in mitochondrial Ca2+ may have been responsible, at least in part, for the removal of the limitation to flux by the ETC, though Ca2+ levels were not specifically measured (62).
Network Thermodynamic Analysis
By calculating the conductances for sequential steps within the mitochondrial energy conversion cascade, we are also able to treat the system as a series of resistors where the resistance of each part is the reciprocal of its conductance. The total resistance of the series of reactions is then equal to the sum of the individual resistances within the system. This approach is similar to network thermodynamic approaches used for modeling multiple reaction steps in a metabolic cascade (63, 64). Further, we can calculate the resistance of each individual element as a percentage of the total resistance and examine whether Ca2+ alters the distribution of resistances within the energy conversion elements. Ca2+ addition resulted in a 1.9-fold decrease in the total resistance to mitochondrial energy conversion as well as a decrease in the resistance of each element (Table 3). However, the distribution of the resistances within the reaction series was altered by Ca2+. The ETC contributed 64.8% of the total resistance to flux in the absence of Ca2+, while the presence of Ca2+ reduced the contribution of the ETC to 51.7% of the total resistance to energy conversion. Despite the well-known effects of Ca2+ on increasing the activity of substrate dehydrogenases (7, 65), Ca2+ trended towards an increase (p=0.09), not decrease, in resistance of the fuel transport/substrate dehydrogenase pathway relative to the other components of mitochondrial energy transfer (Table 3). Thus, while Ca2+ did activate fuel transport/substrate dehydrogenases (LFuel/DH, Table 2), the effects were relatively greater on downstream pathways. This was not surprising, however, as it was recently pointed out that Ca2+ stimulation of respiration cannot be explained by activation of dehydrogenases alone (53).
The data in Table 3 also suggest that Complex IV and Complex V and/or ANT are critical sites of flux control within mitochondria respiring at intermediate rates, as these sites make the greatest contribution to the total mitochondrial resistance to energy conversion. Complex IV, Complex V, and ANT have each previously been reported as important loci of flux control in heart mitochondria (66-68), though the simulations of Korzeniewski and Mazat (69) suggested that, in skeletal muscle mitochondria, these three sites have little or no flux control during intermediate respiration. However, the hexokinase-ATPase system utilized by Korzeniewski and Mazat assumed 85% of the flux control during intermediate respiration with an additional 8% coming from the proton leak, leaving little room for flux control by any mitochondrial enzyme. The CK energy clamp system used here exerts no flux control itself (68), thus allowing for greater sensitivity in detecting the relative control of mitochondrial sites over energy conversion (70).
The observation that multiple steps of oxidative phosphorylation are regulated by Ca2+ is consistent with previous control strength analyses, using the approach of Kascer and Burns (71), finding that the control of oxidative phosphorylation is highly distributed under phosphorylating conditions (72-74). These studies used inhibitor titrations of different steps in the reaction series to establish if “excessive” activity was present and estimate the control strength of a given step based on the overall flux sensitivity to inhibitor action. These titrations, which did not compensate for changes in reaction driving forces as done here and which relied on the specificity of complex inhibitors, also revealed that Complex IV, ANT, and other steps within the ETC all contribute to the overall rate limitation of State 3 oxidative phosphorylation. In the absence of large changes in metabolite or intermediate concentrations, shared flux control among many sites within the energy conversion process necessitates a coordinated modulation of each site in order to achieve the large increases in flux observed in vivo (75). This theoretical prediction was bolstered by the in silico results of Korzeniewski (11, 76, 77) which, using a simplified model of oxidative phosphorylation, suggested that the Vmax's of the entire mitochondrial energy conversion process should be modulated by an external signal consistent with notions previously presented by Balaban (10) and Hochachka and Matheson (78) based on experimental data. Although previous cellular and whole tissue studies have found both pyruvate dehydrogenase (PDH) and Complex V to be activated by the onset of contractile work (49, 66, 79), experimental evidence for simultaneous, multi-site modulation by an external effector has been limited (6, 9, 80). The near ubiquitous activation across the mitochondrial energy conversion cascade observed here suggests that Ca2+ may play a role in the stimulation of oxidative phosphorylation in vivo contributing to the near metabolic homeostasis observed. However, the molecular mechanism for this effect is yet to be fully elucidated with the exception of a few dehydrogenases.
Contribution of Conductance and Driving Force to Flux
The force:flow and network thermodynamic analyses discussed above were done under the assumption that energetic flux can be explained by Ohm's Law. In other words, the current (Jo) must be equal to the voltage (ΔG) multiplied by the conductance (L) (Eq. 6). The linearity displayed in Figures 3, 4, 6, and 9 suggests that this was a valid assumption for nearly all steps within the oxidative phosphorylation cascade. With the establishment of flux as the product of driving force and conductance, we can then determine how much of the increase in flux due to Ca2+ can be attributed to a change in driving force versus a change in conductance. Ca2+ caused an average 2.01-fold increase in Jo (Figure 3A) when comparing mitochondria provided the same extramitochondrial conditions (fuel and ΔGATP). The driving force for oxidative phosphorylation (ΔGNADH – ΔGATP) increased on average by only 1.03-fold with Ca2+ (Figure 6A); consequently, 97% of the increase in Jo must be explained by an increase in the conductance of this pathway (LOxphos). The overall driving force for the ETC (ΔGNADH – ΔGΔΨ) actually decreased by 15% with Ca2+ (Figure 6C), and, as a result, the increase in LETC is able to explain the entire Ca2+- induced increase in flux down this pathway. Within the ETC, 100% and 98% of the greater flux observed with Ca2+ is explained by an increase in the conductances of Complex I+III (Figure 9A) and Complex IV (Figures 9C-D), respectively. Similarly, the driving force for the combined fuel transport and substrate dehydrogenase pathways (ΔGFuel – ΔGNADH) decreased slightly with Ca2+, suggesting that a change in conductance, and not driving force, is entirely responsible for the increase in flux observed with Ca2+. Although the level of NADH and ΔΨ merely reflect the balance of their respective production and utilization and do not offer direct insight into the specific location of any conductance changes, similar comparisons of the contribution of driving force versus conductance to the observed increase in flux can also be made for these two energetic intermediates. Ca2+ caused a 4% increase in both NADH and ΔΨ (Figure 4); thus, the contribution of these two driving forces to the 2.01-fold increase in Jo was minimal compared to the associated increases in conductance due to Ca2+.
Conversely, addition of Ca2+ led to an average 1.25-fold increase in ΔGΔΨ – ΔGATP (Figure 6B), thus, only 76% of the increase in flux through the ATP production and transport reactions can be explained by LATPase. That (ΔGΔΨ – ΔGATP) was also able to explain a significant fraction of the Ca2+-stimulated flux suggests that this thermodynamic parameter itself may play an important role in flux control. Similarly, the reduction level of cyt a607 (Figure 8e) is reported to be a primary controller of flux through Complex IV (67). Just as with (ΔGΔΨ – ΔGATP), the increase in reduction level of cyt a607 is able to explain 54% of the increase in flux through Complex IV due to Ca2+, leaving 46% to be explained by activation of the enzyme. Moreover, in preliminary experiments where Jo was manipulated first by titrating increasing amounts of fuel (Push) and subsequently by increasing the PCr/Cr ratio (Pull), of the energetic parameters measured here, only (ΔGΔΨ – ΔGATP) and the reduction level of a607 maintained a positive, linear relationship with Jo during both the Push and Pull phases (Figures S1 and S2). Thus, these data suggest that (ΔGΔΨ – ΔGATP), the reduction level of cyt a607, and the conductances through each step all play an important role in determining the rate of mitochondrial energy conversion.
Extrapolation to In Vivo Skeletal Muscle
The extrapolation of these data to in vivo conditions is complicated by the mitochondrial isolation process, the incubation conditions, and the removal from the local, cellular environment. However, these comparisons are useful in understanding these limitations. The addition of Ca2+ to levels similar to those observed during exercise in vivo provided a two-fold increase in the maximum velocity of mitochondrial energy conversion in vitro (Figure 3). Ca2+ has been proposed to play a significant role in the matching of energy supply with demand in the heart (12, 81) where AT P turnover can increase five-fold with no change in the cellular energy level (82). Evidence for a balanced activation of the energy supply and demand pathways in skeletal muscle had been limited to in silico models (11, 76, 77) until recently when Wüst et al. (13) reported that the rapid rise in Jo observed at the onset of muscle contractions in vivo was best described by a model of ‘parallel activation.’ These authors showed that the increase in [ADP] at the onset of exercise was insufficient to account for the fast rise in Jo observed; instead, an increase in the apparent Vmax of oxidative phosphorylation was required to explain their results. The [ADP] and Km values reported for the canine gastrocnemius in the study by Wüst et al. (13) covered the range evaluated here (range: 17 – 66 μM, Km: 43 μM), however, they reported ∼17-fold increase in Jo over this range of [ADP] in vivo, whereas we find a 4.2-fold increase in Jo with the combined effects of ADP and Ca2+ in vitro (Figure 3B). The lower dynamic range in vitro is also demonstrated by the respiratory control ratio of ∼15 (Table 1) when the in vivo values have been reported to approach 100 (1). The lower dynamic range of our measures could be due to a lower maximum rate of oxidative phosphorylation or due to a higher ‘resting’ rate. Combining the measured cytochrome a,a3 content of 11.8 ± 1.6 nmol cyt a/g wet weight for the porcine vastus intermedius with the measured in vitro Jo at ∼66 μM ADP (259.2 nmol O2/min/nmol cyt a) approaches the in vivo value reported by Wüst et al. (∼65 ml O2/kg muscle/min) while at ∼17 μM ADP – Ca2+, the rates were 15.2 ml O2/kg muscle/min (in vitro) and 3.8 ml O2/kg muscle/min (in vivo) suggesting that the maximum rate is similar under both conditions and that the discrepancy primarily resided in the resting rates (note that ‘resting’ here is defined as the 17 μM ADP, no Ca2+ condition). The reasons for this may be several-fold. First, in order to make simultaneous, quantitative measurements of Jo, NADH, and ΔΨ, we used isolated mitochondria removed from their native, reticular environment. Though these mitochondria were of high purity (21) and functional integrity, it is likely that the isolation process alters mitochondrial function to some degree (83). Indeed, PDH is reported to be activated after mitochondrial isolation (28, 84), and, together with other dehydrogenases, may contribute to a higher resting Jo in vitro. Similar results have been obtained for Complex IV and Complex V where heart biopsies had 2 – 4 fold lower activity compared to mitochondria isolated from the same tissue (49). Second, these studies were performed with an excess of glutamate and malate to ensure there would be no fuel limitations and to help maintain the steady state. This could result in a higher than normal delivery of reducing equivalents and also increase the ‘resting’ Jo. Finally, the leak rate may also be enhanced during the highly disruptive mitochondrial isolation process (83). Taking these points together, the combination of excess substrates, alterations in membrane leaks, and the activation of metabolic enzyme activity by the mitochondrial isolation process is likely to explain much of the increased ‘resting’ Jo in vitro compared to in vivo. However, the resultant lower Jo dynamic range in vitro would be expected to render the mitochondria less sensitive to Ca2+; thus, the results presented here may actually underestimate the effect of Ca2+ in vivo. Indeed, simultaneous measures of mitochondrial ΔΨ, NADH, cytochrome redox state and phosphorylation potential in the intact functioning muscle should provide a better understanding of how the mechanisms outlined in isolated mitochondria may be in play in vivo.
Assumptions and Calculations
The nature of these experiments cannot distinguish between mitochondrial surface and matrix calcium effects. It was assumed that most of these effects are primarily due to changes in matrix calcium based on several factors. First, it has been shown that matrix Ca2+ rises in vivo with muscle contraction. Rogers et al. (85) demonstrated using Ca2+- sensitive bioluminescence probes that the mitochondrial Ca2+ activity does increase with skeletal muscle contraction in an in vivo transgenic mouse. These data support the results of earlier, more invasive studies (86) and confirm the notion that an influx of Ca2+ into the mitochondrial matrix is occurring in the exercising muscle. Second, as reviewed by Glancy and Balaban (53), most of the effects on mitochondrial metabolism by Ca2+ are eliminated by blocking Ca2+ entry into the mitochondrial matrix. Extra-mitochondrial Ca2+ can impact some mitochondrial transporters, such as aralar (87) which, as part of the malate-aspartate shuttle (MAS), has been shown to play an important role in flux control in brain mitochondria (88). However, we believe there is little flux control by aralar in skeletal muscle mitochondria as aralar activity is five-fold higher in mitochondria from skeletal muscle compared to brain for any given [Ca2+] (89). Thus, while Ca2+-stimulation of aralar may remove a limitation to flux in brain mitochondria, the basal activity of aralar in skeletal muscle mitochondria is likely sufficient as to not impede flux. Moreover, in preliminary experiments, we gave mitochondria G+M and used arsenite to inhibit 2-oxoglutarate dehydrogenase, ensuring that only the mitochondrial components of the MAS were capable of providing NADH to the ETC and that aralar was the primary site of glutamate entry into the matrix. In these conditions, State 3 Jo was no different with and without Ca2+ and was similar to the No Ca2+ condition without arsenite present (data not shown). These results suggest that the two-fold activation of Jo with Ca2+ as shown in Figure 1 was largely through effects beyond those on aralar.
The calculation of the various ΔG values reported here requires a number of additional assumptions to be made. The first is the attainment of the fully oxidized and reduced states for each redox pair. For cytochromes c1 and c, we used sodium hydrosulfite to reach full chemical reduction at the end of each experiment. However, we are unable to use this method with NADH because, in addition to the NADH fluorescent enhancement by binding to Complex I (90), the fluorescent signal is dependent on mitochondrial integrity and is severely disturbed by sodium hydrosulfite. As a result, fully reduced NADH was determined at anoxia and in the presence of Ca2+ for every experiment. The fully oxidized state for NADH and the cytochromes was determined after the 6-minute Ca2+ depletion and subsequent additions of 10 mM Pi and 0.13 mM ADP. Under this condition, the fluorescent NADH signal is ∼10% above that of the dark current even without correcting for non-NADH fluorescent background in the mitochondria, suggesting that NADH can only be further oxidized a maximum of ∼10%. This implied that the primary reducing equivalent source for the cytochromes was highly oxidized under these conditions, supporting our assumption that this was a reasonable estimate of the fully oxidized state of the “downstream” cytochromes. We were unable to measure full chemical (ferricyanide) oxidation in intact mitochondria due to the disruption of the mitochondrial structure with this agent.
The next step in the ΔG calculations involves calculating redox potentials (Eh) from % reduced values (Eq. 1) and requires a midpoint potential (Em) for each redox pair. Em values, especially for the various forms of cyt a as well as cyt c, are highly variable throughout the literature, and while the choice of Em to use for each redox pair does alter the absolute ΔG values, the slopes in Figures 4, 6, 8, and 9 do not change regardless of the Em chosen. Thus, the Em values chosen have no effect on the relative conclusions made herein with regard to Ca2+. The final assumptions made in the ΔG calculations are the values to use for the number of electrons transferred (n), the relative distance electrons travel across the width of the inner membrane between redox pairs (z), the number of protons pumped (m), and the P/O ratio (p) (Eqs. 3-5). All ΔG calculations were made assuming 1 NADH donated 2 electrons (n) yielding 10 protons (m) resulting in 2.7 ATP (p) from the consumption of ½O2. The pumping of 4, 4, and 2 protons per 2 electrons passed by Complexes I, III, and IV, respectively, has been widely accepted. Further validation of the values chosen for n, m, and z and the Em values is provided by the measurement of force ratios (40-42) which provides the value for the number of protons pumped per electron transferred under equilibrium, or static head, conditions. Table 4 shows the close matching between the theoretical and measured stoichiometry values used in the free energy calculations, and perhaps more importantly, that there was no difference with the addition of Ca2+.
The number of protons required to elicit a 360° rotation of the γ subunit of Complex V and synthesize 3 ATP is thought to be determined by the size of the c ring within Complex V (91). Mammalian Complex V has 8 c subunits (92), thus H/ATP is 8/3 or 2.67. However, transport of ATP out of the mitochondria also comes at the expense of one proton, thus, the overall H/ATP is 3.67 yielding a P/O ratio of 10/3.67 or 2.7. This value represents the theoretical maximal P/O ratio, as the actual value may be lower due to contribution of the proton leak. Unfortunately, we did not measure proton leak kinetics here; however, based on the respiratory control ratios reported in Table 1, the contribution of the proton leak in these mitochondria under phosphorylating conditions is likely very low. By assuming that proton leak is 100% of State 4 respiration and zero at State 3 and utilizing a standard relationship between membrane potential and proton leak, we can estimate that accounting for the proton leak would alter the slopes in Figure 6B by ∼10% and have a less than 5% effect on the No Ca2+/Ca2+ ratio between slopes. Further, we do not expect a difference in proton leak between Ca2+ and No Ca2+ conditions as Ca2+ doesn't alter proton leak kinetics in either heart (80) or skeletal muscle mitochondria (6) oxidizing NAD-linked substrates and we find no difference in ADP/O with Ca2+ in heart mitochondria (9).
Additionally, we did not attempt to measure the contribution of the pH gradient to the protonmotive force in this study. Lambert and Brand (25) found that increasing [Pi] lowered the pH gradient in skeletal muscle mitochondria, and extrapolation of their data to 10 mM Pi as used here would make the pH gradient nearly zero. Moreover, the use of 15 mM sodium in our medium, and the resultant sodium/proton exchange, would be expected to drive the pH gradient even lower than that observed by Lambert and Brand (25). In addition, we previously reported that there was no pH gradient in phosphorylating mitochondria under similar conditions to those used in this study (23). Finally, Kavanagh et al. (6) reported that the pH gradient did not change across a wide range of respiration rates in skeletal muscle mitochondria given NAD-linked substrates with and without Ca2+. Thus, any contribution of the pH gradient could be expected to be the same for all points in the force:flow plots, thereby yielding no effect on the slopes and, therefore, the results reported here.
Initial free energy analyses involving cyt a were done similarly to those mentioned above where sodium hydrosulfite was used to determine the fully reduced state using the spectral peak observed at 605 nm, redox potential was determined using a published Em value, ΔG was calculated using the appropriate proton and electron stoichiometries, and these assumptions were validated by the measurement of the force ratios (Table 4). However, as discussed in previous work (31), closer examination revealed that the spectral peak for cyt a in the presence of oxygen was consistently observed at 607 nm and not 605 nm, suggesting that the detected species was the peroxy form of cyt a3 (31, 32). The peroxy form of cyt a3 is just one of several intermediates within the catalytic cycle of Complex IV and is not present in both oxidized and reduced forms as with the b and c cytochromes. Further complicating matters, maximum occupancy of a607 has been reported to represent only ∼30% of the total enzyme (93, 94), suggesting that most of the enzyme complex is in different redox states. These findings bring into question the validity of the assumptions made in the quantification of ΔGcyt a607 discussed above. It should be noted that the determination of cyt a content in detergent extracts with chemical reducing agents does not suffer from this complication since the entire Complex is moved to the fully reduced state. Fortunately, we can use the measurements of LETC and LCI+CIII to subtract the conductance of Complex I+III from the conductance of the entire ETC to yield another measurement of the conductance of Complex IV. Using this calculation, Ca2+ still provides a more than two-fold increase in the conductance of Complex IV, and the subsequent calculation of resistances as in Table 3 suggests that Complex IV is still the primary site of resistance in the absence of Ca2+ and that the relative resistance is reduced upon the addition of Ca2+ (data not shown). Additionally, calculation of the conductance of Complex IV can be done by combining LCIVa and LCIVb and plotting (ΔGcyt c – O2/H2O - ΔGΔΨ) versus Jo. Again, this calculation provides similar results with regard to the effect of Ca2+ on the conductance of Complex IV and its resistance relative to the entire energy conversion cascade. These two calculations, combined with the validity provided by the force ratio measurements, suggest that the interpretations resultant from the initial analyses on the effect of Ca2+ on Complex IV were justified. Moreover, we performed additional analyses on the conductance of electron transfer within Complex IV using a method similar to Wikström and Morgan (32) where the peroxy and ferryl forms of cyt a were considered one redox couple and the ferryl and oxidized forms were considered another. These results are displayed in Figure 10 and further suggest that Ca2+ activates Complex IV by altering the conductance of electron transfer within the catalytic cycle of the enzyme in addition to reducing the contribution of Complex IV to the overall resistance to energy conversion.
Figure 10.
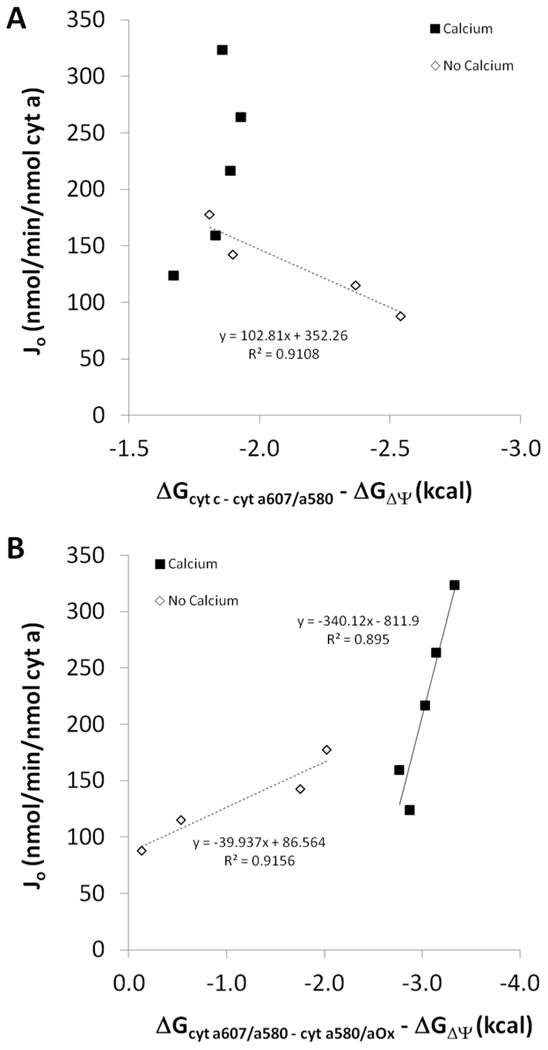
Conductance of electron transfer within Complex IV. A: Conductance of electron flux between the cytochrome c and cytochrome a607/a580 redox couples. B: Conductance of electron flux between the cytochrome a607/a580 and cytochrome a580/oxidized redox couples. Filled squares – calcium, open diamonds – no calcium. Trendlines are included for relationships with R2 values above 0.8. n = 4.
Ca2+ has also been shown to induce a spectral shift in heme a of Complex IV (95, 96), and it is possible that this confounded our results with respect to the Ca2+ activation of Complex IV depicted in Figures 9 and 10. To investigate this possibility, we repeated the experiments of Kirichenko et al. (95) using solubilized porcine mitochondria where cyt a was reduced by KCN, ascorbate, and TMPD. Indeed, addition of Ca2+ induced a red shift of cyt a (data not shown). However, the addition of Ca2+ to intact, respiring mitochondria where Complex IV is more than 90% oxidized induced no such shift in the peak for cyt a suggesting that the observed Ca2+ activation of Complex IV is not simply due to a Ca2+-induced spectral shift.
Summary
These data present the first experimental evidence of a systemic modulation of the oxidative phosphorylation cascade by Ca2+. This stimulation involves the near balanced activation of the entire mitochondrial energy conversion process from the generation of NADH and reduction of oxygen to the formation of ATP from ADP and Pi. While the mechanism explaining this systemic modulation with Ca2+ has yet to be elucidated, current evidence suggests that it is not direct Ca2+ binding as studies on isolated membrane enzymes and submitochondrial particles find no effect of Ca2+ (61, 97). Thus, it seems likely that Ca2+ is acting through an as yet unknown coordination of post-translational modifications (PTMs). Whether this involves alterations in supercomplex structure (98), changes in phosphorylation, multiple PTMs, or other possibilities will be the subject of future work. Additionally, extrapolation of these data to the conditions observed during exercise in skeletal muscle in vivo reveals that a significant fraction of the metabolic activation associated with exercise could be attributed to Ca2+ effects on oxidative phosphorylation coupled with an increase in [ADP], thereby contributing to the metabolic homeostasis of this dynamic tissue.
Supplementary Material
Acknowledgments
Funding Source: This study was supported by Intramural Funding of the Division of Intramural Research, National Heart, Lung, and Blood Institute.
Footnotes
Supporting Information: Additional supplemental figures are available free of charge via the Internet at http://pubs.acs.org.
References
- 1.Weibel ER, Hoppeler H. Exercise-induced maximal metabolic rate scales with muscle aerobic capacity. J Exp Biol. 2005;208:1635–1644. doi: 10.1242/jeb.01548. [DOI] [PubMed] [Google Scholar]
- 2.Combs CA, Aletras AH, Balaban RS. Effect of muscle action and metabolic strain on oxidative metabolic responses in human skeletal muscle. J Appl Physiol. 1999;87:1768–1775. doi: 10.1152/jappl.1999.87.5.1768. [DOI] [PubMed] [Google Scholar]
- 3.Connett R, Honig C. Regulation of VO2 in red muscle: do current biochemical hypotheses fit in vivo data. Am J Physiol. 1989;256:R898–R906. doi: 10.1152/ajpregu.1989.256.4.R898. [DOI] [PubMed] [Google Scholar]
- 4.Kushmerick M, Meyer R, Brown T. Regulation of oxygen consumption in fast- and slow twitch muscle. Am J Physiol. 1992;263:C598–C606. doi: 10.1152/ajpcell.1992.263.3.C598. [DOI] [PubMed] [Google Scholar]
- 5.Johnston JD, Brand MD. Stimulation of the respiration rate of rat liver mitochondria by sub-micromolar concentrations of extramitochondrial Ca2+ Biochem J. 1987;245:217–222. doi: 10.1042/bj2450217. [DOI] [PMC free article] [PubMed] [Google Scholar]
- 6.Kavanagh NI, Ainscow EK, Brand MD. Calcium regulation of oxidative phosphorylation in rat skeletal muscle mitochondria. Biochim Biophys Acta. 2000;1457:57–70. doi: 10.1016/s0005-2728(00)00054-2. [DOI] [PubMed] [Google Scholar]
- 7.McCormack JG, Halestrap AP, Denton RM. Role of calcium ions in regulation of mammalian intramitochondrial metabolism. Physiol Rev. 1990;70:391–425. doi: 10.1152/physrev.1990.70.2.391. [DOI] [PubMed] [Google Scholar]
- 8.Panov AV, Scaduto RC., Jr Substrate specific effects of calcium on metabolism of rat heart mitochondria. Am J Physiol. 1996;270:H1398–1406. doi: 10.1152/ajpheart.1996.270.4.H1398. [DOI] [PubMed] [Google Scholar]
- 9.Territo PR, Mootha VK, French SA, Balaban RS. Ca(2+) activation of heart mitochondrial oxidative phosphorylation: role of the F(0)/F(1)-ATPase. Am J Physiol Cell Physiol. 2000;278:C423–435. doi: 10.1152/ajpcell.2000.278.2.C423. [DOI] [PubMed] [Google Scholar]
- 10.Balaban RS. Regulation of oxidative phosphorylation in the mammalian cell. Am J Physiol. 1990;258:C377–389. doi: 10.1152/ajpcell.1990.258.3.C377. [DOI] [PubMed] [Google Scholar]
- 11.Korzeniewski B. Regulation of oxidative phosphorylation through parallel activation. Biophys Chem. 2007;129:93–110. doi: 10.1016/j.bpc.2007.05.013. [DOI] [PubMed] [Google Scholar]
- 12.Balaban RS, Bose S, French SA, Territo PR. Role of calcium in metabolic signaling between cardiac sarcoplasmic reticulum and mitochondria in vitro. Am J Physiol Cell Physiol. 2003;284:C285–293. doi: 10.1152/ajpcell.00129.2002. [DOI] [PubMed] [Google Scholar]
- 13.Wust RC, Grassi B, Hogan MC, Howlett RA, Gladden LB, Rossiter HB. Kinetic control of oxygen consumption during contractions in self-perfused skeletal muscle. J Physiol. 2011;589:3995–4009. doi: 10.1113/jphysiol.2010.203422. [DOI] [PMC free article] [PubMed] [Google Scholar]
- 14.McCormack JG, Denton RM. Role of calcium ions in the regulation of intramitochondrial metabolism. Properties of the Ca2+-sensitive dehydrogenases within intact uncoupled mitochondria from the white and brown adipose tissue of the rat. Biochem J. 1980;190:95–105. doi: 10.1042/bj1900095. [DOI] [PMC free article] [PubMed] [Google Scholar]
- 15.Murphy AN, Kelleher JK, Fiskum G. Submicromolar Ca2+ regulates phosphorylating respiration by normal rat liver and AS-30D hepatoma mitochondria by different mechanisms. J Biol Chem. 1990;265:10527–10534. [PubMed] [Google Scholar]
- 16.Martin C, Dubouchaud H, Mosoni L, Chardigny JM, Oudot A, Fontaine E, Vergely C, Keriel C, Rochette L, Leverve X, Demaison L. Abnormalities of mitochondrial functioning can partly explain the metabolic disorders encountered in sarcopenic gastrocnemius. Aging cell. 2007;6:165–177. doi: 10.1111/j.1474-9726.2007.00271.x. [DOI] [PubMed] [Google Scholar]
- 17.Carroll SL, Klein MG, Schneider MF. Decay of calcium transients after electrical stimulation in rat fast- and slow-twitch skeletal muscle fibres. J Physiol. 1997;501:573–588. doi: 10.1111/j.1469-7793.1997.573bm.x. [DOI] [PMC free article] [PubMed] [Google Scholar]
- 18.Westerblad H, Allen DG. Changes of myoplasmic calcium concentration during fatigue in single mouse muscle fibers. J Gen Physiol. 1991;98:615–635. doi: 10.1085/jgp.98.3.615. [DOI] [PMC free article] [PubMed] [Google Scholar]
- 19.Westerblad H, Duty S, Allen DG. Intracellular calcium concentration during low-frequency fatigue in isolated single fibers of mouse skeletal muscle. J Appl Physiol. 1993;75:382–388. doi: 10.1152/jappl.1993.75.1.382. [DOI] [PubMed] [Google Scholar]
- 20.Moreno-Sanchez R, Hogue BA, Hansford RG. Influence of NAD-linked dehydrogenase activity on flux through oxidative phosphorylation. Biochem J. 1990;268:421–428. doi: 10.1042/bj2680421. [DOI] [PMC free article] [PubMed] [Google Scholar]
- 21.Glancy B, Balaban RS. Protein composition and function of red and white skeletal muscle mitochondria. Am J Physiol Cell Physiol. 2011;300:C1280–1290. doi: 10.1152/ajpcell.00496.2010. [DOI] [PMC free article] [PubMed] [Google Scholar]
- 22.Balaban RS, Mootha VK, Arai A. Spectroscopic determination of cytochrome c oxidase content in tissues containing myoglobin or hemoglobin. Anal Biochem. 1996;237:274–278. doi: 10.1006/abio.1996.0239. [DOI] [PubMed] [Google Scholar]
- 23.Bose S, French S, Evans FJ, Joubert F, Balaban RS. Metabolic network control of oxidative phosphorylation: multiple roles of inorganic phosphate. J Biol Chem. 2003;278:39155–39165. doi: 10.1074/jbc.M306409200. [DOI] [PubMed] [Google Scholar]
- 24.Rasmussen HN, Rasmussen UF. Oxygen solubilities of media used in electrochemical respiration measurements. Anal Biochem. 2003;319:105–113. doi: 10.1016/s0003-2697(03)00274-4. [DOI] [PubMed] [Google Scholar]
- 25.Lambert AJ, Brand MD. Superoxide production by NADH:ubiquinone oxidoreductase (complex I) depends on the pH gradient across the mitochondrial inner membrane. Biochem J. 2004;382:511–517. doi: 10.1042/BJ20040485. [DOI] [PMC free article] [PubMed] [Google Scholar]
- 26.Fabiato A, Fabiato F. Calculator programs for computing the composition of the solutions containing multiple metals and ligands used for experiments in skinned muscle cells. J Physiol (Paris) 1979;75:463–505. [PubMed] [Google Scholar]
- 27.Reitz FB, Pollack GH. Labview virtual instruments for calcium buffer calculations. Comput Methods Programs Biomed. 2003;70:61–69. doi: 10.1016/s0169-2607(01)00196-1. [DOI] [PubMed] [Google Scholar]
- 28.Messer JI, Jackman MR, Willis WT. Pyruvate and citric acid cycle carbon requirements in isolated skeletal muscle mitochondria. Am J Physiol Cell Physiol. 2004;286:C565–572. doi: 10.1152/ajpcell.00146.2003. [DOI] [PubMed] [Google Scholar]
- 29.Lefort N, Glancy B, Bowen B, Willis WT, Bailowitz Z, De Filippis EA, Brophy C, Meyer C, Hojlund K, Yi Z, Mandarino LJ. Increased reactive oxygen species production and lower abundance of complex I subunits and carnitine palmitoyltransferase 1B protein despite normal mitochondrial respiration in insulin-resistant human skeletal muscle. Diabetes. 2010;59:2444–2452. doi: 10.2337/db10-0174. [DOI] [PMC free article] [PubMed] [Google Scholar]
- 30.Teague WE, Jr, Dobson GP. Effect of temperature on the creatine kinase equilibrium. J Biol Chem. 1992;267:14084–14093. [PubMed] [Google Scholar]
- 31.Chess D, Billings E, Covian R, Glancy B, French S, Taylor J, Murphy E, Balaban RS. Optical spectroscopy of mitochondrial oxidative phosphorylation complexes using an integrating sphere: analysis of steady state reducing equivalent distributions, (submitted) 2012 [Google Scholar]
- 32.Wikstrom M, Morgan JE. The dioxygen cycle. Spectral, kinetic, and thermodynamic characteristics of ferryl and peroxy intermediates observed by reversal of the cytochrome oxidase reaction. J Biol Chem. 1992;267:10266–10273. [PubMed] [Google Scholar]
- 33.Proshlyakov DA, Pressler MA, Babcock GT. Dioxygen activation and bond cleavage by mixed-valence cytochrome c oxidase. Proc Natl Acad Sci U S A. 1998;95:8020–8025. doi: 10.1073/pnas.95.14.8020. [DOI] [PMC free article] [PubMed] [Google Scholar]
- 34.Wikstrom M, Verkhovsky MI. Mechanism and energetics of proton translocation by the respiratory heme-copper oxidases. Biochim Biophys Acta. 2007;1767:1200–1214. doi: 10.1016/j.bbabio.2007.06.008. [DOI] [PubMed] [Google Scholar]
- 35.Kim YC, Wikstrom M, Hummer G. Kinetic gating of the proton pump in cytochrome c oxidase. Proc Natl Acad Sci U S A. 2009;106:13707–13712. doi: 10.1073/pnas.0903938106. [DOI] [PMC free article] [PubMed] [Google Scholar]
- 36.Tiesjema RH, Muijsers AO, van Gelder BF. Biochemical and biophysical studies on cytochrome c oxidase. X. Spectral and potentiometric properties of the hemes and coppers. Biochim Biophys Acta. 1973;305:19–28. doi: 10.1016/0005-2728(73)90227-2. [DOI] [PubMed] [Google Scholar]
- 37.Muijsers AO, Tiesjema RH, Henderson RW, Van Gelder BF. Biochemical and biophysical studies on cytochrome aa 3 . VII. The effect of cytochrome c on the oxidation-reduction potential of isolated cytochrome aa 3. Biochim Biophys Acta. 1972;267:216–221. doi: 10.1016/0005-2728(72)90154-5. [DOI] [PubMed] [Google Scholar]
- 38.Onsager L. Reciprocal relations in irreversible processes. II. Phys Rev. 1931;38:2265–2279. [Google Scholar]
- 39.Onsager L. Reciprocal relations in irreversible processes. I. Phys Rev. 1931;37:405–426. [Google Scholar]
- 40.Brown GC, Brand MD. Thermodynamic control of electron flux through mitochondrial cytochrome bc1 complex. Biochem J. 1985;225:399–405. doi: 10.1042/bj2250399. [DOI] [PMC free article] [PubMed] [Google Scholar]
- 41.Brown GC, Brand MD. Proton/electron stoichiometry of mitochondrial complex I estimated from the equilibrium thermodynamic force ratio. Biochem J. 1988;252:473–479. doi: 10.1042/bj2520473. [DOI] [PMC free article] [PubMed] [Google Scholar]
- 42.Lemasters JJ. The ATP-to-oxygen stoichiometries of oxidative phosphorylation by rat liver mitochondria. An analysis of ADP-induced oxygen jumps by linear nonequilibrium thermodynamics. J Biol Chem. 1984;259:13123–13130. [PubMed] [Google Scholar]
- 43.Hughes BP, Barritt GJ. Effects of glucagon and N6O2′- dibutyryladenosine 3′:5′-cyclic monophosphate on calcium transport in isolated rat liver mitochondria. Biochem J. 1978;176:295–304. doi: 10.1042/bj1760295. [DOI] [PMC free article] [PubMed] [Google Scholar]
- 44.Carafoli E, Lehninger AL. A survey of the interaction of calcium ions with mitochondria from different tissues and species. Biochem J. 1971;122:681–690. doi: 10.1042/bj1220681. [DOI] [PMC free article] [PubMed] [Google Scholar]
- 45.Territo PR, French SA, Dunleavy MC, Evans FJ, Balaban RS. Calcium activation of heart mitochondrial oxidative phosphorylation: rapid kinetics of mVO2, NADH, AND light scattering. J Biol Chem. 2001;276:2586–2599. doi: 10.1074/jbc.M002923200. [DOI] [PubMed] [Google Scholar]
- 46.Glancy B, Barstow T, Willis WT. Linear relation between time constant of oxygen uptake kinetics, total creatine, and mitochondrial content in vitro. Am J Physiol Cell Physiol. 2008;294:C79–87. doi: 10.1152/ajpcell.00138.2007. [DOI] [PubMed] [Google Scholar]
- 47.Kushmerick MJ, Meyer RA, Brown TR. Regulation of oxygen consumption in fast- and slow-twitch muscle. Am J Physiol. 1992;263:C598–606. doi: 10.1152/ajpcell.1992.263.3.C598. [DOI] [PubMed] [Google Scholar]
- 48.Ryschon TW, Fowler MD, Wysong RE, Anthony A, Balaban RS. Efficiency of human skeletal muscle in vivo: comparison of isometric, concentric, and eccentric muscle action. J Appl Physiol. 1997;83:867–874. doi: 10.1152/jappl.1997.83.3.867. [DOI] [PubMed] [Google Scholar]
- 49.Phillips D, Covian R, Aponte AM, Glancy B, Taylor JF, Chess D, Balaban RS. Regulation of oxidative phosphorylation complex activity: effects of tissue-specific metabolic stress within an allometric series and acute changes in workload. Am J Physiol Regul Integr Comp Physiol. 2012;302:R1034–1048. doi: 10.1152/ajpregu.00596.2011. [DOI] [PMC free article] [PubMed] [Google Scholar]
- 50.Turner PR, Westwood T, Regen CM, Steinhardt RA. Increased protein degradation results from elevated free calcium levels found in muscle from mdx mice. Nature. 1988;335:735–738. doi: 10.1038/335735a0. [DOI] [PubMed] [Google Scholar]
- 51.Jones AM, Wilkerson DP, Fulford J. Influence of dietary creatine supplementation on muscle phosphocreatine kinetics during knee-extensor exercise in humans. American Journal of Physiology-Regulatory Integrative and Comparative Physiology. 2009;296:R1078–R1087. doi: 10.1152/ajpregu.90896.2008. [DOI] [PubMed] [Google Scholar]
- 52.Kemp GJ, Taylor DJ, Radda GK. Control of phosphocreatine resynthesis during recovery from exercise in human skeletal muscle. NMR in biomedicine. 1993;6:66–72. doi: 10.1002/nbm.1940060111. [DOI] [PubMed] [Google Scholar]
- 53.Glancy B, Balaban RS. Role of mitochondrial Ca2+ in the regulation of cellular energetics. Biochemistry. 2012;51:2959–2973. doi: 10.1021/bi2018909. [DOI] [PMC free article] [PubMed] [Google Scholar]
- 54.Starkov AA, Fiskum G. Regulation of brain mitochondrial H2O2 production by membrane potential and NAD(P)H redox state. J Neurochem. 2003;86:1101–1107. doi: 10.1046/j.1471-4159.2003.01908.x. [DOI] [PubMed] [Google Scholar]
- 55.Hopper RK, Carroll S, Aponte AM, Johnson DT, French S, Shen RF, Witzmann FA, Harris RA, Balaban RS. Mitochondrial matrix phosphoproteome: effect of extra mitochondrial calcium. Biochemistry. 2006;45:2524–2536. doi: 10.1021/bi052475e. [DOI] [PMC free article] [PubMed] [Google Scholar]
- 56.Brookes PS, Yoon Y, Robotham JL, Anders MW, Sheu SS. Calcium, ATP, and ROS: a mitochondrial love-hate triangle. Am J Physiol Cell Physiol. 2004;287:C817–833. doi: 10.1152/ajpcell.00139.2004. [DOI] [PubMed] [Google Scholar]
- 57.Starkov AA, Polster BM, Fiskum G. Regulation of hydrogen peroxide production by brain mitochondria by calcium and Bax. J Neurochem. 2002;83:220–228. doi: 10.1046/j.1471-4159.2002.01153.x. [DOI] [PubMed] [Google Scholar]
- 58.Covian R, Trumpower BL. The dimeric structure of the cytochrome bc(1) complex prevents center P inhibition by reverse reactions at center N. Biochim Biophys Acta. 2008;1777:1044–1052. doi: 10.1016/j.bbabio.2008.04.008. [DOI] [PMC free article] [PubMed] [Google Scholar]
- 59.Covian R, Zwicker K, Rotsaert FA, Trumpower BL. Asymmetric and redox-specific binding of quinone and quinol at center N of the dimeric yeast cytochrome bc1 complex. Consequences for semiquinone stabilization. J Biol Chem. 2007;282:24198–24208. doi: 10.1074/jbc.M700662200. [DOI] [PubMed] [Google Scholar]
- 60.Kim N, Ripple MO, Springett R. Measurement of the mitochondrial membrane potential and pH gradient from the redox poise of the hemes of the bc1 complex. Biophys J. 2012;102:1194–1203. doi: 10.1016/j.bpj.2012.02.003. [DOI] [PMC free article] [PubMed] [Google Scholar]
- 61.Bender E, Kadenbach B. The allosteric ATP-inhibition of cytochrome c oxidase activity is reversibly switched on by cAMP-dependent phosphorylation. FEBS Lett. 2000;466:130–134. doi: 10.1016/s0014-5793(99)01773-1. [DOI] [PubMed] [Google Scholar]
- 62.Gandra PG, Nogueira L, Hogan MC. Mitochondrial activation at the onset of contractions in isolated myofibres during successive contractile periods. J Physiol. 2012;590:3597–3609. doi: 10.1113/jphysiol.2012.232405. [DOI] [PMC free article] [PubMed] [Google Scholar]
- 63.Kummel A, Panke S, Heinemann M. Systematic assignment of thermodynamic constraints in metabolic network models. BMC Bioinformatics. 2006;7:512. doi: 10.1186/1471-2105-7-512. [DOI] [PMC free article] [PubMed] [Google Scholar]
- 64.Oster GF, Perelson AS, Katchalsky A. Network thermodynamics: dynamic modelling of biophysical systems. Q Rev Biophys. 1973;6:1–134. doi: 10.1017/s0033583500000081. [DOI] [PubMed] [Google Scholar]
- 65.Wan B, LaNoue KF, Cheung JY, Scaduto RC., Jr Regulation of citric acid cycle by calcium. J Biol Chem. 1989;264:13430–13439. [PubMed] [Google Scholar]
- 66.Harris D, Das A. Control of mitochondrial ATP synthesis in the heart. Biochem J. 1991;280:561–573. doi: 10.1042/bj2800561. [DOI] [PMC free article] [PubMed] [Google Scholar]
- 67.Wilson DF, Owen CS, Holian A. Control of mitochondrial respiration: a quantitative evaluation of the roles of cytochrome c and oxygen. Arch Biochem Biophys. 1977;182:749–762. doi: 10.1016/0003-9861(77)90557-4. [DOI] [PubMed] [Google Scholar]
- 68.Kholodenko B, Zilinskiene V, Borutaite V, Ivanoviene L, Toleikis A, Praskevicius A. The role of adenine nucleotide translocators in regulation of oxidative phosphorylation in heart mitochondria. FEBS Lett. 1987;223:247–250. doi: 10.1016/0014-5793(87)80298-3. [DOI] [PubMed] [Google Scholar]
- 69.Korzeniewski B, Mazat JP. Theoretical studies on the control of oxidative phosphorylation in muscle mitochondria: application to mitochondrial deficiencies. Biochem J. 1996;319(Pt 1):143–148. doi: 10.1042/bj3190143. [DOI] [PMC free article] [PubMed] [Google Scholar]
- 70.Davis E, Davis Van-Thienen W. Rate control of phosphorylation-coupled respiration by rat liver mitochondria. Arch Biochem Biophys. 1984;233:573–581. doi: 10.1016/0003-9861(84)90481-8. [DOI] [PubMed] [Google Scholar]
- 71.Kacser H, Burns JA. The control of flux. Symp Soc Exp Biol. 1973;27:65–104. [PubMed] [Google Scholar]
- 72.Groen AK, Wanders RJ, Westerhoff HV, van der Meer R, Tager JM. Quantification of the contribution of various steps to the control of mitochondrial respiration. J Biol Chem. 1982;257:2754–2757. [PubMed] [Google Scholar]
- 73.Tager JM, Groen AK, Wanders RJ, Duszynski J, Westerhoff HV, Vervoorn RC. Control of mitochondrial respiration. Biochem Soc Trans. 1983;11:40–43. doi: 10.1042/bst0110040. [DOI] [PubMed] [Google Scholar]
- 74.Rossignol R, Letellier T, Malgat M, Rocher C, Mazat JP. Tissue variation in the control of oxidative phosphorylation: implication for mitochondrial diseases. Biochem J. 2000;347(Pt 1):45–53. [PMC free article] [PubMed] [Google Scholar]
- 75.Fell DA, Thomas S. Physiological control of metabolic flux: the requirement for multisite modulation. Biochem J. 1995;311(Pt 1):35–39. doi: 10.1042/bj3110035. [DOI] [PMC free article] [PubMed] [Google Scholar]
- 76.Korzeniewski B. Regulation of ATP supply during muscle contraction: theoretical studies. Biochem J. 1998;330(Pt 3):1189–1195. doi: 10.1042/bj3301189. [DOI] [PMC free article] [PubMed] [Google Scholar]
- 77.Korzeniewski B. Regulation of ATP supply in mammalian skeletal muscle during resting state-->intensive work transition. Biophys Chem. 2000;83:19–34. doi: 10.1016/s0301-4622(99)00120-9. [DOI] [PubMed] [Google Scholar]
- 78.Hochachka PW, Matheson GO. Regulating ATP turnover rates over broad dynamic work ranges in skeletal muscles. J Appl Physiol. 1992;73:1697–1703. doi: 10.1152/jappl.1992.73.5.1697. [DOI] [PubMed] [Google Scholar]
- 79.Hagg SA, Taylor SI, Ruberman NB. Glucose metabolism in perfused skeletal muscle. Pyruvate dehydrogenase activity in starvation, diabetes and exercise. Biochem J. 1976;158:203–210. doi: 10.1042/bj1580203. [DOI] [PMC free article] [PubMed] [Google Scholar]
- 80.Mildaziene V, Baniene R, Nauciene Z, Marcinkeviciute A, Morkuniene R, Borutaite V, Kholodenko B, Brown GC. Ca2+ stimulates both the respiratory and phosphorylation subsystems in rat heart mitochondria. Biochem J. 1996;320(Pt 1):329–334. doi: 10.1042/bj3200329. [DOI] [PMC free article] [PubMed] [Google Scholar]
- 81.Balaban RS. Cardiac energy metabolism homeostasis: role of cytosolic calcium. J Mol Cell Cardiol. 2002;34:1259–1271. doi: 10.1006/jmcc.2002.2082. [DOI] [PubMed] [Google Scholar]
- 82.Balaban RS, Kantor HL, Katz LA, Briggs RW. Relation between work and phosphate metabolite in the in vivo paced mammalian heart. Science. 1986;232:1121–1123. doi: 10.1126/science.3704638. [DOI] [PubMed] [Google Scholar]
- 83.Picard M, Taivassalo T, Ritchie D, Wright KJ, Thomas MM, Romestaing C, Hepple RT. Mitochondrial structure and function are disrupted by standard isolation methods. PLoS ONE. 2011;6:e18317. doi: 10.1371/journal.pone.0018317. [DOI] [PMC free article] [PubMed] [Google Scholar]
- 84.Kerbey AL, Randle PJ, Cooper RH, Whitehouse S, Pask HT, Denton RM. Regulation of pyruvate dehydrogenase in rat heart. Mechanism of regulation of proportions of dephosphorylated and phosphorylated enzyme by oxidation of fatty acids and ketone bodies and of effects of diabetes: role of coenzyme A, acetyl-coenzyme A and reduced and oxidized nicotinamide-adenine dinucleotide. Biochem J. 1976;154:327–348. doi: 10.1042/bj1540327. [DOI] [PMC free article] [PubMed] [Google Scholar]
- 85.Rogers KL, Picaud S, Roncali E, Boisgard R, Colasante C, Stinnakre J, Tavitian B, Brulet P. Non-invasive in vivo imaging of calcium signaling in mice. PLoS ONE. 2007;2:e974. doi: 10.1371/journal.pone.0000974. [DOI] [PMC free article] [PubMed] [Google Scholar]
- 86.Rudolf R, Mongillo M, Magalhaes PJ, Pozzan T. In vivo monitoring of Ca(2+) uptake into mitochondria of mouse skeletal muscle during contraction. J Cell Biol. 2004;166:527–536. doi: 10.1083/jcb.200403102. [DOI] [PMC free article] [PubMed] [Google Scholar]
- 87.Satrustegui J, Pardo B, Del Arco A. Mitochondrial transporters as novel targets for intracellular calcium signaling. Physiol Rev. 2007;87:29–67. doi: 10.1152/physrev.00005.2006. [DOI] [PubMed] [Google Scholar]
- 88.Gellerich FN, Gizatullina Z, Trumbekaite S, Korzeniewski B, Gaynutdinov T, Seppet E, Vielhaber S, Heinze HJ, Striggow F. Cytosolic Ca2+ regulates the energization of isolated brain mitochondria by formation of pyruvate through the malate-aspartate shuttle. Biochem J. 2012;443:747–755. doi: 10.1042/BJ20110765. [DOI] [PubMed] [Google Scholar]
- 89.Contreras L, Gomez-Puertas P, Iijima M, Kobayashi K, Saheki T, Satrustegui J. Ca2+ Activation kinetics of the two aspartate-glutamate mitochondrial carriers, aralar and citrin: role in the heart malate-aspartate NADH shuttle. J Biol Chem. 2007;282:7098–7106. doi: 10.1074/jbc.M610491200. [DOI] [PubMed] [Google Scholar]
- 90.Blinova K, Levine RL, Boja ES, Griffiths GL, Shi ZD, Ruddy B, Balaban RS. Mitochondrial NADH fluorescence is enhanced by complex I binding. Biochemistry. 2008;47:9636–9645. doi: 10.1021/bi800307y. [DOI] [PMC free article] [PubMed] [Google Scholar]
- 91.Ferguson SJ. ATP synthase: from sequence to ring size to the P/O ratio. Proc Natl Acad Sci U S A. 2010;107:16755–16756. doi: 10.1073/pnas.1012260107. [DOI] [PMC free article] [PubMed] [Google Scholar]
- 92.Watt IN, Montgomery MG, Runswick MJ, Leslie AG, Walker JE. Bioenergetic cost of making an adenosine triphosphate molecule in animal mitochondria. Proc Natl Acad Sci U S A. 2010;107:16823–16827. doi: 10.1073/pnas.1011099107. [DOI] [PMC free article] [PubMed] [Google Scholar]
- 93.Proshlyakov DA, Ogura T, Shinzawa-Itoh K, Yoshikawa S, Appelman EH, Kitagawa T. Selective resonance Raman observation of the “607 nm” form generated in the reaction of oxidized cytochrome c oxidase with hydrogen peroxide. J Biol Chem. 1994;269:29385–29388. [PubMed] [Google Scholar]
- 94.Proshlyakov DA, Ogura T, Shinzawa-Itoh K, Yoshikawa S, Kitagawa T. Microcirculating system for simultaneous determination of Raman and absorption spectra of enzymatic reaction intermediates and its application to the reaction of cytochrome c oxidase with hydrogen peroxide. Biochemistry. 1996;35:76–82. doi: 10.1021/bi9511705. [DOI] [PubMed] [Google Scholar]
- 95.Kirichenko A, Vygodina T, Mkrtchyan HM, Konstantinov A. Specific cation binding site in mammalian cytochrome oxidase. FEBS Lett. 1998;423:329–333. doi: 10.1016/s0014-5793(98)00117-3. [DOI] [PubMed] [Google Scholar]
- 96.Wikstrom M, Saari H. A spectral shift in cytochrome a induced by calcium ions. Biochim Biophys Acta. 1975;408:170–179. doi: 10.1016/0005-2728(75)90009-2. [DOI] [PubMed] [Google Scholar]
- 97.Panov AV, Scaduto RC., Jr Influence of calcium on NADH and succinate oxidation by rat heart submitochondrial particles. Arch Biochem Biophys. 1995;316:815–820. doi: 10.1006/abbi.1995.1109. [DOI] [PubMed] [Google Scholar]
- 98.Lenaz G, Genova ML. Structural and functional organization of the mitochondrial respiratory chain: a dynamic super-assembly. Int J Biochem Cell Biol. 2009;41:1750–1772. doi: 10.1016/j.biocel.2009.04.003. [DOI] [PubMed] [Google Scholar]
Associated Data
This section collects any data citations, data availability statements, or supplementary materials included in this article.