

Abstract
APOL1 kidney disease is a unique case in the field of the genetics of common disease: 2 variants (termed G1 and G2) with high population frequency have been repeatedly associated with nondiabetic CKDs, with very strong effect size (odds ratios 3–29) in populations of sub-Saharan African descent. This review provides an update on the spectrum of APOL1 kidney disease and on the worldwide distribution of these kidney risk variants. We also summarize the proper way to run a recessive analysis on joint and independent effects of APOL1 G1 and G2 kidney risk variants.
Keywords: Glomerular disease, Apolipoprotein L1, African admixture, APOL1 demographics, Chronic kidney disease
Introduction
In 2010, 2 APOL1 genetic variants (termed G1 and G2) were identified, which are both very frequent on African-derived chromosomes and strongly associated with FSGS and HIV-associated nephropathy (HIVAN).1,2 These associations were confirmed and extended to other glomerular diseases, emphasizing the importance of ApoL1 variant proteins for podocyte and, perhaps, kidney microvascular injury. ApoL1 evolved as an innate resistance factor against trypanosomes and, possibly, other pathogens.3–6 Although the mechanism of ApoL1-mediated pathogen lysis is fairly well worked out,4–6 its role in podocyte or other kidney cells remains elusive. This review will provide an update on the demographics of the APOL1 trypanolytic variants and on the spectrum of APOL1-associated nephropathies. Finally, we will discuss the recessive model of inheritance for the kidney risk alleles and provide advice on the correct way to analyze the joint and independent effects of APOL1 variants.
APOL1 Variants and Haplotypes
The APOL1 gene encodes the ApoL1 protein, which protects against human African trypanosomiasis (HAT, the cause of African sleeping sickness) by lysing the disease-causing trypanosomes.4,7 ApoL1 trypanolytic activity is determined by 3 protein domains encoded by the terminal APOL1 exon: a pore-forming domain, a pH-sensitive membrane-addressing domain, and the serum resistance-associated protein (SRA)-interacting domain (Fig 1A). The APOL1 kidney risk variants are located in the terminal exon of APOL1 within the SRA-binding domain.1 The G1 allele is composed of 2 missense variants in nearly absolute linkage disequilibrium: G1G (p.S342 G) and G1M (p.I384 M). The G1G missense variant is located within the SRA-binding domain but outside the SRA-binding epitope. In contrast, the G1M variant and the G2 6 base pair deletion, which results in the deletion of p.N388/Y389, occur precisely within the SRA-binding epitope comprising amino acids 370 to 392.1,5 However, the resistance to trypanosome infection was shown to be mostly driven by G1G, suggesting a different molecular mechanism for G1 and G2 isoforms.1 The G1 and G2 variants arose independently on separate chromosomes. Because of the close physical proximity of the 2 variants–the G1M and the G2 variant sites are separated by only 12 base pair–they have not undergone a recombination event that would bring them together on the same chromosome,1 so there is no haplotype carrying both G1 and G2 (Fig 1B).
Figure 1.
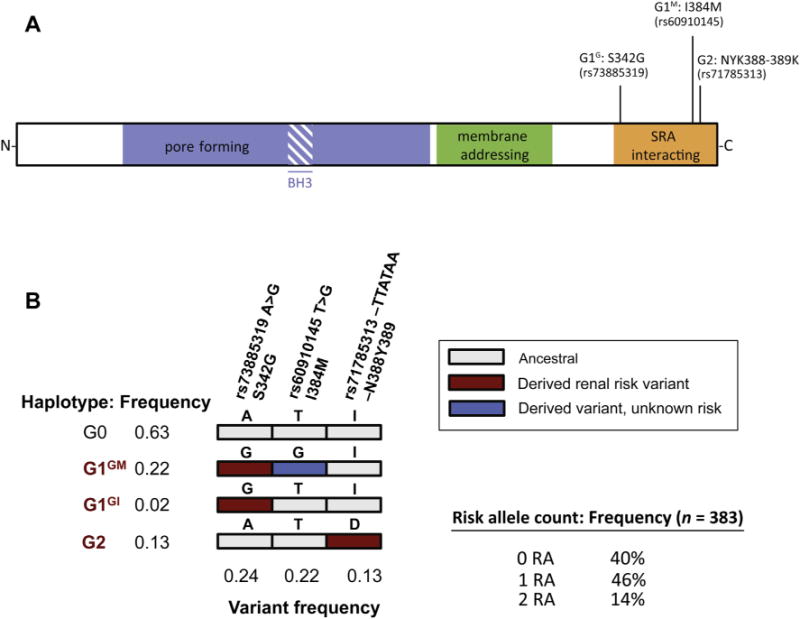
ApoL1 protein structure and haplotype distribution among African Americans. (A) Domain structure of ApoL1 protein, with the location of the G1 allele (S342 G and I384 M) and G2 allele (NYK388–389K). (B) Haplotype and variant frequencies for the general African American population.2 For the G1 alleles, the G1GM refers to the genotype with both mutations and G1GI refers to S342 G without I384 M. Abbreviations: BH3, Bcl2 homology domain 3; SRA, serum resistance antigen (of Trypanosoma brucei rhodesiense).
As discussed subsequently, the occurrence of the 2 variants on separate chromosomes has important implications when testing for genetic associations. Although the G1 variants are in near-absolute linkage disequilibrium and usually occur together on the same chromosome, G1G is infrequently observed in the absence of G1M. For simplicity, we will consider common G1GM haplotype to be “G1.” By analogy with the G1/G2 nomenclature, the wild-type or ancestral haplotype is termed G0. The G1/G2 variants and haplotype frequencies, shown in Figure 1B, are for African Americans; however, these same haplotypes have been observed throughout sub-Saharan Africa in surveys of African ethnic groups represented in the Human Genome Diversity Project and International HapMap Project (C.A.W., unpublished Sanger sequence data).2 As a practical matter, deviations from these expected haplotypes indicate genotypic, database, or sample handling errors rather than recombination events.
Population Genetics of APOL1
Recent data have clarified the frequency distribution of G1 and G2 variants in Africa and worldwide (Table 1, Fig 2).2,8–13 The G1 and G2 alleles are most frequent in Western Africa, with the highest G1 allele frequencies found in Ghana and Nigeria (>40%). The G2 variant also showed similar frequency clines, again with the highest frequencies in Ghana and Nigeria (allele frequency 6%–24%). There are distinctive west-east and west-south clines for both the G1 and G2 alleles. The prevailing hypothesis is that the APOL1 variants arose in the last 10,000 years on sub-Saharan Africa chromosomes, likely in West Africa,1 where they have been subject to intense recent positive selection.3 Interestingly, only the Yoruba people from Nigeria sampled by the Human Genome Diversity Project and the International HapMap Project show convincing evidence of a recent selective sweep, in the form of extended haplotype homozygosity in the region of chromosome 22 harboring the APOL1 alleles.1,14
Table 1.
Prevalence of APOL1 G1 and G2 Variants in Global Populations
| %G1G
|
%G1M
|
%G2
|
||||||
|---|---|---|---|---|---|---|---|---|
| Map Ref. | Population | Country | p.S342 G | p.I384 M | p.N388/Y389 | N | Source | References |
| West Africa | ||||||||
| 1 | Mandenka | Senegal | 5 | 2.4 | 21.4 | 22 | HGDP | Kopp et al2 |
| 2 | Yoruba | Nigeria | 45.2 | 45.2 | 7.5 | 60 | HapMap | Kopp et al2 |
| 2 | Yoruba | Nigeria | 45.2 | 45.2 | 16.7 | 25 | HGDP | Kopp et al2 |
| 2 | Yoruba | Nigeria | 39 | 39 | 6 | 18 | – | Ko et al8 |
| 3 | Igbo | Nigeria | 30.2 | 30.2 | 24.4 | 43 | – | Ulasi et al11 |
| 4 | Bulsa | Ghana | 11.4 | 11.4 | 21.4 | 22 | – | Tzur et al10 |
| 5 | Asante | Ghana | 40.9 | 41.2 | 12.9 | 35 | – | Tzur et al10 |
| West Central Africa | ||||||||
| 6 | Fulani | Cameroon | 0 | 0 | 8 | 19 | – | Ko et al8 |
| 7 | Lemande | Cameroon | 0 | 0 | 3 | 18 | – | Ko et al8 |
| 8 | Mada | Cameroon | 3 | 3 | 3 | 19 | – | Ko et al8 |
| 9 | Bakola | Cameroon | 5 | 5 | 5 | 19 | – | Ko et al8 |
| 10 | Somie | Cameroon | 16.4 | 15.3 | 12.3 | 65 | – | Tzur et al10 |
| 11 | Far North-CMR/Chad | Cameroon | 0.8 | 0 | 3.3 | 64 | – | Tzur et al10 |
| 12 | COG | Republic of Congo | 10.9 | 9.3 | 4.5 | 55 | – | Tzur et al10 |
| Central Africa | ||||||||
| 13 | Biaka | Central African Republic | 4.2 | 4 | 10.0 | 36 | HGDP/Kidd | Kopp et al2 |
| 14 | Mbuti | Democratic Republic of Congo | 0 | 0 | 3.8 | 15 | HGDP/Kidd | Kopp et al2 |
| North Africa | ||||||||
| 15 | Mozabite | Algeria | 1.8 | 1.8 | 0 | 30 | HGDP | Kopp et al2 |
| 16 | Kordofan | Sudan | 0 | 1.7 | 5 | 30 | – | Tzur et al10 |
| 17 | Afar | Ethiopia | 0 | 0 | 0 | 76 | – | Tzur et al10 |
| 18 | Amhara | Ethiopia | 0 | 0 | 0 | 76 | – | Tzur et al10 |
| 19 | Annuak | Ethiopia | 2 | 2 | 2.7 | 76 | – | Behar et al9 |
| 20 | Maale | Ethiopia | 0 | 0 | 0 | 76 | – | Tzur et al10 |
| 21 | Oromo | Ethiopia | 0 | 0 | 0 | 76 | – | Tzur et al10 |
| East Africa | ||||||||
| 22 | Luhya | Kenya | 5.1 | 5.4 | 7.1 | 90 | HapMap | Kopp et al2 |
| 23 | Borana | Kenya | 0 | 0 | 3 | 18 | – | Ko et al8 |
| 24 | Sengwer | Kenya | 0 | 0 | 3 | 19 | – | Ko et al8 |
| 25 | Bantu-NE | Kenya | 4.5 | 4.5 | 4.5 | 12 | HGDP | Kopp et al2 |
| 26 | Hadza | Tanzania | 5 | 5 | 0 | 19 | – | Ko et al8 |
| 27 | Iraqw | Tanzania | 5 | 5 | 3 | 19 | – | Ko et al8 |
| 28 | Sadawe | Tanzania | 5 | 5 | 0 | 19 | – | Ko et al8 |
| Southeastern Africa | ||||||||
| 29 | MWI | Malawi | 12 | 12 | 12 | 50 | – | Tzur et al10 |
| 30 | Sena | Mozambique | 12.2 | 12.0 | 11.0 | 51 | – | Tzur et al10 |
| Southern Africa | ||||||||
| 31 | San | Namibia | 0 | 0 | 1 | 7 | HGDP | Kopp et al2 |
| 32 | Motswana | Botswana | 5.5 | 5.13 | 5.5 | 570 | – | Winkler/Wester* |
| 33 | Bantu-SA | South African | 7.1 | 7 | 21.4 | 8 | HGDP | Kopp et al2 |
| 34 | Zulu | South African | 5.3 | 5.0 | 5.5 | 113 | – | Bhimma/Winkler* |
| Total | 2204 | |||||||
| Other world populations | ||||||||
| South and Central Asia | ||||||||
| Balochi | Pakistan | 0 | 0 | 2.1 | 25 | HGDP | Kopp et al2 | |
| Other | 8 Populations | 0 | 0 | 0 | 195 | HGDP | Kopp et al2 | |
| Eastern Asia | 18 Populations | 0 | 0 | 0 | 231 | HGDP | Kopp et al2 | |
| Europe (8 populations) | 8 Populations | 0 | 0 | 0 | 161 | HGDP | Kopp et al2 | |
| Oceana (2 populations) | 2 Populations | 0 | 0 | 0 | 39 | HGDP | Kopp et al2 | |
| Europe (8 populations) | 8 Populations | 0 | 0 | 0 | 161 | HGDP | Kopp et al2 | |
| Native Americans | 5 Populations | 0 | 0 | 0 | 107 | HGDP | Kopp et al2 | |
| North America | ||||||||
| African Americans | Mid-Atlantic United States | 22.1 | 22.0 | 13.4 | 383 | – | Kopp et al2 | |
| African Americans | Southwest United States | 19.7 | 19.7 | NR | 61 | 1000GP | 1000GP13 | |
| African Americans | – | 22.6 | 22.2 | 13.4 | 2200 | ESP6500 | ESP650012 | |
| African Americans | New York | 20.9 | 20.4 | 15.3 | 148 | – | Tzur et al10 | |
| European Americans | – | 0 | 0 | 0 | 4000 | ESP65000 | ESP650012 | |
| European Americans | Utah | 0 | 0 | 0 | 85 | 1000GP | 1000GP13 | |
| US Hispanic-New York City | New York | 1.8 | 1.8 | NR | – | Tzur et al10 | ||
| US Mexicans-Los Angeles | California | 0 | 0 | 0 | 66 | 1000GP | 1000GP13 | |
Abbreviation: NR, not reported.
Unpublished data from R.B. and C.A.W. for Durban, South Africa, and C.W.W., M.E., and C.A.W. for Gaberone, Botswana.
Figure 2.
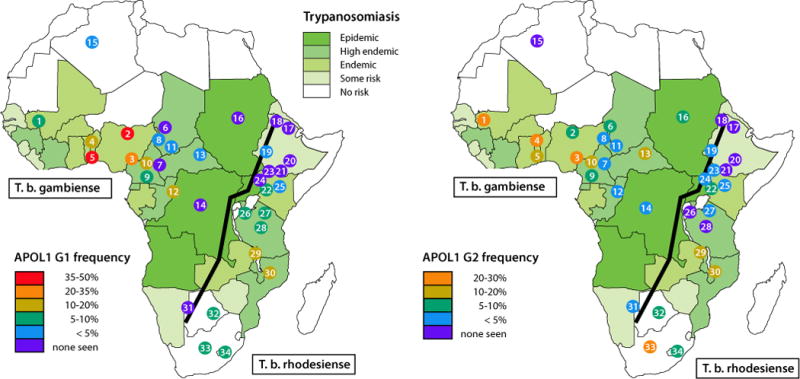
Geographic distribution of APOL1 risk alleles and of Trypanosoma brucei subspecies. Shown are the distributions of G1 and G2 alleles among population groups, mostly in sub-Saharan Africa, together with the population ranges for Trypanosoma brucei gambiense and Trypanosoma brucei rhodesiense.18 The Great Rift Valley is shown as line running from southwest to northeast. The population numbers refer to Table 1.
The variants are found outside Africa at high frequencies only in persons of recent African ancestry. The trans-Atlantic slave trade, lasting primarily from the 16th to 19th centuries, resulted in the forced diaspora of more than 11 million Africans from the Atlantic coastal regions of Africa and to a lesser degree from southeast Africa to the Caribbean and the Americas.15 The high allele frequencies of APOL1 G1 and G2 variants in African Americans and in African and Hispanic Caribbeans reflect the APOL1 G1 and G2 frequencies along the Atlantic coast of Africa, the source of the Atlantic slave trade (Table 1).16 Among 3 surveys of African Americans, G1 variants were found on 20% to 22% of chromosomes and G2 variants were found on 13% to 15% (Table 1); approximately 10% to 15% of African Americans carry 2 APOL1 kidney risk alleles. Hispanics from the New York region, many of whom migrated from the Caribbean and have African admixture, also carry APOL1 risk alleles but at much lower frequencies.9,17
APOL1 G1 and G2 Prevalence Is Not Coincident With Trypanosoma brucei rhodesiense Endemic Regions
The World Health Organization reports that HAT is restricted to the 36 sub-Saharan countries within the geographical range of the transmitting tsetse fly.18 Trypanosoma brucei rhodesiense occurs in 13 of the countries in east and central Africa, causing acute HAT and accounts for only 2% of cases. A second subspecies, Trypanosoma brucei gambiense, is widely distributed across 24 countries in West and Central Africa, causes chronic HAT, and accounts for the vast majority of cases of African sleeping sickness. Uganda is the only country where both forms of HAT are found: T brucei rhodesiense HAT is found in the northwestern region of the country and T brucei gambiense HAT in the southeastern region.18,19 The Democratic Republic of Congo accounted for 83% of reported HAT in 2012; elsewhere HAT is either under-reported because of the lack of surveillance or transmission has declined or stopped.
Of the 36 HAT endemic countries, APOL1 genotypes have been determined for 34 populations in 14 countries, representing 2204 individuals, that is, 4408 chromosomes (Fig 2 and Table 1). Of the 34 African populations with genotypic data, G1 variants were detected in 23 (68%), 7 of which were from T brucei rhodesiense endemic regions. The G2 variant was observed in 27 of 34 (79%) different ethnic groups. It remains a mystery why G2 has not been as strongly selected as G1, given that G2 is a more potent killer of T brucei rhodesiense and arose earlier than G1.1 This suggests that there may be aspects of the evolutionary story that remain to be learned.
Although the G1 and G2 variants restore trypanolytic potential only against T brucei rhodesiense, the African ethnic populations with the highest prevalence of G1 and G2 variants are found in T brucei gambiense endemic regions in West Africa, and this subspecies is resistant to lysis by the G1 and G2 protein isoforms. There are several possible scenarios that might explain this puzzle. First, the tsetse fly vectors for T brucei rhodesiense may have been displaced by the tsetse fly vector for T brucei gambiense because of environmental changes (eg, climate or forest depletion) in West Africa. Of the 8 tsetse fly species that transmit T brucei rhodesiense or T brucei gambiense, only Glossina fuscipes, the forest tsetse fly, is a vector for both subspecies.19,20 Second, the APOL1 variants may have been sufficiently prevalent in human populations to reduce the burden of T brucei rhodesiense below a threshold for transmission efficiency. Third, the APOL1 variants may have been selected for in West Africa by extracellular or intracellular pathogens other than T brucei rhodesiense. Whatever the pathogenic cause of the selective sweep on these variants, they have risen to extremely high frequency in West Africa and have introgressed into the gene pool of many sub-Saharan African ethnic groups from recent human migrations, likely from the Bantu expansion out of West Africa that has occurred over the past 5000 years.16
The map of frequency distribution drawn from various sources indicates that APOL1 G1 and G2 alleles are found throughout sub-Saharan Africa, albeit with widely differing frequencies (Fig 2).2,8–13 It also graphically shows the paucity of APOL1 genotypic data from central Africa, particularly where T brucei rhodesiense is endemic. The punctuated distribution of APOL1 alleles and the blank spots on the map highlight the critical need for extensive sampling of genome sequences among diverse African ethnic groups throughout Africa to catalog the extent of genetic diversity and to find clues for human diseases, some of which may result from pathogen-selected genes. The National Institutes of Health and the Wellcome Trust have funded the Human Heredity and Health in Africa (H3Africa) initiative to carry out large-scale population studies to reveal the extent and character of diversity throughout Africa. The long-term objective is to gain further understanding of the intersection of genetic variation and environmental factors, such as human pathogens, with diseases including kidney diseases.21
Spectrum of APOL1-Associated Kidney Disease
Table 2 presents APOL1 associations with specific kidney diseases and histopathologies. Case-control studies highlight the strong effect sizes (up to 29) and high frequency (up to 72%) of cases that carry 2 risk alleles for HIVAN, primary focal segmental glomerulosclerosis (FSGS),2 Lupus collapsing glomerulopathy,22,23 sickle cell disease nephropathy,24 and hypertension-attributed arterionephrosclerosis.25 Also shown in Table 2 are the correlations of 2 APOL1 risk alleles with specific histopathologies in a series of biopsies from HIV-positive patients with kidney disease. Carriage of 2 APOL1 risk alleles was highly elevated in HIVAN patients with collapsing glomerulosclerosis (62%).26 Among individuals with non-HIVAN kidney disease, the presence of 2 APOL1 risk alleles was elevated for FSGS (63%).27 Of the group of HIV-positive patients carrying 0 or 1 risk allele, only 12% had FSGS, but more than 40% had HIV immune complex disease (HIVICK). HIVICK appears not to be associated with APOL1 risk variants, although an association with HIVICK cannot be excluded because of the limited sample size. In addition to these specific histopathologies, carriage for 2 risk alleles was also associated with increased risk of proteinuria (≥200 mg/g) in HIV-positive women enrolled in the Women’s Interagency HIV Study.28
Table 2.
APOL1 Risk Alleles and Risk for Glomerular Disease Among African Americans
| Results
|
||||
|---|---|---|---|---|
| N | OR or RR | % with 2 RA | References | |
| Case-control studies | ||||
| HIV-associated nephropathy | 54 | 29 (13–68.5) | 72 | Kopp et al2 |
| Primary FSGS | 217 | 17 (11–26) | 72 | Kopp et al2 |
| Lupus collapsing glomerulopathy | 26 | 5.4 (0.4–12.1) | 50 | Larsen et al22 |
| Lupus with end-stage kidney disease | 855 | 2.7 (1.8–4.2) | 25 | Freedman et al23 |
| Sickle cell disease nephropathy | 520 | 3.4 relative risk for proteinuria | 45 | Ashley-Koch et al24 |
| Hypertension-attributed nephropathy | 675 | 2.6 (1.8–3.6); 4.6 (3.1–6.8) in progressors | 23 | Lipkowitz et al25 |
| Case-only biopsy series from HIV-positive patients | ||||
| HIV-associated nephropathy | 60 | – | 62 | Atta et al26 |
| HIV+FSGS | 35 | – | 63 | Fine et al27 |
| HIV immune complex kidney disease | 31 | – | 3 | Fine et al27 |
Abbreviations: AASK, African American Study of Kidney disease and hypertension; OR, odds ratio; RA, risk alleles; RR, relative risk. Associations of APOL1 risk variants with specific kidney disease are shown, in descending order of 2 RA carriage. The study of sickle cell anemia compared the RR for proteinuria conferred by APOL1 risk alleles. The study of lupus ESKD used lupus subjects lacking nephropathy as controls. Studies of pooled chronic kidney disease are omitted. The ORs with 95% confidence intervals in parentheses are shown if reported. For arterionephrosclerosis in the AASK study, progression was defined as urine protein/creatinine >0.6 g/g or serum creatinine >4 mg/dL (serum creatinine >3 mg/dL or end-stage kidney disease) during follow-up.
These studies reveal the uniqueness of APOL1 associations with specific kidney histopathologies. In contrast to most other complex disease genes, APOL1 variants are both very frequent and have substantial penetrance. It is a widely held tenet inthefield of human genetics that common variants generally have small effect sizes (low penetrance), whereas rare variants have the potential to have moderate-to-high penetrance as natural selection will tend to eliminate deleterious alleles from the gene pool.29 Although this concept is generally borne out, in a situation of strong selection by lethal, endemic pathogens that lead to selective sweeps on the protective variant, pathogenresistant variants with deleterious properties may rise to high frequency, as is the case for the sickle cell trait and the APOL1 trypanolytic G1 and G2 alleles.1 In the heterozygote state, APOL1 variants protect against trypanosomes and likely other pathogens, but in the homozygous or compound heterozygote state (“recessive” model), the variants contribute to kidney injury.1,2
The strongest effect size reported for APOL1 associations with kidney disease is for HIVAN (odds ratio [OR] = 29, Table 2).30 Interestingly, Skorecki and colleagues speculated years before the discovery of the chromosome 22 association with glomerular disease that Ethiopians would lack the “African renal susceptibility gene.”31 This was based on the observation that HIVAN was never diagnosed in black HIV-positive Ethiopians, in contrast to other African ancestry populations where HIVAN was a frequent manifestation of untreated HIV-1 infection.32 All 4 populations lacking both APOL1 G1 and G2 variants are located within Ethiopia (Fig 2), supporting a causal role for APOL1 G1 and G2 variants in HIVAN development.9
Additional studies have shown that the APOL1 G1 and G2 are strongly associated with nondiabetic end-stage kidney disease (ESKD) and hypertension-attributed ESKD (OR ~7), but no association has been reported for diabetic ESKD in case-control studies, consistent with studies identifying the chromosome 22 region only with nondiabetic ESKD.25,33–36 APOL1 G1 and G2 variants are also recessively associated with overall burden of nondiabetic CKD, but not diabetic CKD, in the Dallas Heart Study a large population-based cohort study.37 In the Atherosclerosis Risk in Communities study APOL1 risk alleles were associated with a 1.5-fold increased risk for CKD, and among those who developed CKD, there was a 1.9-fold increased risk of progression to ESKD regardless of diabetic status at study entry.38 Recently, carriage of 2 APOL1 risk alleles was associated with increased rate of progression to clinical end points in African Americans enrolled in the Chronic Renal Insufficiency Cohort, nearly half of whom had diabetes, and the African American Study of Kidney disease and hypertension.39 This was the first report showing an APOL1 association with declining estimated glomerular filtration rate and more rapid progression to clinical end points in African American patients with diabetes.
Finally, APOL1 risk variants were recently associated with atherosclerotic cardiovascular disease (CVD) in 2 independent cohorts, the Jackson Heart Study and the Women’s Health Initiative.40 Although CKD is a risk factor for CVD, these results were independent of CKD or traditional CVD risk factors.40 Therefore, the approximately 14% of African Americans bearing 2 APOL1 risk alleles (Fig 1B) are at substantially greater risk of developing CKD and possibly CVD compared with those carrying no or 1 APOL1 risk allele or compared with European Americans.
Recessive Model
Most reports argue for a strong recessive model of inheritance for APOL1 kidney risk alleles. Although effect size is much stronger for the recessive model, there are reports of additive or dominant associations for G1 but not for G2,41 and of a main effect for G1 but not for G2,42 suggesting that G2 might have a weaker or no independent effect. However, the apparent lack of association for the G2 allele is largely because of a statistical analysis artifact introduced by the failure to account for the presence of the second risk variant as advised by Kopp and colleagues2 (see detailed analytical description subsequently). Kopp and colleagues2 reported a weak association for G1 with FSGS (OR = 1.9) for carriage of 1 risk allele vs 0 risk allele, but the association with FSGS was much stronger for the G1 recessive model (OR = 23) for carriage of 2 risk alleles compared with 1 or no risk allele. In addition, the authors showed that the combination of any 2 risk alleles, in the homozygote or compound heterozygote state (G1/G2), is equivalent in effect size, reinforcing the argument for a strong recessive model. However, we cannot completely exclude that there might be an additive or dominant inheritance model for other kidney phenotypes or that there may be permissiveness for kidney injury for heterozygotes.2,10,43,44 Along this line, in 2 independent studies, the age-of-onset for dialysis for nondiabetic ESKD was a decade earlier for carriers of 2 risk alleles and 5 years earlier for carriers of a single G1 risk allele compared with carriers of a single G2 allele or to G0 homozygotes.10,44
Statistical Analysis of APOL1 Kidney Risk Alleles
Because the G1 and G2 alleles always occur on separate chromosomes and have equivalent effect sizes for kidney disease,2 the independent frequencies for G1 and G2 can be added to calculate the burden of risk variants in a population.1 To assess the joint effects of G1 and G2, the number of G1 and G2 risk alleles carried by each individual is summed; each individual will carry 2, 1, or 0 risk alleles: G1 and G2 homozygotes and G1/G2 compound heterozygotes represent 2 risk alleles, G1/G0 and G2/G0 heterozygotes represent 1 risk allele, and G0/G0 corresponds to 0 risk allele as shown in Figure 3A for normal controls and primary FSGS.
Figure 3.

Importance of considering both G1 and G2 alleles in the genetic analysis. Spurious or attenuated associations occur when APOL1 G1 or G2 are considered separately. (A) Analysis by count of risk alleles; bars show frequency of each genotype among FSGS controls and cases.2 Genotypes with 2 risk alleles (red) are strongly associated; genotypes with 1 or no risk alleles (yellow) show weak or no associations. There is no significant difference in disease susceptibility between subjects carrying 1 and no risk alleles. Analysis that considersG1 or G2 separately confounds the association by bringing risk genotypes–genotype with 2 risk alleles–into the groups carrying 1 or no copies of G1 or G2, respectively. (B) Analysis considering the number of copies of G1. Here a significant difference is observed in frequency of FSGS between individuals with 1 copy of G1 and individuals with no copies, suggesting a dominant effect. However, this is driven by the high frequency of individuals with the G1/G2 genotype–individuals with 2 risk alleles, but only 1 copy of G1–among FSGS cases. (C) Analysis considering the number of copies of G2. A much weaker recessive disease association is seen–this is significant with the data shown but may not be with weaker data or smaller effect sizes for a particular phenotype–because of the rarity of the G2/G2 genotype and because the more frequent G1/G2 and G1/G1 genotypes occur only in the comparison (one and no copies of G2) groups.
If one tries to assess the recessive effect of G1 by itself (2 G1 alleles, ie, G1/G1 – vs 0 or 1 G1 allele), the alternative G2 risk genotypes in the comparison group will weaken the recessive association of G1 with the phenotype while creating a spurious dominant effect because of the G1/G2 genotypes included among individuals with 1 copy of G1 (Fig 3B). Similarly for assessing the recessive effect of G2, G1 risk genotypes will be included in the comparison groups, and because G1 is more frequent in many populations, the G2 association may be obscured leading to the false conclusion that G2 has a weak or no association with the phenotype (Fig 3C).
To determine G1 or G2 independent effects, it is necessary to remove all individuals carrying the other risk allele from the analysis; the alternative of stratifying by the other factor is problematic since the associations, for example, 1 copy of G1 may be expected to be radically different depending on whether G2 is present.
Conclusions
The recessive association of APOL1 G1 and G2 risk variants with nondiabetic CKD is an unusual story of high-frequency variants with strong effect size, contrary to the “common disease-common variant” paradigm.45,46 There is evidence that APOL1 risk variants are associated with more severe disease in diabetic and hypertensive patients with CKD, the 2 leading causes of ESKD; whether this is evident that APOL1 variants are progression factors or that APOL1-associated kidney disease tends to progress more rapidly than other forms of glomerular injury remains to be determined. The burden of CKD and ESKD in the United States because of carriage of 2 risk alleles is considerable, but it may be much higher in sub-Saharan Africa, where the G1 and G2 alleles are found in most of the populations surveyed, rates of HIV infection are among the highest in the world, and treatment options are limited. For these reasons, it is essential to continue collecting data on APOL1 G1 and G2 variants in sub-Saharan African populations and deciphering the molecular mechanisms that damages kidney cells to translate APOL1 genetic data to the nephrology clinic.
CLINICAL SUMMARY.
APOL1 kidney risk alleles (G1 and G2) are common throughout sub-Saharan Africa and in individuals with African admixture.
APOL1 risk alleles protect against trypanosome infection and increase risk for CKD.
Approximately 14% of African Americans carry 2 APOL1 risk alleles.
APOL1-mediated kidney disease follows a recessive mode of inheritance.
APOL1 G1 and G2 risk alleles are strongly associated with many forms of CKD and those with 2 risk alleles experience more rapid progression to end-stage kidney disease.
Acknowledgments
This project has been funded in whole or in part with federal funds from the National Cancer Institute, National Institutes of Health (contract HHSN26120080001 E). The content of this publication does not necessarily reflect the views or policies of the Department of Health and Human Services nor does mention of trade names, commercial products, or organizations imply endorsement by the US Government. This Research was supported [in part] by the Intramural Research Program of the National Institutes of Health, National Cancer Institute, Center for Cancer Research, and National Institute of Diabetes and Digestive and Kidney Diseases. We thank Dr R. Bhimma (University of KwaZulu Natal) and Drs C. W. Wester (Vanderbilt University) and M. Essex (Harvard University) for providing DNA samples from South Africa and Botswana, respectively. We dedicate this article to the late Dr Howard Cann (Foundation Jean Dausset-CEPH) in recognition of his significant contributions to the field of human population genetics and for his leadership of the Human Genome Diversity Project.
References
- 1.Genovese G, Friedman DJ, Ross MD, et al. Association of trypanolytic ApoL1 variants with kidney disease in African Americans. Science. 2010;329(5993):841–845. doi: 10.1126/science.1193032. [DOI] [PMC free article] [PubMed] [Google Scholar]
- 2.Kopp JB, Nelson GW, Sampath K, et al. APOL1 genetic variants in focal segmental glomerulosclerosis and HIV-associated nephropathy. J Am Soc Nephrol. 2011;22(11):2129–2137. doi: 10.1681/ASN.2011040388. [DOI] [PMC free article] [PubMed] [Google Scholar]
- 3.Smith EE, Malik HS. The apolipoprotein L family of programmed cell death and immunity genes rapidly evolved in primates at discrete sites of host-pathogen interactions. Genome Res. 2009;19(5):850–858. doi: 10.1101/gr.085647.108. [DOI] [PMC free article] [PubMed] [Google Scholar]
- 4.Vanhamme L, Paturiaux-Hanocq F, Poelvoorde P, et al. Apolipoprotein L-I is the trypanosome lytic factor of human serum. Nature. 2003;422(6927):83–87. doi: 10.1038/nature01461. [DOI] [PubMed] [Google Scholar]
- 5.Lecordier L, Vanhollebeke B, Poelvoorde P, et al. C-terminal mutants of apolipoprotein L-I efficiently kill both Trypanosoma brucei brucei and Trypanosoma brucei rhodesiense. PLoS Pathog. 2009;5(12):e1000685. doi: 10.1371/journal.ppat.1000685. [DOI] [PMC free article] [PubMed] [Google Scholar]
- 6.Perez-Morga D, Vanhollebeke B, Paturiaux-Hanocq F, et al. Apolipo-protein L-I promotes trypanosome lysis by forming pores in lysosomal membranes. Science. 2005;309(5733):469–472. doi: 10.1126/science.1114566. [DOI] [PubMed] [Google Scholar]
- 7.Xong HV, Vanhamme L, Chamekh M, et al. A VSG expression site-associated gene confers resistance to human serum in Trypanosoma rhodesiense. Cell. 1998;95(6):839–846. doi: 10.1016/s0092-8674(00)81706-7. [DOI] [PubMed] [Google Scholar]
- 8.Ko WY, Rajan P, Gomez F, et al. Identifying Darwinian selection acting on different human APOL1 variants among diverse African populations. Am J Hum Genet. 2013;93(1):54–66. doi: 10.1016/j.ajhg.2013.05.014. [DOI] [PMC free article] [PubMed] [Google Scholar]
- 9.Behar DM, Kedem E, Rosset S, et al. Absence of APOL1 risk variants protects against HIV-associated nephropathy in the Ethiopian population. Am J Nephrol. 2011;34(5):452–459. doi: 10.1159/000332378. [DOI] [PubMed] [Google Scholar]
- 10.Tzur S, Rosset S, Skorecki K, Wasser WG. APOL1 allelic variants are associated with lower age of dialysis initiation and thereby increased dialysis vintage in African and Hispanic Americans with non-diabetic end-stage kidney disease. Nephrol Dial Transplant. 2012;27(4):1498–1505. doi: 10.1093/ndt/gfr796. [DOI] [PubMed] [Google Scholar]
- 11.Ulasi II, Tzur S, Wasser WG, et al. High population frequencies of APOL1 risk variants are associated with increased prevalence of non–diabetic chronic kidney disease in the Igbo people from south-eastern Nigeria. Nephron Clin Pract. 2013;123(1–2):123–128. doi: 10.1159/000353223. [DOI] [PubMed] [Google Scholar]
- 12.NHLBI “Grand Opportunity” Exome Sequencing Project. 2014 Available at: http://evs.gs.washington.edu/EVS/. Accessed March 1, 2014.
- 13.Abecasis GR, Altshuler D, Auton A, et al. A map of human genome variation from population-scale sequencing. Nat. 2010;467(7319):1061–1073. doi: 10.1038/nature09534. [DOI] [PMC free article] [PubMed] [Google Scholar]
- 14.Oleksyk TK, Nelson GW, An P, Kopp JB, Winkler CA. Worldwide distribution of the MYH9 kidney disease susceptibility alleles and haplotypes: evidence of historical selection in Africa. PLoS One. 2010;5(7):e11474. doi: 10.1371/journal.pone.0011474. [DOI] [PMC free article] [PubMed] [Google Scholar]
- 15.Klein HS, Klein J. The Atlantic Slave Trade. Cambridge, UK: Cambridge University Press; 1999. [Google Scholar]
- 16.Tishkoff SA, Reed FA, Friedlaender FR, et al. The genetic structure and history of Africans and African Americans. Science. 2009;324(5930):1035–1044. doi: 10.1126/science.1172257. [DOI] [PMC free article] [PubMed] [Google Scholar]
- 17.Rosset S, Tzur S, Behar DM, Wasser WG, Skorecki K. The population genetics of chronic kidney disease: insights from the MYH9-APOL1 locus. Nat Rev Nephrol. 2011;7(6):313–326. doi: 10.1038/nrneph.2011.52. [DOI] [PubMed] [Google Scholar]
- 18.World Health Organization. Human African Trypanosomiasis. 2014 Available at: http://www.who.int/trypanosomiasis_african/en/. Accessed March 1, 2014.
- 19.Aksoy S, Caccone A, Galvani AP, Okedi LM. Glossina fuscipes populations provide insights for human African trypanosomiasis transmission in Uganda. Trends Parasitol. 2013;29(8):394–406. doi: 10.1016/j.pt.2013.06.005. [DOI] [PMC free article] [PubMed] [Google Scholar]
- 20.Cecchi G, Paone M, Franco JR, et al. Towards the Atlas of human African trypanosomiasis. Int J Health Geogr. 2009;8:15. doi: 10.1186/1476-072X-8-15. [DOI] [PMC free article] [PubMed] [Google Scholar]
- 21.Ramsay M, Tiemessen CT, Choudhury A, Soodyall H. Africa: the next frontier for human disease gene discovery? Hum Mol Genet. 2011;20(R2):R214–R220. doi: 10.1093/hmg/ddr401. [DOI] [PubMed] [Google Scholar]
- 22.Larsen CP, Beggs ML, Saeed M, Walker PD. Apolipoprotein L1 risk variants associate with systemic lupus erythematosus-associated collapsing glomerulopathy. J Am Soc Nephrol. 2013;24(5):722–725. doi: 10.1681/ASN.2012121180. [DOI] [PMC free article] [PubMed] [Google Scholar]
- 23.Freedman BI, Langefeld CD, Andringa KK, et al. End-stage renal disease in African Americans with lupus nephritis is associated with APOL1. Arthritis Rheumatol. 2014;66(2):390–396. doi: 10.1002/art.38220. [DOI] [PMC free article] [PubMed] [Google Scholar]
- 24.Ashley-Koch AE, Okocha EC, Garrett ME, et al. MYH9 and APOL1 are both associated with sickle cell disease nephropathy. Br J Haematol. 2011;155(3):386–394. doi: 10.1111/j.1365-2141.2011.08832.x. [DOI] [PMC free article] [PubMed] [Google Scholar]
- 25.Lipkowitz MS, Freedman BI, Langefeld CD, et al. Apolipoprotein L1 gene variants associate with hypertension-attributed nephropathy and the rate of kidney function decline in African Americans. Kidney Int. 2013;83(1):114–120. doi: 10.1038/ki.2012.263. [DOI] [PMC free article] [PubMed] [Google Scholar]
- 26.Atta MG, Estrella MM, Kuperman M, et al. HIV-associated nephropathy patients with and without apolipoprotein L1 gene variants have similar clinical and pathological characteristics. Kidney Int. 2012;82(3):338–343. doi: 10.1038/ki.2012.111. [DOI] [PMC free article] [PubMed] [Google Scholar]
- 27.Fine DM, Wasser WG, Estrella MM, et al. APOL1 risk variants predict histopathology and progression to ESRD in HIV-related kidney disease. J Am Soc Nephrol. 2012;23(2):343–350. doi: 10.1681/ASN.2011060562. [DOI] [PMC free article] [PubMed] [Google Scholar]
- 28.Estrella MM, Wyatt CM, Pearce CL, et al. Host APOL1 genotype is independently associated with proteinuria in HIV infection. Kidney Int. 2013;84(4):834–840. doi: 10.1038/ki.2013.203. [DOI] [PMC free article] [PubMed] [Google Scholar]
- 29.Pritchard JK. Are rare variants responsible for susceptibility to complex diseases? Am J Hum Genet. 2001;69(1):124–137. doi: 10.1086/321272. [DOI] [PMC free article] [PubMed] [Google Scholar]
- 30.Kopp JB, Vlahov D, Maralino G, et al. Candidate gene analysis in focal segmental glomerulosclerosis among African-Americans. J Am Soc Nephrol. 1998;9:390A. [Google Scholar]
- 31.Behar DM, Shlush LI, Maor C, Lorber M, Skorecki K. Absence of HIV-associated nephropathy in Ethiopians. Am J Kidney Dis. 2006;47(1):88–94. doi: 10.1053/j.ajkd.2005.09.023. [DOI] [PubMed] [Google Scholar]
- 32.Kopp J, Winkler CA. HIV-associated nephropathy in African Americans. Kidney Int. 2003;65(Suppl 83):S43–S49. doi: 10.1046/j.1523-1755.63.s83.10.x. [DOI] [PubMed] [Google Scholar]
- 33.Kopp JB, Smith MW, Nelson GW, et al. MYH9 is a major-effect risk gene for focal segmental glomerulosclerosis. Nat Genet. 2008;40(10):1175–1184. doi: 10.1038/ng.226. [DOI] [PMC free article] [PubMed] [Google Scholar]
- 34.Kao WH, Klag MJ, Meoni LA, et al. MYH9 is associated with nondiabetic end-stage renal disease in African Americans. Nat Genet. 2008;40(10):1185–1192. doi: 10.1038/ng.232. [DOI] [PMC free article] [PubMed] [Google Scholar]
- 35.Freedman BI, Kopp JB, Langefeld CD, et al. The apolipoprotein L1 (APOL1) gene and nondiabetic nephropathy in African Americans. J Am Soc Nephrol. 2010;21(9):1422–1426. doi: 10.1681/ASN.2010070730. [DOI] [PMC free article] [PubMed] [Google Scholar]
- 36.Bostrom MA, Kao WH, Li M, et al. Genetic association and genegene interaction analyses in African American dialysis patients with nondiabetic nephropathy. Am J Kidney Dis. 2012;59(2):210–221. doi: 10.1053/j.ajkd.2011.09.020. [DOI] [PMC free article] [PubMed] [Google Scholar]
- 37.Friedman DJ, Kozlitina J, Genovese G, Jog P, Pollak MR. Population-based risk assessment of APOL1 on renal disease. J Am Soc Nephrol. 2011;22(11):2098–2105. doi: 10.1681/ASN.2011050519. [DOI] [PMC free article] [PubMed] [Google Scholar]
- 38.Foster MC, Coresh J, Fornage M, et al. APOL1 variants associate with increased risk of CKD among African Americans. J Am Soc Nephrol. 2013;24(9):1484–1491. doi: 10.1681/ASN.2013010113. [DOI] [PMC free article] [PubMed] [Google Scholar]
- 39.Parsa A, Kao WH, Xie D, et al. APOL1 risk variants, race, and progression of chronic kidney disease. N Engl J Med. 2013;369(23):2183–2196. doi: 10.1056/NEJMoa1310345. [DOI] [PMC free article] [PubMed] [Google Scholar]
- 40.Ito K, Bick AG, Flannick J, et al. Increased Burden of cardiovascular disease in carriers of APOL1 genetic variants. Circ Res. 2014;114(5):845–850. doi: 10.1161/CIRCRESAHA.114.302347. [DOI] [PMC free article] [PubMed] [Google Scholar]
- 41.Tzur S, Rosset S, Shemer R, et al. Missense mutations in the APOL1 gene are highly associated with end stage kidney disease risk previously attributed to the MYH9 gene. Hum Genet. 2010;128(3):345–350. doi: 10.1007/s00439-010-0861-0. [DOI] [PMC free article] [PubMed] [Google Scholar]
- 42.Tayo BO, Kramer H, Salako BL, et al. Genetic variation in APOL1 and MYH9 genes is associated with chronic kidney disease among Nigerians. Int Urol Nephrol. 2013;45(2):485–494. doi: 10.1007/s11255-012-0263-4. [DOI] [PMC free article] [PubMed] [Google Scholar]
- 43.Freedman BI, Langefeld CD, Turner J, et al. Association of APOL1 variants with mild kidney disease in the first-degree relatives of African American patients with non-diabetic end-stage renal disease. Kidney Int. 2012;82(7):805–811. doi: 10.1038/ki.2012.217. [DOI] [PMC free article] [PubMed] [Google Scholar]
- 44.Kanji Z, Powe CE, Wenger JB, et al. Genetic variation in APOL1 associates with younger age at hemodialysis initiation. J Am Soc Nephrol. 2011;22(11):2091–2097. doi: 10.1681/ASN.2010121234. [DOI] [PMC free article] [PubMed] [Google Scholar]
- 45.Lander ES. The new genomics: global views of biology. Science. 1996;274(5287):536–539. doi: 10.1126/science.274.5287.536. [DOI] [PubMed] [Google Scholar]
- 46.Hindorff LA, Sethupathy P, Junkins HA, et al. Potential etiologic and functional implications of genome–wide association loci for human diseases and traits. Proc Natl Acad Sci U S A. 2009;106(23):9362–9367. doi: 10.1073/pnas.0903103106. [DOI] [PMC free article] [PubMed] [Google Scholar]