Abstract

Proline utilization A (PutA) is a bifunctional enzyme that catalyzes the oxidation of proline to glutamate. Structures of type A PutAs have revealed the catalytic core consisting of proline dehydrogenase (PRODH) and Δ1-pyrroline-5-carboxylate dehydrogenase (P5CDH) modules connected by a substrate-channeling tunnel. Type B PutAs also have a C-terminal domain of unknown function (CTDUF) that is absent in type A PutAs. Small-angle X-ray scattering (SAXS), mutagenesis, and kinetics are used to determine the contributions of this domain to PutA structure and function. The 1127-residue Rhodobacter capsulatus PutA (RcPutA) is used as a representative CTDUF-containing type B PutA. The reaction progress curve for the coupled PRODH–P5CDH activity of RcPutA does not exhibit a time lag, implying a substrate channeling mechanism. RcPutA is monomeric in solution, which is unprecedented for PutAs. SAXS rigid body modeling with target–decoy validation is used to build a model of RcPutA. On the basis of homology to aldehyde dehydrogenases (ALDHs), the CTDUF is predicted to consist of a β-hairpin fused to a noncatalytic Rossmann fold domain. The predicted tertiary structural interactions of the CTDUF resemble the quaternary structural interactions in the type A PutA dimer interface. The model is tested by mutagenesis of the dimerization hairpin of a type A PutA and the CTDUF hairpin of RcPutA. Similar functional phenotypes are observed in the two sets of variants, supporting the hypothesis that the CTDUF mimics the type A PutA dimer interface. These results suggest annotation of the CTDUF as an ALDH superfamily domain that facilitates P5CDH activity and substrate channeling by stabilizing the aldehyde-binding site and sealing the substrate-channeling tunnel from the bulk medium.
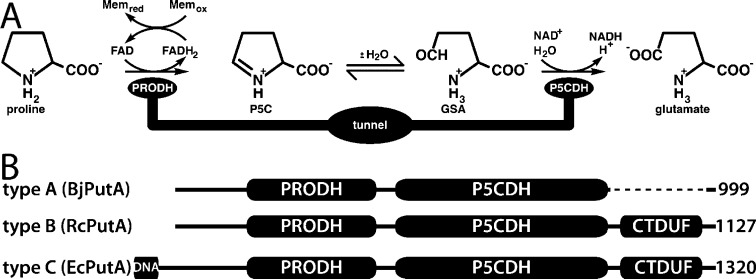
Proline utilization A (PutA) proteins are bifunctional enzymes that catalyze the oxidation of l-proline to l-glutamate in Gram-negative bacteria (Figure 1A).1−3 PutAs contain spatially separated proline dehydrogenase (PRODH) and Δ1-pyrroline-5-carboxylate (P5C) dehydrogenase (P5CDH) active sites that catalyze this four-electron oxidation process. The PRODH active site catalyzes the oxidation of l-proline to P5C with concomitant reduction of the enzyme-bound FAD. The P5CDH active site catalyzes the NAD+-dependent oxidation of l-glutamate-γ-semialdehyde (GSA, the hydrolysis product of P5C) to l-glutamate. In addition to these enzymatic activities, some PutAs, known as trifunctional PutAs, also function as transcriptional regulators of the put regulon.
Figure 1.
PutA reactions and domain architectures. (A) Reactions catalyzed by PutA. (B) Domain diagrams representing the three types of PutA domain architectures.
PutAs are large, multidomain proteins, and sequence analysis suggests three types of PutA based on domain architecture (Figure 1B).1,2 Type A PutAs contain just the catalytic core, which consists of N-terminal PRODH and C-terminal P5CDH modules separated by ∼50 residues. The 999-residue PutA from Bradyrhizobium japonicum (BjPutA) is the best-characterized type A PutA.4−6 Type B PutAs have an additional 100–200-residue C-terminal domain of unknown function (CTDUF) following the P5CDH module. The main subject of this study, PutA from Rhodobacter capsulatus (RcPutA), is a type B PutA. Type C PutAs have an N-terminal DNA-binding domain in addition to the catalytic core and CTDUF. These PutAs are transcriptional repressors of the put regulon and are thus trifunctional.7−9 PutA from Escherichia coli PutA (EcPutA) is the archetypal trifunctional PutA.
The crystal structures of the type A PutAs BjPutA5 and Geobacter sulfurreducens PutA (GsPutA)10 revealed the structure of the PutA catalytic core (Figure 2). The PRODH active site is located in a distorted (βα)8 barrel. The P5CDH module adopts the classic aldehyde dehydrogenase (ALDH) superfamily fold, which consists of three domains: Rossmann NAD+-binding, catalytic, and oligomerization domains. The two active sites are separated by a linear distance of 42 Å and connected by a buried tunnel that serves as a protected conduit for channeling the P5C/GSA intermediate from the PRODH site to the P5CDH site. The structures also revealed ancillary domains, denoted arm, α, and linker domains (Figure 2A), which help maintain the orientations of the two catalytic domains and form the walls of the substrate-channeling tunnel. Although the sequences of BjPutA and GsPutA are only 27% identical, the two structures are very similar [2.0 Å root-mean-square deviation (rmsd)], implying a high degree of structural conservation of the catalytic core throughout the PutA family. Thus, the domain architecture, the spatial disposition of the two active sites, and the intervening tunnel observed in BjPutA and GsPutA are likely present in all PutAs.
Figure 2.
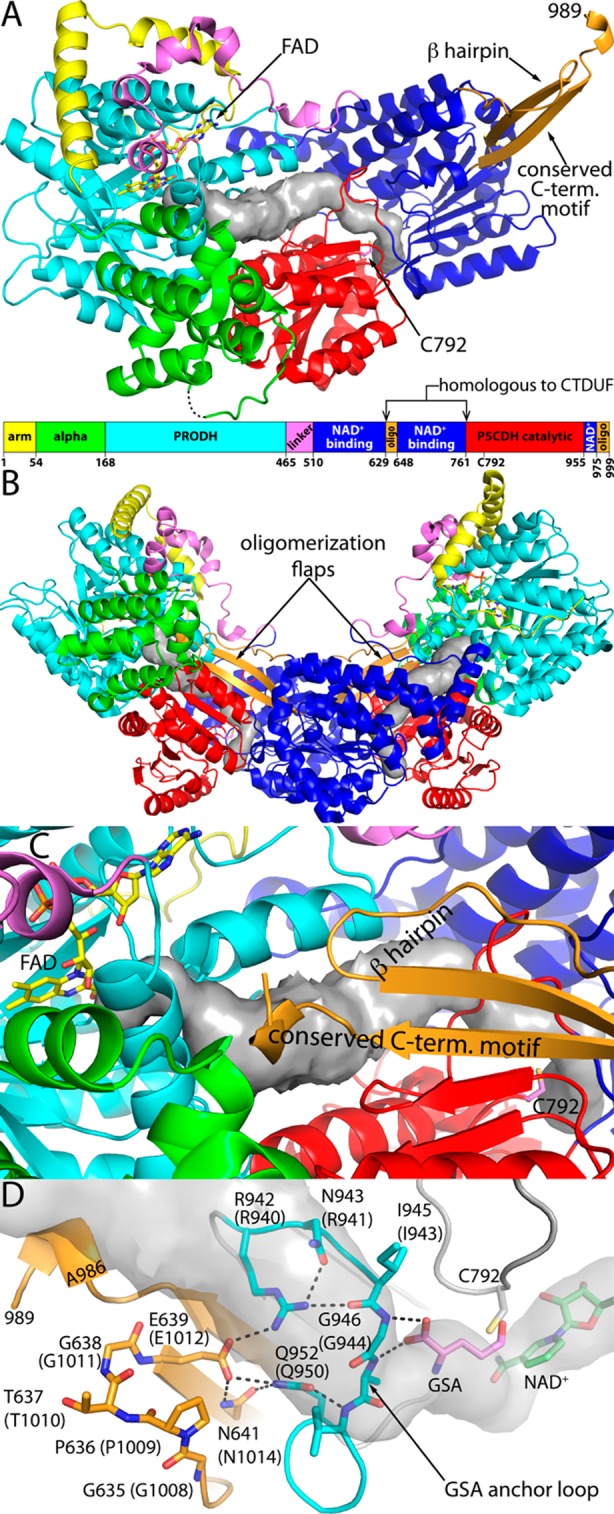
Structure of BjPutA. (A) Protomer structure emphasizing the arrangement of domains. The surface represents the substrate-channeling tunnel calculated using Mole.44 (B) BjPutA dimer. The two protomers are colored according to the legend in panel A. The surfaces represent the substrate-channeling tunnels. (C) Close-up view of the dimer interface, emphasizing how the dimerization flap covers the substrate-channeling tunnel. (D) Interactions between the oligomerization domain (orange) and the GSA anchor loop of the P5CDH catalytic domain (cyan) in BjPutA. The locations of NAD+ and glutamate were inferred from the structures of BjPutA–NAD+ (PDB entry 3HAZ(5)) and P5CDH–glutamate (PDB entry 3V9K(45)) complexes. Residue numbers of RcPutA are listed in parentheses. The surface represents the substrate-channeling tunnel.
The DNA-binding domain of trifunctional PutA is also well-characterized. It can be expressed as an ∼50-residue fragment that retains DNA binding activity,7 which has allowed structural and biophysical analysis. X-ray crystal and solution NMR structures have shown that the DNA-binding domain adopts the ribbon–helix–helix fold and revealed the details of protein–DNA interactions.7,8,11 Also, domain deletion analysis of EcPutA showed that the DNA-binding domain mediates dimerization of type C PutAs.12
In contrast to the catalytic core and DNA-binding domain, less is known about the CTDUF. Study of the CTDUF is hampered by the fact that it is not amenable to soluble expression as an isolated fragment (D. F. Becker and J. J. Tanner, unpublished results). Nevertheless, a few clues about function have been obtained. Domain deletion analysis of EcPutA ruled out a role for the CTDUF in dimerization of type C PutAs.12 The fact that type A PutAs exhibit both PRODH and P5CDH activities implies that the CTDUF is not directly involved in catalysis. Deletion of the CTDUF from EcPutA results in a loss of P5CDH activity, which suggested that the CTDUF might be situated near the P5CDH active site.12 By process of elimination, we speculated that the CTDUF could play a role in facilitating substrate channeling by providing tertiary structural interactions that help prevent escape of the intermediate P5C into the bulk medium.1,12
Here, we use small-angle X-ray scattering (SAXS), steady-state kinetics, and site-directed mutagenesis to evaluate a homology model of the CTDUF and elucidate the contributions of this domain to PutA function. Our results suggest that the CTDUF is homologous to the dinucleotide-binding domain of ALDHs and consists of a β-hairpin fused to a noncatalytic Rossmann fold domain. The β-hairpin facilitates P5CDH activity and substrate channeling by stabilizing the GSA anchor loop in the P5CDH active site and sealing the substrate-channeling tunnel from the bulk medium.
Experimental Procedures
Materials
P5C was synthesized by the method of Williams and Frank13 and stored in 1 M HCl at 4 °C. On the day of the experiments, the DL-P5C (50:50) was neutralized on ice by being titrated with 6 M NaOH. All experiments were conducted in Nanopure water.
Cloning of the RcPutA Gene
The gene encoding full-length RcPutA was amplified via PCR from R. capsulatus SB 1003 genomic DNA (generously provided by J. Cooley) using oligonucleotide primers with the restriction recognition sites NdeI and XhoI located at 5′ and 3′ ends (Table S1 of the Supporting Information). PCR was conducted using 50 μL volumes containing 5.0 μL of 10× buffer, 2 μL of R. capsulatus genomic DNA, 2.5 μL of each PCR forward and reverse primer (1 μM), 1 μL of 10 mM dNTPs, and 1 μL of Pfu DNA polymerase (Agilent); distilled water was added to a final volume of 50 μL. PCR was run under the following cycling conditions: 95 °C for 5 min, followed by 30 cycles of 95 °C for 1 min, Tm at 56 °C for 30 s, 72 °C for 6 min, and a final extension of 10 min at 72 °C. PCR products were detected by 1% agarose gel electrophoresis and extracted using a gel extraction kit (Qiagen). The amplified full-length RcPutA sequence was digested with NdeI and XhoI and then cloned into pET-28a. The gene sequence was confirmed by sequencing at the DNA core of the University of Missouri—Columbia.
Site-Directed Mutagenesis
Site-directed mutants and deletion constructs of RcPutA and BjPutA were generated using the QuikChange II site-directed mutagenesis kit (Agilent) using the primers listed in Table S1 of the Supporting Information. The mutations were confirmed by DNA sequencing. The mutant enzymes were purified as described for the wild-type (WT) enzymes, except where noted.
Protein Expression and Purification
BjPutA and BjPutA mutant enzymes were expressed and purified using immobilized metal affinity chromatography (Ni2+-charged His-Trap HP, GE Healthcare) as described previously.14 The N-terminal His tag was removed as described previously.14 The purified proteins were dialyzed into 50 mM Tris-HCl, 0.5 mM THP, 5% glycerol, and 0.5 mM EDTA (pH 8.0), quick frozen in liquid nitrogen, and stored at −80 °C.
RcPutA and RcPutA mutants were expressed in E. coli BL21(DE3)pLysS and purified as follows. Starter cultures of 10 mL were grown in LB medium overnight and used to inoculate 4 L of LB broth supplemented with 50 μg/mL kanamycin. After the culture had reached an optical density (OD600) of 0.7, 0.3 mM isopropyl β-d-1-thiogalactopyranoside was added to induce protein expression for 12 h at 18 °C. The cells were collected by centrifugation, resuspended in 50 mM Tris, 300 mM NaCl, 10 mM imidazole, and 5% glycerol (pH 7.5), and frozen at −80 °C. The frozen cells were thawed at 4 °C in the presence of protease inhibitors [0.1 mM tosyl phenylalanyl chloromethyl ketone, 0.05 mM 4-(2-aminoethyl)benzenesulfonyl fluoride, 0.1 μM pepstatin, 0.01 mM leupeptin, and 5 μM E-64] and broken using sonication. The mixture was centrifuged at 16500 rpm in an SS34 rotor for 1 h at 4 °C, filtered through a 0.45 μm filter, and loaded on a HisTrap HP column (5 mL) that had been charged with NiCl2 and equilibrated in 50 mM Tris, 300 mM NaCl, 10 mM imidazole, and 5% glycerol (pH 7.5). Washing steps were performed using the loading buffer supplemented with 10 mM imidazole followed by 30 mM imidazole. The target protein was eluted with 200 mM imidazole and then dialyzed overnight in the dark at 4 °C into 50 mM Tris, 0.5 mM EDTA, 0.5 mM THP, and 5% glycerol (pH 7.8) in preparation for further purification using anion exchange chromatography (HiTrap Q). The protein was bound to the HiTrap Q anion exchange column equilibrated with a buffer similar to the dialysis buffer and was eluted with a linear gradient from 0 to 1 M NaCl. The final purified proteins were supplemented with 0.05 mM FAD and NAD+ and then dialyzed against 50 mM Tris-HCl, 0.5 mM THP, 5% glycerol, and 0.5 mM EDTA (pH 8.0) at 4 °C overnight. This procedure was modified slightly for RcPutA mutant RcPutAE1012A. Because of poor expression and low protein yields for RcPutAE1012A, 12 L of LB broth was used for expression, 0.2% Triton X-100 was included in the sonication buffer, and the ion exchange step was omitted. The concentrations of the PutA proteins were determined from the amount of FAD bound to normalize for differences in FAD content.
Steady-State Assays
All steady-state assays were performed at 23 °C. Two PRODH assays were used. First, the PRODH kinetic constants for wild-type RcPutA were determined using proline and CoQ1 as the substrates as described previously.15 Second, the PRODH activities of wild-type RcPutA, RcPutA variants, and BjPutA variants were measured using dichlorophenolindophenol (DCPIP) as the terminal electron acceptor and phenazine methosulfate as the mediator (proline/DCPIP oxidoreductase assay) as previously described.16Km and kcat for proline were determined using PutA (0.085–0.09 μM) and proline (0–300 mM) while fixing the DCPIP concentration at 75 μM. The assays described above were conducted in 20 mM Tris buffer (pH 8.0, 10% glycerol). P5CDH activity was measured in 50 mM potassium phosphate (pH 7.5, 600 mM NaCl) as previously described17 using PutA enzyme (0.17–0.19 μM) and DL-P5C (0–5.5 mM) with the NAD+ concentration fixed at 200 μM. The progress of the reaction was monitored by following NADH formation at 340 nm (ε340 = 6.2 mM–1 cm–1). Data were collected using a path length of 0.15 cm on a Hi-Tech Scientific SF-61DX2 stopped-flow instrument. Assays were performed in triplicate, and values for Km and kcat were estimated by fitting initial velocities to the Michaelis–Menten equation (SigmaPlot version 12.0).
The PRODH–P5CDH coupled activity, in which proline is converted to glutamate, was measured as described previously.5 Briefly, PutA enzyme (0.17–0.19 μM) was mixed with 200 μM CoQ1, 40 mM proline, and 200 μM NAD+ in 50 mM potassium phosphate (pH 7.5, 600 mM NaCl). The progress of the reaction was followed by NAD+ reduction at 340 nm (ε340 = 6200 M–1 cm–1). The transient time was estimated by fitting the linear portion of the product concentration progress curve to a line and extrapolating to the x-axis.
Homology Modeling
Homology models of RcPutA domains were used in SAXS rigid body modeling. The models were obtained from the following servers using default settings: the SWISS-MODEL Workspace server,18 MODELER19 via the HHPred server20 of MPI Bioinformatics Toolkit,21 the Phyre2 server,22 and the I-TASSER server.23
All four servers identified BjPutA (PDB entry 3HAZ) as the best template for modeling the catalytic core (RcPutA residues 1–972). The level of sequence identity between BjPutA and RcPutA in this region is 52% (Figure S1 of the Supporting Information). The four models are very similar; the pairwise rmsds for Cα atoms span the range of 0.5–0.7 Å. A representative model of the catalytic core is shown in Figure S2A of the Supporting Information.
The four servers were also used to calculate models of the CTDUF (residues 994–1097). All four servers identified BjPutA residues 622–756 as the template (27% identical). This region of BjPutA corresponds to the oligomerization hairpin and Rossmann dinucleotide-binding domain (Figure 2A). The pairwise rmsds of the four models span the range of 0.7–2.3 Å. A representative model of the CTDUF is shown in Figure S2B of the Supporting Information.
A model of the conserved C-terminal motif of RcPutA (residues 1108–1119) was built using MODELER. The other servers did not produce models because of the short sequence length. The template structure consisted of BjPutA residues 978–989. This region of BjPutA corresponds to a β-strand followed by a turn of α-helix (Figure 2A). The sequence identity of the modeled region is 5 of 12 residues (Figure S1 of the Supporting Information). The model of the RcPutA C-terminal motif is shown in Figure S2B of the Supporting Information.
Small-Angle X-ray Scattering (SAXS)
Prior to SAXS data collection, purified RcPutA was subjected to size exclusion chromatography using a Superdex 200 column. The column buffer consisted of 50 mM Tris, 5% glycerol, 0.5 mM THP, and 50 mM NaCl (pH 7.8). The fractions were pooled, concentrated to ∼8.5 mg/mL, and dialyzed at 4 °C for 24 h against 50 mM Tris, 50 mM NaCl, 0.5 mM EDTA, 0.5 mM THP, and 5% glycerol (pH 7.8). The dialysate was reserved for use as the SAXS reference.
SAXS experiments were performed at SIBYLS beamline 12.3.1 of the Advanced Light Source through the mail-in program.24,25 For each sample, scattering intensities were measured at three nominal protein concentrations. Data were collected for each protein concentration at exposure times of 0.5, 1.0, 3.0, and 6.0 s. The scattering curves collected from the protein samples were corrected for background scattering using intensity data collected from the reference buffer.
The SAXS data were analyzed as follows. Composite scattering curves were generated with PRIMUS26 by scaling and merging the background-corrected low-q region data from the 0.5 or 1.0 s exposure with the high-q region data from the 3.0 s exposure. PRIMUS was also used to perform Guinier analysis. GNOM was used to calculate pair distribution functions.27 GASBOR28 was used to calculate shape reconstructions. Fifty independent models were generated with GASBOR using a maximal particle dimension (Dmax) of 107 Å and no symmetry constraints. DAMAVER29 was used to average and filter the GASBOR models. Situs module pdb2vol was used to convert the averaged, filtered models into volumetric maps.30 SUPCOMB was used to superimpose dummy atom models.31 CRYSOL was used to calculate theoretical SAXS curves from atomic models.32 The molecular mass in solution was determined from SAXS data using the volume of correlation invariant33 as implemented previously34 and Porod–Debye analysis.35
SAXS Rigid Body Modeling
CORAL (COmplexes with RAndom Loops) of the ATSAS package36 was used to determine the structural relationship between the catalytic core and the CTDUF of RcPutA. The default settings of CORAL were used for all calculations. Three sets of rigid body calculations, denoted as CORAL set 1, CORAL set 2, and CORAL decoy set, were performed as follows.
For CORAL set 1, the catalytic core model (residues 1–972) was held fixed, residues 973–993 were modeled as a string of dummy residues, and the CTDUF model (residues 994–1097) was treated as a movable, rigid body. Each of the four models of the catalytic core was combined with each of the four models of the CTDUF for a total of 16 pairs. For every pair, 10 independent simulated annealing optimization calculations were performed, each starting from a different random number seed. Thus, a total of 160 CORAL poses were generated. The starting configuration for these calculations is shown in Figure S2C of the Supporting Information.
A second set of calculations (CORAL set 2) was performed in which the model of the conserved C-terminal motif (residues 1108–1119) was combined with the CTDUF models using structural similarity to the oligomerization flap of BjPutA. The resulting composite model was considered to be a single, movable rigid body in these calculations. Four such composite models were made by adding the conserved C-terminal motif model to each of the four CTDUF models. One of these composite models is shown in Figure S2B of the Supporting Information. These four composite models were paired with the four catalytic core models, and 30 CORAL calculations were performed for each pair to generate a total of 480 poses. Two different starting configurations were used for these calculations to ensure that the initial arrangement of domains did not bias the results (Figure S2C,D of the Supporting Information).
The CORAL decoy set was generated to validate the results of rigid body modeling. These calculations were performed using decoy structures in place of the CTDUF model. Four decoy structures were used: profilin IB (PDB entry 1ACF, 125 residues), ketosteroid isomerase (PDB entry 3SED, 126 residues), a VH domain (PDB entry 1T2J, 116 residues), and human bromodomain (PDB entry 3HMF, 118 residues). These structures are shown in Figure S3 of the Supporting Information. Each decoy domain was paired with each of the four models of the RcPutA catalytic core, and 20 CORAL calculations were performed for each pair for a total of 320 decoy poses.
Multiangle Light Scattering
The molecular mass of RcPutA in solution was estimated using a multiangle light scattering (MALS) detector (Wyatt Technology) coupled to a G5000PWXL size exclusion chromatography column (Tosoh Bioscience, Montgomeryville, PA). The column buffer consisted of 50 mM Tris-HCl, 50 mM NaCl, 0.5 mM EDTA, 0.5 mM THP, and 5% glycerol (pH 8.0). The flow rate was 0.75 mL/min. The data were analyzed using ASTRA software (Wyatt Technology).
Results
Kinetic Characterization of RcPutA
The RcPutA gene was cloned from genomic DNA to create a recombinant expression system. Recombinant RcPutA is purified as a soluble, yellow protein. Analysis of the purified protein via sodium dodecyl sulfate–polyacrylamide gel electrophoresis is consistent with the predicted molecular mass of 117 kDa. The UV–visible spectrum of RcPutA exhibits maxima at 380 and 451 nm, consistent with a flavoprotein. The flavin content is estimated to be 97%.
The PRODH steady-state kinetic parameters of RcPutA were determined using proline and CoQ1 as substrates. With proline as the variable substrate at a fixed CoQ1 concentration of 300 μM, Km is 5.6 ± 0.8 mM and kcat is 1.0 ± 0.1 s–1, which corresponds to a catalytic efficiency of 180 ± 30 M–1 s–1, a value that is similar to that previously reported for EcPutA (kcat/Km = 124 M–1 s–1).17 With CoQ1 as the variable substrate at a fixed proline concentration of 200 mM, the kinetic parameters are as follows: Km = 94 ± 19 μM, kcat = 2.0 ± 0.1 s–1, and kcat/Km = 21000 ± 4000 M–1 s–1.
The P5CDH activity of RcPutA using P5C as the variable substrate is characterized by a Km of 1530 ± 160 μM and a kcat of 7.3 ± 0.6 s–1. The efficiency of RcPutA (kcat/Km = 4800 ± 1000 M–1 s–1) appears to be nearly 2-fold higher than that of EcPutA (2580 M–1 s–1).17
The PRODH–P5CDH coupled activity of RcPutA was analyzed by monitoring NADH production from a reaction mixture containing proline, CoQ1, and NAD+. The PRODH–P5CDH coupled assay for wild-type RcPutA shows no apparent lag phase in the reaction progress curve (Figure 3A), suggesting that the intermediate L-P5C/GSA is channeled between the PRODH and P5CDH active sites.5 For a nonchanneling control, an equimolar mixture of the monofunctional RcPutA variants R454M and C791A was assayed. The RcPutA mutants R454M and C791A are devoid of PRODH and P5CDH activity, respectively. As described previously for other PutAs, a mixture containing both PutA monofunctional variants is able to oxidize proline to glutamate, but channeling is not possible.5,17 The reaction progress curve with the mixed variants shows a considerable lag time of ∼8 min before steady-state formation of NADH occurs (Figure 3A). This result with RcPutA is a diagnostic feature of substrate channeling in PutAs and is consistent with results reported previously for EcPutA17 and BjPutA5 and repeated here for BjPutA (Figure 3B).
Figure 3.
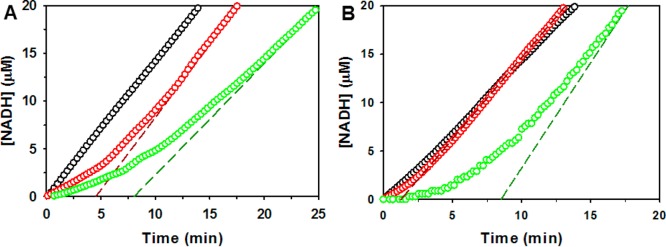
Kinetic analysis of the coupled PRODH–P5CDH reaction of RcPutA and BjPutA. (A) Steady-state progress curves of the production of NADH from proline by wild-type RcPutA (black circles), RcPutA1–1116 (red circles), and an equimolar mixture of RcPutA monofunctional variants R454M and C791A (green circles). (B) Steady-state progress curves of the production of NADH from proline by wild-type BjPutA (black circles), BjPutA1–986 (red circles), and an equimolar mixture of BjPutA monofunctional variants R456M and C792A (green circles). The dashed lines show the linear extrapolation used to estimate the lag time for each reaction.
SAXS Analysis and Oligomeric State of RcPutA
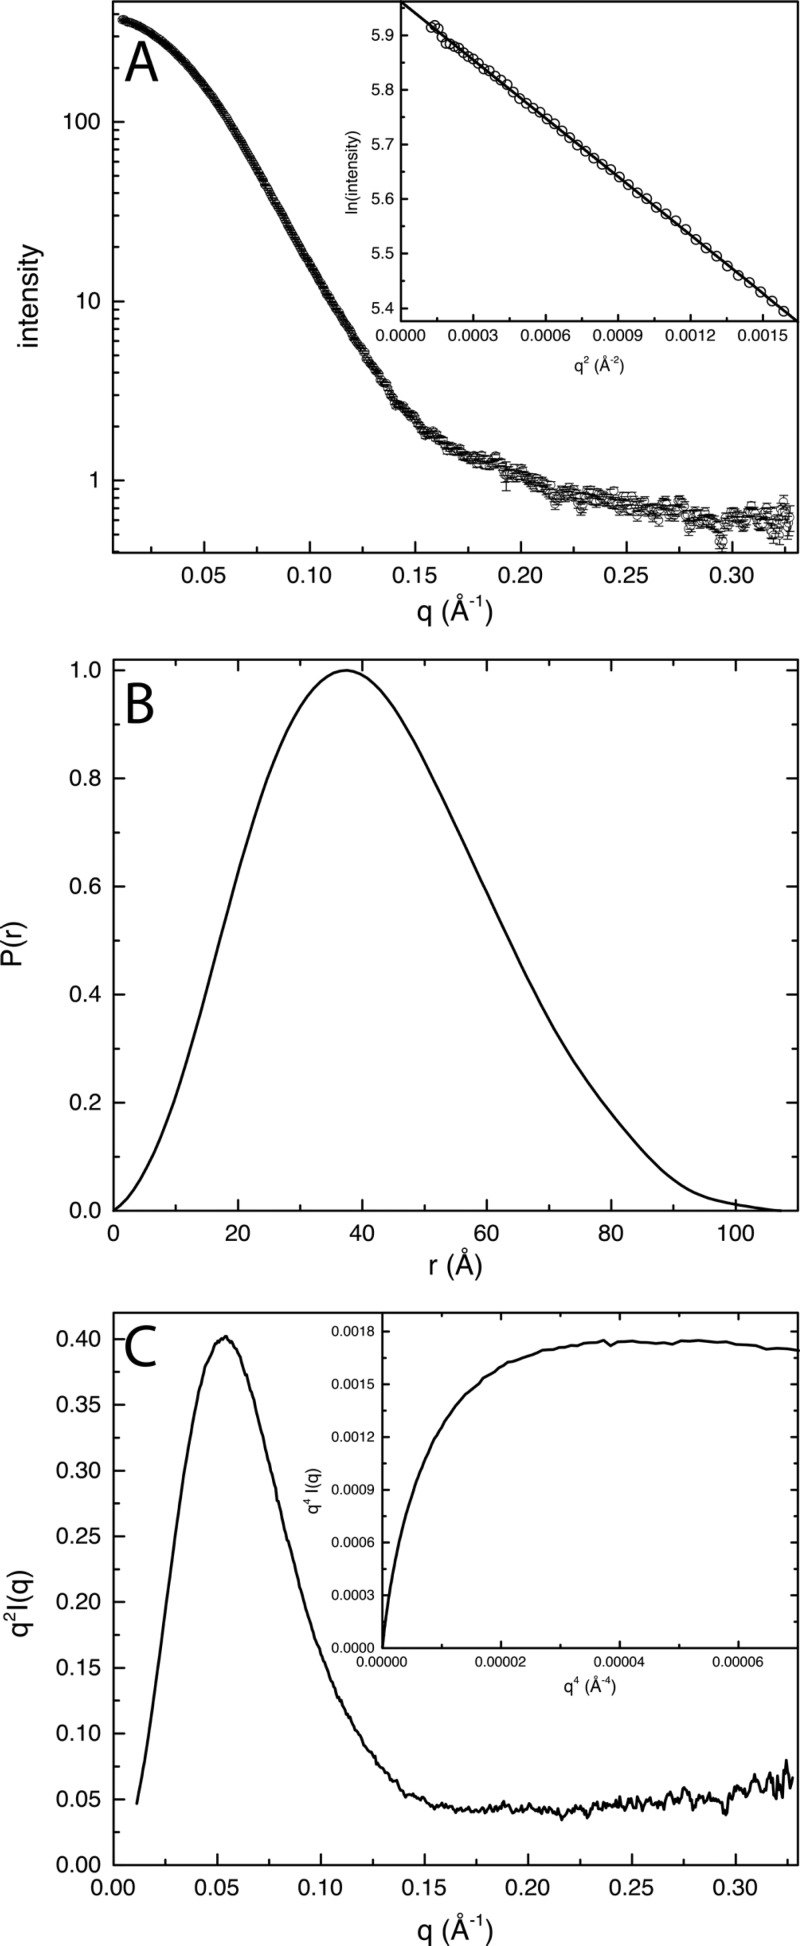
The solution structural properties of RcPutA were studied using SAXS (Figure 4). Guinier analysis of data collected at three protein concentrations yields a radius of gyration (Rg) of 32.3 ± 0.4 Å. Calculations of the pair distribution function [P(r)] suggest an Rg of 32.4–32.8 Å and a maximal particle dimension (Dmax) of 100–110 Å. The P(r) function exhibits a single maximum (r = 37 Å), which is indicative of a particle having a single lobe (Figure 4B).
Figure 4.
SAXS analysis of RcPutA. (A) Scattering curve and Guinier analysis (inset). The Guinier plot spans the qRg range of 0.364–1.29. (B) Pair distribution function. (C) Kratky plot and Porod–Debye plot (inset).
The SAXS data suggest that RcPutA is compact and folded. The Kratky plot exhibits the classic inverted parabola shape that is characteristic of a compact protein that lacks unfolded domains (Figure 4C). Likewise, the Porod–Debye plot has a distinct plateau, indicating a sharp boundary between the scattering particle and the solvent, which is a signature of a well-folded protein (Figure 4C, inset). These results suggest that the domains of PutA are folded and in close contact with each other.
The molecular mass (M) of RcPutA in solution was estimated from the SAXS data using the volume of correlation invariant.33 The volume of correlation of RcPutA is 670 Å2, which corresponds to an M of 108 kDa. This value is within 8% of the theoretical M of an RcPutA monomer of 117 kDa, implying that RcPutA is monomeric in solution.
Porod–Debye analysis35 was used to confirm the oligomeric state of RcPutA. The average excluded particle volume determined from 50 independent shape reconstruction calculations performed using DAMMIF37 is 195600 Å3. This value agrees well with the volume of 188931 Å3 from DATPOROD.36 The density of a monomeric RcPutA protein having a volume of 189000–196000 would be 1.0 g/mL, which is within the expected range for 0.8–1.6 g/mL proteins.35 In contrast, the assumption of higher-order oligomers of RcPutA having volumes of 189000–196000 Å3 implies densities of ≥2.0 g/mL, which is well outside of the expected range. This analysis is also consistent with RcPutA forming a monomer in solution.
The oligomeric state of RcPutA was confirmed via MALS (Figure 5). The data suggest that the purified protein is monodisperse with an apparent M of 124 ± 2 kDa. This value is within 6% of the predicted M of an RcPutA monomer. Thus, SAXS and MALS indicate that RcPutA is primarily monomeric in solution, which is unprecedented for PutAs.
Figure 5.
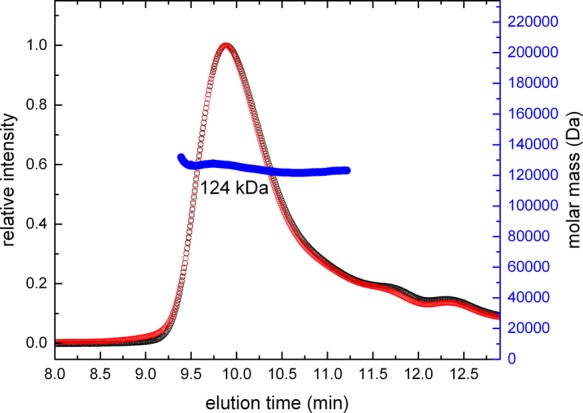
Determination of the molecular mass of RcPutA using MALS. The red curve represents the light scattering response measured at 90°. The black curve represents the response of the refractive index detector. The blue curve shows the derived molecular mass.
Shape reconstruction calculations were performed with GASBOR assuming a monomer (Figure 6A). The normalized spatial discrepancy of the ensemble is 1.02 ± 0.2, and only two of the 50 models were discarded during averaging (2σ cutoff), which indicates a reliable reconstruction. RcPutA resembles an ellipsoid with dimensions of 50 Å × 70 Å × 100 Å. The shape exhibits a distinct curvature when viewed down the 70 Å axis, which results in a pronounced convex surface (Figure 6A).
Figure 6.
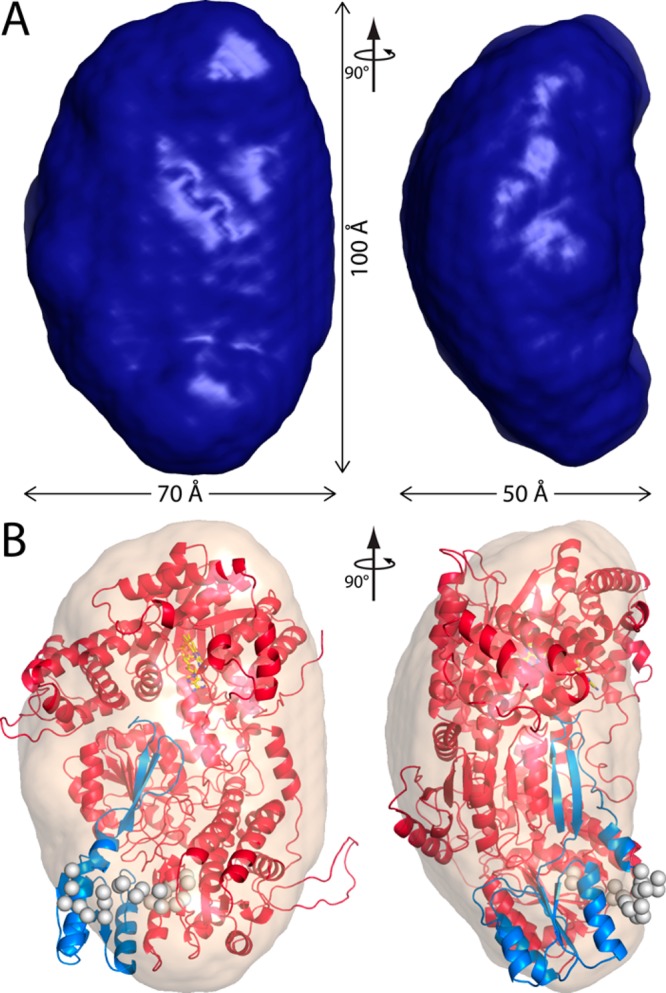
Shape reconstruction of RcPutA. (A) Shape reconstruction from GASBOR. The surface represents the averaged and filtered volume from 50 independent GASBOR calculations. The normalized spatial discrepancy is 1.02 ± 0.2. (B) Superposition of the GASBOR shape with a representative model from SAXS rigid body modeling [χ = 1.5, and rmsd = 1.0 (which corresponds to the green curve in Figure 8A)]. The catalytic core is colored red. The CTDUF with the C-terminal peptide composite model is colored blue. The spheres represent dummy residues linking the catalytic core and CTDUF.
Conservation of the β-Hairpin in the RcPutA CTDUF
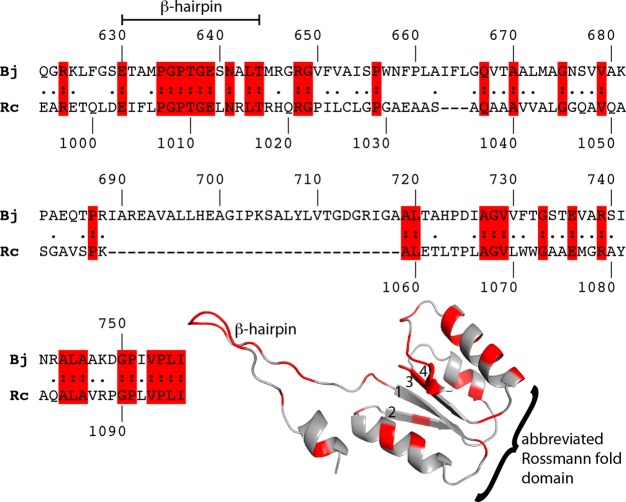
Remote homology detection predicts that the CTDUF is homologous to the N-terminal half of ALDHs.1,12 In particular, the CTDUF of RcPutA is 27% identical to residues 622–756 of BjPutA (Figure 7). This region of BjPutA corresponds to the β-hairpin of the oligomerization domain and the Rossmann fold NAD+-binding domain (Figure 2A).
Figure 7.
Local sequence alignment of BjPutA residues 622–756 and the CTDUF of RcPutA. A homology model of the RcPutA CTDUF based on this alignment from the PHYRE2 server is shown, with identical residues highlighted in red.
Accordingly, homology models of the RcPutA CTDUF calculated from the BjPutA structure using online servers feature a β-hairpin followed by a four-stranded parallel β-sheet flanked by three α-helices (Figure 7). Although the predicted β-hairpin is structurally homologous to the oligomerization β-hairpin of BjPutA and other ALDHs, it is not involved in dimerization of RcPutA, which is a monomeric protein. The predicted β–α–β motifs and strand order of the parallel β-sheet (2134) are diagnostic of the Rossmann dinucleotide-binding fold.38 The predicted Rossmann domain of the CTDUF is abbreviated in that it contains fewer than the standard number of six β-strands.
The predicted β-hairpin of RcPutA was tested by mutagenesis of conserved residues in the β-hairpin of BjPutA and RcPutA. Site-directed mutations were used to replace three conserved residues in the dimerization hairpin of BjPutA (BjPutAG638P, BjPutAE639A, and BjPutAN641A) and the corresponding sites in the predicted hairpin of RcPutA (RcPutAG1011P, RcPutAE1012A, and RcPutAN1014A) (Figure 2D). The β-hairpins were also more aggressively perturbed by deleting the conserved GPTGE sequence at residues 635–639 of BjPutA (BjPutAΔ635–639) and 1008–1012 of RcPutA (RcPutAΔ1008–1012).
The steady-state kinetic parameters for the mutants of RcPutA and BjPutA are listed in Table 1. In general, the PRODH activity was not substantially decreased in any of the mutants. The most significant decrease in PRODH activity was observed for mutants RcPutA RcPutAN1014A and BjPutAΔ635–639, which had a kcat/Km ∼3.5-fold lower than that of the wild-type enzyme. Interestingly, some of the RcPutA mutants showed increased PRODH activity, with the RcPutA mutant RcPutAG1011P having a 5-fold increased kcat/Km.
Table 1. Steady-State Kinetic Parameters for Wild-Type RcPutA and BjPutA and Their Variants.
| PRODHa |
P5CDHb |
|||||
|---|---|---|---|---|---|---|
| kcat (s–1) | Km (mM) | kcat/Km (M–1 s–1) | kcat (s–1) | Km (μM) | kcat/Km (M–1 s–1) | |
| RcPutA (wild-type) | 20.7 ± 0.4 | 54.3 ± 2.8 | 383 ± 4 | 7.3 ± 0.6 | 1530 ± 160 | 4800 ± 1000 |
| RcPutAG1011P | 22.4 ± 1.4 | 10.1 ± 3.2 | 2200 ± 840 | – | – | – |
| RcPutAE1012A | 19.8 ± 0.7 | 15.3 ± 2.6 | 1300 ± 270 | – | – | – |
| RcPutAN1014A | 4.8 ± 0.2 | 44.5 ± 6.7 | 110 ± 21 | – | – | – |
| RcPutAΔ1008–1012 | 8.9 ± 0.2 | 17.8 ± 1.8 | 490 ± 62 | – | – | – |
| RcPutA1–1116 | 26.9 ± 0.9 | 36.2 ± 4.5 | 740 ± 120 | 4.7 ± 0.2 | 1560 ± 86 | 3010 ± 290 |
| BjPutA (wild-type)c | 5.6 ± 0.7 | 150 ± 11 | 37 ± 7.4 | 2.2 ± 0.7 | 200 ± 6 | 11000 ± 3830 |
| BjPutAG638P | 6.1 ± 1.6 | 147 ± 82 | 42 ± 34 | – | – | – |
| BjPutAE639A | 1.95 ± 0.24 | 85 ± 29 | 23 ± 11 | – | – | – |
| BjPutAN641A | 2.5 ± 0.4 | 100 ± 37 | 29 ± 15 | – | – | – |
| BjPutAΔ635–639 | 0.5 ± 0.1 | 43 ± 14 | 11 ± 5 | – | – | – |
| BjPutA1–986 | 10.7 ± 1.2 | 151 ± 38 | 71 ± 26 | 4.4 ± 0.1 | 275 ± 22 | 16000 ± 1800 |
In contrast to PRODH activity, the P5CDH activity was eliminated in all of the hairpin mutants. These results are consistent with the hairpin being close to the P5CDH active site. In particular, the crystal structure of BjPutA shows that the hairpin forms electrostatic interactions that stabilize the loop that binds GSA in the P5CDH active site (Figure 2D). Disruption of these interactions in BjPutA apparently abrogates P5CDH activity. The fact that the same phenotype is seen in the analogous RcPutA variants suggests that the hairpin of RcPutA likewise helps stabilize the GSA-binding loop, thus validating the homology model of the RcPutA CTDUF.
SAXS Rigid Body Modeling of RcPutA: CORAL Set 1
Theoretical SAXS curves were calculated from models of the catalytic core to provide a reference for evaluating SAXS rigid body modeling calculations. The catalytic core represents 85% of RcPutA, and the sequence of the catalytic core is 52% identical to that of BjPutA (Figure S1 of the Supporting Information). SAXS curves calculated from four homology models of the core obtained from different servers yield χ values of 3.5–4.5. The calculated curve having the lowest χ is compared to the experimental curve in Figure 8A (orange curve). Note that the agreement is very good for q values of <0.08 Å–1, but deviation is observed for the q range of 0.08–0.16 Å–1 (Figure 8A, inset).
Figure 8.
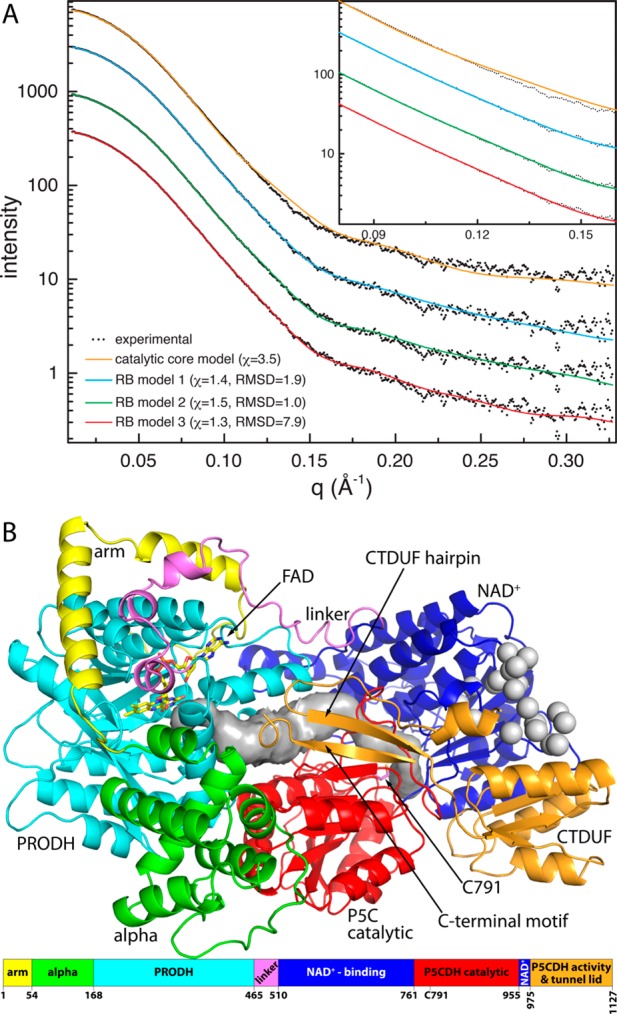
Comparison of the experimental and theoretical SAXS curves. (A) Comparison of the experimental SAXS curve with theoretical curves calculated from the catalytic core model (orange) and three representative models of RcPutA from rigid body modeling. (B) Rigid body model of RcPutA that was used to calculate the green curve in panel A (χ = 1.5, and rmsd = 1.0).
SAXS-constrained rigid body modeling was used to generate three-dimensional models of RcPutA. These calculations were performed with CORAL using homology models of the RcPutA catalytic core [residues 1–972 (Figure S2A of the Supporting Information)] and CTDUF [residues 994–1097 (Figure 7)]. The catalytic core was held fixed; the CTDUF was allowed to move, and the intervening peptide (residues 973–993) was modeled as a string of dummy residues. In the starting configuration, the catalytic core and CTDUF were far apart, with residue 972 of the core and residue 994 of the CTDUF separated by 68 Å (Figure S2C of the Supporting Information).
The results of these calculations are shown in Figure 9A as a scatter plot of the clash penalty versus χ for 160 independent poses. The clash penalty reports on steric interference between domains, while χ expresses the agreement between the experimental scattering curve and the theoretical curve calculated from the model. Low values of both parameters are desirable. The scatter plot shows a tight cluster of 78 poses centered at χ = 1.9 and clash penalty = 1.1. All the poses in this cluster have χ < 2.15 and penalty < 1.5 and represent 49% of the 160 poses generated.
Figure 9.
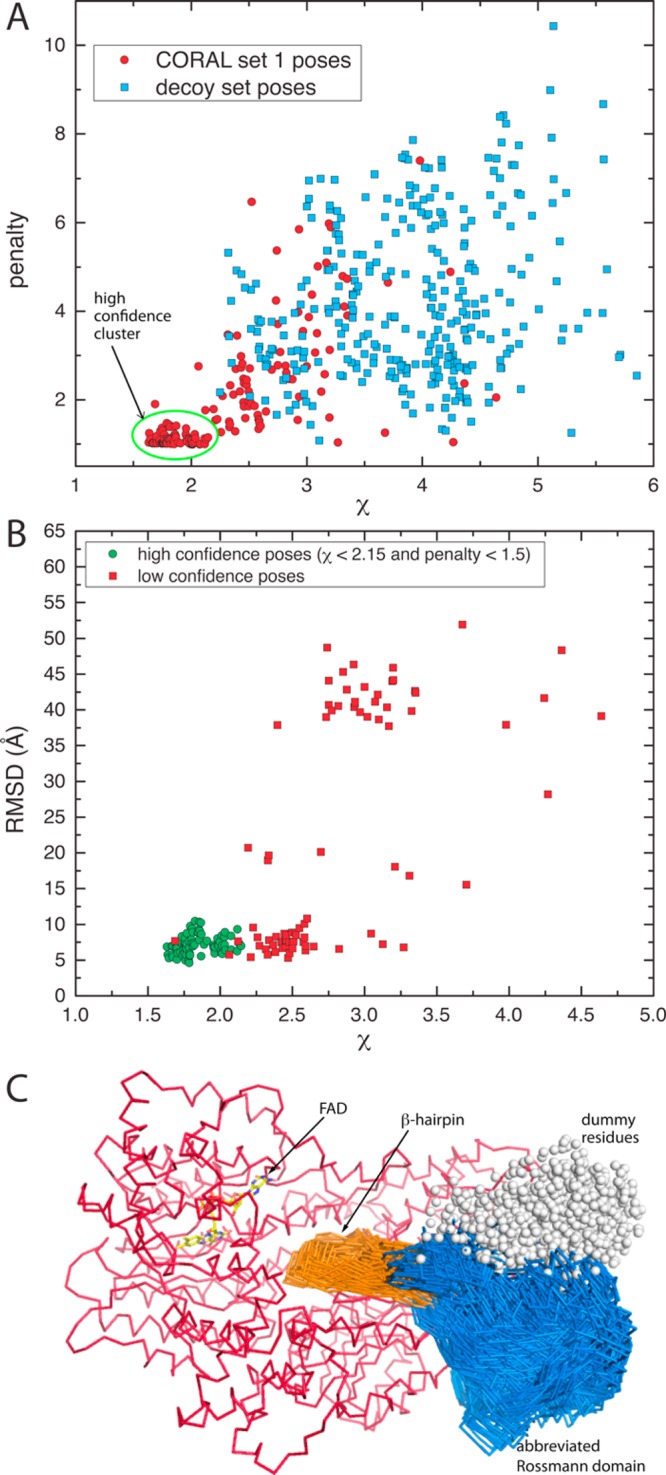
SAXS rigid body modeling results from CORAL set 1. (A) Scatter plot of the clash penalty vs χ for the 160 poses of CORAL set 1 (red circles) and the 320 decoy poses (blue squares). The green oval encloses the high-confidence cluster of 78 poses, which is separated from the decoy poses. (B) Scatter plot of rmsd from the BjPutA dimer interface vs χ. The green circles represent the high-confidence cluster of poses from panel A. (C) Seventy-eight poses of the high-confidence cluster. The catalytic core is colored red. The β-hairpin and abbreviated Rossmann fold of the CTDUF are colored orange and blue, respectively.
The poses in the cluster of 78 are structurally similar (Figure 9C). All 78 poses feature the CTDUF interacting mainly with the P5CDH part of the catalytic core. The β-hairpin of the CTDUF extends into the open region between the two active sites, and the abbreviated Rossmann fold of the CTDUF packs against the NAD+-binding domain of the catalytic core. This arrangement is highly reminiscent of the dimer interface of BjPutA (Figure 2C) but in the context of a monomeric protein.
The structural similarity between the CORAL poses and the BjPutA dimer interface was quantitated by calculating the rmsd between the β-hairpin of each CORAL pose and the β-hairpin as positioned in the BjPutA dimer interface. For this calculation, the BjPutA dimer was first superimposed onto RcPutA using the residues of the catalytic core, and then the rmsd for the Cα atoms of the hairpin was calculated. The scatter plot of rmsd versus χ is shown in Figure 9B. The poses from the cluster of 78 centered at χ = 1.9 and clash penalty = 1.1 have a relatively low rmsd compared to those of the other poses (Figure 9B), which is consistent with the idea that the CTDUF in RcPutA mimics the dimer interface of BjPutA.
SAXS Rigid Body Modeling: Decoy Set
CORAL calculations were also performed using decoy structures in place of the CTDUF model to identify the high-confidence regions of target function space. Four decoy structures were used: profilin IB, ketosteroid isomerase, a VH domain, and human bromodomain. These structures are suitable decoys because they have approximately the same number of residues as the CTDUF model but are functionally unrelated to PutAs. The decoys exhibit diversity in protein fold and secondary structure content (Figure S3 of the Supporting Information). The VH domain is primarily β-strand, whereas the bromodomain is mostly α-helical. Profilin IB and ketosteroid isomerase have mixed α/β-folds. Each decoy domain was paired with each of the four models of the RcPutA catalytic core, and 20 CORAL calculations were performed for each pair for a total of 320 decoy poses.
The results of the decoy calculations are shown in Figure 9A. The χ distribution of the decoy poses ranges from 2.3 to 5.9 with an average of 3.9 ± 0.8, while the clash penalty is 1.1–10.4 with an average of 4.2 ± 1.8. We suggest that the decoy results correspond to the low-confidence region of parameter space where the false positive rate is high. Note that the aforementioned cluster of 78 poses from CORAL set 1 is well-separated from the noise region defined by the decoy calculations, suggesting that these poses are meaningful (Figure 9A).
SAXS Rigid Body Modeling of RcPutA: CORAL Set 2
The results from CORAL set 1 motivated a second, more extensive set of calculations designed to test the idea that the CTDUF mimics the type A PutA dimer interface (CORAL set 2). The BjPutA dimerization flap consists of two elements: the β-hairpin and the C-terminal motif (Figure 2C). The latter element was incorporated into the SAXS modeling by first docking a model of the C-terminal motif to the CTDUF models using the BjPutA oligomerization domain as the superposition template and then treating the resulting composite model (Figure S2B of the Supporting Information) as a rigid body in CORAL.
The CORAL set 2 calculations produced a high-confidence cluster of 253 poses centered at χ = 1.6 and penalty = 1.2 that is clearly separated from the decoy region (Figure 10A). The average χ (1.6) and minimal χ (1.3) of this cluster are lower than the corresponding values of the high-confidence cluster from CORAL set 1, which indicates that inclusion of the C-terminal motif improved the model. All but one of the 253 poses has an rmsd of <10 Å, indicating that they mimic the BjPutA dimer interface (Figure 10B), a result that is confirmed by visual inspection (Figure 10C). Thus, both sets of rigid body calculations suggest that the CTDUF packs against the catalytic core in the same way that the oligomerization domain mediates dimerization in type A PutAs.
Figure 10.
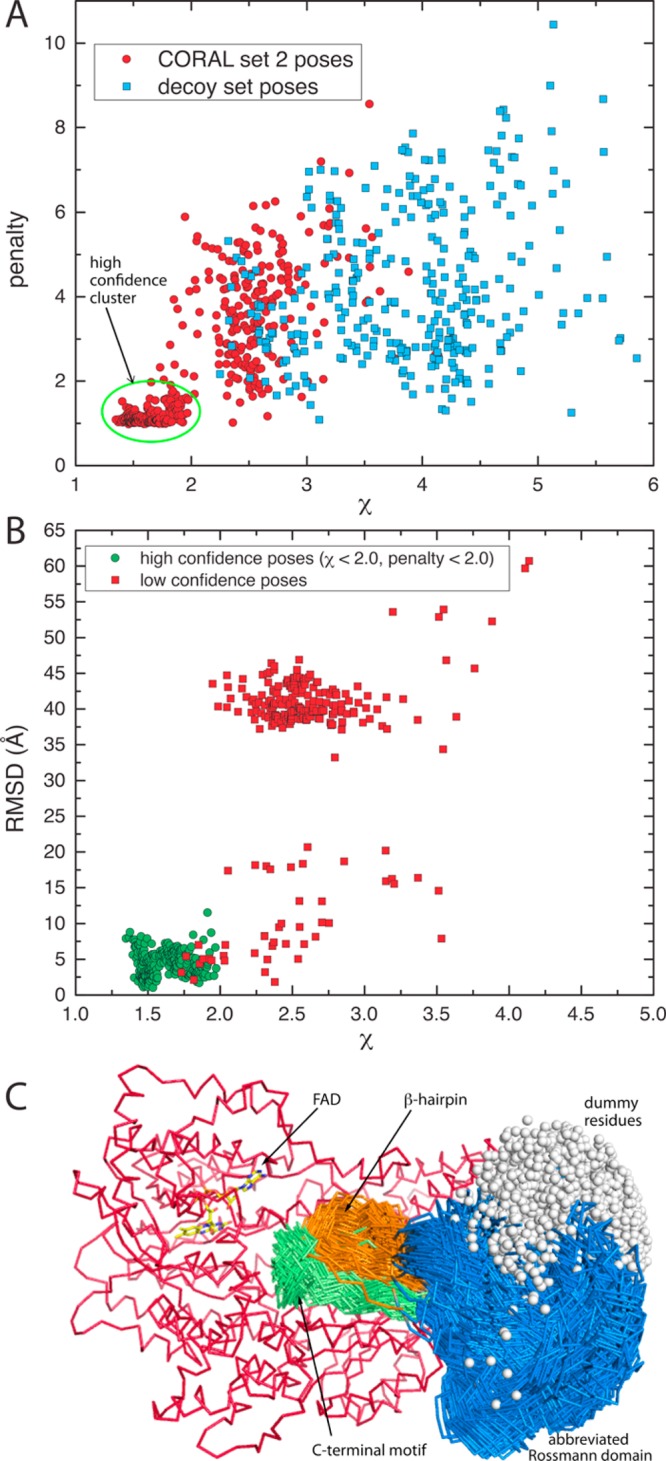
SAXS rigid body modeling results from CORAL set 2. (A) Scatter plot of the clash penalty vs χ for the 480 poses of CORAL set 2 (red circles) and the 320 decoy poses (blue squares). The green oval encloses the high-confidence cluster of 253 poses, which is separated from the decoy poses. (B) Scatter plot of rmsd from the BjPutA dimer interface vs χ. The green circles represent the high-confidence cluster of poses from panel A. (C) Two hundred fifty-three poses of the high-confidence cluster. The catalytic core is colored red, the β-hairpin orange, the Rossmann fold blue, and the conserved C-terminal motif green.
Finally, the models in the high-confidence clusters are in good agreement with the experimental scattering profile and shape reconstruction. For example, Figure 8A shows the curves calculated from three poses from CORAL set 2 corresponding to the (1) best combination of a low χ and a low rmsd, (2) the lowest rmsd regardless of χ, and (3) the lowest χ regardless of rmsd. In all three cases, the fit to the experimental curve is noticeably better than that provided by the catalytic core alone. In particular, the rigid body models significantly improve the fit in the intermediate q region of 0.08–0.16 Å–1 (Figure 8A, inset). The rigid body models are also consistent with the shape reconstruction (Figure 6B).
Function of the C-Terminal Motif in Substrate Channeling
The function of the conserved C-terminal motif was tested by engineering C-terminal truncations BjPutA1–986 and RcPutA1–1116. The C-terminal truncations BjPutA1–986 and RcPutA1–1116 exhibit PRODH and P5CDH activity like the respective wild-type PutA (Table 1), indicating that the C-terminal motif is not critical for the individual activity of the catalytic domains. Kinetic measurements of the coupled PRODH–P5CDH reaction, however, indicate a role for the C-terminal motif in substrate channeling. Reaction progress curves for the coupled PRODH–P5CDH activity of RcPutA1–1116 (Figure 3A) and BjPutA1–986 (Figure 3B) show a lag prior to steady-state formation of NADH. Linear extrapolation yields estimated transient times of ∼4.6 and 1.3 min for RcPutA1–1116 and BjPutA1–986, respectively. Thus, C-terminal truncations disrupt substrate channeling in both PutAs, with a more significant effect observed in RcPutA. These results are consistent with the C-terminus forming part of the lid that seals the substrate-channeling tunnel from the bulk medium (Figure 8B).
Discussion
RcPutA is the first example of a monomeric PutA. This result is consistent with sequence analysis. For example, an alignment of BjPutA and RcPutA shows a gap in RcPutA in the region of the dimerization β-hairpin of BjPutA (Figure S1 of the Supporting Information, cyan box). Accordingly, homology models of the RcPutA catalytic core lack a β-hairpin protruding from the 640s loop (Figure S2A of the Supporting Information). The discovery of a monomeric PutA suggests that the PutA family is diverse in terms of oligomeric states and quaternary structures. Elucidating the full extent of this diversity is a subject of current study in our laboratories.
We used SAXS to determine the tertiary structural interactions of a domain that represents only 15% of the protein, which is somewhat challenging. The challenge can be appreciated by observing that the SAXS profile calculated from a model lacking the CTDUF shows good agreement with the experimental curve, particularly for q values of <0.08 Å–1 (Figure 8A, orange curve). This indicates that methods based solely on the low-q part of the SAXS data, such as Guinier analysis, have limited utility in this case. Data in the intermediate q range of 0.08–0.16 Å–1 contain structural information about the CTDUF, and deviations between the experimental and calculated profiles in this region drive rigid body modeling. Because these deviations are rather subtle (Figure 8A, orange), we developed a rigid body modeling strategy involving the generation of hundreds of models using both the predicted domain model and decoy models. We note that target decoy analysis is used in computational ligand docking39 but has not been used in SAXS modeling to the best of our knowledge. The approach we used has two main benefits. First, the decoy calculations allow delineation of the low- and high-confidence regions of parameter space. Second, the generation of many rigid body models allows identification of clusters containing models sharing a common theme. Densely populated clusters in the high-confidence zone represent valid solutions. We suggest that this approach has general applicability in SAXS modeling.
Our working model of RcPutA (Figure 8B) implies that the CTDUF is a Rossmann dinucleotide-binding domain that does not bind NAD+. Dinucleotides bind at the C-termini of the strands of Rossmann domains. The potential NAD+ surface of the CTDUF is on the perimeter of RcPutA (Figure 8C), and NAD+ bound to the CTDUF would be 40 Å from the catalytic Cys, which is incompatible with the known mechanism of ALDHs in which a hydride is transferred from the hemithioacetal intermediate to NAD+. Furthermore, homology modeling and sequence alignments suggest that the Rossmann fold domain in the catalytic core of RcPutA (residues 510–761 and 955–975) is fully functional. Thus, we suggest that the CTDUF is a noncatalytic Rossmann domain.
Noncatalytic Rossmann domains are rare. The γ-subunit of ATP synthase contains a Rossmann mononucleotide motif that plays a structural role.40 Also, the DNA-processing protein DprA contains a Rossmann domain that binds single-stranded DNA.41,42 PutA is unique in that it contains both catalytic and noncatalytic Rossmann domains in the same protein.
Although it is unlikely that the CTDUF binds NAD+, it nevertheless contributes to P5CDH activity. Mutation of residues in the CTDUF hairpin or the BjPutA dimerization hairpin abrogates P5CDH activity. This result is consistent with the crystal structure of BjPutA, which shows conserved residues of the oligomerization hairpin forming intermolecular electrostatic interactions with conserved residues of the loop that anchors GSA in the P5CDH site (Figure 2D). Our SAXS model implies that analogous intramolecular interactions are present in RcPutA. We conclude that the CTDUF makes an essential, albeit indirect, contribution to the P5CDH activity of RcPutA.
The CTDUF likely also plays a role in substrate channeling. The reaction progress curve for the coupled PRODH–P5CDH activity of RcPutA does not exhibit a perceptible time lag, whereas the nonchanneling control displays a lag of 8 min (Figure 3A). These results are consistent with a substrate channeling mechanism, implying that the pathway between the two active sites is protected from the bulk medium. The SAXS rigid body model suggests that the hairpin and C-terminal motif form a flap that spans the region between two active sites, serving as a lid that seals the tunnel from the bulk medium (Figure 8B). The model is consistent with the observation that truncation of the flap in RcPutA1–1116 results in a 5 min lag in the coupled PRODH–P5CDH assay (Figure 3A). Interestingly, truncation of the C-terminus in BjPutA1–986 results in just a 1 min lag (Figure 3B). We suggest that proximity effects43 due to the oligomeric structure of BjPutA lower the observed transient time. This effect is not possible for monomeric RcPutA.
In summary, our results suggest that the CTDUF resembles the N-terminal half of ALDH superfamily enzymes and consists of a noncatalytic Rossmann fold domain connected to a β-hairpin. Furthermore, the hairpin facilitates P5CDH activity and substrate channeling by stabilizing the aldehyde substrate-binding loop and sealing the substrate-channeling tunnel from the bulk medium.
Acknowledgments
We thank Prof. Jason Cooley for providing genomic DNA and Kevin Dyer for collecting the SAXS data through the SIBYLS mail-in program. We thank Prof. Krishna K. Sharma for the use of the size exclusion chromatography–multiangle laser light scattering (SEC–MALS) instrument and Drs. Santhoshkumar Puttur and Ranjan Singh for help with collection and analysis of the SEC–MALS data. Part of this work was conducted at the Advanced Light Source (ALS), a national user facility operated by Lawrence Berkeley National Laboratory on behalf of the U.S. Department of Energy (DOE), Office of Basic Energy Sciences, through the Integrated Diffraction Analysis Technologies (IDAT) program, supported by the DOE Office of Biological and Environmental Research. Additional support comes from the National Institutes of Health Project MINOS (R01GM105404).
Glossary
Abbreviations
- PRODH
proline dehydrogenase
- P5C
Δ1-pyrroline-5-carboxylate
- P5CDH
Δ1-pyrroline-5-carboxylate dehydrogenase
- FAD
flavin adenine dinucleotide
- GSA
l-glutamate-γ-semialdehyde
- PutA
proline utilization A
- BjPutA
B. japonicum proline utilization A
- GsPutA
G. sulfurreducens proline utilization A
- RcPutA
R. capsulatus proline utilization A
- EcPutA
E. coli proline utilization A
- CTDUF
C-terminal domain of unknown function
- ALDH
aldehyde dehydrogenase
- rmsd
root-mean-square deviation
- PDB
Protein Data Bank
- SAXS
small-angle X-ray scattering
- CoQ1
ubiquinone-1
- WT
wild-type
- PCR
polymerase chain reaction
- THP
tris(3-hydroxypropyl)phosphine
- TEVP
tobacco etch virus protease
- DCPIP
dichlorophenolindophenol
- MALS
multiangle light scattering
- BjPutAG638P
site-directed mutant of BjPutA in which Gly638 is replaced with Pro
- BjPutAE639A
site-directed mutant of BjPutA in which Glu639A is replaced with Ala
- BjPutAN641A
site-directed mutant of BjPutA in which Asn641 is replaced with Ala
- BjPutAΔ635–639
loop deletion mutant of BjPutA in which residues 635–639 are deleted
- BjPutA1–986
C-terminal deletion mutant of BjPutA containing residues 1–986
- RcPutAG1011P
site-directed mutant of RcPutA in which Gly1011 is replaced with Pro
- RcPutAE1012A
site-directed mutant of RcPutA in which Glu1012A is replaced with Ala
- RcPutAN1014A
site-directed mutant of RcPutA in which Asn1014 is replaced with Ala
- RcPutAΔ1008–1012
loop deletion mutant of RcPutA in which residues 1008–1012 are deleted
- RcPutA1–1116
C-terminal deletion mutant of RcPutA containing residues 1–1116.
Supporting Information Available
Primers (Table S1), sequence alignment (Figure S1), homology models used in rigid body modeling (Figure S2), and decoy set (Figure S3). This material is available free of charge via the Internet at http://pubs.acs.org.
Research reported in this publication was supported by National Institute of General Medical Sciences Grants GM061068, GM065546, and P30GM103335.
The authors declare no competing financial interest.
Funding Statement
National Institutes of Health, United States
Supplementary Material
References
- Singh R. K.; Tanner J. J. (2012) Unique Structural Features and Sequence Motifs of Proline Utilization A (PutA). Front. Biosci. 17, 556–568. [DOI] [PMC free article] [PubMed] [Google Scholar]
- Tanner J. J., and Becker D. F. (2013) PutA and proline metabolism. In Handbook of Flavoproteins. Vol. 1. Oxidases, Dehydrogenases and Related Systems (Hille R., Miller S. M., and Palfey B. A., Eds.) pp 31–56, De Gruyter, Berlin. [Google Scholar]
- Tanner J. J. (2008) Structural biology of proline catabolism. Amino Acids 35, 719–730. [DOI] [PMC free article] [PubMed] [Google Scholar]
- Krishnan N.; Becker D. F. (2005) Characterization of a bifunctional PutA homologue from Bradyrhizobium japonicum and identification of an active site residue that modulates proline reduction of the flavin adenine dinucleotide cofactor. Biochemistry 44, 9130–9139. [DOI] [PMC free article] [PubMed] [Google Scholar]
- Srivastava D.; Schuermann J. P.; White T. A.; Krishnan N.; Sanyal N.; Hura G. L.; Tan A.; Henzl M. T.; Becker D. F.; Tanner J. J. (2010) Crystal structure of the bifunctional proline utilization A flavoenzyme from Bradyrhizobium japonicum. Proc. Natl. Acad. Sci. U.S.A. 107, 2878–2883. [DOI] [PMC free article] [PubMed] [Google Scholar]
- Zhang W.; Krishnan N.; Becker D. F. (2006) Kinetic and thermodynamic analysis of Bradyrhizobium japonicum PutA-membrane associations. Arch. Biochem. Biophys. 445, 174–183. [DOI] [PubMed] [Google Scholar]
- Gu D.; Zhou Y.; Kallhoff V.; Baban B.; Tanner J. J.; Becker D. F. (2004) Identification and characterization of the DNA-binding domain of the multifunctional PutA flavoenzyme. J. Biol. Chem. 279, 31171–31176. [DOI] [PMC free article] [PubMed] [Google Scholar]
- Zhou Y.; Larson J. D.; Bottoms C. A.; Arturo E. C.; Henzl M. T.; Jenkins J. L.; Nix J. C.; Becker D. F.; Tanner J. J. (2008) Structural basis of the transcriptional regulation of the proline utilization regulon by multifunctional PutA. J. Mol. Biol. 381, 174–188. [DOI] [PMC free article] [PubMed] [Google Scholar]
- Brown E. D.; Wood J. M. (1992) Redesigned purification yields a fully functional PutA protein dimer from Escherichia coli. J. Biol. Chem. 267, 13086–13092. [PubMed] [Google Scholar]
- Singh H.; Arentson B. W.; Becker D. F.; Tanner J. J. (2014) Structures of the PutA peripheral membrane flavoenzyme reveal a dynamic substrate-channeling tunnel and the quinone-binding site. Proc. Natl. Acad. Sci. U.S.A. 111, 3389–3394. [DOI] [PMC free article] [PubMed] [Google Scholar]
- Halouska S.; Zhou Y.; Becker D. F.; Powers R. (2009) Solution structure of the Pseudomonas putida protein PpPutA45 and its DNA complex. Proteins 75, 12–27. [DOI] [PMC free article] [PubMed] [Google Scholar]
- Singh R. K.; Larson J. D.; Zhu W.; Rambo R. P.; Hura G. L.; Becker D. F.; Tanner J. J. (2011) Small-angle X-ray Scattering Studies of the Oligomeric State and Quaternary Structure of the Trifunctional Proline Utilization A (PutA) Flavoprotein from Escherichia coli. J. Biol. Chem. 286, 43144–43153. [DOI] [PMC free article] [PubMed] [Google Scholar]
- Williams I.; Frank L. (1975) Improved chemical synthesis and enzymatic assay of Δ-1-pyrroline-5-carboxylic acid. Anal. Biochem. 64, 85–97. [DOI] [PubMed] [Google Scholar]
- Schuermann J. P.; White T. A.; Srivastava D.; Karr D. B.; Tanner J. J. (2008) Three crystal forms of the bifunctional enzyme proline utilization A (PutA) from Bradyrhizobium japonicum. Acta Crystallogr. F64, 949–953. [DOI] [PMC free article] [PubMed] [Google Scholar]
- Moxley M. A.; Tanner J. J.; Becker D. F. (2011) Steady-state kinetic mechanism of the proline:ubiquinone oxidoreductase activity of proline utilization A (PutA) from Escherichia coli. Arch. Biochem. Biophys. 516, 113–120. [DOI] [PMC free article] [PubMed] [Google Scholar]
- Zhang W.; Zhang M.; Zhu W.; Zhou Y.; Wanduragala S.; Rewinkel D.; Tanner J. J.; Becker D. F. (2007) Redox-induced changes in flavin structure and roles of flavin N(5) and the ribityl 2′-OH group in regulating PutA-membrane binding. Biochemistry 46, 483–491. [DOI] [PMC free article] [PubMed] [Google Scholar]
- Moxley M. A.; Sanyal N.; Krishnan N.; Tanner J. J.; Becker D. F. (2014) Evidence for Hysteretic Substrate Channeling in the Proline Dehydrogenase and Δ1-Pyrroline-5-carboxylate Dehydrogenase Coupled Reaction of Proline Utilization A (PutA). J. Biol. Chem. 289, 3639–3651. [DOI] [PMC free article] [PubMed] [Google Scholar]
- Arnold K.; Bordoli L.; Kopp J.; Schwede T. (2006) The SWISS-MODEL workspace: A web-based environment for protein structure homology modelling. Bioinformatics 22, 195–201. [DOI] [PubMed] [Google Scholar]
- Sali A.; Blundell T. L. (1993) Comparative protein modelling by satisfaction of spatial restraints. J. Mol. Biol. 234, 779–815. [DOI] [PubMed] [Google Scholar]
- Soding J. (2005) Protein homology detection by HMM-HMM comparison. Bioinformatics 21, 951–960. [DOI] [PubMed] [Google Scholar]
- Biegert A.; Mayer C.; Remmert M.; Soding J.; Lupas A. N. (2006) The MPI Bioinformatics Toolkit for protein sequence analysis. Nucleic Acids Res. 34, W335–W339. [DOI] [PMC free article] [PubMed] [Google Scholar]
- Kelley L. A.; Sternberg M. J. (2009) Protein structure prediction on the Web: A case study using the Phyre server. Nat. Protoc. 4, 363–371. [DOI] [PubMed] [Google Scholar]
- Zhang Y. (2008) I-TASSER server for protein 3D structure prediction. BMC Bioinf. 9, 40. [DOI] [PMC free article] [PubMed] [Google Scholar]
- Hura G. L.; Menon A. L.; Hammel M.; Rambo R. P.; Poole F. L. II; Tsutakawa S. E.; Jenney F. E. Jr.; Classen S.; Frankel K. A.; Hopkins R. C.; Yang S. J.; Scott J. W.; Dillard B. D.; Adams M. W.; Tainer J. A. (2009) Robust, high-throughput solution structural analyses by small angle X-ray scattering (SAXS). Nat. Methods 6, 606–612. [DOI] [PMC free article] [PubMed] [Google Scholar]
- Classen S.; Hura G. L.; Holton J. M.; Rambo R. P.; Rodic I.; McGuire P. J.; Dyer K.; Hammel M.; Meigs G.; Frankel K. A.; Tainer J. A. (2013) Implementation and performance of SIBYLS: A dual endstation small-angle X-ray scattering and macromolecular crystallography beamline at the Advanced Light Source. J. Appl. Crystallogr. 46, 1–13. [DOI] [PMC free article] [PubMed] [Google Scholar]
- Konarev P. V.; Volkov V. V.; Sokolova A. V.; Koch M. H. J.; Svergun D. I. (2003) PRIMUS: A Windows PC-based system for small-angle scattering data analysis. J. Appl. Crystallogr. 36, 1277–1282. [Google Scholar]
- Svergun D. (1992) Determination of the regularization parameter in indirect-transform methods using perceptual criteria. J. Appl. Crystallogr. 25, 495–503. [Google Scholar]
- Svergun D. I.; Petoukhov M. V.; Koch M. H. (2001) Determination of domain structure of proteins from X-ray solution scattering. Biophys. J. 80, 2946–2953. [DOI] [PMC free article] [PubMed] [Google Scholar]
- Volkov V. V.; Svergun D. I. (2003) Uniqueness of ab initio shape determination in small-angle scattering. J. Appl. Crystallogr. 36, 860–864. [DOI] [PMC free article] [PubMed] [Google Scholar]
- Wriggers W. (2010) Using Situs for the integration of multi-resolution structures. Biophys. Rev. 2, 21–27. [DOI] [PMC free article] [PubMed] [Google Scholar]
- Kozin M. B.; Svergun D. I. (2001) Automated matching of high- and low-resolution structural models. J. Appl. Crystallogr. 34, 33–41. [Google Scholar]
- Svergun D.; Barberato C.; Koch M. H. J. (1995) CRYSOL: A program to evaluate X-ray solution scattering of biological macromolecules from atomic coordinates. J. Appl. Crystallogr. 28, 768–773. [Google Scholar]
- Rambo R. P.; Tainer J. A. (2013) Accurate assessment of mass, models and resolution by small-angle scattering. Nature 496, 477–481. [DOI] [PMC free article] [PubMed] [Google Scholar]
- Luo M.; Singh R. K.; Tanner J. J. (2013) Structural determinants of oligomerization of Δ1-pyrroline-5-carboxylate dehydrogenase: Identification of a hexamerization hot spot. J. Mol. Biol. 425, 3106–3120. [DOI] [PMC free article] [PubMed] [Google Scholar]
- Rambo R. P.; Tainer J. A. (2011) Characterizing flexible and instrinsically unstructured biological macromolecules by SAS using the porod-debye law. Biopolymers 95, 559–571. [DOI] [PMC free article] [PubMed] [Google Scholar]
- Petoukhov M. V.; Franke D.; Shkumatov A. V.; Tria G.; Kikhney A. G.; Gajda M.; Gorba C.; Mertens H. D. T.; Konarev P. V.; Svergun D. I. (2012) New developments in the ATSAS program package for small-angle scattering data analysis. J. Appl. Crystallogr. 45, 342–350. [DOI] [PMC free article] [PubMed] [Google Scholar]
- Franke D.; Svergun D. I. (2009) DAMMIF, a program for rapid ab-initio shape determination in small-angle scattering. J. Appl. Crystallogr. 42, 342–346. [DOI] [PMC free article] [PubMed] [Google Scholar]
- Brändén C., and Tooze J. (1991) Introduction to protein structure, Garland Publishing, Inc., New York. [Google Scholar]
- Huang N.; Shoichet B. K.; Irwin J. J. (2006) Benchmarking sets for molecular docking. J. Med. Chem. 49, 6789–6801. [DOI] [PMC free article] [PubMed] [Google Scholar]
- Gibbons C.; Montgomery M. G.; Leslie A. G.; Walker J. E. (2000) The structure of the central stalk in bovine F(1)-ATPase at 2.4 Å resolution. Nat. Struct. Biol. 7, 1055–1061. [DOI] [PubMed] [Google Scholar]
- Wang W.; Ding J.; Zhang Y.; Hu Y.; Wang D. C. (2014) Structural insights into the unique single-stranded DNA-binding mode of Helicobacter pylori DprA. Nucleic Acids Res. 42, 3478–3491. [DOI] [PMC free article] [PubMed] [Google Scholar]
- Quevillon-Cheruel S.; Campo N.; Mirouze N.; Mortier-Barriere I.; Brooks M. A.; Boudes M.; Durand D.; Soulet A. L.; Lisboa J.; Noirot P.; Martin B.; van Tilbeurgh H.; Noirot-Gros M. F.; Claverys J. P.; Polard P. (2012) Structure-function analysis of pneumococcal DprA protein reveals that dimerization is crucial for loading RecA recombinase onto DNA during transformation. Proc. Natl. Acad. Sci. U.S.A. 109, E2466–E2475. [DOI] [PMC free article] [PubMed] [Google Scholar]
- Bauler P.; Huber G.; Leyh T.; McCammon J. A. (2010) Channeling by Proximity: The Catalytic Advantages of Active Site Colocalization Using Brownian Dynamics. J. Phys. Chem. Lett. 1, 1332–1335. [DOI] [PMC free article] [PubMed] [Google Scholar]
- Berka K.; Hanak O.; Sehnal D.; Banas P.; Navratilova V.; Jaiswal D.; Ionescu C. M.; Svobodova Varekova R.; Koca J.; Otyepka M. (2012) MOLEonline 2.0: Interactive web-based analysis of biomacromolecular channels. Nucleic Acids Res. 40, W222–W227. [DOI] [PMC free article] [PubMed] [Google Scholar]
- Srivastava D.; Singh R. K.; Moxley M. A.; Henzl M. T.; Becker D. F.; Tanner J. J. (2012) The Three-Dimensional Structural Basis of Type II Hyperprolinemia. J. Mol. Biol. 420, 176–189. [DOI] [PMC free article] [PubMed] [Google Scholar]
Associated Data
This section collects any data citations, data availability statements, or supplementary materials included in this article.


