

Abstract
Protein dimerization and oligomerization is commonly used by nature to increase the structural and functional complexity of proteins. Regulated protein assembly is essential to transfer information in signaling, transcriptional, and membrane trafficking events. Here we show that a combination of cell-free protein expression, a proximity based interaction assay (AlphaScreen), and single-molecule fluorescence allow rapid mapping of homo- and hetero-oligomerization of proteins. We have applied this approach to the family of BAR domain-containing sorting nexin (SNX-BAR) proteins, which are essential regulators of membrane trafficking and remodeling in all eukaryotes. Dimerization of BAR domains is essential for creating a concave structure capable of sensing and inducing membrane curvature. We have systematically mapped 144 pairwise interactions between the human SNX-BAR proteins and generated an interaction matrix of preferred dimerization partners for each family member. We find that while nine SNX-BAR proteins are able to form homo-dimers, several including the retromer-associated SNX1, SNX2, and SNX5 require heteromeric interactions for dimerization. SNX2, SNX4, SNX6, and SNX8 show a promiscuous ability to bind other SNX-BAR proteins and we also observe a novel interaction with the SNX3 protein which lacks the BAR domain structure.
The last decade has witnessed an unprecedented increase in the number of identified human protein–protein interactions (PPIs)1, and these commonly form sophisticated interaction networks that mediate adaptive signaling responses to environmental stimuli. Validation of PPIs in general remains challenging, particularly when examining interactions within a family of proteins. Self-interaction is even more difficult to detect but can play an important physiological role. In human cells homo- or hetero-dimerization is a common feature of proteins regulating cell signaling, including tyrosine kinase receptors, G-protein coupled receptors, chemokines, cytokines, and transcription factors (1). Dimerization also has the potential to increase the efficiency and specificity of enzymatic reactions, with more than 70% of enzymes able to self-associate (1).
Dimerization and higher-order oligomerization is also an important and widespread feature among proteins central to membrane trafficking. In this study we focus on a family of proteins, the sorting nexins (SNXs), which regulate vesicular and tubulovesicular transport in the endocytic system (2, 3). In particular, we examine the propensity for homo- and hetero-association among SNX proteins containing the Bin/Amphiphysin/Rvs (BAR) domain, a family of molecules that utilize dimerization to sense and drive membrane curvature. In vivo studies have shown that the SNX-BAR proteins are localized on tubular and vesicular membrane structures throughout the endocytic network (4, 5). They have been shown to be involved in a growing array of endosomal sorting events (6–9) and both clathrin-dependent and independent endocytosis (10). The 12 members of the SNX-BAR subfamily contain a phox-homology (PX) domain required for membrane association and a C-terminal BAR domain, composed of three α-helices that can dimerize to form a rigid banana-shaped structure (Fig. 1A). The concave surface of the dimeric BAR domains contains basic residues that mediate association with the phospholipid bilayer through electrostatic interactions. These proteins are then able to sense local bending of the membrane, and even drive membrane deformation by forming higher order helical arrays that stabilize high curvature membrane tubules and vesicles (11–13). The exact structure of polymerized SNX-BAR proteins has not been elucidated. However, it is known that BAR domain-driven dimerization of the proteins is required. Both homo-dimerization and hetero-dimerization have been observed. For example, SNX9, SNX18, and SNX33 have been shown to form homo-dimers (14–17). On the other hand, SNX2, SNX5, and SNX6, which assemble with the retromer trafficking complex, have been reported to form a series of restricted hetero-dimers that coat common endosomal membrane tubules (18, 19). Although still poorly understood, one potential advantage of hetero-dimerization of the SNX-BAR proteins is that formation of different combinations may allow for fine-tuning of membrane trafficking processes either in a spatially restricted manner within individual cells, or via tissue-specific expression patterns of the different proteins.
Fig. 1.

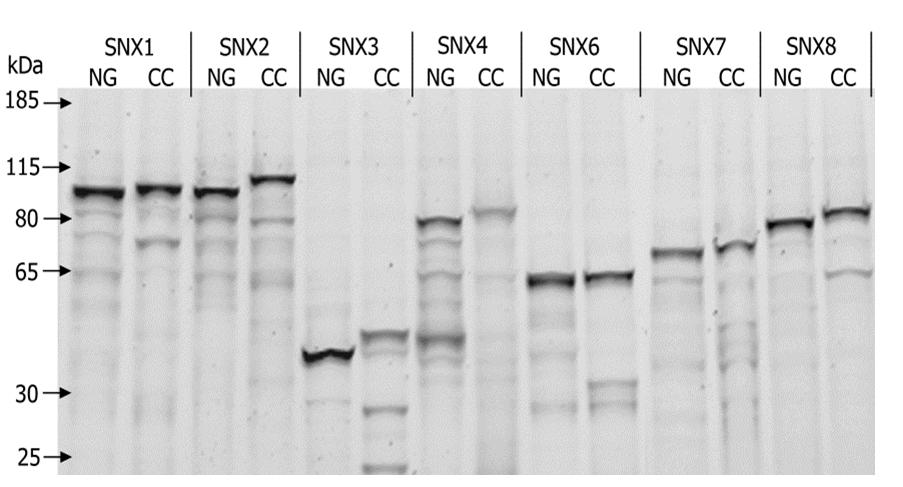
Expression of the human SNX-BAR proteins in L. tarentolae cell free lysate. A, Ribbon representation of a representative crystal structure of the SNX9 dimer (PDB:2RAI), viewed from the convex side (top) and the lateral side (bottom). One SNX9 subunit is shown in red/orange/yellow, the other in green/cyan/blue. Red/blue indicates the two PX (Phox) domains, orange/cyan the two yoke domains and yellow/green the two BAR (Bin, Amphiphysin, Rvs) domains. Dimerization of the BAR domains leads to a rigid banana-shaped structure. B, Domain structures of the 12 members of the sorting nexin (SNX) family analyzed here. All proteins possess a PX domain represented as a blue rectangle. Except for SNX3, all other proteins also contain a C-terminal BAR domain indicated in red. A Src Homology 3 (SH3) domain (orange circle) is also present in SNX9 and SNX33. C, SDS-Page analysis of the LTE expressed SNX-BAR domain proteins. Each protein was labeled with a N-terminal GFP tag or a Cherry-myc tag. Proteins were separated on SDS-PAGE gel (4–12% Tris-glycine) and visualized by in gel fluorescence scanning.
Here we present a systematic analysis of the in vitro SNX-BAR interaction landscape, using a combination of cell-free protein expression, AlphaScreen proximity assay, co-immunoprecipitation and single molecule fluorescence techniques. All possible pairs of 11 different SNX-BAR proteins (SNX1, SNX2, SNX4, SNX5, SNX6, SNX7, SNX8, SNX9, SNX30, SNX32, and SNX33; Fig. 1B), plus the PX domain-only SNX protein SNX3, were co-expressed in a Leishmania tarentolae-based cell-free expression system and analyzed for their ability to form homo- or hetero-oligomers in vitro by AlphaScreen. The homo-dimerization propensity was further validated by co-immunoprecipitation assays and by single-molecule brightness analysis. Finally, single molecule coincidence was used to analyze the stoichiometry of proteins in the SNX assemblies, confirming the presence of monomers and dimers, and revealing unexpected hetero-assemblies.
EXPERIMENTAL PROCEDURES
The genetically encoded tags used here are enhanced GFP (GFP), mCherry (Cherry), and c-Myc (myc).
Plasmids Preparation
The ORFs (Open Reading Frames) encoding SNX proteins were cloned into the following Gateway cloning compatible Leishmania expression vectors*: pCellFree-N-terminal-GFP, pCellFree-N-terminal-myc-Cherry, and pCellFree-C-terminal-Cherry-myc at the ARVEC Facility, UQ Diamantina Institute. These genes were sourced from the Human ORFeome collection version 1.1 and 5.1 or the Human Orfeome collaboration OCAA collection (Open Biosystems, Huntsville, AL) (20). Briefly, the SNX gene in entry clones pDONOR223 or pENTR201 vectors were exchanged with the ccdB gene in the expression plasmid by LR recombination (Invitrogen, Australia).
Test Expression in the Cell-free System
The Leishmania tarentolae Extract (LTE) was prepared as published earlier (21). A 10 μl expression volume containing 30 nm of pCellFree-N-terminal-GFP and 60 nm of pCellFree-C-terminal-Cherry-myc was incubated for 2.5 h at 27 °C for expression. Expressed proteins were mixed with NuPAGE LDS sample buffer (Invitrogen, Australia), denatured by heating at 72 °C for 3 min and resolved on NuPage Novex 4%-12% gel (Invitrogen, Australia). The proteins were detected by scanning the gel for fluorescence using ChemiDoc MP System (Bio-Rad, Australia).
AlphaScreen Assay
The AlphaScreen Assay was performed using the AlphaScreen cMyc detection kit and Proxiplate-384 Plus plates from Perkin Elmer. Expressed protein pairs were diluted in ¼ serial dilutions in Buffer A (25 mm HEPES, 50 mm NaCl). A volume of 2 μl of diluted protein was added to each well containing 12.5 μl (0.4 μg) of Acceptor beads in Buffer B (25 mm HEPES, 50 mm NaCl, 0.001% v/v casein, and 0.001% v/v Nonidet P-40). This was followed by addition of 2 μl biotin labeled GFP-nanotrap diluted in Buffer A to a final concentration of ∼2.5 nm. The proteins and Acceptor beads were incubated for 45 min at RT before addition of 2 μl (0.4 μg) of Streptavidin coated Donor Beads. This was followed by a second incubation of 45 min at RT in the dark. The AlphaScreen signal was measured using the PE Envision Multilabel Platereader according to the manufacturer's recommended settings (excitation: 680/30 nm for 0.18 s, emission: 570/100 nm after 37 ms).
A binding index is defined as the average of all the signal intensities for each protein pair. For each experiment, the signal intensity from a negative control (where GFP alone is present in the solution) is subtracted. The signals are then normalized to a reference value. In this case, we chose the value obtained for the interaction between GFP-SNX4 and SNX4-Cherry-myc, as a standard in all measurements. An average of all the normalized data for both configuration of each protein pair (GFP-protein A/protein B-Cherry OR GFP-protein B/protein A-Cherry) was calculated to provide the binding index.
Co-immunoprecipitation Assay
GFP and Cherry labeled pairs of SNX proteins were co-expressed in 170 μl of LTE for 3.5 h at 27 °C. The co-expression was performed with 6 nm of the vector coding for N-terminal GFP “bait” SNX proteins and 18 nm of the vector coding for a C-terminal Cherry-myc “prey” SNX protein. A GFP construct was used as a negative control bait. NaCl was added to the expressed protein (to a final concentration of 200 mm) and the samples were incubated with 10 μl of GFP-nanotrap coated beads (NHS-activated Sepharose coupled with MBP-GFP-Nanotrap) for 30 min at 4 °C with gentle mixing by rotation. Subsequently, the beads were washed six times with 200 μl of wash buffer (PBS with 0.1% Triton X-100 and 200 mm NaCl). The proteins were released from the beads by heating for 3 min at 72 °C in 15 μl of 2x NuPAGE LDS loading buffer and resolved as described above for gel electrophoresis. Fluorescence intensity was analyzed using ImageJ software and a leakage of 10% of the GFP fluorescence into the Cherry channel was accounted for in the quantification of the pull-down results.
Single Molecule Fluorescence Spectroscopy
Single molecule spectroscopy was performed as described previously (22, 23). Proteins were expressed in LTE and immediately diluted ∼400 times in buffer A, to a final concentration of ∼50 pm. A volume of 20 μl of each sample was placed into a custom-made silicone 192-well plate that self-seals on top of a large 70 × 80 mm glass coverslip (ProSciTech, Australia). Plates were analyzed at room temperature on a Zeiss LSM710 microscope with a FCS Confocor3 module.
Single Molecule Fluorescence Intensity Measurements
For intensity measurements, N-terminal GFP-labeled SNX proteins were expressed in 10 μl of LTE using 50 nm of DNA and incubation for 3 h at 27 °C. One laser (488 nm) was focused in solution using a 40×/1.2 NA water-immersion objective. Fluorescence from GFP was filtered by a 505–540 band pass filter. The number of photons collected in 1 ms time bins (IGFP(t)) was recorded. A single-molecule event was detected when the total intensity was above a threshold of 50 photons.
Single-molecule brightness analysis is the simple “counting” of photons emitted by a protein complex and comparison to the typical number of photons obtained from a GFP monomer, to calculate the number of GFP fluorophores present in the complex. This is however complicated by the fact that proteins diffuse randomly through the focal volume and that different trajectories are observed. The optimal trajectory maximizes the time spent in the focal volume and the number of photons emitted. If one considers that at any time step, the proteins can escape the detection volume, this optimal trajectory is exponentially rare and smaller bursts are more frequent. Therefore, the distribution of burst size typically follows an exponential decay. The number of events for each intensity range was counted and normalized to the total number of events to give a probability P(I). Intensity measurement graphs were obtained by measuring more than 1000 events; P(I) is plotted as a function of burst intensity (I) (photons per ms).
Single Molecule Coincidence Measurements
For coincidence experiments, N-terminal GFP-labeled and N-terminal Cherry labeled SNX proteins were co-expressed using 40 nm of DNA in 10 μl of LTE for 3 h at 27 °C. Two lasers (488 nm and 561 nm) were focused in solution using a 40×/1.2 NA water-immersion objective. Fluorescence was collected and separated using a 565 nm dichroic; signal from GFP (IGFP(t)) was filtered by a 505–540 band pass filter, whereas fluorescence from Cherry (ICherry(t)) was filtered by a 580 nm long pass. The fluorescence of the two channels was recorded simultaneously and separately, adding the number of photons collected in 1 ms time bins. A single-molecule event was detected when the total intensity of the two channels was above a threshold of 50 photons. For each event, the intensities of the GFP and Cherry bursts were corrected for background and leakage (10% leakage of the GFP into the Cherry channel). The coincidence C was then measured ratiometrically as the corrected Cherry signal, divided by the total intensity of the burst (C = ICherry/[IGFP + ICherry]). In the absence of Cherry fluorescence, C is close to zero, and in the absence of GFP, C tends toward 1. Events with 0.25<C<0.75 are considered coincident events. The number of events for each ratio C was counted and normalized to the total number of events to give a probability P(C). Histograms of single-molecule coincidence (P(C) as a function of C) were obtained by measuring >1000 events per interaction, and fitted by Gaussian peaks for GFP-only, coincidence and Cherry-only contributions. The bound fraction was calculated as the proportion of coincidence (0.25<C<0.75) to total events.
RESULTS
In Vitro Co-expression of SNX-BAR Proteins
We set out to systematically analyze the pairwise interactions between 12 SNX proteins, following co-expression of all 144 possible pairs. Due to the large number of possible combinations, a cell-free approach was used to accelerate conversion of DNA to protein while controlling of the co-expression ratios. We employed the recently developed eukaryotic L. tarentolae-based cell free expression system (LTE). This system enables expression of complex human proteins in their functional and full-length form (24). As L. tarentolae is a fast-growing and fermentable organism, the translation-competent lysate can be generated rapidly and inexpensively (21, 25, 26).
The SNX proteins were expressed in vitro as GFP and Cherry-myc fusion proteins. GFP and Cherry fluorescence were used to detect expressed proteins and GFP and myc serve as affinity tags (27). Genetically encoded tags are relatively large and may interfere with protein folding and the ability to engage in protein-protein interactions. To address these issues, we iteratively tagged each SNX with an N-terminal GFP tag and a C-terminal Cherry-myc tag and each interaction was tested in two combinations. Cloning of the 24 different fusion proteins was greatly simplified by the development of a cell-free expression vector compatible with Gateway recombination technology* that enabled us to source the SNX-BAR genes from a human Open Reading Frame (ORF) library (supplemental Fig. S2). All fusion proteins were expressed in LTE and analyzed by SDS-PAGE, and as can be seen in the Fig. 1C, all proteins migrated corresponding to their expected molecular weights. All proteins could be expressed at similar levels, typically between 1 and 1.5 μm (supplemental Figs. S4 and S5). Note that SNX6 was a truncated clone, with an intact BAR domain. The only human SNX-BAR protein not included in these studies is SNX18, as its ORF was not found in available libraries.
Analysis of SNX-BAR Interactions using AlphaScreen Assay
AlphaScreen is a sensitive bead-based proximity assay able to detect interactions with a wide range of affinities (from pm to mm) (28, 29). Fig. 2A shows a schematic of how this assay was employed to analyze the pair-wise interactions between SNX protein pairs following their co-expression in the cell-free system, without any purification or enrichment steps. AlphaScreen signals can occur even if beads are relatively far apart (distance up to 200 nm), and it is therefore technically a proximity assay as opposed to a direct binding assay. However, as we are using an orthogonal in vitro expression system, bridging by intermediate proteins from the LTE is not expected and interactions are most likely direct. The luminescence signal upon binding depends strongly on protein concentration (Fig. 2B), thus different dilutions of the proteins were used to determine the maximum response of each AlphaScreen assay. The system is therefore self-calibrating, adjusting for the differences in initial protein concentrations so the protein expression levels do not have to be tightly controlled. This feature of the binding signal also serves as an internal quality control, as nonspecific interactions do not display a strong dose dependent response. The typical AlphaScreen data presented in Fig. 2C for a pair of interacting proteins (SNX8-SNX8) and for a noninteracting pair (SNX3-SNX3) demonstrates that the method can detect specific interactions between SNX proteins with confidence.
Fig. 2.

AlphaScreen assay for pair-wise interaction analysis. A, Schematic representation of AlphaScreen proximity assay. The streptavidin coated donor bead binds biotin coupled GFP-nanotrap that recruits N-terminally GFP-tagged protein A. The acceptor bead coated with anti-myc antibody binds to the C-terminal mCherry-myc tag of protein B. The donor bead contains phthalocyanine, a photosensitizer that converts ambient oxygen to an excited and reactive state upon illumination at 680 nm. The singlet oxygen (1O2) has a half-life of 4 μs in which it can diffuse ∼200 nm in solution. If an acceptor bead is within that distance, the singlet oxygen reacts with thioxene derivatives in the acceptor bead, subsequently luminescing at 520–620 nm. In the absence of an acceptor bead, the singlet oxygen will fall to ground state and no signal is produced. When protein A and B interact with each other, the proteins will bring the beads in a close proximity to each other, leading to the AlphaScreen signal. B, The “hooking effect” in the AlphaScreen assay. AlphaScreen signal measured in counts per seconds (cps) is dependent on the dilution of the protein. Low protein concentration in the assay will lead to a limited bead association and a low AlphaScreen signal. An excess of proteins will lead to a low AlphaScreen signal by inhibition of bead association through competition with the unbound proteins. C, Typical AlphaScreen data obtained for a noninteracting pair (GFP-SNX3 and SNX3-Cherry-myc, dotted line) and for an interacting pair (GFP-SNX8 and SNX8-Cherry-myc, black line). The proteins were co-expressed in LTE and diluted as indicated. The average signal ± S.E. for three different experiments is presented.
In the interaction screen, all 144 protein pairs were tested in triplicate and for each pair 5 dilutions were performed to accurately measure the maximal response of the assay. Because of the excellent scalability of the AlphaScreen assay we were able to perform it in a 384-well format. We averaged the results obtained with the N- and C-terminal tag combinations and plotted the aggregated results as a matrix of interactions (Fig. 3). An AlphaScreen binding index was calculated relative to a strong binding pair (SNX4-SNX4), which was used as internal control in every AlphaScreen plate. We chose an arbitrary threshold of 50% of the SNX4-SNX4 binding index as a cut-off for a positive interaction, and then sought independent validation of these results using other methods.
Fig. 3.

SNX-BAR interaction heat map measured by AlphaScreen. A binding index is calculated for each interaction over at least three experiments (see Experimental Procedures) and plotted in a color-coded matrix. Red indicates a strong interaction and blue corresponds to no detectable interaction.
Under these conditions, all proteins except for SNX1, SNX3, and SNX5 are able to form homo-dimers, and most show significant selectivity for different heteromeric binding partners. In nearly all cases, the signal intensities obtained with probes carrying tags at different termini were comparable, providing a high degree of confidence in the binding specificities we observe. Only one significant outlier was seen, and interestingly this interaction is between SNX8 and the nonBAR domain protein SNX3, where we observe an interaction using GFP-tagged SNX8 and cherry-tagged SNX3, but little association when tags are reversed (supplemental Fig. S1). We believe however, that this is a specific interaction based on further validation as discussed below.
Validation of SNX-BAR Homo-dimerization by Co-immunoprecipitation
The propensity to form homo-oligomers was also assessed by a co-immunoprecipitation (co-IP) assay (Fig. 4). The bait proteins were expressed with an N-terminal GFP tag, whereas C-terminal Cherry-myc fusion proteins were used as prey. Immunoprecipitation was carried out using GFP-antibody functionalized Sepharose, and samples were resolved by SDS-PAGE and scanned for GFP and Cherry fluorescence. To compensate for variations in expression levels, we measured the intensities of Cherry fluorescence before and after pull-down and calculated the ratio of intensities as a measure of binding. Qualitative comparison of the two methods (AlphaScreen and co-IP) validated our choice of a binding index of 50 as a threshold for positive interactions (Figs. 4B and 4C). Furthermore, a higher AlphaScreen index roughly correlates with a stronger interaction as estimated by co-IP. This analysis also revealed limitations of the two methods, with co-IPs failing to reproduce the self-association of SNX2, and AlphaScreen underestimating the strength of the SNX9 self-interaction.
Fig. 4.

Validation of SNX-BAR homo-dimerization by co-IP and fluorescence brightness analysis. A, In gel fluorescence detection of Cherry-labeled proteins before (top) and after (bottom) co-immunoprecipitation. C-terminal mCherry-myc labeled SNXs (preys) were co-expressed in LTE with N-terminal GFP labeled SNX (+) or GFP protein alone (−) as baits. GFP-labeled proteins were immunoprecipitated using GFP-nanotrap coated beads and loaded on SDS-PAGE gels (4%-12% acrylamide). Fluorescence scanning of the gel with excitation at 585/20 nm and detection at 620/20 nm is presented. B, Cherry fluorescence enrichment by co-immunoprecipitation. Fluorescence intensity on panel A was quantified and the ratio of intensities was calculated (r = Iafter CoIP/Ibefore CoIP). C, Related binding index from AlphaScreen assay. The binding index is calculated as described in the Experimental Procedures. The standard error (S.E.) over at least three experiments is represented. D, Representative fluorescence time-traces for single freely diffusing molecule brightness analysis. Burst intensity (photons counts per ms) are plotted as a function of time. The top panel (GFP-SNX3) corresponds to monomers diffusing through the confocal volume resulting in the maximal photon counts per ms of 50. The bottom panel (GFP-SNX8) shows bursts of 100 or more photons per ms, indicating the residence of two or more fluorophores in the confocal volume at the same time. This was interpreted as dimer formation. E, Burst intensity analysis for different SNXs. GFP-SNX fusion proteins, as well as a GFP-Cherry fusion protein, were expressed in LTE and diluted to 100 pm before analysis on a confocal microscope. Fluorescence signal was recorded for 500 s. The number of events for each intensity range was counted and normalized to the total number of events. This fraction of events P(I) is plotted as a function of burst intensity (I) (photons per ms) in a semi-logarithmic representation for GFP-Cherry (small black squares), SNX3 (grey triangles), SNX8 (light grey circles), and SNX6 (white diamonds). F, Brightness analysis. For each protein, the fraction of events above threshold (125 photons) was calculated.
SNX-BAR Dimerization in Solution Measured by Single Molecule Fluorescence Intensity
Although the results of co-IP experiments correlate well with AlphaScreen data, both methods measure interactions of proteins coupled to solid supports that may potentially contribute to nonspecific association. To address this issue, we turned to single molecule spectroscopy of freely diffusing fluorescently labeled proteins. Single-molecule spectroscopy is typically performed after the purification of recombinant proteins and labeling with organic fluorescent dyes. We found that GFP and Cherry fluorophores can be measured at the single-molecule level, even on freely diffusing proteins (30). The fluorescence intensity of a monomeric fluorescent protein can be calibrated precisely and subsequently used to “count” the number of proteins in diffusing protein complexes.
The SNX-BAR proteins were expressed with an N-terminal GFP tag in LTE, and the samples were analyzed on a confocal microscope configured for single-molecule studies. For brightness analysis, we used a 488 nm laser to excite the GFP fluorophores. Time traces of GFP emission were recorded in 1 ms time “bins” to improve signal/noise ratio. Proteins were diluted to picomolar concentrations where only single proteins or protein complexes were present in the confocal volume. When GFP-tagged proteins diffuse through the confocal volume, a fluorescent burst is recorded. The burst intensity indicates how many fluorophores are present in the confocal volume at the given time. In the case of dimer formation, the burst intensity will be approximately twice as large as that of a monomer (Fig. 4D). In the case of higher-order oligomerization, multiple fluorescent proteins will pass through the confocal volume simultaneously, resulting in a higher photon count. However, because not all objects follow an ideal path through the confocal volume, the analysis is not so straightforward (see Experimental Procedure and (30) for details). In Fig. 4E, the size of the bursts is plotted against the fraction of the bursts of that size to determine whether the SNXs form monomers, homo-dimers or larger oligomers. The GFP-Cherry-myc chimeric protein, which diffuses as a monomer at these concentrations, was used to calibrate the data and determine the threshold for monomeric behavior. Fig. 4F presents the percentage of events above threshold, which correlates with the propensity of proteins to form dimers.
In agreement with our AlphaScreen and co-IP data, SNX1, SNX3, and SNX5 display mainly monomeric behavior, very similar to that of control GFP molecules (Fig. 4F). Under these conditions, SNX2 also displays a predominantly monomeric distribution, in contrast to the weak association seen in AlphaScreen assay, but correlating with co-IP experiments. Overall however, these single molecule measurements show excellent agreement with both AlphaScreen and co-IP data, with other members of the family showing a propensity for monomer or dimer formation that is similar in all three assays (Fig. 4F). Note also that there is no observed tendency to form larger oligomers or aggregates under these conditions.
Single Molecule Coincidence Measurements Confirm SNX-BAR Interactions and Identify a Novel SNX8-SNX3 Complex
Single-molecule “counting” measurements rely on a single fluorescent tag and are well adapted to quantify the formation of homo-dimers and homo-oligomers. To study hetero-dimers, we need to separately detect the two proteins, labeled with two different fluorophores. We use two-color coincidence detection (31–35) on co-expressed pairs of SNX-BAR proteins tagged with GFP and Cherry. After co-expression in LTE, the samples were diluted to picomolar concentrations and measured rapidly (within 15 min) to avoid dissociation of complexes. In two-color single-molecule coincidence, the two fluorophores are excited independently by two spatially overlapping lasers (488 nm and 564 nm for the GFP and Cherry excitation respectively) (Fig. 5A). Emission is recorded for each event in two channels (as shown in Fig. 5B for SNX8-SNX8) and for each burst a ratio of the intensity of Cherry (R) to the total intensity of Cherry plus GFP fluorescence (R+G) is calculated. A ratio close to 1 means that only a Cherry labeled protein is present in the confocal volume, a ratio close to 0 means that only a GFP labeled protein is present, and a ratio around 0.5 means that both Cherry and GFP are present in the confocal volume at a 1:1 ratio. At the chosen concentrations, coincidence statistically happens only if the two proteins interact with each other. This simple technique therefore is well-suited to detect specific binding between two proteins, and quantify the stoichiometry of interaction. For each experiment, a thousand events are recorded and the data are plotted as histograms recording the fraction of events that correspond to each coincidence ratio. The presence of a Gaussian peak between 0.25 and 0.75 indicates an interaction.
Fig. 5.

Single molecule coincidence analysis of SNX-BAR domain proteins. A, Principle of single molecule coincidence analysis. In single molecule coincidence experiments, overlapped lasers (495 nm and 560 nm) are focused through a confocal microscope into a dilute sample. Fluorescent particles, labeled with GFP (green ball) or Cherry (red ball) diffuse freely in the solution. When a particle enters the observation volume, fluctuations of the signal (“burst”) are recorded either on the GFP channel (green) or the Cherry channel (red) B, Typical fluorescence time-trace (5 s) for an interacting protein pair (GFP-SNX8 and Cherry-SNX8). In some instances, a signal is simultaneously detected in both channels, indicating that a GFP and a Cherry fluorophore are present in the observation volume at the same time. This statistically only happens if two proteins (one GFP-labeled, the other Cherry-labeled) interact. C–H, Representative histograms for single molecule coincidence experiments. In experiments C–G, GFP-labeled proteins were co-expressed with Cherry-labeled proteins in LTE. In H, GFP-SNX8 and Cherry-SNX6 were expressed separately in LTE then mixed together and allowed to interact for 1h before the assay. In all cases, the mixtures were diluted to pm immediately before testing. A fluorescence signal was recorded in the GFP channel and the Cherry channel over 500s. The signal was then analyzed as a succession of individual events. For each event, a ratio of Cherry fluorescence to the total fluorescence is calculated. The number of events for each ratio C was counted and normalized to the total number of events. This fraction of events P(C) is plotted as a function of coincidence ratio (C). Gaussian curves are overlaid on the histograms: the green Gaussian curve corresponds to GFP only, the red Gaussian to Cherry only; the yellow Gaussian highlights the presence of both GFP and Cherry in the focal volume. Coincidence histograms are recorded for SNX1 (C), SNX3 (D), SNX8 (E), and SNX32 (F). Interactions of GFP-SNX8 with Cherry-SNX6, after co-expression (G) or mixing of separately expressed proteins (H) have been investigated. I, Binding index from AlphaScreen assay for SNX1-SNX1, SNX3-SNX3, SNX8-SNX8, and SNX32-SNX32 interactions. The binding index is calculated as described in the Experimental Procedures. J, Single molecule coincidence analysis for SNX1-SNX1, SNX3-SNX3, SNX8-SNX8, and SNX32-SNX32 interactions. The percentage of coincidence corresponds to the fraction of events with a coincidence ratio between 0.2 and 0.8.
Firstly, we studied the homo-dimerization of SNX8 and SNX3 (Fig. 5D, 5E). As expected we detect a coincidence peak centered on 0.5 in the case of SNX8 homo-dimers, indicating that one GFP-SNX8 interacts with one Cherry-SNX8. For SNX3 only background coincidence is observed, consistent with its monomeric state. The single-molecule coincidence data also reproduces the trend observed by AlphaScreen for two other pairs. Little coincidence is seen for the SNX1-SNX1 homo-dimer (Fig. 5C), and intermediate coincidence levels are measured for the SNX32-SNX32 pair (Fig. 5F). Interestingly, using the single molecule coincidence approach we also confirmed the potential SNX8 interaction with the non-BAR domain protein SNX3 seen in AlphaScreen. Unexpectedly, we find that the two proteins interact in a fixed ratio of ∼2 molecules SNX8 bound to 1 molecule of SNX3 (supplemental Fig. S3). The brightness analysis suggests that a homo-dimer of SNX8 can bind a SNX3 monomer, but the molecular details of this interaction will require further investigations.
Finally, we investigated the interaction between SNX6 and SNX8. Both proteins have high propensity to form homo-dimers on their own, and AlphaScreen results revealed a strong interaction between the two proteins. Upon co-expression, coincidence is detected with a peak centered at 0.5 confirming that the SNX8 and SNX6 proteins form heteromeric complexes in a 1:1 ratio (Fig. 5G). Analysis of burst intensities suggests the formation of a simple hetero-dimer rather than the higher order assembly of separate preformed SNX6 and SNX8 homo-dimers (data not shown).
DISCUSSION
Analyzing homo- and hetero-oligomerization among large sets of proteins such as the SNX-BAR family can be time consuming and highly impractical if the typical cycles of expression in bacterial or mammalian cells, purification and analysis are performed. A typical example of such study is the investigation attempted by Chang et al. (36), analyzing interactions between mammalian PDZ domains. The study required the expression and purification of 157 PDZ domains followed by labeling with organic fluorescent dyes, for use on protein microarrays.
Our cell-free approach eliminates the purification steps and accelerates the study of full-length multi-domain proteins. More importantly, it allows co-expression of all protein pairs, and we believe that co-folding of the proteins typically increases their potential binding. The screen of 12,403 possible PDZ dimers revealed 37 interactions (36), a relatively low hit-rate that could potentially be increased by co-expression of the PDZ pairs. Note that without co-expression, a tight homo-dimer would not be seen as interacting with itself or with other PDZ domains, unless the PDZ domains can separate and re-arrange on the measurement timescale.
In our case, we observed that characterization of hetero-dimers of SNX-BAR proteins would not be possible without co-expression for all 144 pairs. Indeed the SNX8-SNX6 interaction could not be recapitulated when we recombined separately expressed SNX6 and SNX8, suggesting that co-expression is required for their hetero-dimerization in vitro (Fig. 5H). This also implies that labile subunit exchange between pre-assembled SNX8 and SNX6 dimers is unlikely in a cellular context, and will likely require co-translational assembly for SNX8-SNX6 hetero-dimerization to occur.
Using in vitro protein co-expression combined with sensitive and high-throughput proximity assay has been suggested as a valuable tool for post-genomic research (37). The combination of cell-free protein expression and AlphaScreen has been used to identify auto-antigen proteins (38, 39). So far, similar studies have focused on a single protein target, and here we demonstrate the feasibility of that approach on large matrix of protein-protein interactions. Our approach adds single molecule fluorescence measurements, which contributes us valuable information on stoichiometries and protein aggregation at the same time.
Species-independent Gateway vectors enable rapid conversion of ORF libraries into tagged expression constructs that can be translated in any in vitro expression systems. Highly sensitive AlphaScreen assay allowed us to rapidly and inexpensively generate a high-confidence interaction map for a relatively large human protein family, and using single molecule measurements, we validated the specificity of the observed interactions, determined the size of the oligomers and determined the ratio between proteins in a given oligomer. Tag position can often interfere with the protein-protein interaction, so we tested the entire interaction matrix in different tagging configurations to create data redundancy and avoid false negatives. In this case, as in other ongoing studies, almost all interactions could be detected using both tag configurations. This is probably due to the fact that AlphaScreen is quite insensitive to the distance between tags (up to 200 nm), in contrast to most complementation assays such as split-GFP or Yeast-Two-Hybrid screens. The genetically encoded tags we used are large, but this may actually help the tags to remain accessible for binding to the beads.
Another source of false results in protein-protein interactions studies is protein aggregation or nonspecific binding. This is especially important for homo-oligomerization studies. Often, information about the propensity of a protein to self-interact is lost in the experimental noise and the importance of homodimers is overlooked. Here we verify the specificity of interactions measured in AlphaScreen by using single-molecule spectroscopy, where measurements are performed on freely diffusing proteins, directly in solution and avoiding interference from solid surfaces. The single-molecule brightness analysis and two-color measurements validate that interactions do genuinely occur without nonspecific aggregation. Here we are able to detect which proteins interact and measure the stoichiometry of these interactions.
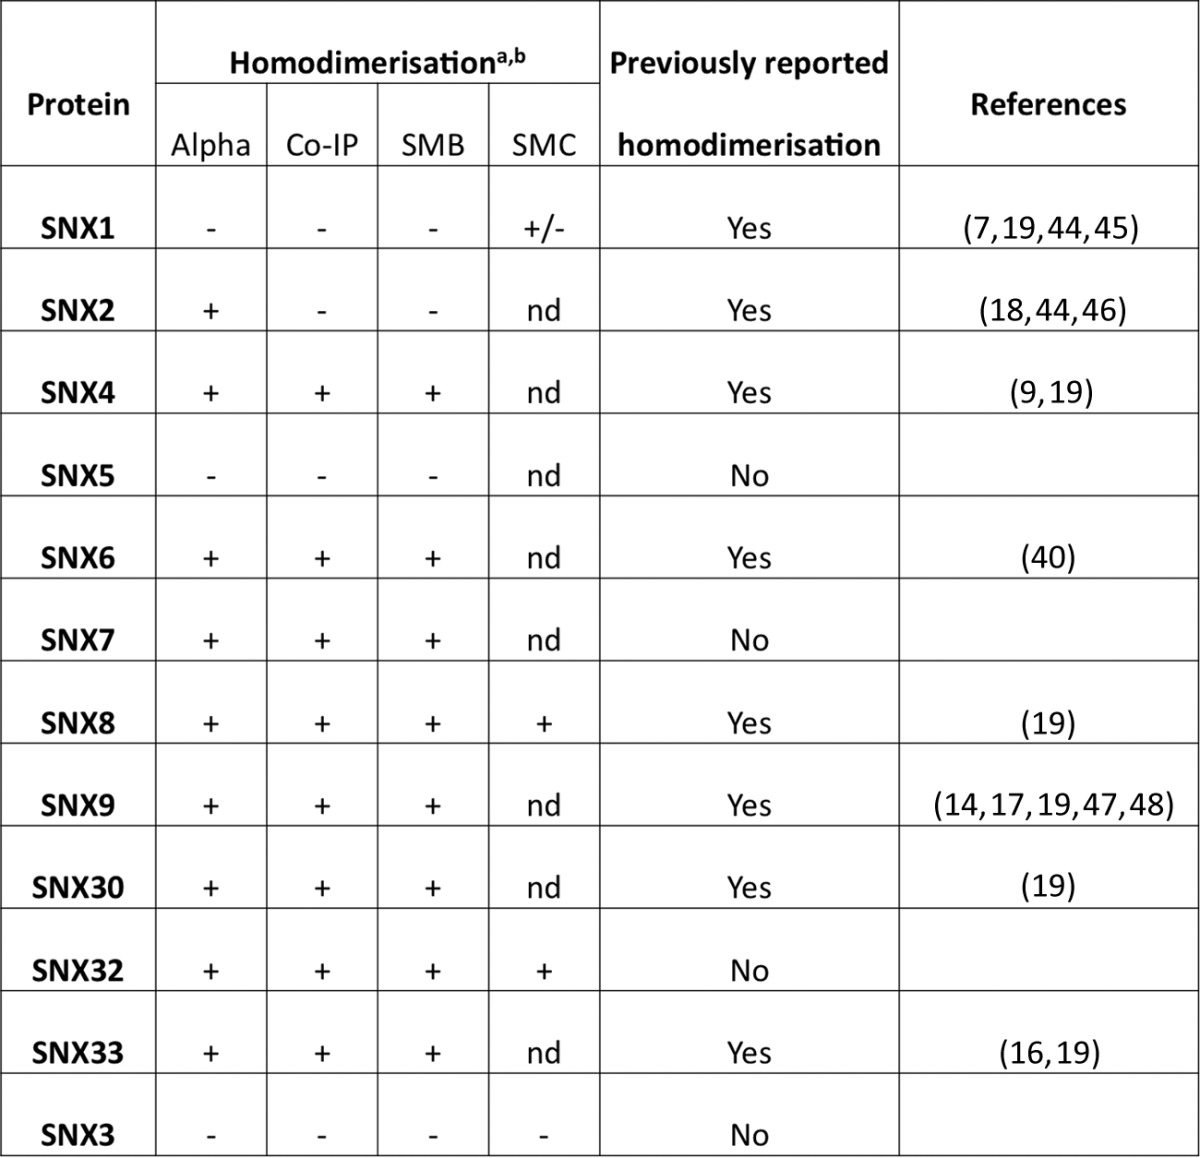
In this study we have applied this powerful approach to the family of human SNX-BAR proteins, which have central roles in endocytic and endosomal membrane trafficking. Critically, the SNX-BAR proteins function as obligate dimers, where dimerization of the BAR domains is required for both membrane association and remodeling. Therefore, determining the scope of potential homo- and heterodimeric SNX-BAR assemblies is essential for a greater understanding of their cellular functions. Overall, we observe the formation of a restricted range of both homo- and hetero-dimers within the SNX-BAR family. Our results are in general agreement with previous semi-systematic studies (3, 7, 19) (Table I for homo-dimers and supplemental Fig. S6 for heterodimers), but extend these results by examining direct protein-protein interactions between all but one of the SNX-BAR molecules. We conclude that SNX4, SNX6, SNX7, SNX8, SNX9, and SNX33 form strong homo-dimers as detected by all three techniques used here. In their recent report, van Weering et al. (19) analyzed the formation of homo- and heterodimers between different SNXs using co-IPs of proteins co-expressed in HEK-293T cells. In agreement with our results, it was also found that SNX4, SNX8, SNX9, and SNX33 were able to form homodimers. In addition, our data points to SNX6 and SNX7 being able to homodimerize in vitro. This is in contrast to recent studies of SNX6 (7), and SNX7 (19), that suggest these proteins do not self-associate, but is supported by earlier data showing that SNX6 is able to form homodimers in co-IPs (40). Interestingly, SNX1, SNX2 and SNX5 do not appear to form stable homodimers. This is in close agreement with previous work by Wassmer and colleagues who also found that both SNX1 and SNX2 showed little propensity for self-association (7). We observed that SNX1 expressed in bacteria can form homo-dimers at high concentrations (data not shown) and note that the crystal structure of the SNX1 BAR domain homo-dimer was recently solved (19). However, it was noted that the SNX1 BAR domain interaction is likely to be unstable because of the presence of unpaired charged residues at the dimeric interface. The relatively low affinity between SNX1 monomers, and the relatively low concentrations at which the proteins are expressed in the L. tarentolae system could explain the low binding scores obtained in this study.
Table I. Summary of the homodimerization properties of the human SNX-BAR proteins. For each protein, the propensity to homodimerize is summarized for the different methods (Alpha, detected by AlphaScreen; Co-IP, detected by co-IPs; SMB detected by single molecule brightness and SMC, detected by single molecule coincidence). nd refers to the absence of SMC data. The table includes relevant references from the literature.
Hetero-dimerization of the SNX-BAR may play an important role in the cell. For example, the subset of SNX1, SNX2, SNX5, and SNX6 coordinate with each other to regulate retromer mediated endosomal trafficking, and the evidence is now strong that this involves formation of heterodimeric SNX-BAR complexes. In our study, the otherwise monomeric SNX1, SNX2, and SNX5 can associate with other SNX-BAR proteins, especially SNX6 (7). Multiple interactions that obtained a high score in our AlphaScreen assay have been previously reported; for example, SNX4 was found to preferentially form hetero-dimers with SNX7 (19). Our systematic analysis shows that four proteins (SNX2, SNX4, SNX6, and SNX8) can interact with many other SNX-BARs. Previous experiments in mammalian cells also showed that SNX8 was able to co-IP all the tested proteins to a significant extent (19). Although this could point to nonspecific binding, the lack of aggregation of these proteins detected by single molecule brightness analyses, and validation of the SNX8-SNX6 hetero-dimeric interaction by single molecule coincidence suggests this is not the case. Our data set suggests that SNX2, SNX4, SNX6, and SNX8 have a propensity to participate in promiscuous complex formation.
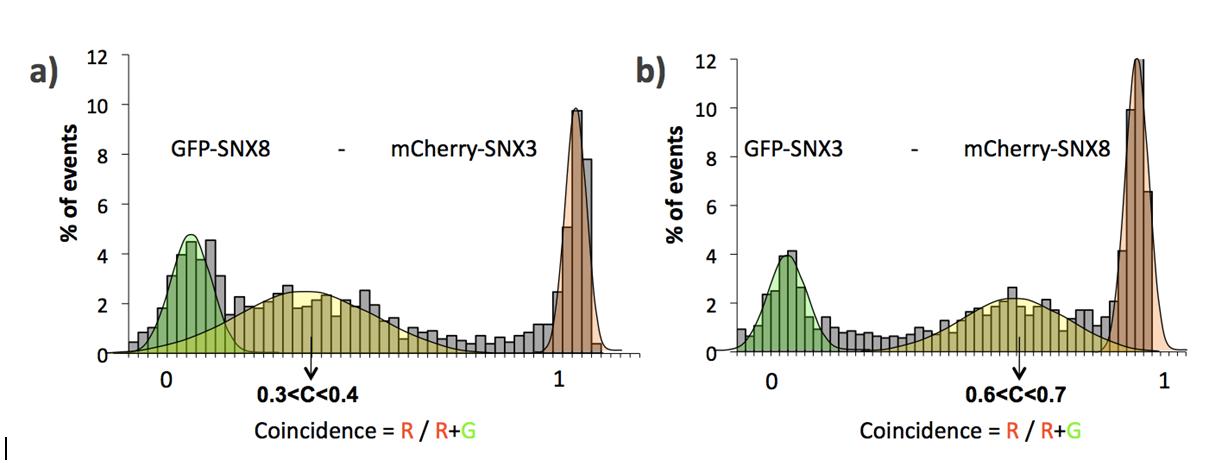
One of the most unexpected findings was an apparently specific interaction of SNX8 with the non-BAR domain protein SNX3. Single molecule coincidence experiments show that GFP-SNX8 and Cherry-SNX3 bind to each other with a coincidence peak centered at ∼0.35, and inverting the fusion tags results in a coincidence peak centered at ∼0.65. This indicates a very specific interaction, and formation of a complex containing two molecules of SNX8 and a SNX3 monomer (see supplemental Fig. S2 and S3). This association is consistent with proposed roles for both SNX8 and SNX3 in endosome to Golgi recycling pathways (8, 41, 42), but like the SNX8-SNX6 complex will require further validation in vivo to confirm its functional importance.
In summary, we have systematically determined the range of direct interactions that are possible between members of the SNX-BAR family in vitro, by combining cell-free expression for rapid protein synthesis and AlphaScreen and single molecule spectroscopy for sensitive detection of the interactions. One of the key challenges of a post-genomic era will be the validation of massive PPI data sets from proteomics screens, and this will be especially true for self-interacting proteins. The analysis presented here can be performed in a highly multiplexed format, directly from the protein co-expression mixture, without any purification or washing steps that could perturb the protein complexes. Our approach certainly does not have the throughput of Yeast-2-Hybrid or other protein complementation assays, but it has the potential to create high-confidence data sets at a faster pace than traditional biophysical methods, co-immunoprecipitation and co-localization microscopy.
We believe it should be a valuable tool for the validation of protein-protein interaction networks (43).
Supplementary Material
Footnotes
Author contributions: E.S., B.M.C., K.A., and Y.G. designed research; E.S., L.M.S., N.G., M.E.P., M.M., and Y.G. performed research; N.G., M.E.P., M.M., S.M., W.A.J., M.D., D.S., T.J.G., and B.G. contributed new reagents or analytic tools; E.S., L.M.S., B.M.C., K.A., and Y.G. analyzed data; E.S., L.M.S., B.M.C., K.A., and Y.G. wrote the paper.
* This work was supported by Australian Research Council (ARC) Future Fellowships (FT100100027 to BMC, FT0991611 to KAA and FT110100478 to YG), as well as by ARC Discovery Project Grants (DP120103930, DP130102396 and DP120101423), by a National Health and Medical Research Council Project Grant (NHMRC) (APP1025082) and NHMRC Program Grants (511005 and APP1037320). Microscopy was performed at the ARCF/IMB Cancer Biology Imaging Facility, established with the generous support of the Australian Cancer Research Foundation.
 This article contains supplemental Figs. S1 to S6.
1 The abbreviations used are:
- PPI
- protein–protein interaction
- AlphaScreen
- Amplified Luminescent Proximity Homogeneous Assay Screen
- BAR
- Bin/Amphiphysin/Rvs
- C
- coincidence
- cps
- count per second
- G
- intensity of GFP fluorescence
- GFP
- green fluorescent protein
- GW
- Gateway technology
- IP (co-)
- immunoprecipitation (co-)
- LTE
- Leishmania tarentolae extract
- PX
- Phox
- SH3
- SRC homology 3
- SNX
- sorting nexin
- R
- intensity of Cherry fluorescence
- RT
- room temperature.
REFERENCES
- 1. Marianayagam N. J., Sunde M., Matthews J. M. (2004) The power of two: protein dimerization in biology. Trends Biochem. Sci. 29, 618–625 [DOI] [PubMed] [Google Scholar]
- 2. Seet L. F., Hong W. (2006) The Phox (PX) domain proteins and membrane traffic. Biochim. Biophys. Acta 1761, 878–896 [DOI] [PubMed] [Google Scholar]
- 3. Teasdale R. D., Collins B. M. (2012) Insights into the PX (phox-homology) domain and SNX (sorting nexin) protein families: structures, functions, and roles in disease. Biochem. J. 441, 39–59 [DOI] [PubMed] [Google Scholar]
- 4. Cullen P. J. (2011) Phosphoinositides and the regulation of tubular-based endosomal sorting. Biochem. Soc. Trans. 39, 839–850 [DOI] [PubMed] [Google Scholar]
- 5. van Weering J. R., Verkade P., Cullen P. J. (2010) SNX-BAR proteins in phosphoinositide-mediated, tubular-based endosomal sorting. Semin. Cell Dev. Biol. 21, 371–380 [DOI] [PMC free article] [PubMed] [Google Scholar]
- 6. Wang J. T., Kerr M. C., Karunaratne S., Jeanes A., Yap A. S., Teasdale R. D. (2010) The SNX-PX-BAR family in macropinocytosis: the regulation of macropinosome formation by SNX-PX-BAR proteins. PLoS One 5, e13763. [DOI] [PMC free article] [PubMed] [Google Scholar]
- 7. Wassmer T., Attar N., Harterink M., van Weering J. R., Traer C. J., Oakley J., Goud B., Stephens D. J., Verkade P., Korswagen H. C., Cullen P. J. (2009) The retromer coat complex coordinates endosomal sorting and dynein-mediated transport, with carrier recognition by the trans-Golgi network. Dev. Cell 17, 110–122 [DOI] [PMC free article] [PubMed] [Google Scholar]
- 8. van Weering J. R., Verkade P., Cullen P. J. (2012) SNX-BAR-mediated endosome tubulation is co-ordinated with endosome maturation. Traffic 13, 94–107 [DOI] [PubMed] [Google Scholar]
- 9. Traer C. J., Rutherford A. C., Palmer K. J., Wassmer T., Oakley J., Attar N., Carlton J. G., Kremerskothen J., Stephens D. J., Cullen P. J. (2007) SNX4 coordinates endosomal sorting of TfnR with dynein-mediated transport into the endocytic recycling compartment. Nat. Cell Biol. 9, 1370–1380 [DOI] [PubMed] [Google Scholar]
- 10. McGough I. J., Cullen P. J. (2013) Clathrin is not required for SNX-BAR-retromer-mediated carrier formation. J. Cell Sci. 126, 45–52 [DOI] [PMC free article] [PubMed] [Google Scholar]
- 11. Masuda M., Mochizuki N. (2010) Structural characteristics of BAR domain superfamily to sculpt the membrane. Semin. Cell Dev. Biol. 21, 391–398 [DOI] [PubMed] [Google Scholar]
- 12. Qualmann B., Koch D., Kessels M. M. (2011) Let's go bananas: revisiting the endocytic BAR code. EMBO J. 30, 3501–3515 [DOI] [PMC free article] [PubMed] [Google Scholar]
- 13. Rao Y., Haucke V. (2011) Membrane shaping by the Bin/amphiphysin/Rvs (BAR) domain protein superfamily. Cell. Mol. Life Sci. 68, 3983–3993 [DOI] [PMC free article] [PubMed] [Google Scholar]
- 14. Childress C., Lin Q., Yang W. (2006) Dimerization is required for SH3PX1 tyrosine phosphorylation in response to epidermal growth factor signaling and interaction with ACK2. Biochem. J. 394, 693–698 [DOI] [PMC free article] [PubMed] [Google Scholar]
- 15. Dislich B., Than M. E., Lichtenthaler S. F. (2011) Specific amino acids in the BAR domain allow homodimerization and prevent heterodimerization of sorting nexin 33. Biochem. J. 433, 75–83 [DOI] [PubMed] [Google Scholar]
- 16. Zhang J., Zhang X., Guo Y., Xu L., Pei D. (2009) Sorting nexin 33 induces mammalian cell micronucleated phenotype and actin polymerization by interacting with Wiskott-Aldrich syndrome protein. J. Biol. Chem. 284, 21659–21669 [DOI] [PMC free article] [PubMed] [Google Scholar]
- 17. Wang Q., Kaan H. Y., Hooda R. N., Goh S. L., Sondermann H. (2008) Structure and plasticity of endophilin and sorting nexin 9. Structure 16, 1574–1587 [DOI] [PubMed] [Google Scholar]
- 18. Haft C. R., de la Luz Sierra M., Barr V. A., Haft D. H., Taylor S. I. (1998) Identification of a family of sorting nexin molecules and characterization of their association with receptors. Mol. Cell. Biol. 18, 7278–7287 [DOI] [PMC free article] [PubMed] [Google Scholar]
- 19. van Weering J. R., Sessions R. B., Traer C. J., Kloer D. P., Bhatia V. K., Stamou D., Carlsson S. R., Hurley J. H., Cullen P. J. (2012) Molecular basis for SNX-BAR-mediated assembly of distinct endosomal sorting tubules. EMBO J. 31, 4466–4480 [DOI] [PMC free article] [PubMed] [Google Scholar]
- 20. Škalamera D., Ranall M. V., Wilson B. M., Leo P., Purdon A. S., Hyde C., Nourbakhsh E., Grimmond S. M., Barry S. C., Gabrielli B., Gonda T. J. (2011) A high-throughput platform for lentiviral overexpression screening of the human ORFeome. PLoS One 6, e20057. [DOI] [PMC free article] [PubMed] [Google Scholar]
- 21. Kovtun O., Mureev S., Jung W., Kubala M. H., Johnston W., Alexandrov K. (2011) Leishmania cell-free protein expression system. Methods 55, 58–64 [DOI] [PubMed] [Google Scholar]
- 22. Gambin Y., Schug A., Lemke E. A., Lavinder J. J., Ferreon A. C., Magliery T. J., Onuchic J. N., Deniz A. A. (2009) Direct single-molecule observation of a protein living in two opposed native structures. Proc. Natl. Acad. Sci. U.S.A. 106, 10153–10158 [DOI] [PMC free article] [PubMed] [Google Scholar]
- 23. Gambin Y., VanDelinder V., Ferreon A. C., Lemke E. A., Groisman A., Deniz A. A. (2011) Visualizing a one-way protein encounter complex by ultrafast single-molecule mixing. Nat. Methods 8, 239–241 [DOI] [PMC free article] [PubMed] [Google Scholar]
- 24. Guo Z., Johnston W., Kovtun O., Mureev S., Brocker C., Ungermann C., Alexandrov K. (2013) Subunit organization of in vitro reconstituted HOPS and CORVET multisubunits membrane tethering complexes. Plos One 8, e81534. [DOI] [PMC free article] [PubMed] [Google Scholar]
- 25. Mureev S., Kovtun O., Nguyen U. T., Alexandrov K. (2009) Species-independent translational leaders facilitate cell free expression. Nat. Biotechnol. 27, 747–752 [DOI] [PubMed] [Google Scholar]
- 26. Kovtun O., Mureev S., Johnston W., Alexandrov K. (2010) Towards the construction of expressed proteomes using a Leishmania tarentolae based cell-free expression system. PLoS One 5, e14388. [DOI] [PMC free article] [PubMed] [Google Scholar]
- 27. Kubala M. H., Kovtun O., Alexandrov K., Collins B. M. (2010) Structural and thermodynamic analysis of the GFP:GFP-nanobody complex. Protein Sci. 19, 2389–2401 [DOI] [PMC free article] [PubMed] [Google Scholar]
- 28. Eglen R. M., Reisine T., Roby P., Rouleau N., Illy C., Bosse R., Bielefeld M. (2008) The use of AlphaScreen technology in HTS: current status. Curr. Chem. Genomics 1, 2–10 [DOI] [PMC free article] [PubMed] [Google Scholar]
- 29. Taouji S., Dahan S., Bosse R., Chevet E. (2009) Current screens based on the AlphaScreen technology for deciphering cell signaling pathways. Curr. Genomics 10, 93–101 [DOI] [PMC free article] [PubMed] [Google Scholar]
- 30. Gambin Y., Ariotti N., McMahon K.-A., Bastiani M., Sierecki E., Kovtun O., Polinkovsky M., Magenau A., Jung W., Okano S., Zhou Y., Leneva N., Mureev S., Johnston W., Gaus K., Hancock J. F., Collins B. M., Alexandrov K., Parton R. G. (2013) Single molecule analysis reveals self-assembly and nanoscale segregation of two distinct cavin subcomplexes on caveolae. eLife 3, e01434. [DOI] [PMC free article] [PubMed] [Google Scholar]
- 31. Orte A., Clarke R., Klenerman D. (2010) Single-molecule two-color coincidence detection to probe biomolecular associations. Biochem. Soc. Trans. 38, 914–918 [DOI] [PubMed] [Google Scholar]
- 32. Li H., Zhou D., Browne H., Balasubramanian S., Klenerman D. (2004) Molecule by molecule direct and quantitative counting of antibody-protein complexes in solution. Anal. Chem. 76, 4446–4451 [DOI] [PubMed] [Google Scholar]
- 33. Alves D., Li H., Codrington R., Orte A., Ren X., Klenerman D., Balasubramanian S. (2008) Single-molecule analysis of human telomerase monomer. Nat. Chem. Biol. 4, 287–289 [DOI] [PubMed] [Google Scholar]
- 34. Li H., Ying L., Ren X., Balasubramanian S., Klenerman D. (2004) Fluorescence studies of single biomolecules. Biochem. Soc. Trans. 32, 753–756 [DOI] [PubMed] [Google Scholar]
- 35. Cremades N., Cohen Samuel I. A., Deas E., Abramov Andrey Y., Chen Allen Y., Orte A., Sandal M., Clarke Richard W., Dunne P., Aprile Francesco A., Bertoncini Carlos W., Wood Nicholas W., Knowles Tuomas P. J., Dobson Christopher M., Klenerman D. (2012) Direct observation of the interconversion of normal and toxic forms of α-Synuclein. Cell 149, 1048–1059 [DOI] [PMC free article] [PubMed] [Google Scholar]
- 36. Chang Bryan H., Gujral Taranjit S., Karp Ethan S., BuKhalid R., Grantcharova Viara P., MacBeath G. (2011) A systematic family-wide investigation reveals that about 30% of mammalian PDZ domains engage in PDZ-PDZ interactions. Chem. Biol. 18, 1143–1152 [DOI] [PMC free article] [PubMed] [Google Scholar]
- 37. Madono M., Sawasaki T., Morishita R., Endo Y. (2011) Wheat germ cell-free protein production system for post-genomic research. N. Biotechnol. 28, 211–217 [DOI] [PubMed] [Google Scholar]
- 38. Nagayoshi Y., Nakamura M., Matsuoka K., Ohtsuka T., Mori Y., Kono H., Aso T., Ideno N., Takahata S., Ryo A., Takeda H., Ito T., Oda Y., Endo Y., Sawasaki T., Tanaka M. (2014) Profiling of autoantibodies in sera of pancreatic cancer patients. Ann. Surg. Oncol. 21, 459–465 [DOI] [PubMed] [Google Scholar]
- 39. Matsuoka K., Komori H., Nose M., Endo Y., Sawasaki T. (2010) Simple screening method for autoantigen proteins using the N-terminal biotinylated protein library produced by wheat cell-free synthesis. J. Proteome Res. 9, 4264–4273 [DOI] [PMC free article] [PubMed] [Google Scholar]
- 40. Parks W. T., Frank D. B., Huff C., Renfrew Haft C., Martin J., Meng X., de Caestecker M. P., McNally J. G., Reddi A., Taylor S. I., Roberts A. B., Wang T., Lechleider R. J. (2001) Sorting Nexin 6, a novel SNX, interacts with the transforming growth factor-β family of receptor serine-threonine kinases. J. Biol. Chem. 276, 19332–19339 [DOI] [PubMed] [Google Scholar]
- 41. Dyve A. B., Bergan J., Utskarpen A., Sandvig K. (2009) Sorting nexin 8 regulates endosome-to-Golgi transport. Biochem. Biophys. Res. Commun. 390, 109–114 [DOI] [PubMed] [Google Scholar]
- 42. Harterink M., Port F., Lorenowicz M. J., McGough I. J., Silhankova M., Betist M. C., van Weering J. R., van Heesbeen R. G., Middelkoop T. C., Basler K., Cullen P. J., Korswagen H. C. (2011) A SNX3-dependent retromer pathway mediates retrograde transport of the Wnt sorting receptor Wntless and is required for Wnt secretion. Nat. Cell Biol. 13, 914–923 [DOI] [PMC free article] [PubMed] [Google Scholar]
- 43. Sierecki E., Giles N., Polinkovsky M., Moustaqil M., Alexandrov K., Gambin Y. (2013) A cell-free approach to accelerate the study of protein-protein interactions in vitro. Interface Focus 3, 10.1098/rsfs.2013.0018 [DOI] [PMC free article] [PubMed] [Google Scholar]
- 44. Haft C. R., de la Luz Sierra M., Bafford R., Lesniak M. A., Barr V. A., Taylor S. I. (2000) Human orthologs of yeast vacuolar protein sorting proteins Vps26, 29, and 35: assembly into multimeric complexes. Mol. Biol. Cell 11, 4105–4116 [DOI] [PMC free article] [PubMed] [Google Scholar]
- 45. Kurten R. C., Eddington A. D., Chowdhury P., Smith R. D., Davidson A. D., Shank B. B. (2001) Self-assembly and binding of a sorting nexin to sorting endosomes. J. Cell Sci. 114, 1743–1756 [DOI] [PubMed] [Google Scholar]
- 46. Rojas R., Kametaka S., Haft C. R., Bonifacino J. S. (2007) Interchangeable but essential functions of SNX1 and SNX2 in the association of retromer with endosomes and the trafficking of mannose 6-phosphate receptors. Mol. Cell. Biol. 27, 1112–1124 [DOI] [PMC free article] [PubMed] [Google Scholar]
- 47. Pylypenko O., Lundmark R., Rasmuson E., Carlsson S. R., Rak A. (2007) The PX-BAR membrane-remodeling unit of sorting nexin 9. EMBO J. 26, 4788–4800 [DOI] [PMC free article] [PubMed] [Google Scholar]
- 48. Shin N., Lee S., Ahn N., Kim S. A., Ahn S. G., YongPark Z., Chang S. (2007) Sorting nexin 9 interacts with dynamin 1 and N-WASP and coordinates synaptic vesicle endocytosis. J. Biol. Chem. 282, 28939–28950 [DOI] [PubMed] [Google Scholar]
Associated Data
This section collects any data citations, data availability statements, or supplementary materials included in this article.