

Abstract
Objective:
To evaluate the effects of corticosteroids on the lower extremity muscles in boys with Duchenne muscular dystrophy (DMD) using MRI and magnetic resonance spectroscopy (MRS).
Methods:
Transverse relaxation time (T2) and fat fraction were measured by MRI/MRS in lower extremity muscles of 15 boys with DMD (age 5.0–6.9 years) taking corticosteroids and 15 corticosteroid-naive boys. Subsequently, fat fraction was measured in a subset of these boys at 1 year. Finally, MRI/MRS data were collected from 16 corticosteroid-naive boys with DMD (age 5–8.9 years) at baseline, 3 months, and 6 months. Five boys were treated with corticosteroids after baseline and the remaining 11 served as corticosteroid-naive controls.
Results:
Cross-sectional comparisons demonstrated lower muscle T2 and less intramuscular (IM) fat deposition in boys with DMD on corticosteroids, suggesting reduced inflammation/damage and fat infiltration with treatment. Boys on corticosteroids demonstrated less increase in IM fat infiltration at 1 year. Finally, T2 by MRI/MRS detected effects of corticosteroids on leg muscles as early as 3 months after drug initiation.
Conclusions:
These results demonstrate the ability of MRI/MRS to detect therapeutic effects of corticosteroids in reducing inflammatory processes in skeletal muscles of boys with DMD. Our work highlights the potential of MRI/MRS as a biomarker in evaluating therapeutic interventions in DMD.
Duchenne muscular dystrophy (DMD) is a devastating form of muscular dystrophy caused by the absence of dystrophin, making muscle cell membranes fragile and susceptible to mechanical damage.1,2 Currently, there is no cure for the disease. Corticosteroids have been reported to slow disease progression in DMD.3–7 However, the mechanism by which corticosteroids preserve muscle function in DMD is not fully understood.
Among several proposed mechanisms, corticosteroids are thought to reduce inflammation in dystrophic muscles.8,9 MRI, in particular T2-weighted MRI, is sensitive to alterations in muscle chemistry and structure induced by processes like damage/inflammation and fat infiltration,10–17 and therefore may have the potential to detect the effects of corticosteroid treatment on dystrophic muscles. Magnetic resonance spectroscopy (MRS) allows quantification of chemical compounds and can separate lipid and water components, allowing a more targeted investigation of skeletal muscles in DMD.18–21
The overall goal of this study was to examine the ability of MRI/MRS to detect the effects of corticosteroids on skeletal muscles in boys with DMD. The specific aims of the study were to (1) perform a cross-sectional comparison between the lower extremity muscles of 5- to 6.9-year-old boys with DMD on corticosteroids and age-matched corticosteroid-naive boys, using both quantitative T2 measurements and 1H-MRS; (2) compare 1-year progression in intramuscular (IM) fat fraction in a subset of corticosteroid-treated and corticosteroid-naive boys; and (3) examine the effect of corticosteroid initiation on muscle T2 and fat fraction.
METHODS
Participants and study design
The data were collected as part of a multicenter study (Imaging DMD; http://imagingdmd.org/) conducted at University of Florida (UF), Oregon Health & Science University (OHSU), and Children's Hospital of Philadelphia (CHOP) between September 2011 and November 2013. Appendix e-1 on the Neurology® Web site at Neurology.org contains details of eligibility criteria as well as sources and methods of subject recruitment. To address aim 1, 15 boys with DMD (age 5–6.9 years) on corticosteroids and 15 age-matched corticosteroid-naive boys were studied. We first performed a careful characterization of the lower extremity muscles using a combination of MRI and MRS strategies, which included examination of T2 of the muscles and quantification of IM fat fraction. After MRI/MRS testing, the subjects participated in strength and functional testing. For aim 2, we measured 1-year progression in IM fat fraction in a subset of boys who remained corticosteroid-naive for 12 months, and an age-matched group of corticosteroid-treated boys. For aim 3, we collected MRI/MRS data from 16 boys with DMD (age 5–8.9 years) at baseline, 3 months, and 6 months. Five of these boys began treatment with corticosteroids after their baseline assessment while the remaining boys served as corticosteroid-naive controls. One subject in the corticosteroid treatment group did not complete the 6-month assessment because the family was unable to travel to the study site.
Standard protocol approvals, registrations, and patient consents.
The study was registered on clinicaltrials.gov (NCT01484678). The institutional review boards at UF, OHSU, and CHOP approved the study. A parent or guardian of the participants provided informed written consent and each subject provided written assent before participation.
MRI/MRS acquisition.
We advised all subjects to avoid any excessive physical activity beyond their normal activities for at least 3 days before magnetic resonance data collection. A detailed MRI/MRS characterization of the right lower extremity muscles was performed using 3T whole body MRI instruments (Philips [Amsterdam, the Netherlands] Achieva Quasar Dual 3T at UF, Siemens [Munich, Germany] Magnetom TIM Trio 3T at OHSU, and Siemens Magnetom Verio 3T at CHOP). We performed magnetic resonance scanning of the lower leg using an 8-channel sensitivity encoding volume receive-only knee coil (UF and CHOP) or a transmit-receive quadrature extremity coil (OHSU). We used a 2-channel FLEX surface coil (UF), a transmit-receive quadrature extremity coil (OHSU), or a body matrix array coil (CHOP) for the upper leg muscles. A previous study described the implemented MRI/MRS protocol in detail and established the reliability and reproducibility of the magnetic resonance protocols across all 3 centers.21 In addition, a description of the data acquisition and analysis procedures is provided in appendix e-1. Briefly, the following MRI/MRS measures were used to evaluate the muscles of the lower extremity of the subjects: (1) quantitative T2 values from multi–spin echo MRI and spectroscopic relaxometry; and (2) fat fraction using single-voxel 1H-MRS. We acquired T2-weighted spin echo images (4-8 axial slices, repetition time [TR] 3 seconds, 16 echo times [TEs] 20–320 ms, slice thickness 7 mm, slice gap 3.5 mm) in the lower leg and thigh. In addition, 2 sets of unsuppressed localized 1H-MRS scans were acquired. To measure the relative IM fat fraction, we acquired single-voxel stimulated echo acquisition mode (STEAM) spectra (TR 3 seconds, TE 108 ms, average of 64 spectra) in both the soleus (Sol) and vastus lateralis (VL) muscles. In addition, we used spectroscopic relaxometry sequences using 1H-MRS STEAM to quantify 1H2O T2 in the Sol (TR 9 seconds; 16 TEs 11–288 ms) and VL (TR 9 seconds; 4 TEs 11–252 ms).
Strength and functional testing.
We measured isometric peak torque of the knee extensors and ankle plantar flexors of the right leg using a Biodex dynamometer (Biodex Medical Systems, Inc., Shirley, NY). The peak torque, defined as the highest value obtained out of 5 trials, was used for analysis. After strength testing, the subjects performed 3 timed functional tests that included walking/running 10 meters (10-m walk/run), climbing 4 steps (stair-climbing), and rising from the floor (supine to stand). We performed each test 3 times and the fastest trial was used for analysis. Following the timed functional tests, the subjects participated in the 6-minute walk test (6MWT). The tester instructed subjects to walk as far as possible in 6 minutes and recorded the total distance covered. A detailed description of the strength and functional testing is provided in appendix e-1.
Statistical analysis.
For the cross-sectional comparisons in aim 1, we used nonparametric (Mann-Whitney U) tests to test for differences in demographic features, MRI/MRS measures, and strength and functional measures between corticosteroid-treated and corticosteroid-naive boys using IBM (Armonk, NY) SPSS Statistics 20 software. In aim 2, we calculated the absolute change in fat fraction over 1 year for 2 groups and used the Mann-Whitney U test to make comparisons across groups. In aim 3, we assessed the differences in MRI/MRS parameters at 3 and 6 months with respect to baseline between corticosteroid treatment and corticosteroid-naive groups using Mann-Whitney U test. The level of significance was set at p ≤ 0.05.
RESULTS
Cross-sectional and longitudinal comparisons between corticosteroid-treated and corticosteroid-naive boys.
Subject demographics.
Table e-1 shows baseline demographic data. The 2 groups were similar in age, weight, height, and body mass index at baseline.
MRI and MRS T2 measures.
Quantitative T2 MRI revealed lower T2 values in all the lower leg muscles studied (Sol, medial gastrocnemius [MG], peroneals [Per], tibialis anterior [TA], and tibialis posterior [TP]) in boys with DMD on corticosteroid treatment (figure 1A). Similarly, the mean T2 of thigh muscles (VL and biceps femoris long head) was lower in boys on a corticosteroid regimen, except in the gracilis (Gra) muscle (figure 1B). Spectroscopic 1H2O T2 values for the VL and Sol muscles were lower in boys on corticosteroid treatment compared to corticosteroid-naive boys (figure 2B).
Figure 1. Cross-sectional comparisons of MRI T2 between corticosteroid-treated and corticosteroid-naive boys with Duchenne muscular dystrophy.

Comparison of T2 by imaging in the lower leg muscles (A) and thigh muscles (B) of boys with Duchenne muscular dystrophy (DMD) on corticosteroid treatment (CS) and corticosteroid-naive boys (CS-naive). T2 values were lower in all the muscles examined in boys with DMD on corticosteroid therapy except for the gracilis (Gra) muscle. Values are represented as mean ± SEM; **p ≤ 0.01 and *p ≤ 0.05. BFLH = biceps femoris long head; MG = medial gastrocnemius; Per = peroneals; Sol = soleus; TA = tibialis anterior; TP = tibialis posterior; VL = vastus lateralis.
Figure 2. Cross-sectional comparisons of MRS T2 between corticosteroid-treated and corticosteroid-naive boys with Duchenne muscular dystrophy.

An example gradient echo image of the lower leg with voxel placement in the soleus (Sol) muscle is depicted with the corresponding spectra acquired during the spectroscopic relaxometry scan. (A) Cross-sectional comparisons of T2 by spectroscopy between corticosteroid-treated boys (CS) and corticosteroid-naive boys (CS-naive) with Duchenne muscular dystrophy. (B) T2 values for both the Sol and vastus lateralis (VL) muscles were lower in CS boys compared to CS-naive boys, indicating less damage in the muscles of boys on corticosteroid treatment. Values are represented as mean ± SEM; **p ≤ 0.01 and *p ≤ 0.05. MRS = magnetic resonance spectroscopy; TE = echo time.
Fat fraction.
The cross-sectional comparison showed lower fat fraction in both the VL and Sol muscles of boys on corticosteroid treatment compared to the muscles of corticosteroid-naive boys (figure 3B).
Figure 3. Cross-sectional and longitudinal comparisons of fat fraction between corticosteroid-treated and corticosteroid-naive boys with Duchenne muscular dystrophy.

(A) 1H–magnetic resonance spectroscopy spectrum from the soleus (Sol) muscle of a boy with Duchenne muscular dystrophy (DMD) depicts water and lipid peaks. (B) Cross-sectional comparisons of fat fraction in the Sol and vastus lateralis (VL) muscles between corticosteroid-treated (CS) and corticosteroid-naive boys (CS-naive) with DMD. (C) Longitudinal changes in fat fraction over 1 year in the Sol and VL muscles of boys in 2 groups. Values are represented as mean ± SEM; **p ≤ 0.01 and *p ≤ 0.05.
Over 1 year, corticosteroid-naive boys (n = 6, age 6.4 ± 0.1 years) had greater increases in fat fraction in both the VL and Sol muscles compared to boys on corticosteroid treatment (n = 9, age 6.2 ± 0.1 years, figure 3C).
Strength and functional tests.
Table 1 shows strength testing results, performance on timed functional tests, and the distance covered by subjects during the 6MWT for both study groups. Boys on corticosteroid treatment showed higher knee extensor muscle strength and better performance on the 10-meter walk, supine to stand, and stair-climbing tests compared to corticosteroid-naive boys. Ankle plantar flexor peak torque and the average distance covered in 6 minutes did not differ across the 2 groups (table 1).
Table 1.
Cross-sectional comparisons of strength and functional parameters between corticosteroid-treated and corticosteroid-naive boys with DMD

Impact of initiation of corticosteroid therapy in boys with DMD.
Within 3 months of treatment with corticosteroids, mean T2 values in treated boys (n = 5, age 6.7 ± 0.6 years) tended to decrease in the Sol, MG, Per, TA, and TP muscles. More importantly, at both 3 months and 6 months, comparisons between the absolute T2 changes in naive (n = 11, age 6.2 ± 0.3years) and treated boys with DMD showed a striking difference between the 2 groups (figure 4). Similarly, the change in MRS-T2 of the Sol muscle from baseline differed in corticosteroid-treated boys compared to corticosteroid-naive boys at 3 months (figure e-2A), with a pronounced decline in T2 in the corticosteroid-treated boys. Fat fraction of the Sol muscle did not differ between the 2 groups at either follow-up timepoint (figure e-2B).
Figure 4. Effects of corticosteroid initiation on MRI T2 of lower leg muscles in boys with Duchenne muscular dystrophy.
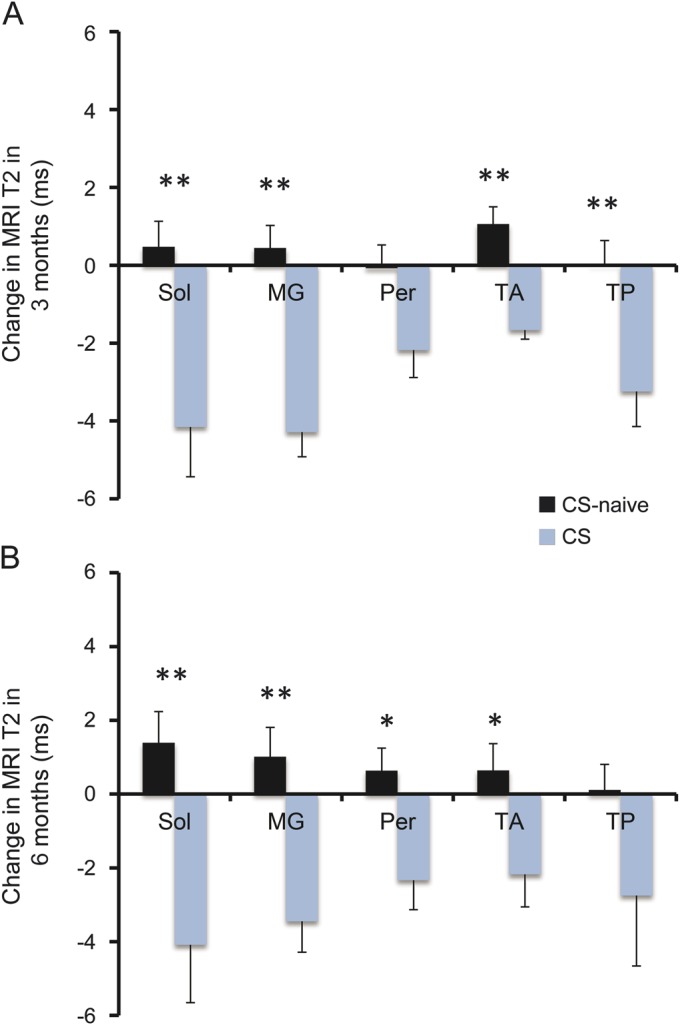
Comparison of absolute change in MRI T2 with respect to baseline in lower leg muscles of corticosteroid-treated boys with Duchenne muscular dystrophy (CS) and corticosteroid-naive boys (CS-naive) at 3 months (A) and 6 months (B). Values are represented as mean ± SEM; **p ≤ 0.01 and *p ≤ 0.05. MG = medial gastrocnemius; Per = peroneals; Sol = soleus; TA = tibialis anterior; TP = tibialis posterior.
DISCUSSION
This study demonstrated that MRI/MRS can monitor the effects of corticosteroids on the lower extremity muscles of young boys with DMD. Specifically, we found that (1) 5- to 6.9-year-old boys with DMD treated with corticosteroids had lower MRI/MRS T2 values and fat fraction in the lower extremity muscles than corticosteroid-naive boys; (2) boys on corticosteroid treatment demonstrated a slower rate of fat accumulation in the Sol and VL muscles compared to corticosteroid-naive boys; and (3) T2 by MRI and MRS decreased within 3 months of corticosteroid initiation.
MRI is an important noninvasive tool to study cardiac and skeletal muscle pathology in muscular dystrophy.22–28 Previous MRI studies have demonstrated that dystrophic muscles have higher T2 relaxation times,10,11,17 even in young boys with DMD.15 Elevated T2 in dystrophic muscles has been linked to both the presence of muscle damage/inflammation and fatty tissue infiltration.11–13,25 Since the presumed mode of action of corticosteroids involves the suppression of inflammation, we examined their effects on skeletal muscle T2, using both T2 mapping and 1H spectroscopic relaxometry. To our knowledge, there is only one previous study that used MRI techniques to study the effects of corticosteroids on skeletal muscles of boys with DMD. In that study, longitudinal assessments of T2 mapping were performed in the gluteal muscles of 5- to 15-year-old boys with DMD who started corticosteroid treatment.29 The authors reported variability in T2 response to treatment, but the study lacked a control group of boys who were corticosteroid-naive. Cross-sectionally mean T2 derived from MRI T2 mapping was lower in both thigh and lower leg muscles of boys on corticosteroid treatment in our study. Of the muscle groups studied, the Gra muscle was the only exception. Gra is known to be one of the most preserved muscles in DMD20,22,30 and hence might not reveal treatment response at such a young age. Likewise, MRS T2 was lower in the Sol and VL muscles of corticosteroid-treated boys. In addition, MRI/MRS measures detected the beneficial effects of corticosteroids on the skeletal muscles as early as 3 months after drug initiation. Collectively, these results support the proposed role of corticosteroids in reducing inflammatory processes in skeletal muscles of boys with DMD. More importantly, these findings emphasize the potential of MRI/MRS as a biomarker for the quantification of early and subtle muscle changes caused by the disease process and evaluation of therapeutic interventions in DMD.
Several studies have observed a progressive increase in IM fat content with disease progression and age in boys with DMD.20,23,24 Even though we only measured the fat fraction in 2 muscles (Sol and VL) using 1H spectroscopy, both muscles showed lower IM fat fractions in corticosteroid-treated boys with DMD compared to corticosteroid-naive boys. Most importantly, boys in the corticosteroid treatment group showed a blunted increase in fat fraction over 1 year compared to corticosteroid-naive boys (10% vs 30%–70%). These data provide the first evidence that corticosteroids not only suppress muscle inflammation in dystrophic muscles, but also slow the progressive replacement of lower extremity skeletal muscles by fatty tissue. We speculate that the reduction in fat fraction in corticosteroid-treated boys is secondary to the mitigation of inflammation at an earlier stage of the disease progression, as these boys were on a corticosteroid regimen for an average duration of ∼1.5 years. We should point out that no effects of treatment were observed on fat infiltration at 3 or 6 months after drug initiation. This is likely due to an insufficient duration of corticosteroid treatment to produce any immediate beneficial effects in muscles as measured by fat infiltration.
Both MRI and MRS showed positive effects of corticosteroids on skeletal muscles. However, 6MWT distance did not show a significant difference in cross-sectional comparisons between corticosteroid-treated and corticosteroid-naive boys. Although the 6MWT has been established as a clinically meaningful outcome measure in DMD,31 it is less sensitive in monitoring muscle response to disease progression in younger boys (<7 years old).31,32 The reduced sensitivity of the 6MWT in younger boys with DMD has been attributed to the fact that disease-related progressive loss of muscle strength and function might be overshadowed by normal growth and development.31,32 Performance on timed functional tests showed clear differences between corticosteroid-treated and corticosteroid-naive groups, suggesting that these tests may be more sensitive in young boys with DMD.
Peak torque of the knee extensors was higher in boys on corticosteroid treatment. In contrast, we did not detect a difference in the plantar-flexor peak torque, possibly due to the small group size. Previous investigations have shown longitudinal improvement in muscle strength over 6 months following initiation of corticosteroid treatment in boys with DMD, followed by stabilization of symptoms for up to 2–3 years.4,33
The therapeutic effects of corticosteroids in DMD are well-recognized. However, due to the risk of side effects and differences in physician practices, variations in corticosteroid use and age at initiation are common in this population. According to the Centers for Disease Control and Prevention care consideration guidelines, corticosteroid treatment should be started between the ages of 4 and 8 years once the child has reached the plateau phase in achievement of motor skills or demonstrates functional decline.3 In aim 1 of the study, boys began taking corticosteroids at the average age of ∼4 years, although the earliest was 2 years of age. Overall, the results suggested that early corticosteroid intervention helps to preserve muscle integrity in 5- to 6.9-year-old boys with DMD. However, these comparisons were not based on controlled (randomized) groupings nor did we control the participant's corticosteroid treatment regimen. Furthermore, we cannot ignore the potential side effects of corticosteroids, such as reduced immune resistance, decreased bone density, glucose resistance, and weight gain, when evaluating drug efficacy for long-term care.7 Future longitudinal studies in a larger cohort using different dosing regimens are required to more definitively investigate the effects of corticosteroid treatment on the muscles of young boys with DMD.
Overall, this study demonstrates the ability of MRI/MRS measures to monitor the therapeutic effects of corticosteroids on skeletal muscles in young boys with DMD. Both fat fraction and muscle T2 by MRI and MRS showed distinct differences in boys treated with corticosteroids vs corticosteroid-naive boys, with a more rapid accumulation of IM fat in corticosteroid-naive boys. Importantly, the effect of corticosteroid treatment was observed within 3 months after initiation as a decrease in muscle T2, consistent with the anti-inflammatory action of corticosteroids. We propose that MRI/MRS biomarkers are valuable tools that should be included to evaluate the effects of potential therapeutic interventions in muscular dystrophies, as well as in treatment strategies that target inflammation.
Supplementary Material
ACKNOWLEDGMENT
A portion of this work was performed at the National High Magnetic Field Laboratory's Advanced Magnetic Resonance Imaging and Spectroscopy Facility in the McKnight Brain Institute, which is partially supported by the National Science Foundation.
GLOSSARY
- 6MWT
6-minute walk test
- CHOP
Children's Hospital of Philadelphia
- DMD
Duchenne muscular dystrophy
- Gra
gracilis
- MG
medial gastrocnemius
- MRS
magnetic resonance spectroscopy
- OHSU
Oregon Health & Science University
- Per
peroneals
- Sol
soleus
- STEAM
stimulated echo acquisition mode
- TA
tibialis anterior
- TP
tibialis posterior
- TE
echo time
- TR
repetition time
- UF
University of Florida
- VL
vastus lateralis
Footnotes
Editorial, page 956
Supplemental data at Neurology.org
AUTHOR CONTRIBUTIONS
Guarantors of integrity of the study: I.A., R.J.W., S.C.F., and K.V. Drafting/revising the manuscript for content, including medical writing for content: all authors. Study concept or design: all authors. Analysis or interpretation of data: all authors. Manuscript final version approval: all authors. Acquisition of data: S.C.F., W.D.R., D.-J.W., and G.A.W. Statistical analysis: I.A. and M.J.D. Study supervision or coordination: C.R.S. and K.V. Obtaining funding: S.C.F., R.S.F., D.J.L., C.R.S., M.J.D., B.J.B., E.L.F., B.S.R., D.-J.W., W.D.R., G.A.W., H.L.S., and K.V.
STUDY FUNDING
Supported by NIAMS/NINDS R01AR05697 and R01AR065943.
DISCLOSURE
I. Arpan, R. Willcocks, and S. Forbes report no disclosures relevant to the manuscript. R. Finkel’s institution received a grant from PTC Therapeutics for a study of ataluren in DMD for which he is the primary investigator (some of the subjects in that study also participated in the current study, but no financial conflict is identified). D. Lott, W. Rooney, W. Triplett, C. Senesac, M. Daniels, B. Byrne, E. Finanger, B. Russman, and D. Wang report no disclosures relevant to the manuscript. G. Tennekoon reports that PTC Therapeutics provides funds for an ongoing phase 3 study in his institution. G. Walter, H. Sweeney, and K. Vandenborne report no disclosures relevant to the manuscript. Go to Neurology.org for full disclosures.
REFERENCES
- 1.Hoffman EP, Brown RH, Jr, Kunkel LM. Dystrophin: the protein product of the Duchenne muscular dystrophy locus. Cell 1987;51:919–928 [DOI] [PubMed] [Google Scholar]
- 2.Petrof BJ, Shrager JB, Stedman HH, Kelly AM, Sweeney HL. Dystrophin protects the sarcolemma from stresses developed during muscle contraction. Proc Natl Acad Sci USA 1993;90:3710–3714 [DOI] [PMC free article] [PubMed] [Google Scholar]
- 3.Bushby K, Finkel R, Birnkrant DJ, et al. Diagnosis and management of Duchenne muscular dystrophy, part 1: diagnosis, and pharmacological and psychosocial management. Lancet Neurol 2010;9:77–93 [DOI] [PubMed] [Google Scholar]
- 4.Mendell JR, Moxley RT, Griggs RC, et al. Randomized, double-blind six-month trial of prednisone in Duchenne’s muscular dystrophy. N Engl J Med 1989;320:1592–1597 [DOI] [PubMed] [Google Scholar]
- 5.Griggs RC, Moxley RT, III, Mendell JR, et al. Prednisone in Duchenne dystrophy: a randomized, controlled trial defining the time course and dose response: Clinical Investigation of Duchenne Dystrophy Group. Arch Neurol 1991;48:383–388 [DOI] [PubMed] [Google Scholar]
- 6.Angelini C, Pegoraro E, Turella E, Intino MT, Pini A, Costa C. Deflazacort in Duchenne dystrophy: study of long-term effect. Muscle Nerve 1994;17:386–391 [DOI] [PubMed] [Google Scholar]
- 7.Manzur AY, Kuntzer T, Pike M, Swan A. Glucocorticoid corticosteroids for Duchenne muscular dystrophy. Cochrane Database Syst Rev 2008;1:CD003725. [DOI] [PubMed] [Google Scholar]
- 8.Kissel JT, Lynn DJ, Rammohan KW, et al. Mononuclear cell analysis of muscle biopsies in prednisone- and azathioprine-treated Duchenne muscular dystrophy. Neurology 1993;43:532–536 [DOI] [PubMed] [Google Scholar]
- 9.Guerron AD, Rawat R, Sali A, et al. Functional and molecular effects of arginine butyrate and prednisone on muscle and heart in the mdx mouse model of Duchenne muscular dystrophy. PLoS One 2010;5:e11220. [DOI] [PMC free article] [PubMed] [Google Scholar]
- 10.Phoenix J, Betal D, Roberts N, Helliwell TR, Edwards RHT. Objective quantification of muscle and fat in human dystrophic muscle by magnetic resonance image analysis. Muscle Nerve 1996;19:302–310 [DOI] [PubMed] [Google Scholar]
- 11.Huang Y, Majumdar S, Genant HK, et al. Quantitative MR relaxometry study of muscle composition and function in Duchenne muscular dystrophy. J Magn Reson Imaging 1994;4:59–64 [DOI] [PubMed] [Google Scholar]
- 12.Maillard SM, Jones R, Owens C, et al. Quantitative assessment of MRI T2 relaxation time of thigh muscles in juvenile dermatomyositis. Rheumatology 2004;43:603–608 [DOI] [PubMed] [Google Scholar]
- 13.Mathur S, Vohra RS, Germain SA, et al. Changes in muscle T2 and tissue damage after downhill running in mdx mice. Muscle Nerve 2011;43:878–886 [DOI] [PMC free article] [PubMed] [Google Scholar]
- 14.Fischmann A, Hafner P, Fasler S, et al. Quantitative MRI can detect subclinical disease progression in muscular dystrophy. J Neurol 2012;259:1648–1654 [DOI] [PubMed] [Google Scholar]
- 15.Arpan I, Forbes SC, Lott DJ, et al. T2 mapping provides multiple approaches for the characterization of muscle involvement in neuromuscular diseases: a cross-sectional study of lower leg muscles in 5–15-year-old boys with Duchenne muscular dystrophy. NMR Biomed 2013;26:320–328 [DOI] [PMC free article] [PubMed] [Google Scholar]
- 16.Willcocks RJ, Arpan IA, Forbes SC, et al. Longitudinal measurements of MRI-T2 in boys with Duchenne muscular dystrophy: effects of age and disease progression. Neuromuscul Disord 2014;24:393–401 [DOI] [PMC free article] [PubMed] [Google Scholar]
- 17.Kim HK, Laor T, Horn PS, Racadio JM, Wong B, Dardzinski BJ. T2 mapping in Duchenne muscular dystrophy: distribution of disease activity and correlation with clinical assessments. Radiology 2010;255:899–908 [DOI] [PubMed] [Google Scholar]
- 18.Slopis JM, Jackson EF, Narayana PA, Papasozomenos SC, Butler IJ. Proton magnetic resonance imaging and spectroscopic studies of the pathogenesis and treatment of juvenile dermatomyositis. J Child Neurol 1993;8:242–249 [DOI] [PubMed] [Google Scholar]
- 19.Boesch C, Machann J, Vermathen P, Schick F. Role of proton MR for the study of muscle lipid metabolism. NMR Biomed 2006;19:968–988 [DOI] [PubMed] [Google Scholar]
- 20.Torriani M, Townsend E, Thomas BJ, Bredella MA, Ghomi RH, Tseng BS. Lower leg muscle involvement in Duchenne muscular dystrophy: an MR imaging and spectroscopy study. Skeletal Radiol 2012;41:437–445 [DOI] [PMC free article] [PubMed] [Google Scholar]
- 21.Forbes SC, Walter GA, Rooney WD, et al. Skeletal muscles of ambulant children with Duchenne muscular dystrophy: validation of multicenter study of evaluation with MR imaging and MR spectroscopy. Radiology 2013;269:198–207 [DOI] [PMC free article] [PubMed] [Google Scholar]
- 22.Matsumura K, Nakano I, Fukuda N, Ikehira H, Tateno Y, Aoki Y. Proton spin-lattice relaxation time of Duchenne dystrophy skeletal muscle by magnetic resonance imaging. Muscle Nerve 1988;11:97–102 [DOI] [PubMed] [Google Scholar]
- 23.Marden FA, Connolly AM, Siegel MJ, Rubin DA. Compositional analysis of muscle in boys with Duchenne muscular dystrophy using MR imaging. Skeletal Radiol 2005;34:140–148 [DOI] [PubMed] [Google Scholar]
- 24.Wren TA, Bluml S, Tseng-Ong L, Gilsanz V. Three-point technique of fat quantification of muscle tissue as a marker of disease progression in Duchenne muscular dystrophy: preliminary study. AJR Am J Roentgenol 2008;190:W8–W12 [DOI] [PubMed] [Google Scholar]
- 25.Kan HE, Scheenen TW, Wohlgemuth M, et al. Quantitative MR imaging of individual muscle involvement in facioscapulohumeral muscular dystrophy. Neuromuscul Disord 2009;19:357–362 [DOI] [PubMed] [Google Scholar]
- 26.Wansapura JP, Hor KN, Mazur W, et al. Left ventricular T2 distribution in Duchenne muscular dystrophy. J Cardiovasc Magn Reson 2010;12:14. [DOI] [PMC free article] [PubMed] [Google Scholar]
- 27.Hollingsworth KG, Garrood P, Eagle M, Bushby K, Straub V. Magnetic resonance imaging in Duchenne muscular dystrophy: longitudinal assessment of natural history over 18 months. Muscle Nerve 2013;48:586–588 [DOI] [PubMed] [Google Scholar]
- 28.Willis TA, Hollingsworth KG, Coombs A, et al. Quantitative muscle MRI as an assessment tool for monitoring disease progression in LGMD2I: a multicentre longitudinal study. PLoS One 2013;8:e70993. [DOI] [PMC free article] [PubMed] [Google Scholar]
- 29.Kim HK, Laor T, Horn PS, Wong B. Quantitative assessment of the T2 relaxation time of the Gluteus muscles in children with Duchenne muscular dystrophy: a Comparative study before and after Steroid treatment. Korean J Radiol 2010;11:304–311 [DOI] [PMC free article] [PubMed] [Google Scholar]
- 30.Akima H, Lott D, Senesac C, et al. Relationships of thigh muscle contractile and non-contractile tissue with function, strength, and age in boys with Duchenne muscular dystrophy. Neuromuscul Disord 2012;22:16–25 [DOI] [PMC free article] [PubMed] [Google Scholar]
- 31.McDonald CM, Henricson EK, Han JJ, et al. The 6-minute walk test in Duchenne/Becker muscular dystrophy: longitudinal observations. Muscle Nerve 2010;42:966–974 [DOI] [PubMed] [Google Scholar]
- 32.Mazzone E, Vasco G, Sormani MP, et al. Functional changes in Duchenne muscular dystrophy: a 12-month longitudinal cohort study. Neurology 2011;77:250–256 [DOI] [PubMed] [Google Scholar]
- 33.Fenichel GM, Florence JM, Pestronk A, et al. Long-term benefit from prednisone therapy in Duchenne muscular dystrophy. Neurology 1991;41:1874–1877 [DOI] [PubMed] [Google Scholar]
Associated Data
This section collects any data citations, data availability statements, or supplementary materials included in this article.