Abstract
We investigate the osmotic equilibrium between a bulk polyethylene glycol (PEG) solution and DNA tightly packed in a spherical capsid. We base our analysis on the equations of thermodynamic equilibrium in terms of osmotic pressure. The equality between external osmotic pressure of PEG and osmotic pressure of tightly packed DNA gives us the DNA encapsidation curves. In this way we directly connect the wealth of existing osmotic pressure data for DNA in the bulk with the DNA encapsidation curves within small viral capsids. Specific calculations are made for a monovalent salt, Na+-DNA and a divalent salt, Mn2+-DNA that have quite different DNA encapsidation behaviors. The main conclusion of our work is that bending energy of DNA is of minor importance regarding the encapsidated DNA length, but has a non-negligible influence on the density distribution of DNA within the capsid.
1 Introduction
Recent studies of packing of viral DNA in bacteriophages such as T7 [1], epsilon15 [2] and ϕ29 [3], are starting to provide a very detailed picture of the genome organization inside bacteriophage capsids. At elevated densities DNA appears to be wrapped into a coaxial inverse spool, with pronounced ordering and high density close to the capsid wall that both appear to decay towards the center of the capsid. This packing allows DNA to act like a coiled osmotic spring piled up against the inner surface of the capsid [4] ready to release its chemical and mechanical energy through the portal complex on docking onto a bacterial wall [5].
The energetics of packaging and ejection of DNA in bacteriophages has recently received a lot of attention from the biophysical point of view [6–13]. The Odijk-Gelbart inverse spool model based on the idea of decomposition of the DNA chemical potential within the viral capsid into an interaction term and a curvature term was shown to describe the genome ejection reasonably well [14, 15]. Apart from the simulations of the genome packing within the capsid [16,17], all theoretical approaches are based on certain assumptions regarding the form of the curvature energy of the DNA forced to reside within the confines of the capsid, as well as the interactions among the highly charged and hydrated DNA segments packed at high densities within the capsid. Simulations of course rely on other sets of assumptions that we will not address in what follows.
Elastic curvature energy appears to be the lesser of the two unknowns alluded to above, though some very recent work might point to the contrary [18]. It is proportional to the square of local DNA curvature and in fact follows from the Euler-Kirchhoff model of an elastic filament. Though this model contains some subtle features due to the strong interhelical forces between the segments of the molecule [19], it nevertheless appears to be a consistent description of DNA [20] on mesoscopic scales [18]. The parameters of the Euler-Kirchhoffian model of DNA, such as its persistence length, are well established and have been measured by a variety of methods with satisfactory consensus among the results [21].
The interaction energy enters the inverse spool model rather differently. It is measured in osmotic stress experiments directly [22] and can be deconvoluted into a longer ranged electrostatic contribution [23] and a shorter-ranged hydration component [24]. Both of them have been quantified in terms of magnitudes and decay lengths [25]. The experimental variable is thus the osmotic pressure in DNA arrays in the bulk. However, the way the inverse spool model has been formulated, it is not the osmotic pressure that enters the chemical equilibrium equations for the DNA confined within the capsid, but it is rather its chemical potential for which various expressions are used: some based entirely on theoretical polyelectrolyte models [26,6,7] and others based on semi-empirical chemical potential expressions [9,10,12,13].
Of course there is a standard thermodynamic relation between the osmotic pressure, p, at DNA density ρ, and the corresponding chemical potential μ, i.e. , the deconvolution of which however requires knowledge of the osmotic pressure for all densities. Experimentally and necessarily only a limited regime of DNA densities has been available for osmotic pressure studies [22]. The semi-empirical chemical potential expressions should thus be considered at best as very rough estimates. One could of course live with that, but we suggest it might be more appropriate to reformulate the entire Odijk-Gelbart inverse spool model in terms of DNA osmotic pressure as opposed to its chemical potential. One would thus be able to use directly, without deconvoluting, the wealth of osmotic pressure data measured over the years [27–29]. The conceptual framework of the inverse spool model would thus become directly related to the conceptual framework of the osmotic stress experiments, which we believe is a rather important and necessary development.
In what follows we will present a polymer nematic droplet model for the DNA packing within a spherical viral capsid which is just a variant of the inverse spool model that treats the DNA subphase within a continuum, mesoscopic framework. However, this is not the most important facet of this contribution. Indeed, we will formulate this model in such a way that the interaction osmotic pressure as measured in the osmotic stress experiments, will feature directly in the basic equations of the chemical equilibrium of DNA confined to a spherical capsid. We will then assume an ansatz for the DNA packing geometry and solve the equilibrium equations in terms of the measured osmotic pressure. This will allow us to deconvolute the osmotic stress experiments for a variety of ionic conditions into the packing fraction of the genome as a function of external osmotic pressure, also referred to as the DNA encapsidation curve. We will show how peculiarities of the DNA osmotic pressure in the bulk with mono (Na+-) and polyvalent (Mn2+-) counterions transpire in the encapsidation curves. Our approach will also allow us to assess the relative importance of bending vs. osmotic energies in the viral packing of DNA.
2 Polymer nematic droplet model
We assume that the viral genome is in osmotic equilibrium with an external PEG solution of known osmotic pressure and known activity of the salt. The viral capsid is assumed to be permeable to small salt ions but is impermeable to PEG. The presence of the PEG gradient across the boundary of the viral capsid creates a pressure gradient that would in general tend to change the density of the solution within the capsid and put the capsid itself under mechanical stress. In what follows we shall assume that this effect is small and will not consider it any further.
According to Lepault et al. [30] the packing of DNA within bacteriophages seems to be governed by the tendency of DNA to form local alignments (nematic liquid crystals) whose orientational order is constrained by the bacteriophage capsid. This constrained nematic crystallization within the bacteriophage capsid suggests to us to treat the viral genome packing in the framework of the liquid crystalline nanodroplet model. We thus formulate a local thermodynamic mesoscopic theory based on the director field and the density field of the polymer just as was done in the context of DNA toroidal aggregates [31].
We assume that the polymer shows local nematic order and that the corresponding deformation energy density is given by the Frank-Oseen ansatz [32,33] as
| (1) |
just as in the case of bulk DNA nematic liquid crystals [25]. The bending elastic modulus in the case of a semiflexible polymer liquid crystal has the form
| (2) |
where Kc = kBT ℒP is the intrinsic elastic modulus of the polymer with ℒP its persistence length. ρ(2) is the 2D density of the polymers perpendicular to the director, D is the average axial separation between the polymers and V (r) is the interaction potential [25]. The other two terms in the elastic free energy are assumed to be negligible. The splay term, proportional to K1, is small because the splay modulus in nematic polymers is renormalized due to the coupling between local polymer density and local nematic director, in such a way to penalize any appreciable splay deformation [34]. Also the cylindrical spool ansatz that we use below automatically satisfied the condition ∇ · n = 0. The twist term in equation (1), proportional to K2, is small on the length scale of a viral capsid [25]. In this work of the three terms in the Frank-Oseen elastic energy only the bending term will be treated as significant.
Inside the liquid crystalline (LC) drop, thus inside the viral capsid, the connection between the 3D monomer density ρ and ρ(2) is given by ρ = (ρ(2)/Lbp) × (L/Lbp). In other words: the density is the number of phosphates L/Lbp, where Lbp is the phosphate-phosphate separation along the DNA and L is its total length, times one over volume per single phosphate group, which is ρ(2)/Lbp. The 3D density represents the number of base pairs per volume whereas the 2D density represents the number of DNA strands per unit area normal to the director. Incidentally ρ(2) is also the density of phosphates in a nematic phase which can be measured experimentally [25]. Obviously the elastic constant in equation (2) entering this model free energy has a term that is linear in the polymer density, as well as a term, K0(ρ) that is in general non-linear and its specific form is unknown. In the range of densities inside viral capsids this term is much smaller then the first one (see Section II. of [25]) and remains only a small perturbation. The deformation free energy can be thus written to the lowest order as
| (3) |
Here we decomposed the deformation free energy into a product of a density-dependent elastic modulus K (ρ) and the part that depends only on the director field, g(ni, ∂lnk). The density as well as the director field are by assumption both position dependent, ρ = ρ(r) and n = n(r). Assuming now that the encapsidated DNA is in chemical equilibrium with the outside world, so that it can be partitioned partly inside and partly outside the capsid, the total free energy of thus encapsidated DNA can be decomposed as
| (4) |
where the first term represents the part of the free energy that depends only on the density and thus describes bulk DNA at density ρ, while μ is the (constant) chemical potential associated with the equilibrium between the inside and the outside compartments, depending on the osmotic pressure in the external compartment. The index 0 will from now on be used to stand for the bulk properties of DNA that is not enclosed and thus elastically deformed inside a capsid.
The thermodynamic equilibrium conditions are obtained from the Euler-Lagrange (EL) equations that can be derived in the standard form [33,32]
| (5) |
and
| (6) |
where we have taken into account the fact that n is a unit vector. λ is the Lagrange multiplier associated with the constraint n · n = 1. The derivatives in the last equation can be evaluated straightforwardly (see [32]). The equations (5) and (6) are the explicit equilibrium conditions that determine the director and the density equilibrium profiles of the DNA nematic droplet inside the viral capsid: ρ(r) and n(r).We will not venture to solve these equations directly —they are very complex non-linear differential equations— but will rely rather on the semi-inverse method and assume an ansatz for the director field corresponding to an appropriate packing geometry.
What we would first like to do first is to formulate the equations of chemical equilibrium of DNA in such a way that they would contain DNA osmotic pressure directly rather then its chemical potential. For further reference let us first introduce the chemical potential of an undeformed bulk DNA nematic LC at density ρ that can be written as . In local thermodynamics [35] this would be the local chemical potential of the sample at local density ρ(r). To this chemical potential there corresponds the osmotic pressure p0 that can be derived from the thermodynamic identity dp0= ρ dμ0 valid for the bulk. The osmotic pressure p0(ρ) is what is measured in the osmotic stress experiments [22]. Futher manipulation of the mechanical equilibrium conditions (5) and (6), by following directly the standard approach [33,32], allows us to write them in the form of a first integral
| (7) |
where p is the external osmotic pressure. The details of the derivation are relegated to the Appendix. Note here that this condition can be derived exactly for a non-uniform polymer nematic, i.e. n = n(r) as well as ρ = ρ(r), and thus represents an extension of the standard result [33,32] valid for a uniform nematic, ρ = const. The only assumption needed while deriving the above result is that the elastic constant K3 is linear in density (see App. A). The first integral of the EL equations in general does not exist in this simple form for non-linear dependence of elastic constants on the density field.
Equation (7) simply states that for a deformed polymer nanodrop the total osmotic pressure p is composed of an interaction contribution to the osmotic pressure, p0(ρ), that can be measured separately in an undeformed nematic DNA phase as, e.g., in the osmotic stress experiments [22], and an elastic stress contribution to the total osmotic pressure, which is simply equal to the elastic free-energy density. The situation here is quite analogous to the first integral of the Poisson-Boltzmann equation in the theory of electrostatic interactions in colloids [36]. Within this analogy the first term of equation (7) would correspond to van’t Hoff expression for the osmotic pressure of the ions and the second one to the electrostatic Maxwell stress tensor.
Simply stated this relation equates the total osmotic pressure inside the capsid, composed of the bulk and bending contributions, to the external osmotic pressure. In extenso, taking into account everything said previously, we remain with
| (8) |
The equality between the internal and external osmotic pressures follows from simple thermodynamic arguments since the water molecules can exchange between the two compartments. The mechanical-chemical equilibrium of DNA within and outside the enclosing capsid is thus reduced to the constancy of osmotic pressure.
3 Equilibrium director profile
Instead of solving the EL equations directly for the spatial director and density profiles, we will rather assume a certain nematic director profile and deduce the corresponding density profile. In an inverse spool DNA is packed with cylindrical symmetry [37]. This Odijk-Gelbart inverse spool model has already been used quite successfully in the same context [6–13]. The assumption of cylindrical symmetry is reasonable both on theoretical as well as experimental grounds: the splay elastic energy in nematic polymers is large because of the coupling between nematic director and local density changes [34]. Thus in equilibrium any configuration with pronounced splay will be penalized. Also, experimental studies of DNA configuration inside viral capsids show configurations with cylindrical symmetry [1–3].
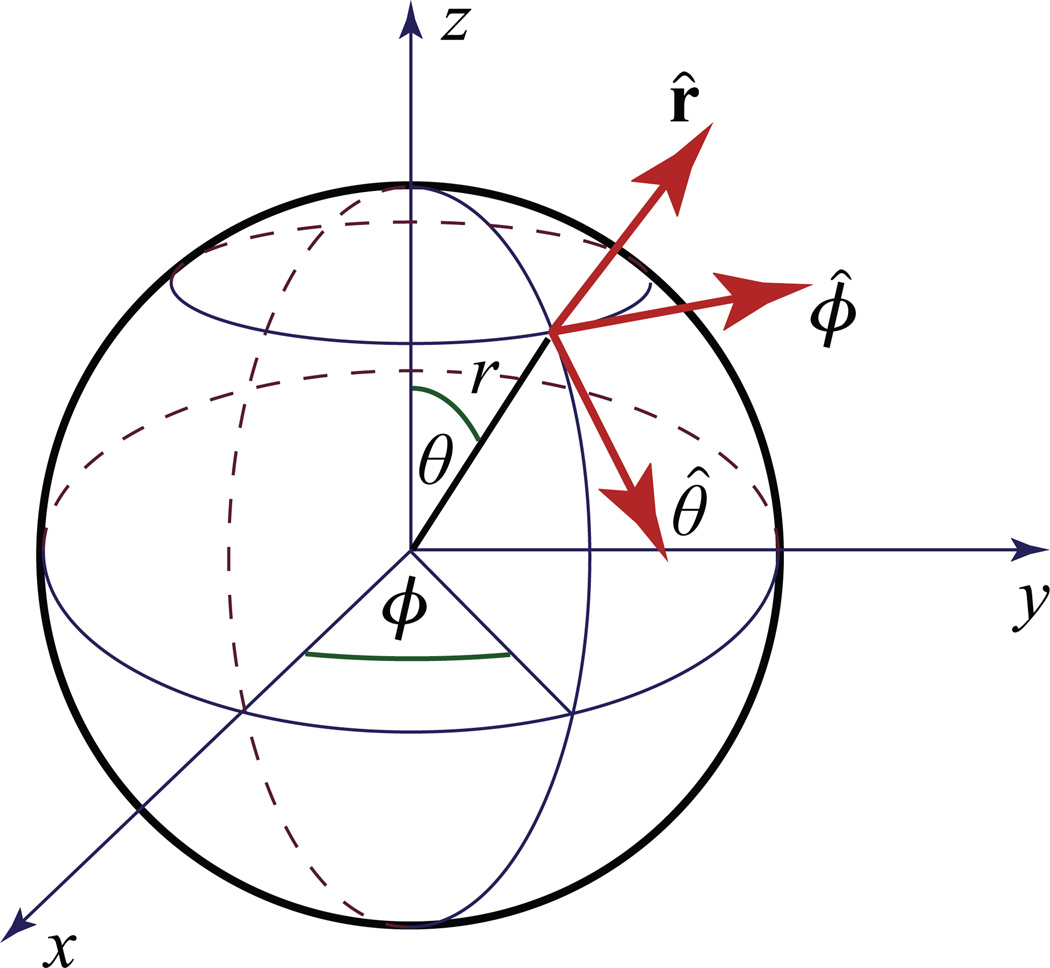
In the case of the director configuration with cylindrical symmetry one remains with only an equatorial component with respect to the z axis, see Figure 1
| (9) |
Fig. 1.
Definition of unit radial r̂, meridional/zenith θ̂ and azimuthal/zonal ϕ̂ director vectors in spherical coordinates.
For this director spatial profile we get
| (10) |
The mechanical equilibrium condition (8) is now of the form
| (11) |
To this equilibrium condition we have to add the constraint on the length of DNA inside the capsid, L (p). This is defined as
| (12) |
Above we have acknowledged that the DNA density within the capsid has the form ρ(r) = ρ(r, θ) due to cylindrical symmetry. The mechanical equilibrium condition (11) has a zero-radius limit viz.
| (13) |
The curvature stress obviously depletes the core (r → 0) of the DNA liquid crystalline nano-drop within the capsid. This is the physical origin of the Odijk-Gelbart inverse spool. It emerges naturally from the formalism adopted in this paper.
4 Osmotic encapsidation of DNA
Let us now discuss the osmotic pressure curves or equivalently the bulk equation of state of DNA: p0(ρ) [23]. The osmotic pressure is usually measured in nematic hexagonal or line hexatic arrays via the osmotic stress method as a function of the interaxial spacing D, and is usually referred to as the equation of state of DNA. This equation of state has been investigated very thoroughly in monovalent (NaCl) [28] and divalent (MnCl2) [29] salt environments and a wealth of osmotic pressure data in the bulk has been assembled. In everything that follows we always assume that DNA is locally hexagonally packed [27].
The osmotic encapsidation equation, meaning the dependence of the amount of encapsidated DNA as a function of external osmotic pressure, for cylindrical symmetry has been obtained in the form (11) together with the corresponding total amount of DNA within the capsid. We solve these equations numerically by taking the measured osmotic stress data, p0(ρ), and convert them into the length of encapsidated DNA. This can also be easily transformed into encapsidated fraction of the entire viral genome as a function of the applied total osmotic pressure, p. As instructive examples we take the cases of monovalent NaCl and divalent MnCl2 salt that have vastly different behaviors in the bulk [28,29]. We consider the bacteriophage capsids of radii 10 and 30 nm and first analyze osmotic stress data for a monovalent salt with Na+ as the counterion and then continue to the divalent Mn2+ as the counterion.
4.1 NaCl salt
To solve equation (11), we discretize r and θ coordinates in Nr and Nθ points. This transforms equation (11) into Nr × Nθ nonlinear algebraic equations, one for each (r, θ) point. The normalization condition in equation (12) becomes an additional algebraic equation coupling the Nr × Nθ equations together. In total, this yields Nr × Nθ+1 equations with the same number of unknowns (Nr × Nθ values of density and the unknown value of L (p)). We solve this system of equations numerically [38]. Typically, Nr ~ 100 and Nθ ~ 20 are needed to obtain convergence of the total length of encapsidated DNA to four significant digits.
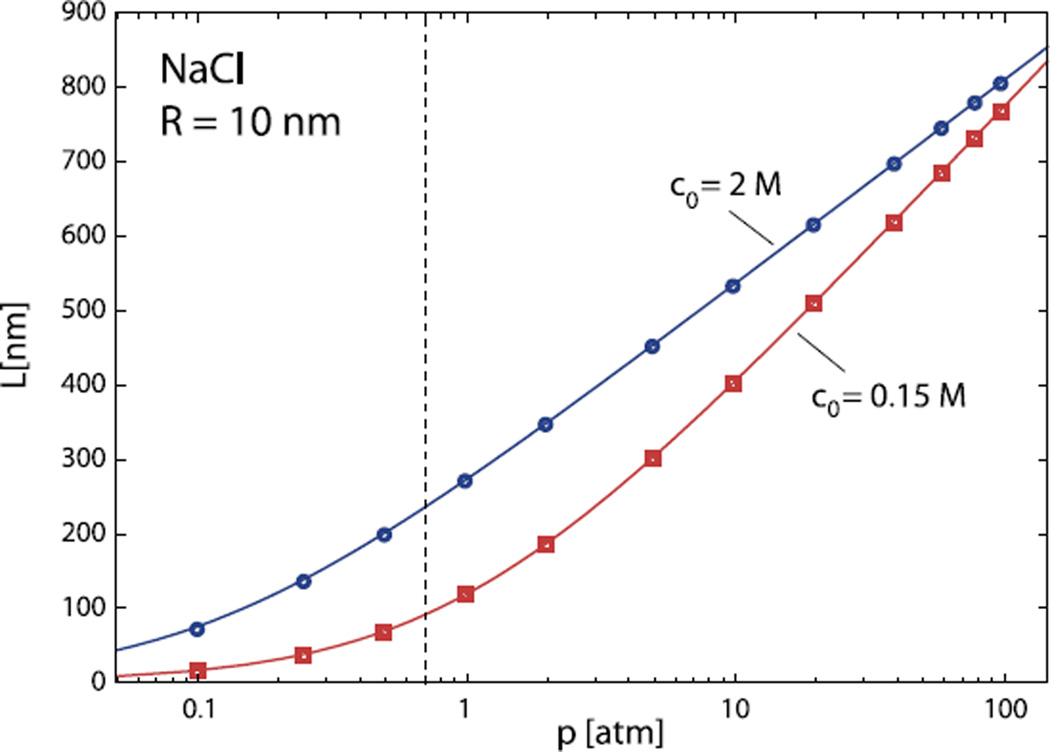
We first concentrate on the dependence of encapsidated DNA length on external osmotic pressure, p. The results for a capsid of radius R = 10 nm in two different concentrations of NaCl salt are shown in Figure 2. The values obtained by solving equation (11) are denoted by symbols. The full lines were obtained by neglecting completely the DNA bending energy contribution, i.e. by setting ρ(r, θ) = ρ0 from
| (14) |
and evaluating the encapsidated length as
| (15) |
Fig. 2.
The length of the encapsidated DNA as a function of the osmotic pressure in the solutions containing 0.15 M (squares) and 2 M of NaCl (diamonds). The symbols denote numerical results obtained by solving equation (11). Full lines are predictions of equation (15). The capsid radius in these calculations is R = 10 nm. The region of bulk osmotic pressures left from the vertical dashed line is not determined in the osmotic stress experiments and was obtained by extrapolating the existing results in the way indicated in reference [28]. The relative error in L changes with pressure and depends on the relative errors of osmotic pressure and DNA density measurements in the bulk. It is smallest at high pressures (typically below 7%).
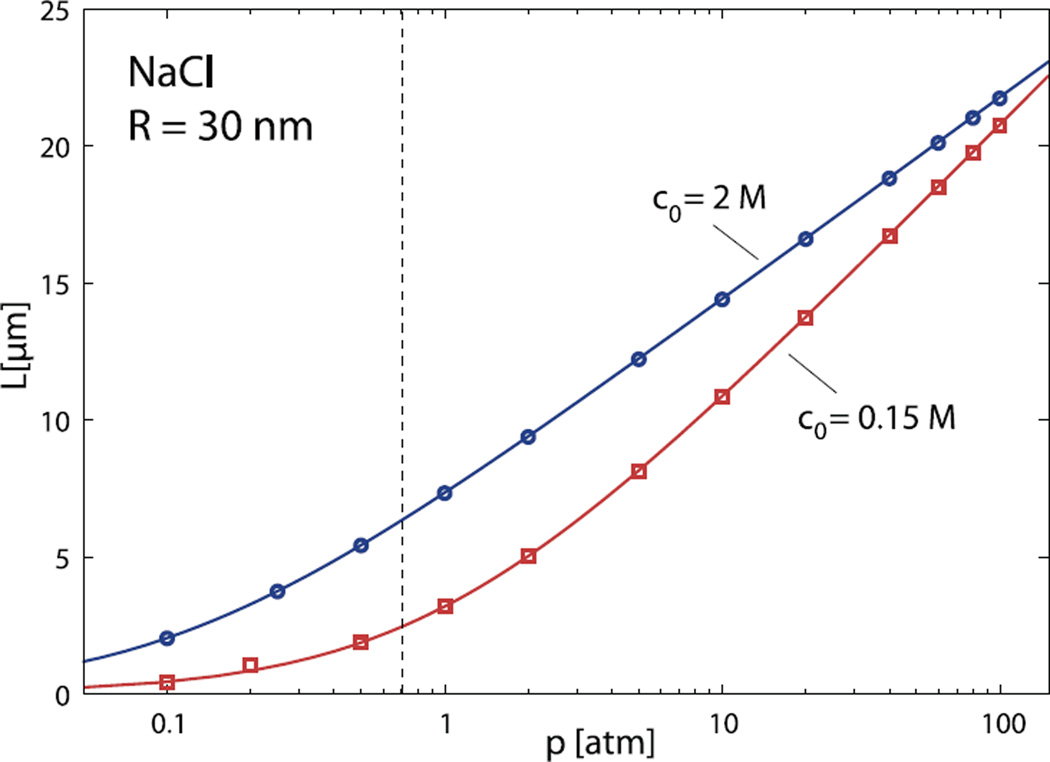
Note that the encapsidated lengths obtained by this simple method are practically indistinguishable from the full numerical results which indicates that the DNA bending energy contribution to the total energy balance for this choice of parameters is secondary at best. Similar results are obtained for a capsid of larger radius, R = 30 nm, as shown in Figure 3. Of course, the total encapsidated lengths are much larger in this case, but again, approximate values obtained from equation (15) are in excellent agreement with numerical results. We thus conclude that DNA bending does not contribute significantly to the energetics of viral packing. For bacteriophage λ EMBL3, that has a mean capsid radius close to 30 nm, our results predict that the full length of its genome (14.4µm) at 0.15M NaCl would be packed at osmotic pressure of 24.4 atm, in excellent agreement with experimental data of Evilevich et al. [39]. One should also note the convergence of the encapsidation curves in Figure 2 at high osmotic pressures. This is a straightforward consequence of the behavior of DNA in the bulk, where the equation of state at high values of osmotic pressure gradually ceases to be dependent on the salt concentration.
Fig. 3.
Same as in Figure 2, only for capsid radius of R = 30 nm.
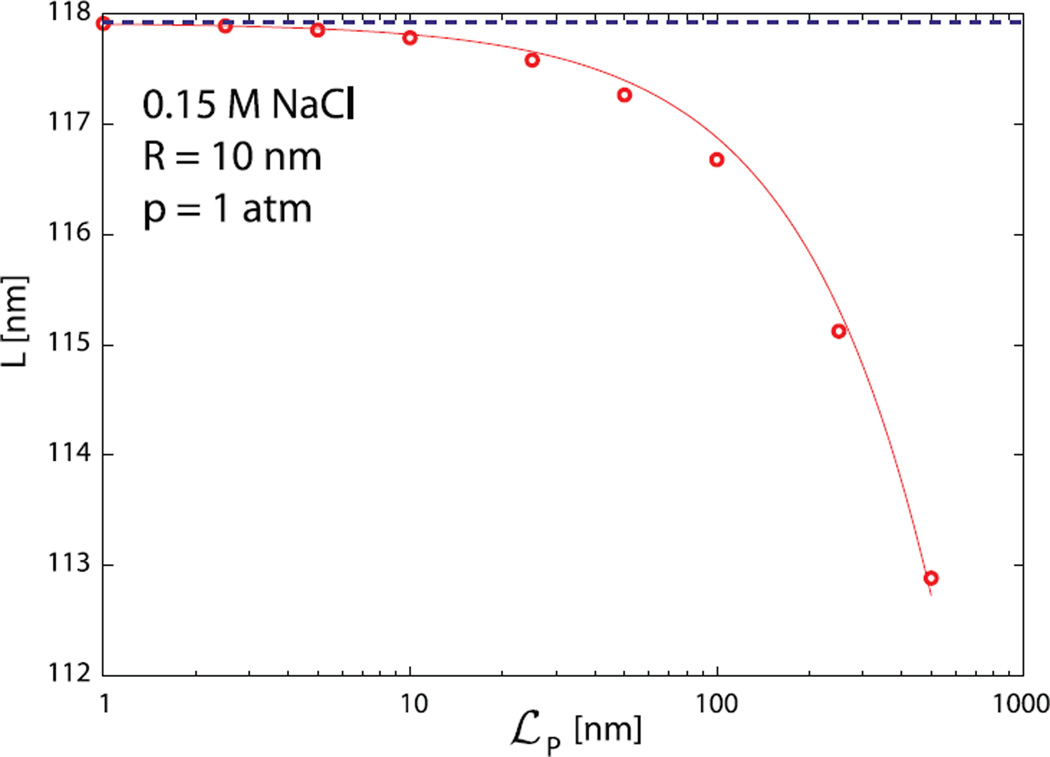
The scale of the bending energy contribution in these calculations is set by the persistence length, ℒP of DNA, taken as 50 nm in all calculations shown in Figures 2 and 3. To pinpoint the influence of the DNA bending rigidity on the total length of the DNA encapsidated in bacteriophages we show how the results for the encapsidated DNA length change with ℒP in Figure 4. The numerical results are represented by symbols. It can be shown analytically that the (negative) correction to the loaded genome length due to finite DNA persistence length should be in the lowest order proportional to ℒp, and the full line in Figure 4 shows the function L(p) = L(p;ℒp = 0)−C(R, p)ℒp, where C(R, p) is a dimensionless constant for given R and p. Note that variation of bending rigidity from 5 nm to 500 nm produces only a 4% decrease in the length of encapsidated DNA. Our conclusion on the marginal importance of DNA bending energy in viral packing energetics thus appears quite robust.
Fig. 4.
Dependence of the encapsidated DNA length L on persistence length ℒP of the DNA. The calculations (symbols) were performed for R = 10 nm capsid, osmotic pressure p = 1 atm in a solution containing 0.15 M of NaCl. The dashed line is a prediction of equation (15). The full line is a function L = L(p;ℒp= 0) − Cℒp, where C is treated as a fitting parameter (C = 0.0104).
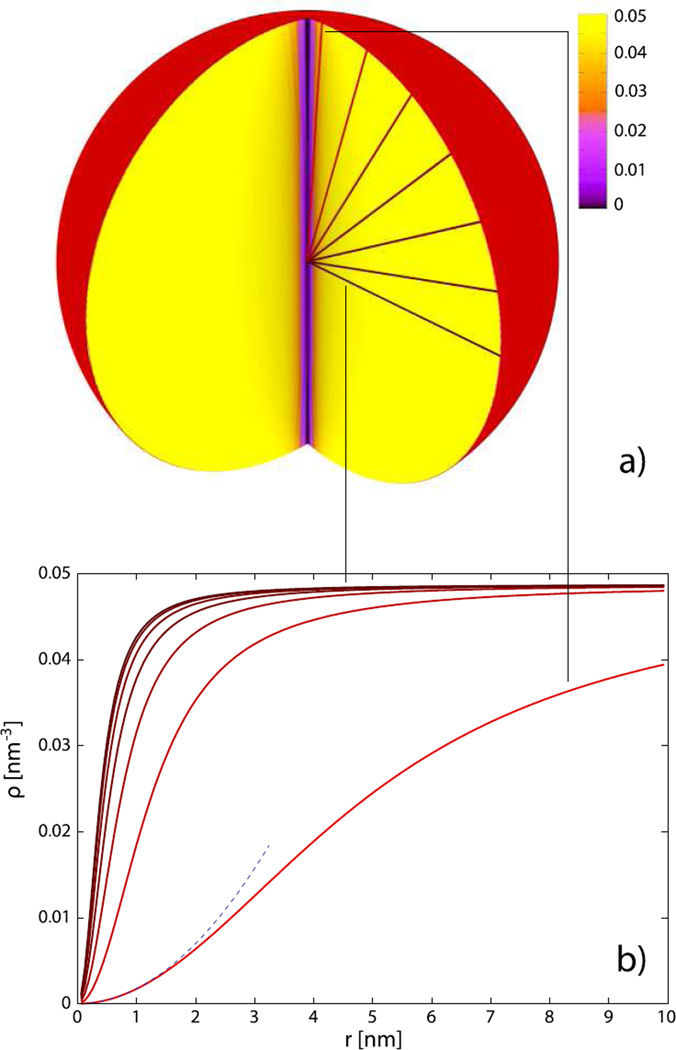
Although the energetics of DNA bending is of minor importance concerning the encapsidated DNA length, it has nevertheless a visible and non-negligible influence on the density distribution of encapsidated DNA, i.e. on the DNA density profile within the capsid. This is shown in Figure 5. One can clearly discern a cylindrical region of depleted DNA density. The depletion effect is always more prominent for smaller radial distances, consistent with the approximate solution (13), but is clearly observed only for sufficiently low pressures (small genome packing fractions). For high enough pressures, the depletion region becomes “compressed” and its effective radius small on the scale set by the capsid radius. Figure 5 also clearly explains why the depleted region has only a minor influence on the encapsidated length of DNA. Note that the radius of a cylinder of depleted DNA density is about 0. 05R, and its volume is thus 0.016 R3 which is only 0.4% of the capsid volume (this is consistent with the data shown in Fig. 4). All these conclusions stemming from the numerical analysis of our model are completely consistent with recent investigations of the three-dimensional architecture of the bacteriophage ϕ29 packaged genome [3].
Fig. 5.
The DNA density distribution in the capsid of R = 10 nm under osmotic pressure of p = 0.5 atm in a solution that contains 0.15 M of NaCl. Panel (a) represents a three-dimensional cut-through view of the density. The curves in panel (b) display the DNA densities along the directions (fixed angles θ = π/40, 4π/40, 7π/40,…, 19π/40) indicated in panel (a). The thin dashed line shows the r2 dependence of the density predicted by equation (13). For the calculation of 3D profile, Nr = 90 and Nθ = 42 divisions were used. The length of encapsidated DNA is 68.5 nm.
We should also note here that though the first integral (11) depends only on the radial distance from the cylindrical axis, i.e. r sin θ, the length constraint (12) does not! Nevertheless, numerical results indicate that the density profile looks almost like a function of the distance from the cylindrical axis.
The experimental points on osmotic encapsidation obtained by Evilevitch et al. [39] are within the range of calculated values obtained from the Na+ bulk osmotic stress data at low ionic strength, which is consistent with the stated ionic conditions in the experiment (very low salt and TM buffer). The same conclusion would hold also for the other data presented by the same group [40,14] though there is a small variation in the length of the genome investigated. Unfortunately no systematic study of the osmotic loading curves as a function of salt concentration was attempted in this work so we cannot make a detailed comparison at this point.
4.2 MnCl2 salt
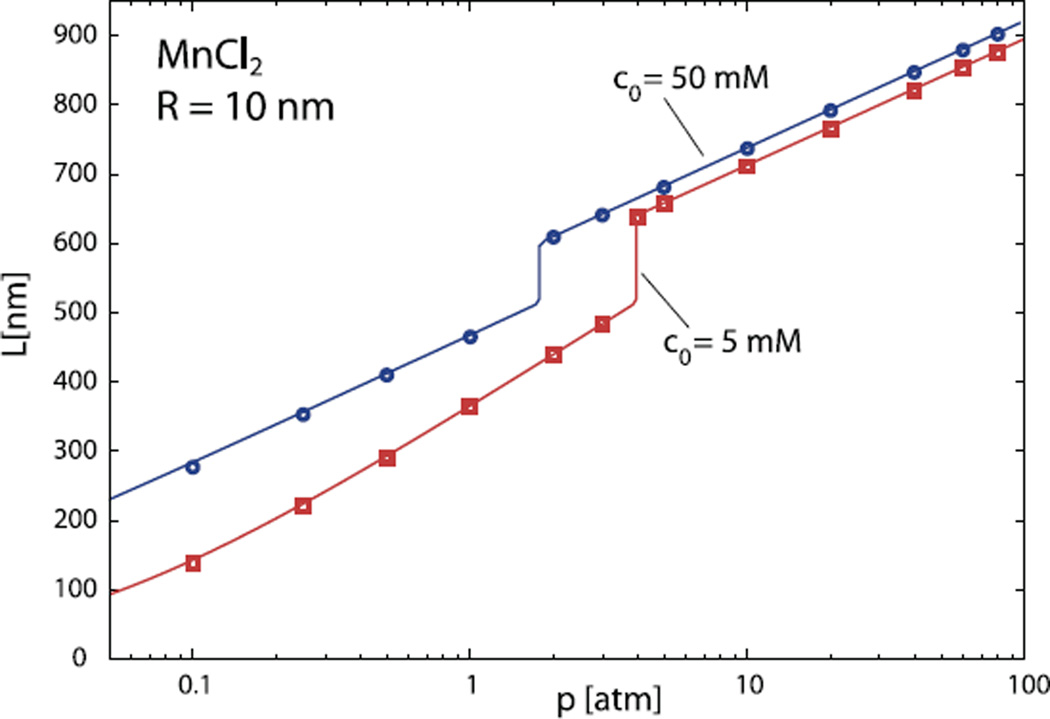
In the case of divalent salt the bulk osmotic pressure curves, with Mn2+ as a counterion, show breaks in the dependence on DNA density, or equivalently interaxial spacing [29]. This behavior is pertinent to this specific divalent counterion only, but are ubiquitous for higher valency (three or more) counterions. These breaks are due to attractions between DNAs conferred by the hydrated polyvalent counterion and correspond to thermodynamically unstable osmotic pressure regions, for details see [29]. The DNA osmotic pressures thus become constant for a certain range of densities, depending on salt concentration.
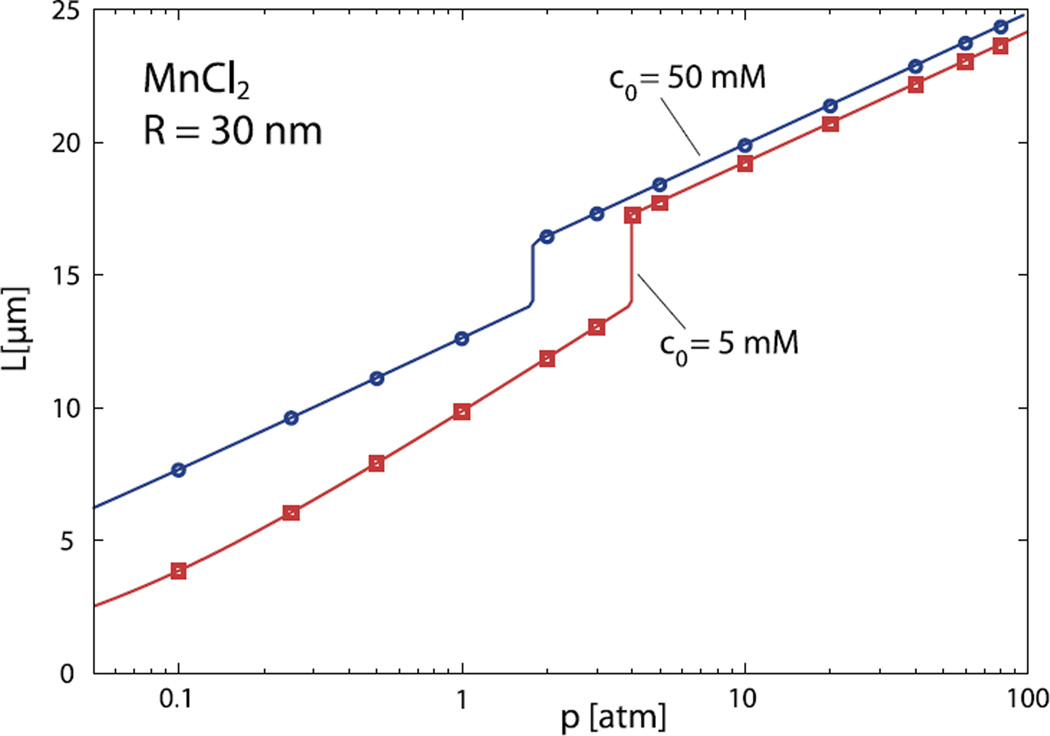
The non-monotonicity of the first derivative of the osmotic pressure is expected to be translated into a discontinuity in the loaded DNA length that appears at certain “critical” pressure. Indeed, this is what we observe from our calculations for viruses in solutions with MnCl2 salt. Figure 6 shows the encapsidated DNA length as a function of the osmotic pressure for a capsid of R = 10 nm radius. The results of analogous calculations for R = 30 nm capsid are displayed in Figure 7. The full lines are again approximate predictions of equation (15) which are very accurate in this case also. Again this corroborates our previous conclusion on the marginal influence of DNA elasticity on viral encapsidation energetics. For high osmotic pressures the encapsidation curves for various amounts of the divalent salt converge to the same value, consistent to the behavior of DNA equation of state in the bulk, just as in the case of the monovalent salt.
Fig. 6.
The length of the encapsidated DNA as a function of the osmotic pressure in the solutions containing 5 mM (squares) and 50mM of MnCl2 (diamonds) together with 0.25 M NaCl. The symbols denote numerical results obtained by solving equation (11). Full lines are again predictions of equation (15). The capsid radius in these calculations is R = 10 nm.
Fig. 7.
Same as in Figure 6, only for capsid radius of R = 30 nm.
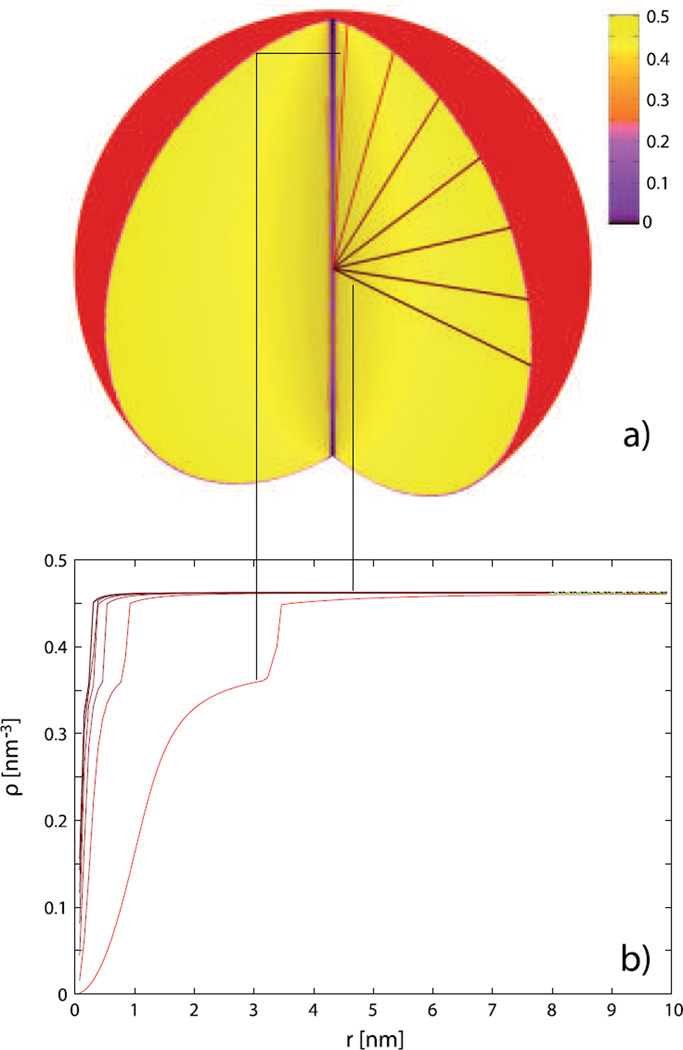
The first derivative discontinuity in the osmotic pressure dependence of the bulk DNA density can be observed also in the density distributions of the packed DNA for osmotic pressures that are not too far away from the discontinuity region. This is shown in Figure 8. The jumps in the DNA density separate the high-density DNA regions from cylindrically depleted viral core containing the DNA of low density.
Fig. 8.
The DNA density distribution in the capsid of R = 10 nm under osmotic pressure of p = 5 atm in a solution that contains 5 mM of MnCl2 and 0.25 M of NaCl. Panel (a) represents a three-dimensional cut-through view of the density. The curves in panel (b) display the DNA densities along the directions (fixed angles θ) indicated in panel (a). For the calculation of 3D profile, Nr = 90 and Nθ = 42 divisions were used. The length of encapsidated DNA is 657.8 nm.
5 Conclusions
The approach introduced in this work is based on the reformulation of the Odijk-Gelbart inverse spool model by casting it in terms of osmotic pressure directly, which is the experimental variable figuring in the bulk osmotic stress experiments [22]. Standard chemical potential formulation, that figures in the EL equations (5, 6), and in previous work on DNA packing within viral capsids [6,7, 9,10,12,13,26], which demands that the chemical potential of osmotically stressed DNA is calculated from the measured bulk DNA osmotic pressure, is thereby circumvented. This is particularly convenient in the analysis of encapsidation curves for polyvalent salts where the osmotic pressure shows discontinuities. In our approach this feature of the bulk DNA equation of state can be taken into account directly, whereas if one formulates the equations of thermodynamic equilibrium in terms of the chemical potential, its form would have to be reconstructed from the osmotic pressure curves—certainly a non-trivial exercise. The packing geometry of the DNA director in this work has been conveniently formulated in the frame-work of cylindrically symmetric director profiles within the bacteriophage capsid, which allows for some important simplifications in the analysis and leads to a very simple form of the first integral of the EL equations that can be solved straightforwardly numerically. The reformulation of the inverse spool theory described in this work allows us finally to obtain concurrently the encapsidated fraction as well as the spatial density distribution of the DNA inside the viral capsid.
The main difference between the divalent (MnCl2) and the monovalent (NaCl) salt considered here, very similar and related to the respective behavior of the bulk osmotic pressures [29], is the discontinuous variation of the loaded genome fraction as a function of external osmotic pressure. This difference, which is one of the main results of our work, is clearly discernible and is qualitative. The jumps in bulk osmotic pressure are directly translated into discontinuities in the size of packed genome as a function of external PEG osmotic pressure. Once again, these results follow straightforwardly from the reformulation of the inverse spool model advocated here, whereas they would involve heavy numerical work in order to deconvolute the discontinuous osmotic pressure into the corresponding chemical potential.
These effect are not universal for all divalent counterions and are in fact quite specific for Mn [29]. We are not aware at this point of any experiments that would systematically investigate the ionic strength dependence of the osmotic loading curves, particularly in the case of polyvalent counterions that we addressed above. It would be quite interesting to see whether our theoretical predictions would show any similarity to experiments in progress on polyvalent counterions (Evilevitch, personal communication).
The other important conclusion of our work is that the contribution of DNA bending energy to energetics of DNA encapsidation and specifically to DNA encapsidation curves, seems to be marginal. The encapsidation curves can be quite accurately fitted without any contribution from DNA elasticity. Nevertheless, DNA bending energetics does influence the details of the density distribution of encapsidated DNA. It thus appears that DNA elasticity is important for local density of DNA packing within the capsid, but does not influence the global properties, such as the integral of the DNA density within the capsid.
There are several features pertaining to the approximations introduced in this work that deserve special comment. First of all the free-energy ansatz for the nematic nanodroplet does not include higher-order gradient terms since the corresponding correlation length would be smaller than the range of variation in the density field. Also since DNA is depleted from the center of the capsid, the nematic droplet ansatz is strictly speaking not applicable in the central region of the capsid that corresponds to DNA densities well within the isotropic regime, where the nematic free-energy ansatz is not valid. One would have to modify the free energy by including terms that would allow for the isotropic-nematic transition within the capsid to describe properly the depletion and nematic ordering of DNA in the vicinity of the center of the capsid. That such a transition occurs has been clearly stated in recent work [3]. Though these terms would complicate the mathematical analysis, we might venture to amend the free energy ansatz along these lines in the future.
Acknowledgments
RP would like to acknowledge the financial support by the Slovenian Research Agency under contracts P1-0055(C), Z1-7171 and L2-7080. AŠ acknowledges support by the Ministry of Science, Education and Sports of Republic of Croatia through the Research Project No. 035-0352828-2837. This study was supported in part by the Intramural Research Program of the NIH, National Institute of Child Health and Human Development.
Appendix A
Consider first a deformed DNA subphase corresponding to a spatially varying director profile, in thermodynamic equilibrium with bulk DNA, which is undeformed. Following closely the standard derivation [32] we first obtain straightforwardly from the EL equations, equations (5, 6) that
| (A.1) |
a relation identical to the case, where the elastic modulus is a constant, K(ρ) = const [32]. Here we used the thermodynamic identity ∂ip0 = ρ ∂iμ0. However, the above form can be derived only if K(ρ) is at most a linear function of the density, which is indeed the case we are considering here. Equation (A.1) does not yield a first integral of the EL system if K(ρ) is not a constant. In order to arrive at the first integral one has to rework it as follows. First we have
| (A.2) |
From the first EL equation (5) it now follows directly that
| (A.3) |
Thus remembering that μ is a constant chemical potential, we remain with
| (A.4) |
By the well-known thermodynamic relation [35] the (osmotic) pressure is defined as
This is the bulk (osmotic) pressure, i.e. it contains no contribution from the deformation energy, at the chemical potential μ. From here we conclude that in thermodynamic equilibrium between the deformed and bulk DNA subphases the following condition should be valid, viz.
| (A.5) |
One should remember here that on the l.h.s. p0(ρ) is the (osmotic) pressure at μ0(ρ) and is thus not equal to p(ρ). Furthermore let us reiterate that the above first integral of the EL equations exists in this simple form only if K(ρ) is at most a linear function of the density and is thus not universal!
The last step in the derivation of equation (7) is conceptual. We now add a third component to our system: a solution of PEG in thermodynamic equilibrium with the bulk system characterised by p(ρ), at the same osmotic pressure. This is the situation usually encountered in the osmotic stress experiments [22]. The deformed DNA nematic system is in thermodynamic equilibrium with the undeformed DNA bulk nematic, which is in thermodynamic equilibrium with PEG. Thus the deformed DNA nematic is also in equilibrium with the PEG at osmotic pressure p. Therefore
| (A.6) |
This concludes the argument and demonstrates the validity of equation (7).
References
- 1.Cerritelli ME, Cheng N, Rosenberg AH, McPherson CE, Booy FP, Steven AC. Cell. 1997;91:271. doi: 10.1016/s0092-8674(00)80409-2. [DOI] [PubMed] [Google Scholar]
- 2.Jiang W, Chang J, Jakana J, Weigele P, King J, Chiu W. Nature. 2006;439:612. doi: 10.1038/nature04487. [DOI] [PMC free article] [PubMed] [Google Scholar]
- 3.Comolli LR, Spakowitz AJ, Siegerist CE, Jardine PJ, Grimes S, Anderson DL, Bustamante C, Downing KH. Virology. 2008;371:267. doi: 10.1016/j.virol.2007.07.035. [DOI] [PubMed] [Google Scholar]
- 4.Gelbart WM, Knobler CM. Phys. Today. 2008;61:43. [Google Scholar]
- 5.Smith DE, Tans SJ, Smith SB, Grimes S, Anderson DL, Bustamante C. Nature. 2001;413:748. doi: 10.1038/35099581. [DOI] [PubMed] [Google Scholar]
- 6.Odijk T. Biophys. J. 1998;75:1223. doi: 10.1016/S0006-3495(98)74041-X. [DOI] [PMC free article] [PubMed] [Google Scholar]
- 7.Odijk T. Philos. Trans. R. Soc. London, Ser. A. 2004;362:1497. doi: 10.1098/rsta.2004.1385. [DOI] [PubMed] [Google Scholar]
- 8.Kindt J, Tzlil S, Ben-Shaul A, Gelbart WM. Proc. Natl. Acad. Sci. U.S.A. 2001;98:13671. doi: 10.1073/pnas.241486298. [DOI] [PMC free article] [PubMed] [Google Scholar]
- 9.Purohit PK, Kondev J, Phillips R. Proc. Natl. Acad. Sci. U.S.A. 2003;100:3173. doi: 10.1073/pnas.0737893100. [DOI] [PMC free article] [PubMed] [Google Scholar]
- 10.Purohit PK, Inamdar MM, Grayson PD, Squires TM, Kondev J, Phillips R. Biophys. J. 2005;88:851. doi: 10.1529/biophysj.104.047134. [DOI] [PMC free article] [PubMed] [Google Scholar]
- 11.Tzlil S, Kindt JT, Gelbart WM, Ben-Shaul A. Biophys. J. 2003;84:1616. doi: 10.1016/S0006-3495(03)74971-6. [DOI] [PMC free article] [PubMed] [Google Scholar]
- 12.Klug WS, Feldmann MT, Ortiz M. Comput. Mech. 2005;35:146. [Google Scholar]
- 13.Klug WS, Ortiz M, Mech J. Phys. Sol. 2003;51:1815. [Google Scholar]
- 14.Evilevitch A, Lavelle L, Knobler CM, Raspaud E, Gelbart WM. Proc. Natl. Acad. Sci. U.S.A. 2003;100:9292. doi: 10.1073/pnas.1233721100. [DOI] [PMC free article] [PubMed] [Google Scholar]
- 15.Grayson P, Evilevitch A, Inamdar MM, Purohit PK, Knobler CM, Phillips R, Gelbart WM. Biophys. J. 2005;88:230A. [Google Scholar]
- 16.Arsuaga J, Tan RK-Z, Vazquez M, Sumners DW, Harvey SC. Biophys. Chem. 2002;101:475. doi: 10.1016/s0301-4622(02)00197-7. [DOI] [PubMed] [Google Scholar]
- 17.Spakowitz AJ, Wang Z-G. Biophys. J. 2005;88:3912. doi: 10.1529/biophysj.104.052738. [DOI] [PMC free article] [PubMed] [Google Scholar]
- 18.Wiggins PA, van der Heijden T, Moreno-Herrero F, Spakowitz A, Phillips R, Widom J, Dekker C, Nelson PC. Nature (Nanotechnol.) 2006;1:137. doi: 10.1038/nnano.2006.63. [DOI] [PubMed] [Google Scholar]
- 19.Podgornik R, Hansen PL, Parsegian VA, Chem J. Phys. 1999;113:9343. [Google Scholar]
- 20.Williams MC, Rouzina I. Curr. Op. Struc. Biol. 2002;12:330. doi: 10.1016/s0959-440x(02)00340-8. [DOI] [PubMed] [Google Scholar]
- 21.Hagerman PJ. Annu. Rev. Biophys. Biophys. Chem. 1988;17:265. doi: 10.1146/annurev.bb.17.060188.001405. [DOI] [PubMed] [Google Scholar]
- 22.Parsegian VA, Rand RP, Fuller NL, et al. Methods Enzymol. 1986;127:400. doi: 10.1016/0076-6879(86)27032-9. [DOI] [PubMed] [Google Scholar]
- 23.Strey HH, Podgornik R, Rau DC, Parsegian VA. Curr. Opin. Struc. Biol. 1998;8:309. doi: 10.1016/s0959-440x(98)80063-8. [DOI] [PubMed] [Google Scholar]
- 24.Leikin S, Parsegian VA, Rau DC. Annu. Rev. Phys. Chem. 1993;44:369. doi: 10.1146/annurev.pc.44.100193.002101. [DOI] [PubMed] [Google Scholar]
- 25.Strey HH, Parsegian VA, Podgornik R. Phys. Rev. E. 1999;59:999. [Google Scholar]
- 26.Slok F, Odijk T, Phys J. Chem. B. 2003;107:8074. [Google Scholar]
- 27.Rau DC, Lee B, Parsegian VA. Proc. Natl. Acad. Sci. U.S.A. 1984;81:2621. doi: 10.1073/pnas.81.9.2621. [DOI] [PMC free article] [PubMed] [Google Scholar]
- 28.Podgornik R, Rau DC, Parsegian VA. Macromol. 1989;22:1780. Biophys. J. 66, 962 (1994). [Google Scholar]
- 29.Rau DC, Parsegian VA. Biophys. J. 1992;61:246. doi: 10.1016/S0006-3495(92)81831-3. [DOI] [PMC free article] [PubMed] [Google Scholar]
- 30.Lepault J, Dubochet J, Baschong W, Kellenberger E. EMBO J. 1987;6:1507. doi: 10.1002/j.1460-2075.1987.tb02393.x. [DOI] [PMC free article] [PubMed] [Google Scholar]
- 31.Kulić IM, Andrienko D, Deserno M. Europhys. Lett. 2004;67:418. [Google Scholar]
- 32.Kosevich AM, Lifshitz EM, Landau LD, Pitaevskii LP. Theoretical Physics. third edition. Vol. 7. Butterworth-Heinemann; 1986. Theory of Elasticity. [Google Scholar]
- 33.de Gennes PG, Prost J. The Physics of Liquid Crystals, International Series of Monographs on Physics. second edition. USA: Oxford University Press; 1995. [Google Scholar]
- 34.Kamien RD, LeDoussal P, Nelson DR. Phys. Rev. A. 1992;45:8727. doi: 10.1103/physreva.45.8727. [DOI] [PubMed] [Google Scholar]
- 35.Rowlinson JS, Widom B. Molecular Theory of Capillarity. Dover Publications; 2003. [Google Scholar]
- 36.Andelman D. In: Handbook of Biological Physics: Structure and Dynamics of Membranes. Lipowsky R, Sackmann E, editors. 1B. Amsterdam: Elsevier Science B.V; 1995. ch. 12. [Google Scholar]
- 37.Earnshaw WC, King J, Harrison SC, Eiserling FA. Cell. 1978;14:559. doi: 10.1016/0092-8674(78)90242-8. [DOI] [PubMed] [Google Scholar]
- 38.MINPACK library of FORTRAN routines. Garbow BS, Hillstrom KE, More JJ. Argonne National Laboratory. MINPACK Project. 1996 [Google Scholar]
- 39.Evilevitch A, Gober JW, Phillips M, Knobler CM, Gelbart WM. Biophys. J. 2005;88:751. doi: 10.1529/biophysj.104.045088. [DOI] [PMC free article] [PubMed] [Google Scholar]
- 40.Grayson P, Evilevitch A, Inamdar MM, Purohit PK, Gelbart WM, Knobler CM, Phillips R, et al. Virology. 2006;348:430. doi: 10.1016/j.virol.2006.01.003. [DOI] [PMC free article] [PubMed] [Google Scholar]


