

Abstract
GABAergic inhibitory interneurons control fundamental aspects of neuronal network function. Their functional roles are assumed to be defined by the identity of their input synapses, the architecture of their dendritic tree, the passive and active membrane properties and finally the nature of their postsynaptic targets. Indeed, interneurons display a high degree of morphological and physiological heterogeneity. However, whether their morphological and physiological characteristics are correlated and whether interneuron diversity can be described by a continuum of GABAergic cell types or by distinct classes has remained unclear. Here we perform a detailed morphological and physiological characterization of GABAergic cells in the dentate gyrus, the input region of the hippocampus. To achieve an unbiased and efficient sampling and classification we used knock-in mice expressing the enhanced green fluorescent protein (eGFP) in glutamate decarboxylase 67 (GAD67)-positive neurons and performed cluster analysis. We identified five interneuron classes, each of them characterized by a distinct set of anatomical and physiological parameters. Cross-correlation analysis further revealed a direct relation between morphological and physiological properties indicating that dentate gyrus interneurons fall into functionally distinct classes which may differentially control neuronal network activity. © 2013 The Authors. Hippocampus Published by Wiley Periodicals, Inc.
Keywords: dentate gyrus, classification, basket cell, dendrite-inhibiting interneuron, GAD67-GFP
INTRODUCTION
GABAergic cells perform multiple operations in neuronal networks. They control the electrical activity of large neuronal populations by feedforward and feedback inhibition (Cobb et al., 1995; Pouille and Scanziani, 2001), determine frequency and timing of action potentials in their target neurons (Buzsáki and Chrobak, 1995; Cobb et al., 1995; Miles et al., 1996) and contribute to the generation of fast network oscillations in cortical circuits (Whittington et al., 1995; Wang and Buzsáki, 1996; Bartos et al., 2002, 2007; Somogyi and Klausberger, 2005, 2008; Epsztein et al., 2006; Doischer et al., 2008).
Cortical interneurons display a high diversity in terms of their anatomical, physiological and neurochemical characteristics (Ramón y Cajal, 1911; Lorente de Nó, 1934; Amaral, 1978; Freund and Buzsáki, 1996; Somogyi et al., 1998; Ali et al., 1999; Gupta et al., 2000). First, the axonal distribution pattern and the location of their output synapses along the somato-dendritic axis of their target neurons varies between interneuron types (Klausberger et al., 2003, 2004; Hájos et al., 2004; Tamás et al., 2004) and it has been shown that perisomatic versus dendritic inhibition contributes differentially to input-processing in postsynaptic cells. Perisomatic inhibitory synapses can efficiently control action potential generation whereas dendritically located synapses predominantly control local electrogenesis and synaptic plasticity (Miles et al., 1996; Gulledge and Stuart, 2003; Pouille and Scanziani, 2004; Gidon and Segev, 2012). Second, interneurons display diverse intrinsic membrane properties such as input resistance, resting membrane potential and action potential threshold (Mountcastle et al., 1969; Mott et al., 1997; Parra et al., 1998; Cauli et al., 2000; Gupta et al., 2000; van Hooft et al., 2000; Petilla Nomenclature, 2008) indicating that spatio-temporal integration of synaptic inputs differ among interneuron types and their recruitment will take place under different network conditions. Finally, interneurons can express neurochemical markers including Ca2+-binding proteins such as parvalbumin (PV) and neuropeptides such as somatostatin (SOM) (Freund and Buzsáki, 1996; Freund, 2003; Somogyi and Klausberger, 2005). Thus, the various cellular characteristics suggest that different interneuron types contribute differentially to cortical network operations.
However, to understand interneurons∼ role in information processing we need to clarify whether they divide into distinct morpho-physiological classes (Freund and Buzsáki, 1996; Kawaguchi and Kubota, 1997; Cauli et al., 2000; Gupta et al., 2000; van Hooft et al., 2000; Wang et al., 2002; Klausberger et al., 2003; Hájos et al., 2004; Gloveli et al., 2005; Sugino et al., 2006) or alternatively, form a continuum with each cell expressing an individual set of functional characteristics (Mott et al., 1997; Parra et al., 1998; Maccaferri and Lacaille, 2003; Baraban and Tallent, 2004). Our knowledge on the signaling properties of interneurons improved in recent years, however, the controversy between the “class” and “continuum” hypothesis remained unresolved. We therefore addressed this open question in the present study on GABAergic cells in the hippocampal dentate gyrus. This brain region is the interface between the entorhinal cortex and hippocampus and is therefore central for the translation of the multimodal cortical information into a sparse hippocampal code. In this region the number of quantitative descriptions of interneuron types is very low (Ceranik et al., 1997; Mott et al., 1997; Armstrong et al., 2011) in contrast to other hippocampal areas (∼21 in CA1; Freund and Buzsáki, 1996; Somogyi and Klausberger, 2005). Furthermore, quantitative analysis of the morpho-physiological profile is sparse due to very low numbers of intracellularly labeled cells (Han et al., 1993; Scharfman, 1995; Lübke et al., 1998).
Here we used a GAD67-eGFP knock-in mouse line (Tamamaki et al., 2003; Doischer et al., 2008), enabling a reliable and unbiased identification of interneurons in the acute hippocampal slice preparation. On the basis of whole-cell patch-clamp recordings from eGFP-cells in combination with intracellular labeling, we quantified morphological and physiological characteristics of a large set of GABAergic cells. Cluster analysis on the basis of morphometric variables revealed that dentate gyrus interneurons fall into five classes with each class characterized by a distinct set of morpho-physiological parameters. Thus, our data support the “interneuron class” hypothesis suggesting that neuronal networks are composed of functionally distinct types of inhibitory elements with each type contributing differentially to circuit function.
MATERIALS AND METHODS
Patch-Clamp Recordings
Knock-in GAD67-eGFP heterozygote mice (Tamamaki et al., 2003) were crossed with wild-type mice (C57/Bl6). The expression of the transgene was tested in the offspring by illuminating the heads with UV-light (<400 nm). In a subset of six cells, transgenic mice expressing eGFP under the control of the Gad1-promoter were used, thereby labeling SOM-positive cells (Oliva et al., 2000).
Transverse hippocampal slices (300 µm thickness) were cut from brains of 18- to 25-day-old mice using a vibratome (DTK-1000, Dosaka). Institutional animal care and use committee approved the treatment of animals in the reported experiments (license nr: X-10/13S). Patch pipettes were pulled from borosilicate glass tubing (2 mm outer diameter, 1 mm inner diameter). When filled with intracellular solution, the resistance was 2.0–3.0 MΩ. Recordings were performed from eGFP-labeled neurons in the dentate gyrus under visual control using infrared differential interference contrast video microscopy (IR-DIC; Bartos et al., 2002; Sauer and Bartos, 2010). Expression of eGFP was visualized in interneurons in the acute slice preparation using epifluorescence illumination. Selected interneurons had somata located at the granule cell layer-hilus border, in the granule cell layer or in the molecular layer. The recording temperature was 33–34°C.
An Axopatch 200B amplifier (Axon Instruments) was used for recordings. Neurons were held in the current-clamp mode during recordings (CC; holding potential −70 mV) to determine active (CC-fast mode) and passive (input resistance, whole-cell capacitance; CC-slow mode) properties with series resistance (Rs) compensation enabled (∼95% in CC; Rs before compensation 10–12 MΩ). The stationarity of Rs in the postsynaptic neuron was assessed in the voltage-clamp (VC) mode from the amplitude of the capacitive current in response to a 10 mV pulse. The compensation was readjusted during the experiment when necessary. Determination of the input resistance (Rin) was performed under VC conditions without Rs compensation. Signals were filtered at 10–20 kHz using the four-pole low-pass Bessel filter of the amplifiers and were digitized at 20–40 kHz using a 1401plus laboratory interface (Cambridge Electronic Design, CED) connected to a PC. Igor programs (F-Pulse, U. Fröbe, Physiologisches Institut, Freiburg) were used for stimulus generation and acquisition and Stimfit (http://www.stimfit.org), Mathematica 4.2 (Wolfram Research) and MATLAB (The MathWorks) were used for data analysis.
Solutions
The physiological extracellular solution contained in mM: 125 NaCl, 25 NaHCO3, 25 glucose, 2.5 KCl, 1.25 NaH2PO4, 2CaCl2, and 1 MgCl2 (equilibrated with 95% O2/5% CO2 gas mixture). Slices were stored in a solution containing in mM: 87 NaCl, 25 NaHCO3, 2.5 KCl, 1.25 NaH2PO4, 0.5 CaCl2, 7 MgCl2, 25 glucose, and 75 sucrose. Kynurenic acid (KYN; 2 mM) and bicuculline methiodide (BIC; 10 µM) were added to the bath solution to block synaptic currents during the measurement of the input resistance (Rin) and the membrane time constant (τm). The intracellular solution contained in mM: 135 K-gluconate, 20 KCl, 0.1 EGTA, 2 MgCl2, 2Na2 ATP and 10 HEPES; the pH was adjusted to 7.2 with KOH and the osmolarity was 300–310 mOsm. BIC and KYN were both purchased from Sigma. Other chemicals were from Merck, Sigma or Tocris.
Analysis of Passive and Active Membrane Properties
Determination of passive parameters
Resting membrane potential (Vrest) was determined immediately after break through in the whole-cell mode. Membrane potentials reported in this study were corrected for a junction potential of 11 mV determined with a 3 M KCl bridge. Rin was measured from the average current (average from 20 single traces) at the end of a 10 mV (1 s) voltage pulse. To determine τm short (0.2 ms) depolarizing current pulses (100 pA) were applied in the CC mode. The corresponding 300–500 voltage traces were averaged and the late phase of the logarithmically transformed decay was analyzed by linear regression. All recordings were performed in the presence of 2 mM KYN and 20 µM BIC.
Determination of single action potential parameters
Single action potentials were elicited either by brief (2 ms) depolarizing rectangular current steps of increasing amplitude (step-size 10 pA) or by 1-s-long stepwise (10 pA) increasing amplitude current injections. In the latter case only action potentials generated during the first 10 ms upon onset of the current injection which just crossed the action potential threshold were considered. All values represent averages from 10 single action potentials for each cell. The action potential threshold (Vthres) was defined as the point of the voltage trajectory that exceeded a slope of 20 V s−1 (Bekkers et al., 2001) during the rising phase of the action potential. Peak amplitude of action potentials was measured from Vthres to the peak potential. Half-duration (HD) of action potentials was measured at the two points during the rise and decay phase halfway between threshold and peak. Fast after-hyperpolarization (fAHP) was defined between Vthres and the most negative deflection immediately following the peak of single action potentials.
Analysis of discharge patterns
Trains of action potentials were evoked by step-wise increasing (−400 to 1500 pA; step size 50 pA) long-lasting (0.9–1 s) current injections. Discharge frequencies were determined as the reciprocal of the inter-spike intervals (ISIs). Maximal discharge frequencies, determined from a frequency–current relationship and discharge frequencies at current injections of 700 pA (1 s) are given. Ratios between the first and the tenth ISI were defined as adaptation ratio 1 and between the first and the last ISI as adaptation ratio 2. Coefficients of variation (CV) were examined for the peak amplitude, HD, ISI, maximal rate of rise, and rate of decay of action potentials during a train. Slow AHPs were measured from the baseline preceding the train and the most negative voltage deflection after the train.
Statistical analysis
Values are given as mean ± SEM. Error bars in figures represent SEM. Significance of differences between all classes was assessed using the nonparametric Kruskal–Wallis test. A nonparametric Mann–Whitney U test was performed to examine significant differences between two groups. Correlation between variables was determined applying Spearman∼s rank correlation analysis with significance levels (P) indicated.
Morphological Reconstruction and Analysis
Neurons were filled with biocytin (0.2%) during recordings. After withdrawal of the pipette, slices were fixed in 2.5% paraformaldehyde, 1.25% glutaraldehyde, 15% v/v saturated picric acid in 100 mM phosphate buffered solution (PB, pH 7.4) overnight, then rinsed in PB. Filled cells were visualized using avidin-biotinylated peroxidase complex and 3,3′-diaminobenzidine tetrahydrochloride (DAB) as chromogen and in a subset of three cells by Alexa647-coupled Streptavidin (Invitrogen). Slices were embedded in an aqueous mounting medium (Mowiol).
Axons and dendrites were examined with a light microscope using a 63× oil immersion objective (Numerical aperture 1.4). In 19 from a total of 114 recorded cells, the morphology of neurons was reconstructed using a Neurolucida (MicroBrightfield, V7) and in three neurons ImageJ software (V1.47). Morphometric data analysis was performed with the Neurolucida Explorer. The fluorescently labeled cells were imaged with a LSM710 using a Zeiss Plan-Apochromat 20× objective (NA 0.8). Cells were reconstructed using the Simple Neurite Tracer plugin for ImageJ and mophometric data analysis was done in Matlab. The selection of the 22 cells in total for reconstructions was based on the intensity of the labeling and the ability to fully reconstruct the labeled dendritic and axonal arborizations. These cells are termed in the following “rigorously identified” cells. The remaining 92 labeled neurons were visually identified on the basis of soma and dendrite location and the layer-specific distribution pattern of the axonal arbors observed in the light microscope (no reconstructions) and termed in the following “visually identified” cells. In Figure 2A, four–six color codes are used to represent rigorously and visually identified interneuron types. The “orange color code” represents basket cells (BCs), the “yellow code” stands for hilar commissural-associational pathway-associated cells (HICAPs), the “green code” defines molecular layer neurons (MLs), the “blue code” identifies total molecular layer interneurons (TMLs) and the “purple code” represents hilar perforant path-associated cells (HIPPs; see Results for further explanations). Axon projections in the hilus were termed “hilar projections” if >0.5% of the total reconstructed axon was located in this brain area. Axon projections in the inner molecular layer were termed “weak” if <14% of the total axon of reconstructed cells was located in this area. All reconstructions are available from the institutional web site (http://www.physiologie.uni-freiburg.de/research-groups/neural-networks/).
FIGURE 2.

Cluster analysis of morphological properties revealed four distinct interneuron classes. (A) Dendrogram derived from a hierarchical cluster analysis with Ward∼s method based on ten axonal and four dendritic properties selected by principal factor analysis (PFA). Squared Euclidean distance was chosen to measure distances. Color code indicates cell classification based on layer-specific axonal distribution patterns and the location of the soma (Freund and Buzsáki, 1996) identified by light-microscopical analysis (n = 22). (B) Representative neurolucida reconstructions of intracellularly labeled GAD67-eGFP-positive interneurons in the dentate gyrus corresponding to the identified class. Soma and dendrites are depicted in black and the axon in red. Class M1 cells (orange in A) with axon located in the granule cell layer (gcl), resembled basket and axo-axonic cells (BCs, AAs, respectively). Class M2 interneurons (yellow in A) with axon in the inner molecular layer resembled hilar commissural-associational pathway-related cells (HICAP cells). Class M3 cells (blue in A) had axon collaterals distributed throughout the total molecular layer (TMLs). Class M4 cells (green/purple in A) had axon collaterals in the outer molecular layer and resembled hilar perforant pathway-related neurons with axon in the outer molecular layer (HIPP-like; purple in A; bottom right) or they had both their axon and soma located in the molecular layer (MLs; green in A; bottom left). Abbreviations: gcl, granule cell layer; ml, molecular layer. Scale bar: 100 µm.
Immunohistochemistry
For immunohistochemical identification of GFP-labeled interneurons 6-week-old mice were deeply anesthetized with a ketamine/xylazine-combination (100/5 mg kg−1) and subsequently perfused intracardially with Ringer-solution followed by 4% paraformaldehyde in PB (100 mM, pH 7.4). The fixed brains were removed immediately from the skull, rinsed in phosphate-buffered saline (PBS; 0.9% NaCl in PB) and hippocampal sections were cut at 50 µm thickness using a vibratome (Dosaka). After several rinses in PBS, slices were incubated with 10% goat-serum and 0.3% triton X-100 in PBS for 1 h to block nonspecific binding. Slices were then incubated with antibodies against one of the following proteins: PV (mouse, monoclonal, Swant, 1:10,000); calretinin ([CR] rabbit, polyclonal, Swant, 1:2,000); calbindin ([CB] rabbit, polyclonal, Swant, 1:2,000); GAD67 (mouse, monoclonal, Chemicon, 1:5,000) diluted in PBS containing 5% goat-serum and 0.2% Triton X-100 for 24 h at 22°C. The secondary antibody (goat anti-mouse or anti-rabbit conjugated with Cy3, 1:300, Molecular Probes in PBS and 0.3% triton X-100) was applied for 6–12 h at 22°C. Slices were washed in PBS and embedded in Prolong Antifade (Molecular Probes). Labeled neurons were examined with a LSM710-Meta confocal microscope (Zeiss) and quantitative analysis was performed with ImageJ.
Intensity of immunohistochemical labeling in the cell body of GABAergic cells was determined by setting a defined region of interest (ROI; 3 × 3 µm2) in the cytoplasmic area of a defined cell from a confocal image taken with a 40× objective. The background fluorescence was measured by setting a second ROI (3 × 3 µm2) in close proximity of the cell body of interest which did not include labeled somata or fibers. After background subtraction, the labeling intensity was averaged over four measurements in the same cell body (Fig. 1B).
FIGURE 1.

GAD67 expression in GAD67-eGFP labeled cells of the dentate gyrus. (A) Z-projection of a confocal image stack of a horizontal slice (300 µm thickness, steps of 3 µm) derived from a P20 GAD67-eGFP knock-in mouse. Green spots indicate endogenous eGFP epiflorescence (excited at λ = 488 nm; emission band-pass at 500–550 nm) of interneuron cell bodies. (B) Densitometric measure of labeling intensity for GAD67 antibody labeling in single cell bodies plotted as a function of eGFP signal intensity. (C,D) Confocal image of eGFP-fluorescence. In green [C], endogenous eGFP; in red [D], immunolabeling against GAD67. Arrowheads point to eGFP- and GAD67- positive interneuron somata. (E–G) GAD67-eGFP co-localizes with interneuron-specific markers. Representative confocal images obtained from the dentate gyrus gcl-hilus border confirming co-localization of GAD67-eGFP with the common interneuron markers parvalbumin (PV; E), calbindin (CB; F) and calretinin (CR; G). Secondary antibody conjugated to Cy3 was directed against antibodies targeting PV, CB and CR. Bar graphs summarize the percental fraction of the neurochemically defined interneuron types. Abbreviations: gcl, granule cell layer; ml, molecular layer.
Cluster Analysis and Principal Factorial Analysis
Morphological and physiological properties of identified GAD67-eGFP cells were tested for uniformity in their distribution. Each of the quantified 65 variables was binned (31 morphological; 34 physiological; red labeled in Supporting Information Tables 1 and 2) and a fit of the data was performed with one and the sum of two or more Gaussian functions (Mathematica, V4.2) based on the assumption that a variable is normally distributed in a given interneuron class. Quality of the fit was determined using maximum likelihood analysis (MLA; χ2 test; Supporting Information Figs. 1 and 2). Variables with a nonuniform distribution were used for subsequent cluster analysis.
Hierarchical cluster analysis was performed for morphological and physiological properties of GAD67-eGFP cells by SPSS (V15.0 and 20.0; Chicago, IL) algorithms (Ward∼s method, Euclidian distance). Cluster analysis reveals dissimilarities between cells by calculating the intercellular distance in a multidimensional space, where each dimension corresponds to one of the quantified cellular parameters. Cluster tree diagrams group cells into classes with highest similarities. The larger the distance between classes the larger the difference. We used the Euclidean distance as dissimilarity measure and the Ward minimum variance method as linkage procedure (Cauli et al., 2000; Cossart et al., 2006; Dumitriu et al., 2007; Dávid et al., 2007). Cluster analysis on morphological criteria has been performed on the basis of 22 rigorously identified cells. Cluster analysis on physiological variables was performed on the basis of 72 out of 114 recorded cells in which all passive and active membrane properties, summarized in the Supporting Information Table 2, could be determined.
Explorative principal factor analysis (PFA) was applied to identify variables most responsible for class formation (Dávid et al., 2007; Dumitriu et al., 2007). Variables were extracted which showed >80% correlation with the 1st factor (14 morphological and 11 physiological parameters; labeled by an asterisk in Supporting Information Tables 1 and 2; see Dumitriu et al., 2007). This method identified the most important variables without prior knowledge on the number of clusters and the members of the clusters (Maddock and Young, 1987).
Cross-correlation analysis was performed to examine correlations between morphological and physiological variables using SPSS statistical software package. Ten physiological parameters with a significant correlation of P < 0.001 with one or more morphological parameters were identified (Fig. 6B).
FIGURE 6.

Cluster analysis of morphological and physiological properties of rigorously identified cells revealed five interneuron classes. (A) Cross-correlation analysis of selected morphological and physiological variables (red labeled, Supporting Information Tables 1 and 2) revealed significant relationship between some dendritic, axonal, passive and active membrane properties. A “+” represents morphological variables that correlated at P < 0.001 with one or more electrophysiological properties. A “−” represents no significant correlation (P > 0.05). (B) Cluster analysis based on 14 morphological and 11 physiological properties selected by PFA (red asterisks, Supporting Information Tables 1 and 2). Color code corresponds to the morphological interneuron types shown in Figure 2A (n = 22).
RESULTS
We performed whole-cell patch-clamp recordings from a sample of 114 eGFP-positive cells in acute slice preparations of mouse dentate gyrus (Tamamaki et al., 2003; Doischer et al., 2008) for the identification of their passive and active membrane properties. Several eGFP-positive cells were visualized at the hilus-granule cell layer border, in the granule cell layer and in the molecular layer using epifluorescence illumination (Fig. 1A). Cells were filled during the recordings with biocytin for subsequent morphological identification and analysis.
Neurochemical Identification of GAD67-eGFP-Expressing Cells
To confirm that GAD67-eGFP expression is a reliable marker for GABAergic cells in the dentate gyrus, we performed immunohistochemical double-labeling with primary antibodies against the interneuron marker GAD67 and the Ca2+ binding proteins PV, CB, and CR (Fig. 1). The intensity of the eGFP signal varied among neurons. Double-labeling confirmed that all eGFP cells expressed GAD67 and all GAD67-expressing neurons showed eGFP-labeling (75 out of 75 cells; Figs. 1C,D). Furthermore, the densitometrically measured eGFP intensity was linearly related to the intensity of the GAD67 fluorescence signal (Spearman∼s rank correlation P < 0.01; Fig. 1B; Materials and Methods), indicating that eGFP-labeling is a good predictor for the relative amount of GAD67 expression. Among the eGFP cells, 13.9% coexpressed PV (38 from 274 eGFP cells in 14 slices; Fig. 1E), in agreement with previous estimates of ∼15% of PV-positive neurons within the GABAergic population in this hippocampal subregion (Kosaka et al., 1987). Finally, 24.4% of eGFP-positive cells coexpressed CB (38 from 156 eGFP cells in 16 slices; Fig. 1F) and 12.5% of eGFP neurons coexpressed CR (22 from 176 cells in 20 slices; Fig. 1G), corresponding to previously published data from rat dentate gyrus (Miettinen et al., 1992; Freund and Buzsáki, 1996). Thus, GAD67-eGFP signals enable a reliable identification of GABAergic cells in the dentate gyrus and by randomly selecting eGFP interneurons during recordings, we can obtain an unbiased sample of interneurons.
Dentate Gyrus Interneurons Form Morphologically Distinct Classes
To examine whether interneurons classify on the basis of morphological properties, we performed 3D reconstructions from 22 out of 114 cells (rigorously identified; Fig. 2B; Supporting Information Figs. 3–7; Materials and Methods). On the basis of the reconstructions we analyzed 31 morphometric parameters which describe axonal (17 variables) and dendritic (14 variables) properties of eGFP cells (Supporting Information Table 1; reconstructed cells are available online, see Materials and Methods). Cluster analysis (Ward∼s Method) was performed with these variables to determine whether morphological properties represent classification criteria. We started out by testing all variables and found that interneurons did not separate into distinct classes (Euclidian linkage distances <20%; data not shown). We therefore asked whether some of the investigated variables may be more valuable for interneuron classification than others by testing whether the distribution of morphological variables depicted from the reconstructed interneuron population can be best fitted with one, two or more Gaussian functions, using MLA (Materials and Methods). We isolated 16 variables (12 axonal and 4 dendritic properties; red labeled in Supporting Information Table 1) with distribution patterns best fitted with two or three Gaussian functions indicating nonuniformity (Supporting Information Fig. 1). Subsequent cluster analysis with the isolated morphological parameters revealed two major super-families with a maximal Euclidian linkage distance of >70% (Fig. 2A). One super-family fell into two further morphological (M) classes with Euclidian linkage distances of ≥20% and will be referred to as class M1 and M2 in the following text. Similarly, the second super-family fell into two classes with Euclidian distances of >20% which will be referred to as class M3 and M4.
Thus, unbiased cluster analysis of nonuniformly distributed morphological characteristics resulted in the distribution of dentate gyrus GABAergic cells into four clearly separated classes.
Class-specific Morphological Differences
To identify those morphological factors which are most influential for interneuron classification we performed PFA analysis (see Materials and Methods; Dumitriu et al., 2007). All factors that correlated with more than 80% with the first and second principal component were extracted. PFA revealed that ten out of 17 parameters related to the axon, most importantly the layer-specific axonal distribution and its total length and density and four out of 14 dendritic parameters related to the total dendritic length and the area of its two-dimensional distribution (>83% correlation; labeled by a red asterisk in Supporting Information Table 1) are key variables determining cluster formation. They are summarized for every M class in the following.
Axon-related Variables
Quantitative analysis of axonal properties revealed a scenario in which class M1 and M3 form two opposing extremes (seven M1 and five M3 reconstructed cells; Fig. 3). Class M1 contained interneurons with axonal arborizations largely constrained to the granule cell layer (68.4% ± 13.0%; Figs. 2B and 3A; Supporting Information Fig. 3) a classical characteristic of perisoma-inhibiting basket cells (BCs) or their morphologically related axo-axonic cells (AAs; Han et al., 1993; Halasy and Somogyi, 1993; Buhl et al., 1994). Because AAs form only 10–15% of the total population of perisoma-inhibiting interneurons in the hippocampus (Somogyi et al., 1983; Baude et al., 2007), we expected that most of our class M1 cells are BC-like cells, (characterized by an “orange code” in Figs. 2B and 6). In three out of seven reconstructed M1 cells, however, 11.0% ± 5.9% of the axon collaterals extended additionally into the hilus and the principal cell layer of CA3 and in two M1 cells 14.3% ± 6.9% of the axon projected to the inner molecular layer (yellow code in Fig. 2B). Although M1 cells were characterized by one of the largest axonal length (22.3 ± 2.3 mm) and the highest number of branch points (399.4 ± 84.1) in comparison to all other interneuron classes, the projected area covered by axon collaterals in the transverse plane was small (53,681 ± 5,331 µm2; Fig. 3D), resulting in the highest axon density (0.38 ± 0.05 µm µm−2) in comparison to the remaining interneuron classes (M3 and M4 versus M1, P < 0.05 for both comparisons; Figs. 3B,C; Supporting Information Table 3). BC-like M1 cells were further characterized by the highest fractal dimension (1.6 ± 0.02, Fig. 3E), a factor measuring the ability of a one-dimensional axon to fill a two-dimensional area and varying between 1 and 2. A value of 1 indicated a poor ability of the axon to fill a two-dimensional space whereas a value of 2 indicated that the axon fills the area almost entirely (Dumitriu et al., 2007; Petilla Nomenclature, 2008). These data are in line with previous electrophysiological evidences for a strong perisomatic inhibition of the large principal cell population (Cobb et al., 1995; Pouille and Scanziani, 2001; Bartos et al., 2001, 2007).
FIGURE 3.
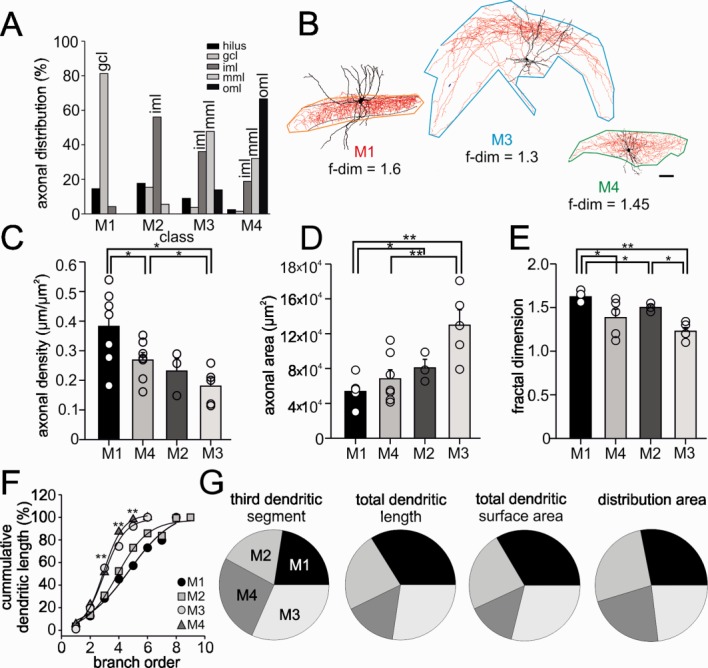
Interneuron classes differ in their axonal and dendritic characteristics. (A) Percental distribution of axonal projections within defined layers of the dentate gyrus and hilus and CA3 derived from reconstructed interneurons. Class M1 cells (n = 7) show axon distributions largely in the granule cell layer (gcl), class M2 cells (n = 3) in the inner molecular layer (iml), class M3 neurons (n = 5) in the inner and middle molecular layer (iml, mml) and class M4 cells (n = 7) distribute axon collaterals in the middle and outer molecular layer (mml, oml). (B) Morphological neurolucida reconstructions of representative neurons belonging to class M1, M3, and M4. Lines surrounding neurons show how tiles were defined to determine the fractal dimensionality (f-dim) and density of the projected axon. Numbers represent f-dim values of the three shown representative cells. Scale bar, 50 µm. (C–E) Graphs summarize average axonal density (C), axonal area (D) and fractal dimension of the axon (E). Axonal density was determined by dividing total axonal length by the tile area. (F,G) Interneuron classes express differences in dendritic properties. (F) Cumulative dendritic distribution of interneuron classes in dependence on branch order. Note larger cumulative dendritic length between the 3rd and 5th branch order for class M3 and M4 neurons. (G) Pie charts represent differences in the length of the third order dendritic segment, the total dendritic length, the total dendritic surface area and the distribution area of dendrites among interneuron M classes (100% refers to the sum of the mean values from all M classes). (*, P < 0.05; **, P < 0.01; see also Supporting Information Tables 3 and 4).
In contrast, class M3 interneurons (five reconstructed cells) with cell bodies at the hilar-granule cell layer border distributed their axonal collaterals throughout the molecular layer (Fig. 2B; Supporting Information Fig. 5) with highest preference for the middle (41.7% ± 1.9%) and the inner thirds (31.3% ± 5.1%; Fig. 3A). This indicated that M3 cells predominantly form GABAergic synapses onto proximal and mid-distal apical dendrites and to a much lower degree onto the outer dendrites of their targets. These morphological properties are in agreement with the previously described total molecular layer interneurons (TML; blue color code in Figs. 2A and 6; Soriano und Frotscher, 1993; Buckmaster und Schwartzkroin, 1995; Mott et al., 1997). Although the total axonal length was comparable to values obtained from class M1 cells (M3 22.7 ± 2.5 mm versus M1 22.3 ± 2.3 mm), the projected axon covered a 142% larger area (129,749 ± 17,585 µm2; P < 0.01) and resulted thereby, in comparison to the other interneuron classes, in the lowest axonal density (0.2 ± 0.01 µm µm−2; Supporting Information Table 3; Fig. 3C) and the lowest fractal dimension (1.2 ± 0.04; Fig. 3E). Thus, class M3 cells seem to innervate target cell populations with a large spatial distribution but their connectivity is likely to be lower than that of M1 cells.
M2 cells took up an intermediate position between class M1 and M3 neurons (yellow code in Figs. 2A and 6). The axon collaterals were largely located within the inner molecular layer (53.6% ± 3.2%; three reconstructed cells) with some extending to the granule cell layer (15.5% ± 3.2%; Fig. 3A; Supporting Information Fig. 8A; Supporting Information Table 3). In agreement with the layer-specific distribution of axon collaterals among morphologically distinct interneuron types, the cumulative distribution of the axonal length as a function of Sholl distance was significantly different for the interneuron classes (Supporting Information Fig. 4), suggesting that these interneurons predominantly innervate the proximal apical dendrites of their postsynaptic partners. This axonal distribution pattern is in good agreement with the previously identified hilar commissural-associational pathway-associated cells (HICAPs; Halasy und Somogyi, 1993; Han et al., 1993; Buckmaster und Schwartzkroin 1995; Mott et al., 1997; Sik et al., 1997; Lübke et al., 1998). The total axonal length was 25% lower than for M1 and M3 neurons (16.7 ± 1.2 mm) and had the lowest number of branch points (Supporting Information Table 3). With axon collaterals covering an area of 80,822 ± 9,705 µm2 (Fig. 3D), M2 cells had an intermediate axonal density of 0.2 ± 0.03 µm µm−2. The density was 42% lower than for class M1 cells but similar to class M3 neurons (Supporting Information Table 3). Finally, the fractal dimension of the axon with 1.50 ± 0.03 (Fig. 3E) was smaller than the values obtained for M1 cells (P < 0.05; see below).
Axonal arbors of class M4 cells (seven reconstructed neurons) extended throughout the molecular layer with preference for the medial and outer molecular layer (35.5% ± 2.4% and 45.7% ± 9.1%, respectively; Figs. 2B and 3A). Four reconstructed cells had somata located at the hilus-granule cell layer border and resembled qualitatively hilar perforant path-associated cells with axon in the outer molecular layer (HIPP-like; purple code in Figs. 2A and 6; Supporting Information Fig. 7; Halasy und Somogyi, 1993; Han et al., 1993). However, the remaining three neurons had somata and dendrites located in the molecular layer and were therefore termed molecular layer cells (MLs; green code in Figs. 2A and 6; Supporting Information Fig. 6), corresponding to MOPP cells (Houser und Escalpez, 1994; Ceranik et al., 1997) and neurogliaform cells (Armstrong et al., 2011). Soma location did not contribute to this interneuron classification. Class M4 cells may play a key role in modulating synaptic inputs from the perforant path onto apical dendrites of their target cells. Interestingly, the area covered by the axon with (68,169 ± 10,447 µm2) in the transverse plane and the axonal density with 0.3 ± 0.02 µm µm−2 (Figs. 3B–D; Supporting Information Table 3) were comparable to those of class M1 cells (53,681 ± 5,331 µm2 and 0.4 ± 0.05 µm µm−2) reflecting a localized and dense axon. However, the moderate number of branch points (136 ± 21.3) and total length (18.8 ± 1.7 mm) resulted in a significantly lower mean fractal dimension of 1.38 ± 0.09 (Fig. 3E) than in M1 cells but a higher one than for class M3 cells.
Sholl Variables
We determined the Sholl variables, defined as the average total axonal length in 100 µm concentric rings (Supporting Information Fig. 8A; Supporting Information Table 3). In agreement with the layer-specific distribution of axon collaterals among morphologically distinct interneuron types, the cumulative distribution of the axonal length as a function of Sholl distance was significantly different for the interneuron classes (Supporting Information Fig. 8B). It was steeper for class M1, followed by M4 (BC-, ML/HIPP-like cells, respectively) and lowest for class M2 and M3 cells (HICAP-, TML-like, respectively). Class M1 and 43% of M4 cells started to arborize with their axon early after forming the axon initial segment and reached 47 and 30% of their total axonal length, respectively, at a Sholl distance of 100 µm (Supporting Information Fig. 8B). In contrast, the axon of M2 and M3 cells started to arborize later approaching ∼60% of the total axonal length at Sholl distances of 180–200 µm. Thus, M1 and M4 cells showed a local dense axonal arborization indicating locally high connectivity, whereas M2 and M3 cells showed a more widespread axon distribution indicating a spatially broader and weaker connectivity within the dentate gyrus circuitry.
Dendrite-Related Variables
To our surprise, PFA analysis indicated that the third order dendritic segment, but not the others, is one of the four dendrite-related key parameters for interneuron classification (Figs. 3F,G; Supporting Information Table 1). Additional dendrite-related key parameters were the total dendritic length, the total dendritic surface area and the distribution area of dendritic arbors (Fig. 3G). To understand why the third dendritic segment is an important parameter, we plotted in Figure 3F the cumulative dendritic length as a function of branch order. This relation was steeper for class M3 (TML-like) and M4 (ML-/HIPP-like) than for class M1 (BC-like) and M2 (HICAP-like) cells. Interestingly, the deviation in the steepness started to emerge at the third dendritic branch segment and continued to be significant among interneuron classes up to the fifth segment (P < 0.01; Fig. 3F). On the basis of the remaining three parameters a scenario emerges in which class M1 and M4 cells formed two opposing extremes. Class M1 cells had 119% longer dendrites than M4 cells (M1 5,423 ± 720 µm versus M4 2,477 ± 245 µm; P < 0.01), a 132% larger total surface area (M1 14,260 ± 2,549 µm2 versus M4 6,147 ± 620 µm2; P < 0.01; Supporting Information Table 4) and a 24% larger dendritic distribution area (M1 31,404 ± 4,439 µm2 versus M4 25,272 ± 3,032 µm2; P < 0.05). Thus, cells in class M1 may have the potential to receive highest numbers of synaptic inputs from the perforant and the commissural path as well as local granule cells and interneurons. On the contrary, class M4 cells showed the shortest dendrites and smallest mean dendritic surface area and therefore may receive lower numbers of synaptic input in the molecular layer of the dentate gyrus. Cells in class M2 and M3 expressed intermediate dendritic characteristics which brought them in a position in between the two extremes (Supporting Information Table 4).
Dentate Gyrus Interneurons Form Classes on the Basis of Passive and Active Membrane Properties
Next, we studied whether interneurons fall into physiological (P) classes on the basis of their passive and active membrane properties (Fig. 4). Electrophysiological analysis collected 34 variables related to passive and active membrane properties (Supporting Information Table 2). When all 34 physiological parameters were considered in the cluster analysis, neurons did not fall into distinct classes (data not shown). We therefore used MLA to identify parameters which were non-uniformly distributed in the interneuron population (Supporting Information Fig. 2; Materials and Methods). Three passive membrane properties, seven variables related to discharge patterns and three variables describing single action potentials were isolated (red labeled in Supporting Information Table 2). When cluster analysis was performed on the basis of these parameters, we observed that interneurons fell into three distinct classes with classes P1 and P2 separated by the largest linkage distance (>50%) from the remaining third class (P3; Fig. 4A).
FIGURE 4.

Cluster analysis of passive and active membrane properties reveal three distinct interneuron classes. (A) Cluster analysis based on three passive membrane properties, three characteristics related to single action potentials and five properties related to long-lasting discharge patterns selected by PFA (72 cells). Color code corresponds to the morphological interneuron types visually identified by light-microscopy (orange, BC-; green ML-; yellow, HICAP-; blue, TML-; purple, HIPP-like cells). (B) Representative discharge patterns of interneurons belonging to the three P classes during 1-s long depolarizing current injections of different amplitude. In gray, two examples of accommodating discharge patterns from class P3 are shown. The left one was obtained from a M2 (HICAP-like) and the right from a M3 (TML-like) interneuron. (C) Bar graphs summarize the three main passive and five active membrane properties related to discharge patterns that were selected for cluster analysis in A (*, P < 0.05; **, P < 0.01; see also Supporting Information Table 5).
Class-specific Physiological Differences
Which physiological parameters gave rise to interneuron classification? PFA revealed that among the passive membrane characteristics Rin, τm, and Vrest (Supporting Information Table 5) are involved in interneuron classification. Interestingly, only five properties related to spike trains and three factors defining single action potentials received highest scores in PFA analysis (>80%), indicating that they contributed largely to interneuron classification (Figs. 4 and 5; red asterisks in Supporting Information Table 2). The selected passive and active variables of the defined classes are presented in the following.
FIGURE 5.

Interneuron classes differ in properties related to single action potentials. (A) Representative traces of single action potentials recorded from interneurons representing classes P1-3. Upper traces represent the overshooting part of single spikes and lower traces the fast afterhyperpolarization (fAHP) of the same spike. In gray, two examples of single action potentials from class P3 are shown. The left one was obtained from a M2 (yellow, HICAP-like) and the right from a M3 (blue, TML-like) interneuron. (B) Superposition of single action potentials shown in A. Color code corresponds to class P1 (orange), class P2 (green) and class P3 (gray). (C) Bar graphs summarize the three active membrane properties related to single action potentials used in the cluster analysis shown in Figure 4A. Abbreviation: Vthres, threshold potential; amp, peak amplitude; HD, half-duration; FS, fast-spiking; STUT, stuttering; AC, accommodating (*, P < 0.05; **, P < 0.01; see also Supporting Information Table 6).
Passive Membrane Properties
P1 neurons were characterized by the lowest Rin (134.5 ± 10.3 MΩ; 23 cells; P < 0.01; Fig. 4C; Supporting Information Table 5). It was 19 and 39% lower than for the remaining cells in class P2 and P3, respectively. P2 cells were characterized by the fastest τm (7.1 ± 0.4 ms; 15 cells) which was together with the one of P1 neurons (11.6 ± 0.8 ms) significantly faster than the τm of P3 cells (15.1 ± 0.7 ms; 34 cells; P < 0.01; Fig. 4C). Furthermore, Vrest of P2 cells (−87.7 ± 1.2 mV) was ∼10 mV more negative than the average Vrest of class P1 and P3 cells (P1 −75.0 ± 0.9 mV; P3 −77.0 ± 1.3 mV; P < 0.01; Fig. 4C). Finally, the difference in Vrest between P1 and P3 was small but significant (P < 0.01; Fig. 4C).
Considering previously established nomenclatures based on axonal distribution patterns (Freund and Buzsáki, 1996), we observed a strong overlap between the morphological identity of interneurons in a given P class using light-microscopy and their electrophysiological membrane properties (Fig. 4A). P1 neurons were largely confined by BCs (orange code; 15 out of 23 visually identified P1 cells) and HIPP-like neurons (purple code; 8 out of 23 P1 cells). In contrast, P2 neurons were formed entirely by MLs (green code, 15 out of 15 visually identified P2 cells). Finally, class P3 cells were a highly heterogeneous group containing 44% HICAPs (yellow code), 47% TMLs (blue code) and 9% HIPP-like cells (purple code; 15, 16, and 3 out of 34 visually identified P3 cells, respectively).
High-frequency Discharge Patterns
Interneuron classification correlated highest with active membrane properties related to long-lasting trains of discharges and resulted in a scenario in which class P1 (BC-like, orange/HIPP-like, purple) cells were characterized by a nonaccommodating fast-spiking (FS) and class P2 (ML-like, green) neurons by a stuttering (STUT) discharge pattern. These two clusters showed the largest Euclidian distance of >50% (Fig. 4A). In contrast, class P3 cells (gray) discharged accommodating (AC) trains of action potentials and thus, took up an intermediate position between P1 and P2 (Figs. 4B,C). The discharge characteristics of the three groups were as follows:
First, action potential discharges of P1 FS cells increased steeply with increasing current injections thereby leading to a maximal average discharge frequency of 154.6 ± 9.8 Hz (23 cells) which was by ∼120% higher than the corresponding activities of class P2 STUT cells with 70.0 ± 5.3 Hz (15 cells, P < 0.01; Fig. 4C; Supporting Information Table 6). The low discharge frequency of P2 was largely due to the fact that STUTs fired brief bursts of high-frequent action potentials which were interrupted by periods of silence (Fig. 4B) with variable duration. The monotonically increasing accommodation of subsequently generated action potentials during a train of class P3 AC cells resulted in an intermediate average discharged frequency of 85.1 ± 3.9 Hz (34 cells), significantly lower than in class P1 FS cells (P < 0.01) but higher than the frequency observed in class P2 STUT cells (P < 0.05; Fig. 4C). Second, action potentials generated later in the train in P1 FS neurons showed only modest attenuation in their amplitude at constant spike threshold. This was reflected in a very low CV of amplitudes with 0.05 ± 0.01 (Fig. 4C). In contrast, attenuation in STUT cells was by 100% higher than in FS cells with a CV of 0.10 ± 0.01 (P < 0.01). Again, class P3 ACs took up an intermediate position with a mean CV of 0.06 ± 0.01, on average by 20% higher, albeit not significantly, than the one obtained in FS neurons and 40% lower than in STUT cells (P < 0.01; Fig. 4C). Third, the half-duration (HD) of action potentials during a train underwent a broadening. This broadening, as quantified by the CV, was smallest for FS cells, followed by AC cells and largest for STUT cells (Fig. 4C; Supporting Information Table 6). Thus, electrophysiological membrane properties shaping spike trains can be used as predictors for interneuron classification and can very likely be explained by different expression profiles of passive and active conductances.
Single Action Potential Waveform
Properties related to single action potentials resulted in the emergence of three classes with similar distributions of cells among classes P1-P3 as observed for spike trains (Fig. 5; Supporting Information Table 7). P1 FS neurons generated single action potentials with the shortest HD (0.4 ± 0.02 ms), fastest rate of rise (603 ± 30 V s−1) and largest fAHP (20.2 ± 0.7 mV) than class P2 STUT and class P3 AC cells (Figs. 5A,C; Supporting Information Table 7). FS and AC cells formed the two extremes whereas STUT cells took up an intermediate position (Fig. 5C; Supporting Information Table 7; AC cells: HD 0.6 ± 0.02 ms, rate of rise 400 ± 11 V s−1, fAHP 16.3 ± 0.7 mV; STUT cells HD 0.5 ± 0.02 ms, rate of rise 485 ± 21 V s−1, fAHP 17.7 ± 0.8 mV). Thus, single action potential properties are characteristic for the three interneuron P classes.
Correlation Between Morphological and Physiological Parameters
To test whether a correlation between physiological and anatomical variables exists, we used the following two approaches (Fig. 6). We used a cross-correlation analysis between morphological and physiological parameters (Fig. 6A). Subsequently, we performed cluster analysis on the basis of morphological variables obtained from 22 rigorously identified interneurons and their passive and active membrane properties (Fig. 6B). Crosscorrelation analysis revealed a significant relationship between specific morphological and physiological criteria. First, the total dendritic length and dendritic surface area were significantly related to properties describing the discharge pattern of interneurons such as the CV of the peak amplitude, the HD and the decay time constant of subsequently generated action potentials (Fig. 6A). Second, characteristics related to the density and layer-specific distribution of the axon correlated with single spike as well as continuous discharge characteristics (Fig. 6A). Third, one dendritic and two axonal properties showed significant relations to passive membrane characteristics. Although there was a significant correlation between some M and P parameters, it was not possible to directly assign P to M classes. We therefore applied a combined morphological and physiological cluster analysis of the 22 rigorously identified interneuons. We found that interneurons fell into the following five classes with distinct anatomical and physiological properties (Fig. 6B): FS non-AC BCs with axon collaterals primarily located in the granule cell layer (orange); AC and moderately slow spiking HICAP cells with axon largely confined to the inner molecular layer (yellow); AC TML cells with axonal distribution in the total molecular layer (blue), FS HIPP-like neurons (purple) with axon collaterals largely constrained to the outer and medial molecular layer and finally STUT ML cells (green) with dense axon and dendrites in the entire molecular layer.
In summary, our data show that the combination of morphological and physiological parameters is required for unequivocal classification of all dentate gyrus interneurons examined in this study.
DISCUSSION
Our combined morphological, electrophysiological and cluster analysis revealed well-defined interneuron classes. Physiological and morphological parameters showed a strong correlation and after combining these two parameter spaces, five classes emerged with each class represented by a distinct set of anatomical and electrophysiological criteria. Thus, inhibitory cells do not form a continuum as previously proposed (Mott et al., 1997; Parra et al., 1998; Baraban and Talent, 2004) but distinct classes (see also Han et al., 1993; Lübke et al., 1998; Armstrong et al., 2011) reflecting functionally defined inhibitory units with specialized computational functions within the neuronal network of the dentate gyrus.
Morphological Clusters and Interneuron Specification
Our cluster analysis revealed a clear separation of interneurons on the basis of their dendritic and axonal parameters. Key morphological parameters underlying the clustering were the layer-specific distribution of the axon, its length and its density in the transverse plane. However, some overlap among classes was also evident. For example, class M1 cells were largely formed by interneurons with axon collaterals in the principal cell layer (five out of seven cells) thereby forming perisomatic contacts. This class included BC-like cells (Fig. 2) but probably also AAs. Although we did not perform electron-microscopical investigations to distinguish between BCs and AAs, we believe that due to a low abundance of AAs (10–15%; Freund and Buzsáki, 1996), our sample will mostly comprise BCs and few AAs. Class M1 included also cells with axon collaterals in the inner molecular and granule cell layer which have been previously described as HICAPs (Han et al., 1993; Buckmaster und Schwartzkroin 1995; Mott et al., 1997). What could be the reason for the contribution of the two HICAP-like cells in class M1? Both neurons had a high axonal length (22.3 and 18.6 mm) similar to the mean value obtained from BC-like cells in the same class (23.5 mm; five cells) but higher than the average axonal length of class M2 HICAP-like neurons (16.7 mm; Supporting Information Table 3). Furthermore, both cells had ∼20% of their axonal arbors located in the granule cell layer thereby deviating from the low average axonal distribution of class M2 HICAP-like neurons in the granule cell layer with 15.5% (three cells; Supporting Information Table 3). They further expressed 26% of their axon in the hilus which was observed for five BC-like class M1 neurons with 14.6%. These data suggest that a morphological overlap between BC- and HICAP-like neurons may exist. Furthermore, HICAPs appear to be heterogeneous and may comprise two subtypes which could explain their presence in two major M classes (M1 and M2). Similarly, class M4 interneurons were formed by three ML and four HIPP-like neurons with axon collaterals extending in the middle and outer molecular layer. Although axonal density tended to be higher in ML- than HIPP-like cells, their overlap in the layer-specific distribution of the axon was strong and thus contributed very likely to their common classification.
One limitation of our study was that recordings have been performed from cells located >60 µm below the slice surface. Nevertheless, we can not fully exclude that parts of the axonal fibers and dendrites were cut during the procedure of slice preparation. All morphological criteria in this study have been determined from cells in adolescent (P18-25) mice. As the major morphological characteristics of interneuron types will not show major alterations during further maturation, we expect that these criteria may undergo small changes during the course of the subsequent 2–3 weeks until animals reach their adult stage.
Correlation Between Morphological and Physiological Properties
GABAergic cells fell into four morphological classes but diverged into three physiological classes with strong overlap among BC- and HIPP-like neurons in class P1 and between TML-, ML-, and HIPP-like cells in class P3 (Fig. 4A). Interestingly, ML cells formed an exception; they could be classified on the basis of only their electrophysiological characteristics. TML cells could be largely but not entirely classified on the basis of electrophysiological parameters. For the remaining interneurons, however, electrophysiological criteria were not sufficient for classification of all interneuron types in the dentate gyrus. Indeed, a combination of morphological and physiological characteristics resulted in the emergence of five classes with strong correlations between morphologically defined interneuron types and physiological properties (Fig. 6B). Morphological parameters related to the axon and dendrites correlated strongly with the single spike shape and frequency-dependent alteration in the size and time course of subsequently generated action potentials (Fig. 6A). Thus, a link between neuronal structure and its function seems to exist on a single class level.
Our data show similarities and differences to previous findings by Mott et al. (1997) on interneuron identification in rat dentate gyrus. In both studies similar morphological interneuron subtypes have been identified. However, the study by Mott et al. (1997) did not allow a division of interneurons into defined classes and consequently proposed the continuum hypothesis. Contrasts between this and our study may have been caused by differences in the number of recorded cells, quality and extent in single cell preservation and labeling as well as electrophysiological measurements. In our study Vrest (when not corrected for liquid junction potential) was on average ∼5 mV more negative, Rin values markedly lower and τm values faster. Alternatively, species-specific differences in the intrinsic passive properties of interneurons may exist. Furthermore, to improve structural preservation of the interneurons, we deliberately aimed to record and label cells deeper in the slices (>60 µm).
How do the identified morphological and physiological parameters of interneurons in the dentate gyrus reported in this study compare to the characteristics of interneuron types identified in the hippocampus? This comparison is only possible to a limited extent due to differences in the layer-specific organization of hippocampal areas between CA1, CA3, and the dentate gyrus. Clear similarities exist among perisomatic-inhibitory BCs and AAs in all hippocampal areas including the dentate gyrus. The fast nonaccommodating discharge pattern, the low Rin, the fast τm and the dense axonal collaterals in principal cell layers have been uniformly identified for hippocampal BCs (Freund and Buzsáki, 1996; Bartos et al., 2002; Klausberger and Somogyi, 2008). Similarly, interneurons with soma and dendrites in stratum oriens-alveus (OA) of CA1 and dense axon projections in the stratum lacunosum moleculare (Maccaferri and McBain, 1996) have been thought to correspond to dentate gyrus HIPP cells (Freund and Buzsáki, 1996) and discharge similar to HIPP neurons action potentials at high rates (>100 Hz) with nonaccommodating patterns when depolarized with long-lasting current injections (Zhang and McBain, 1995; Lien and Jonas, 2002). The innervation of proximal apical dendrites and the expression of cholecystokinine (CCK) suggests that HICAP cells may be related to mossy fiber-associated interneurons of the CA3 area (Vida and Frotscher, 2000; Losonczy et al., 2004). Finally, ML cells include neurogliaform cells (Armstrong et al., 2011) found among the apical dendritic layers of all other subfields of the hippocampus and the neocortex (Vida et al., 1998; Tamas et al., 2003). Further, direct comparisons between the remaining dentate gyrus interneuron types and identified CA1 or CA3 GABAergic cells can not be made due to the marked differences in the hippocampal layering.
Functional Relevance of Correlated Morphological and Physiological Characteristics
Dendritic processing of synaptic inputs involves passive and active membrane mechanisms and can substantially modify the impact of synaptic signals on the activity of a cell (Rall, 1977; Jack et al., 1983; Johnston and Wu, 1995; Mainen and Sejnowski, 1996). Laminar distribution of the dendrites defines what synaptic inputs the cell may receive whereas the differences in the morphological pattern of dendritic arborization (e.g., length, diameter, number of branch points) will lead to differential dendritic processing and integration of synaptic inputs (Emri et al., 2001; Nörenberg et al., 2010). As EPSPs propagate from the location of their initiation at the dendrite to the soma, they undergo attenuation and prolongation. The degree of attenuation is defined by the location of input synapses (e.g., distal entorhinal cortex inputs via the perforant path in the outer molecular layer versus proximal mossy cell inputs via the commissural-associational path in the inner molecular layer) but also on the dendritic geometry and specific membrane resistance (Rm) of the dendritic membrane. Our data indicate that Rm varies among interneuron classes. For example, BC-like cells (class 1) have large diameter dendrites with passive membrane properties (Hu et al., 2010). Their Rin is low (<150 MΩ) and τm is fast (∼10 ms), suggesting a low Rm because τm = RmCm with Cm defining the capacitance of a given membrane area (Nörenberg et al., 2010). Consequently, distal EPSPs propagating to the soma will be strongly attenuated. However, they will have a fast time course because of the fast τm. In contrast, TML-like (class 3) interneurons have a high Rm as indicated by the high Rin (>150 MΩ) and slow τm (>10 ms; Supporting Information Table 5). Therefore, distally evoked EPSPs will show a weaker attenuation at the soma than BC-like class1 cells but substantial deceleration. Consequently, temporal summation will be restricted in BC-like class 1 cells to narrow time windows supporting coincidence detection whereas in TML-like class 3 neurons temporal summation will dominate. Thus, interneuron types equipped with different morphological and physiological properties will support cell class-specific processing of excitatory inputs.
As a function of the location of output synapses as well as the functional and dynamic properties of IPSCs, interneuron types will differentially impact the activity of their target cells (Hefft and Jonas, 2005). Somatic synapses have been shown to control spike discharges, to contribute to the generation of high-frequency network oscillations (Cobb et al., 1995; Buzsáki and Draguhn, 2004) and the emergence of coactive cell assemblies (Csicsvari et al., 2003). In contrast, dendritic inhibitory synapse may control synaptic integration, dendritic electrogenesis and synaptic plasticity (Lamsa et al., 2005; Bartos et al., 2011). Interestingly, the proposed functions for dendrite inhibiting cells seem to be highly layer-specific (Han et al., 1993; Vida et al., 1998), thus controlling excitatory inputs from distinct sources. Accordingly, HIPP-like class 4 and ML-like class 5 cells seem to preferentially control perforant path-mediated whereas HICAP-like class 2 cells may control commissural-associational path-mediated inputs. Further investigations will be required to examine the functional role of interneuron classes in the processing of information at the microcircuit level.
Taken together, our data are not consistent with the continuum hypothesis but instead demonstrate that interneurons fall into diverse classes with defined morpho-physiological characteristics. Indeed, we present evidence that morphological and physiological properties are correlated and suggest a division of labour among interneuron classes with distinct functional roles in the network. These properties define information processing in each class and indicate how interneurons of a certain class may enhance the large computational power of neuronal circuits.
Acknowledgments
The authors thank Drs. Jonas-Frederic Sauer and Claudio Elgueta for critically reading the manuscript. They also thank Karin Winterhalter, Margit Northemann and Ulrich Nöller for technical assistance. The authors declare that there is no conflict of interest.
Supporting Information
Additional Supporting Information may be found in the online version of this article.
Supporting Information Figure 1. Morphological properties of identified GAD67-eGFP cells are not uniformly distributed. The distribution of dendritic and axonal properties was tested by using maximum likelihood analysis (MLA; see Materials and Methods). Each of the 31 variables was fit with one and the sum of two or more Gaussian functions (Mathematica, 4.2). Only variables with a non-uniform distribution (best fit with the sum of two or three Gaussian functions) were used for subsequent cluster analysis. Black lines indicate distribution of the original data obtained from all reconstructed cells for three representative morphological parameters (axonal density, axonal length, dendritic length). The gray line describes the best fit of the data distribution using MLA. Arrows point to modes of the two or three Gaussian functions fit to the original data.
Supporting Information Figure 2. Electrophysiological properties of identified GAD67-eGFP cells are not uniformly distributed. The distribution of passive and active membrane properties was tested by using MLA (see Materials and Methods). Each of the electrophysiological variables was fit with one and the sum of two and three Gaussian functions (gray line). Here representative variables are shown which could be best fit with the sum of two or three Gaussian functions. Arrows point to the modes of the two or three Gaussian functions. Variables with a non-uniform distribution were used for subsequent cluster analysis. Black lines show distribution of the binned data for eight electrophysiological parameters related to passive membrane properties (membrane time constant [τm], membrane resting potential [Vrest]) and characteristics related to trains of high frequent action potentials (700 pA, 1 s).
Supporting Information Figure 3. Basket cell (BC)-like neurons (class 1) contributed to classes M1 and P1 (orange code in Fig. 2A,4A,6B). (A,B,C) Three representative Neurolucida reconstructions of class 1 neurons. Soma and dendrites are shown in black and the axon projections in the granule cell layer (gcl) are shown in red. Note, some class 1 cells show axon collaterals in the hilus. (D) Schematic representation of class 1 morphology (modified from Freund and Buzsáki, 1996). Soma and dendrites are depicted in black and the axon in gray. Numbers (n) represent the total number of (rigorously and visually) identified class 1 cells. Scale bar 100 μm; ml, molecular layer.
Supporting Information Figure 4. Hilar commissural associational pathway related (HICAP)-like cells (class 2) contributed to classes M2 and P3 (yellow code in Fig. 2A,4A,6B). (A,B) Two representative Neurolucida reconstructions are shown. Note, the axonal arborisation distributed in the inner part of the molecular layer (ml). Soma and dendrites are shown in black and the axon in red. A subset of cells showed axon projections in the hilus. (C) Schematic representation of class 2 morphology (modified from Freund and Buzsáki, 1996). Soma and dendrites are depicted in black and the axon in gray. Numbers (n) represent the total of rigorously and visually identified HICAP cells. Scale bar 100 μm; gcl, granule cell layer.
Supporting Information Figure 5. Total molecular layer (TML)-like cells (class 3) contributed to classes M3 and P3 (blue code in Fig. 2A,4A,6B). (A,B) Two representative Neurolucida reconstructions of class 3 cells are shown. Note, the axonal arborization distributed throughout the molecular layer (ml). Soma and dendrites are shown in black and the axon in red. (C) Schematic representation of TML morphology (modified from Freund and Buzsáki, 1996). Soma and dendrites are depicted in black and the axon in gray. Bright gray region in the hilus indicates low axonal projections in this area (< 0.5% of total axonal length). Numbers (n) represent the total of rigorously and visually identified TML-like cells. Scale bar 100 μm; gcl, granule cell layer.
Supporting Information Figure 6. Molecular layer (ML)-like cells (class 5) contributed to classes M4 and formed P2 (green code in Fig. 2A,4A,6B) with axon in the molecular layer, previously also termed MOPP cells (Han et al., 1993). (A,B) Two representative Neurolucida reconstructions of ML-like cells are shown. Note, soma, dendrites and the axonal arborization distributed throughout the molecular layer (ml) and in one case crossed the hippocampal fissure (Ceranik et al., 1997). Soma and dendrites are shown in black and the axon in red. (C) Schematic representation of class 4 morphology (modified from Freund and Buzsáki, 1996). Soma and dendrites are depicted in black and the axon in gray. Numbers (n) represent the total of rigorously and visually identified ML-like cells. Scale bar 100 μm; gcl, granule cell layer.
Supporting Information Figure 7. Hilar perforant path-associated (HIPP)-like cells (class 4) fall in classes M4, P1 and P3 (purple code in Fig. 2A,4A,6B) with axon predominantly located in the outer two thirds of the molecular layer. (A) Two reconstructions of HIPP-like cells are shown. Note, soma, dendrites are located at the gcl-hilus border and the axonal arborization is distributed in the molecular layer (ml). Close to the axon initial segment of the left cell the axon also arborizes in the inner molecular layer thereby representing a non-classical HIPP cell. Soma and dendrites are shown in black and the axon in red. (B) Schematic representation of a HIPP-like morphology (modified from Freund and Buzsáki, 1996). Soma and dendrites are depicted in black and the axon in gray. Bright gray area indicates that on average axon projections are weak in the inner molecular layer. Numbers (n) represent the total of rigorously and visually identified HIPP-like neurons. Scale bar 100 μm; gcl, granule cell layer.
Supporting Information Figure 8. Axonal Sholl distribution differs among classes. (A) Schematic illustration of the Sholl analysis. Concentric rings were centered at the centroid of the soma with a stepwise increasing radius of 100 μm. (B). Cumulative distribution of axonal length of each interneuron M class defined as the percentage of the total axonal length in each 100 μm concentric circle starting from the soma. Data points are averages from reconstructed interneurons (*p < 0.05; **p < 0.01).
Supporting Information Figure 9. Micrographs of representative class 1 - 5 cells. Micrographs of DAB-labeled interneurons are shown for class 1 - 5. Arrows point to axonal projections. Dotted lines represent borders between the hilus and the granule cell layer (gcl), between the gcl and the molecular layer (ml) and in case of the class 4 cell, the hippocampal fissure.
Supporting Information Table 1.
Supporting Information Table 2.
Supporting Information Table 3.
Supporting Information Table 4.
Supporting Information Table 5.
Supporting Information Table 6.
Supporting Information Table 7.
REFERENCES
- Ali AB, Bannister AP, Thomson AM. IPSPs elicited in CA1 pyramidal cells by putative basket cells in slices of adult rat hippocampus. Eur J Neurosci. 1999;11:1741–1753. doi: 10.1046/j.1460-9568.1999.00592.x. [DOI] [PubMed] [Google Scholar]
- Amaral DG. A Golgi study of cell types in the hilar region of the hippocampus in the rat. J Comp Neurol. 1978;182:851–914. doi: 10.1002/cne.901820508. [DOI] [PubMed] [Google Scholar]
- Armstrong C, Szabadics J, Tamás G, Soltesz I. Neurogliaform cells in the molecular layer of the dentate gyrus as feed-forward γ-aminobutyric acidergic modulators of entorhinal-hippocampal interplay. J Comp Neurol. 2011;519:1476–1491. doi: 10.1002/cne.22577. [DOI] [PMC free article] [PubMed] [Google Scholar]
- Baraban SC, Tallent MK. Interneuron diversity series: Interneuronal neuropeptides-endogenous regulators of neuronal excitability. TINS Neurosci. 2004;27:135–142. doi: 10.1016/j.tins.2004.01.008. [DOI] [PubMed] [Google Scholar]
- Bartos M, Vida I, Jonas P. Synaptic mechanisms of synchronized gamma oscillations in inhibitory interneuron networks. Nat Rev Neurosci. 2007;8:45–56. doi: 10.1038/nrn2044. [DOI] [PubMed] [Google Scholar]
- Bartos M, Vida I, Frotscher M, Geiger JR, Jonas P. Rapid signaling at inhibitory synapses in a dentate gyrus interneuron network. J Neurosci. 2001;21:2687–2698. doi: 10.1523/JNEUROSCI.21-08-02687.2001. [DOI] [PMC free article] [PubMed] [Google Scholar]
- Bartos M, Vida I, Frotscher M, Meyer A, Moyer H, Geiger JRP, Jonas P. Fast synaptic inhibition promotes synchronized gamma oscillations in hippocampal interneuron networks. Proc Natl Acad Sci USA. 2002;99:13222–13227. doi: 10.1073/pnas.192233099. [DOI] [PMC free article] [PubMed] [Google Scholar]
- Bartos M, Alle H, Vida I. Role of microcircuit structure and input integration in hippocampal interneuron recruitment and plasticity. Neuropharmacology. 2011;60:730–739. doi: 10.1016/j.neuropharm.2010.12.017. [DOI] [PubMed] [Google Scholar]
- Baude A, Bleasdale C, Dalezios Y, Somogyi P, Klausberger T. Immunoreactivity for the GABAA receptor α1 subunit, somatostatin and Connexin36 distinguishes axoaxonic, basket, and bistratified interneurons of the rat hippocampus. Cereb Cortex. 2007;17:2094–2107. doi: 10.1093/cercor/bhl117. [DOI] [PubMed] [Google Scholar]
- Bekkers JM, Delaney AJ. Modulation of excitability by α−dendrotoxin-sensitive potassium channels in neocortical pyramidal neurons. J Neurosci. 2001;21:6553–6560. doi: 10.1523/JNEUROSCI.21-17-06553.2001. [DOI] [PMC free article] [PubMed] [Google Scholar]
- Buckmaster PS, Schwartzkroin PA. Interneurons and inhibition in the dentate gyrus of the rat in vivo. J Neurosci. 1995;15:774–789. doi: 10.1523/JNEUROSCI.15-01-00774.1995. [DOI] [PMC free article] [PubMed] [Google Scholar]
- Buhl EH, Han ZS, Lorinczi Z, Stezhka VV, Karnup SV, Somogyi P. Physiological properties of anatomically identified axo-axonic cells in the rat hippocampus. J Neurophysiol. 1994;71:1289–1307. doi: 10.1152/jn.1994.71.4.1289. [DOI] [PubMed] [Google Scholar]
- Buzsáki G, Chrobak JJ. Temporal structure in spatially organized neuronal ensembles: A role for interneuronal networks. Curr Opin Neurobiol. 1995;5:504–510. doi: 10.1016/0959-4388(95)80012-3. [DOI] [PubMed] [Google Scholar]
- Buzsáki G, Draguhn A. Neuronal oscillations in cortical networks. Science. 2004;304:1926–1929. doi: 10.1126/science.1099745. [DOI] [PubMed] [Google Scholar]
- Cauli B, Porter JT, Tsuzuki K, Lambolez B, Rossier J, Quenet B, Audinat E. Classification of fusiform neocortical interneurons based on unsupervised clustering. Proc Natl Acad Sci USA. 2000;97:6144–6149. doi: 10.1073/pnas.97.11.6144. [DOI] [PMC free article] [PubMed] [Google Scholar]
- Ceranik K, Bender R, Geiger J, Monyer H, Jonas P, Frotscher M, Lübke J. A novel type of interneurons connecting the output regions of the hippocampus. J Neurosci. 1997;17:5380–5394. doi: 10.1523/JNEUROSCI.17-14-05380.1997. [DOI] [PMC free article] [PubMed] [Google Scholar]
- Cobb SR, Buhl EH, Halasy K, Paulsen O, Somogyi P. Synchronization of neuronal activity in hippocampus by individual GABAergic interneurons. Nature. 1995;378:75–78. doi: 10.1038/378075a0. [DOI] [PubMed] [Google Scholar]
- Cossart R, Petanjek Z, Dumitriu D, Hirsch JC, Ben-Ari Y, Esclapez M, Bernard C. Interneurons targeting similar layers receive synaptic inputs with similar kinetics. Hippocampus. 2006;16:408–420. doi: 10.1002/hipo.20169. [DOI] [PubMed] [Google Scholar]
- Csicsvari J, Jamieson B, Wise KD, Buzsáki G. Mechanisms of gamma oscillations in the hippocampus of the behaving rat. Neuron. 2003;37:311–322. doi: 10.1016/s0896-6273(02)01169-8. [DOI] [PubMed] [Google Scholar]
- Dávid C, Schleicher A, Zuschratter W, Staiger JF. The innervation of parvalbumin-containing interneurons by VIP-immunopositive interneurons in the primary somatosensory cortex of the adult rat. Eur J Neurosci. 2007;25:2329–2340. doi: 10.1111/j.1460-9568.2007.05496.x. [DOI] [PubMed] [Google Scholar]
- Doischer D, Hosp JA, Yanagawa Y, Obata K, Jonas P, Vida I, Bartos M. Postnatal differentiation of basket cells from slow to fast signaling devices. J Neurosci. 2008;28:12956–12968. doi: 10.1523/JNEUROSCI.2890-08.2008. [DOI] [PMC free article] [PubMed] [Google Scholar]
- Dumitriu D, Cossart R, Huang J, Yuste R. Correlation between axonal morphologies and synaptic input kinetics of interneurons from mouse visual cortex. Cereb Cortex. 2007;17:81–91. doi: 10.1093/cercor/bhj126. [DOI] [PubMed] [Google Scholar]
- Emri Z, Antal K, Gulyas AI, Megias M, Freund TF. Electrotonic profile and passive propagation of synaptic potentials in three subpopulations of hippocampal CA1 interneurons. Neurosci. 2001;104:1013–1026. doi: 10.1016/s0306-4522(01)00136-1. [DOI] [PubMed] [Google Scholar]
- Epsztein J, Milh M, Bihi RI, Jorquera I, Ben-Ari Y, Represa A, Crépel V. Ongoing epileptiform activity in the post-ischemic hippocampus is associated with a permanent shift of the excitatory-inhibitory synaptic balance in CA3 pyramidal neurons. J Neurosci. 2006;26:7082–7092. doi: 10.1523/JNEUROSCI.1666-06.2006. [DOI] [PMC free article] [PubMed] [Google Scholar]
- Freund TF. Interneuron diversity series: Rhythm and mood in perisomatic inhibition. TINS. 2003;26:489–495. doi: 10.1016/S0166-2236(03)00227-3. [DOI] [PubMed] [Google Scholar]
- Freund TF, Buzsáki G. Interneurons of the hippocampus. Hippocampus. 1996;6:347–470. doi: 10.1002/(SICI)1098-1063(1996)6:4<347::AID-HIPO1>3.0.CO;2-I. [DOI] [PubMed] [Google Scholar]
- Gidon A, Segev I. Principles governing the operation of synaptic inhibition in dendrites. Neuron. 2012;75:330–341. doi: 10.1016/j.neuron.2012.05.015. [DOI] [PubMed] [Google Scholar]
- Gloveli T, Dugladze T, Saha S, Monyer H, Heinemann U, Traub RD, Whittington MA, Buhl EH. Differential involvement of oriens/pyramidale interneurones in hippocampal network oscillations in vitro. J Physiol. 2005;562:131–147. doi: 10.1113/jphysiol.2004.073007. [DOI] [PMC free article] [PubMed] [Google Scholar]
- Gulledge AT, Stuart GJ. Excitatory actions of GABA in the cortex. Neuron. 2003;37:299–309. doi: 10.1016/s0896-6273(02)01146-7. [DOI] [PubMed] [Google Scholar]
- Gupta A, Wang Y, Markram H. Organizing principles for a diversity of GABAergic interneurons and synapses in the neocortex. Science. 2000;287:273–278. doi: 10.1126/science.287.5451.273. [DOI] [PubMed] [Google Scholar]
- Hájos N, Pálhalmi J, Mann EO, Németh B, Paulsen O, Freund TF. Spike timing of distinct types of GABAergic interneuron during hippocampal gamma oscillations in vitro. J Neurosci. 2004;24:9127–9137. doi: 10.1523/JNEUROSCI.2113-04.2004. [DOI] [PMC free article] [PubMed] [Google Scholar]
- Halasy K, Somogyi P. Subdivisions in the multiple GABAergic innervation of granule cells in the dentate gyrus of the rat hippocampus. Eur J Neurosci. 1993;5:411–429. doi: 10.1111/j.1460-9568.1993.tb00508.x. [DOI] [PubMed] [Google Scholar]
- Han ZS, Buhl EH, Lörinczi Z, Somogyi P. A high degree of spatial selectivity in the axonal and dendritic domains of physiologically identified local-circuit neurons in the dentate gyrus of the rat hippocampus. Eur J Neurosci. 1993;5:395–410. doi: 10.1111/j.1460-9568.1993.tb00507.x. [DOI] [PubMed] [Google Scholar]
- Hefft S, Jonas P. Asynchronous GABA release generates long-lasting inhibition at a hippocampal interneuron-principal neuron synapse. Nat Neurosci. 2005;8:1319–1328. doi: 10.1038/nn1542. [DOI] [PubMed] [Google Scholar]
- Houser CR, Esclapez M. Localization of mRNAs encoding two forms of glutamic acid decarboxylase in the rat hippocampal formation. Hippocampus. 1994;4:530–545. doi: 10.1002/hipo.450040503. [DOI] [PubMed] [Google Scholar]
- Hu H, Martina M, Jonas P. Dendritic mechanisms underlying rapid synaptic activation of fast-spiking hippocampal interneurons. Science. 2010;327:52–58. doi: 10.1126/science.1177876. [DOI] [PubMed] [Google Scholar]
- Jack JJB, Noble D, Tsien RW. Electric Current Flow in Excitable Cells. Oxford, UK: Clarendon Press; 1983. [Google Scholar]
- Johnston D, Wu SM-S. Foundations of Cellular Neurophysiology. Cambridge, USA: MIT Press; 1995. [Google Scholar]
- Kawaguchi Y, Kubota Y. GABAergic cell subtypes and their synaptic connections in rat frontal cortex. Cereb Cortex. 1997;7:476–486. doi: 10.1093/cercor/7.6.476. [DOI] [PubMed] [Google Scholar]
- Klausberger T, Somogyi P. Neuronal diversity and temporal dynamics: The unity of hippocampal circuit operations. Science. 2008;321:53–57. doi: 10.1126/science.1149381. [DOI] [PMC free article] [PubMed] [Google Scholar]
- Klausberger T, Magill PJ, Márton LF, Roberts JD, Cobden PM, Buzsáki G, Somogyi P. Brain-state- and cell-type-specific firing of hippocampal interneurons in vivo. Nature. 2003;421:844–848. doi: 10.1038/nature01374. [DOI] [PubMed] [Google Scholar]
- Klausberger T, Marton LF, Baude A, Roberts JD, Magill PJ, Somogyi P. Spike timing of dendrite-targeting bistratified cells during hippocampal network oscillations in vivo. Nat Neurosci. 2004;7:41–47. doi: 10.1038/nn1159. [DOI] [PubMed] [Google Scholar]
- Kosaka T, Katsumaru H, Hama K, Wu JY, Heizmann CW. GABAergic neuron containing the Ca2+-binding protein parvalbumin in the rat hippocampus and dentate gyrus. Brain Res. 1987;419:119–130. doi: 10.1016/0006-8993(87)90575-0. [DOI] [PubMed] [Google Scholar]
- Lamsa K, Heeroma JH, Kullmann DM. Hebbian LTP in feed-forward inhibitory interneurons and the temporal fidelity of input discrimination. Nat Neurosci. 2005;8:916–924. doi: 10.1038/nn1486. [DOI] [PubMed] [Google Scholar]
- Lien CC, Martina M, Schultz JH, Ehmke H, Jonas P. Gating, modulation and subunit composition of voltage-gated K(+) channels in dendritic inhibitory interneurones of rat hippocampus. J Physiol. 2002;538:405–419. doi: 10.1113/jphysiol.2001.013066. [DOI] [PMC free article] [PubMed] [Google Scholar]
- Lorente de NóR. Studies on the structure of the cerebral cortex II. Continuation of the study of the ammonic system. J Psychol Neurol. 1934;46:113–177. [Google Scholar]
- Losonczy A, Biró AA, Nusser Z. Persistently active cannabinoid receptors mute a subpopulation of hippocampal interneurons. Proc Natl Acad Sci USA. 2004;101:1362–1367. doi: 10.1073/pnas.0304752101. [DOI] [PMC free article] [PubMed] [Google Scholar]
- Lübke J, Frotscher M, Spruston N. Specialized electrophysiological properties of anatomically identified neurons in the hilar region of the rat fascia dentata. J Neurophysiol. 1998;79:1518–1534. doi: 10.1152/jn.1998.79.3.1518. [DOI] [PubMed] [Google Scholar]
- Maccaferri G, McBain CJ. Long-term potentiation in distinct subtypes of hippocampal nonpyramidal neurons. J Neurosci. 1996;16:5334–5343. doi: 10.1523/JNEUROSCI.16-17-05334.1996. [DOI] [PMC free article] [PubMed] [Google Scholar]
- Maccaferri G, Lacaille JC. Interneuron diversity series: Hippocampal interneuron classifications-making things as simple as possible, not simpler. TINS. 2003;26:564–571. doi: 10.1016/j.tins.2003.08.002. [DOI] [PubMed] [Google Scholar]
- Maddock L, Young JZ. Quantitative differences among the brains of cephalopods. J Zool (Lond) 1987;212:739–767. [Google Scholar]
- Mainen ZF, Sejnowski TJ. Influence of dendritic structure on firing pattern in model neocortical neurons. Nature. 1996;382:363–366. doi: 10.1038/382363a0. [DOI] [PubMed] [Google Scholar]
- Miettinen R, Gulyás AI, Baimbridge KG, Jacobowitz DM, Freund TF. Calretinin is present in non-pyramidal cells of the rat hippocampus-II. Co-existence with other calcium binding proteins and GABA. Neuroscience. 1992;48:29–43. doi: 10.1016/0306-4522(92)90335-y. [DOI] [PubMed] [Google Scholar]
- Miles R, Tóth K, Guljás AI, Hájos N, Freund TF. Differences between somatic and dendritic inhibition in the hippocampus. Neuron. 1996;16:815–823. doi: 10.1016/s0896-6273(00)80101-4. [DOI] [PubMed] [Google Scholar]
- Mott DD, Turner DA, Okazaki MM, Lewis DV. Interneurons of the dentate-hilus border of the rat dentate gyrus: Morphological and electrophysiological heterogeneity. J Neurosci. 1997;17:3990–4005. doi: 10.1523/JNEUROSCI.17-11-03990.1997. [DOI] [PMC free article] [PubMed] [Google Scholar]
- Mountcastle VB, Talbot WH, Sakata H, Hyvärinen J. Cortical neuronal mechanisms in flutter-vibration studied in unanesthetized monkeys. Neuronal periodicity and frequency discrimination. J Neurophysiol. 1969;32:452–484. doi: 10.1152/jn.1969.32.3.452. [DOI] [PubMed] [Google Scholar]
- Nörenberg A, Hu H, Vida I, Bartos M, Jonas P. Distinct nonuniform cable properties optimize rapid and efficient activation of fast-spiking GABAergic interneurons. Proc Natl Acad Sci USA. 2010;107:894–899. doi: 10.1073/pnas.0910716107. [DOI] [PMC free article] [PubMed] [Google Scholar]
- Oliva AA, Jr, Jiang M, Lam T, Smith KL, Swann JW. Novel hippocampal interneuronal subtypes identified using transgenic mice that express green fluorescent protein in GABAergic interneurons. J Neurosci. 2000;20:3354–3368. doi: 10.1523/JNEUROSCI.20-09-03354.2000. [DOI] [PMC free article] [PubMed] [Google Scholar]
- Parra P, Gulyás AI, Miles R. How many subtypes of inhibitory cells in the hippocampus? Neuron. 1998;20:983–993. doi: 10.1016/s0896-6273(00)80479-1. [DOI] [PubMed] [Google Scholar]
- Petilla Interneuron Nomenclature Group. Petilla terminology: Nomenclature of features of GABAergic interneurons of the cerebral cortex. Nat Rev Neurosci. 2008;9:557–568. doi: 10.1038/nrn2402. [DOI] [PMC free article] [PubMed] [Google Scholar]
- Pouille F, Scanziani M. Enforcement of temporal fidelity in pyramidal cells by somatic feed-forward inhibition. Science. 2001;293:1159–1163. doi: 10.1126/science.1060342. [DOI] [PubMed] [Google Scholar]
- Pouille F, Scanziani M. Routing of spike series by dynamic circuits in the hippocampus. Nature. 2004;429:717–723. doi: 10.1038/nature02615. [DOI] [PubMed] [Google Scholar]
- Rall W. Core conductor theory and cable properties of neurones. In: Kandel E, editor. Handbook of Physiology. The Nervous System. Cellular Biology of Neurons. Bethesda, MD: American Physiological Society; 1977. pp. 39–97. [Google Scholar]
- Ramón y Cajal S. Histologie de système nerveux de l'Homme et des Vert∼br∼s tomme II (Azoulay L, translation) Maloine. Paris: 1911. [Google Scholar]
- Sauer JF, Bartos M. Recruitment of early postnatal parvalbumin-positive hippocampal interneurons by GABAergic excitation. J Neurosci. 2010;30:110–115. doi: 10.1523/JNEUROSCI.4125-09.2010. [DOI] [PMC free article] [PubMed] [Google Scholar]
- Scharfman HE. Electrophysiological diversity of pyramidal-shaped neurons at the granule cell layer/hilus border of the rat dentate gyrus recorded in vitro. Hippocampus. 1995;5:287–305. doi: 10.1002/hipo.450050403. [DOI] [PMC free article] [PubMed] [Google Scholar]
- Sik A, Penttonen M, Buzsáki G. Interneurons in the hippocampal dentate gyrus: An in vivo intracellular study. Eur J Neurosci. 1997;9:573–588. doi: 10.1111/j.1460-9568.1997.tb01634.x. [DOI] [PubMed] [Google Scholar]
- Somogyi P, Klausberger T. Defined types of cortical interneuron structure space and spike timing in the hippocampus. J Physiol (Lond) 2005;562:9–26. doi: 10.1113/jphysiol.2004.078915. [DOI] [PMC free article] [PubMed] [Google Scholar]
- Somogyi P, Nunzi MG, Gorio A, Smith AD. A new type of specific interneuron in the monkey hippocampus forming synapses exclusively with the axon initial segments of pyramidal cells. Brain Res. 1983;259:137–142. doi: 10.1016/0006-8993(83)91076-4. [DOI] [PubMed] [Google Scholar]
- Somogyi P, Tamás G, Lujan R, Buhl EH. Salient features of synaptic organisation in the cerebral cortex. Brain Res Brain Res Rev. 1998;26:113–135. doi: 10.1016/s0165-0173(97)00061-1. [DOI] [PubMed] [Google Scholar]
- Soriano E, Frotscher M. GABAergic innervation of the rat fascia dentata: A novel type of interneuron in the granule cell layer with extensive axonal arborization in the molecular layer. J Comp Neurol. 1993;334:385–396. doi: 10.1002/cne.903340305. [DOI] [PubMed] [Google Scholar]
- Sugino K, Hempel CM, Miller MN, Hattox AM, Shapiro P, Wu C, Huang ZJ, Nelson SB. Molecular taxonomy of major neuronal classes in the adult mouse forebrain. Nat Neurosci. 2006;9:99–107. doi: 10.1038/nn1618. [DOI] [PubMed] [Google Scholar]
- Tamamaki N, Yanagawa Y, Tomioka R, Miyazaki J, Obata K, Kaneko T. Green fluorescent protein expression and colocalization with calretinin, parvalbumin, and somatostatin in the GAD67-GFP knock-in mouse. J Comp Neurol. 2003;467:60–79. doi: 10.1002/cne.10905. [DOI] [PubMed] [Google Scholar]
- Tamás G, Lorincz A, Simon A, Szabadics J. Identified sources and targets of slow inhibition in the neocortex. Science. 2003;299:1902–1905. doi: 10.1126/science.1082053. [DOI] [PubMed] [Google Scholar]
- Tamás G, Szabadics J, Lörincz A, Somogyi P. Input and frequency-specific entrainment of postsynaptic firing by IPSPs of perisomatic or dendritic origin. Eur J Neurosci. 2004;20:2681–2690. doi: 10.1111/j.1460-9568.2004.03719.x. [DOI] [PubMed] [Google Scholar]
- van Hooft JA, Giuffrida R, Blatow M, Monyer H. Differential expression of group I metabotropic glutamate receptors in functionally distinct hippocampal interneurons. J Neurosci. 2000;20:3544–3551. doi: 10.1523/JNEUROSCI.20-10-03544.2000. [DOI] [PMC free article] [PubMed] [Google Scholar]
- Vida I, Frotscher M. A hippocampal interneuron associated with the mossy fiber system. Proc Natl Acad Sci USA. 2000;97:1275–1280. doi: 10.1073/pnas.97.3.1275. [DOI] [PMC free article] [PubMed] [Google Scholar]
- Vida I, Halasy K, Szinyei C, Somogyi P, Buhl EH. Unitary IPSPs evoked by interneurons at the stratum radiatum-stratum lacunosum-moleculare border in the CA1 area of the rat hippocampus in vitro. J Physiol (Lond) 1998;506:755–773. doi: 10.1111/j.1469-7793.1998.755bv.x. [DOI] [PMC free article] [PubMed] [Google Scholar]
- Wang XJ, Buzsáki G. Gamma oscillation by synaptic inhibition in a hippocampal interneuronal network model. J Neurosci. 1996;16:6402–6413. doi: 10.1523/JNEUROSCI.16-20-06402.1996. [DOI] [PMC free article] [PubMed] [Google Scholar]
- Wang Y, Gupta A, Toledo-Rodriguez M, Wu CZ, Markram H. Anatomical, physiological, molecular and circuit properties of nest basket cells in the developing somatosensory cortex. Cereb Cortex. 2002;12:395–410. doi: 10.1093/cercor/12.4.395. [DOI] [PubMed] [Google Scholar]
- Whittington MA, Traub RD, Jefferys JG. Synchronized oscillations in interneuron networks driven by metabotropic glutamate receptor activation. Nature. 1995;373:612–615. doi: 10.1038/373612a0. [DOI] [PubMed] [Google Scholar]
- Zhang L, McBain CJ. Potassium conductances underlying repolarization and after-hyperpolarization in rat CA1 hippocampal interneurones. J Physiol (Lond) 1995;488:661–672. doi: 10.1113/jphysiol.1995.sp020998. [DOI] [PMC free article] [PubMed] [Google Scholar]
Associated Data
This section collects any data citations, data availability statements, or supplementary materials included in this article.
Supplementary Materials
Supporting Information Figure 1. Morphological properties of identified GAD67-eGFP cells are not uniformly distributed. The distribution of dendritic and axonal properties was tested by using maximum likelihood analysis (MLA; see Materials and Methods). Each of the 31 variables was fit with one and the sum of two or more Gaussian functions (Mathematica, 4.2). Only variables with a non-uniform distribution (best fit with the sum of two or three Gaussian functions) were used for subsequent cluster analysis. Black lines indicate distribution of the original data obtained from all reconstructed cells for three representative morphological parameters (axonal density, axonal length, dendritic length). The gray line describes the best fit of the data distribution using MLA. Arrows point to modes of the two or three Gaussian functions fit to the original data.
Supporting Information Figure 2. Electrophysiological properties of identified GAD67-eGFP cells are not uniformly distributed. The distribution of passive and active membrane properties was tested by using MLA (see Materials and Methods). Each of the electrophysiological variables was fit with one and the sum of two and three Gaussian functions (gray line). Here representative variables are shown which could be best fit with the sum of two or three Gaussian functions. Arrows point to the modes of the two or three Gaussian functions. Variables with a non-uniform distribution were used for subsequent cluster analysis. Black lines show distribution of the binned data for eight electrophysiological parameters related to passive membrane properties (membrane time constant [τm], membrane resting potential [Vrest]) and characteristics related to trains of high frequent action potentials (700 pA, 1 s).
Supporting Information Figure 3. Basket cell (BC)-like neurons (class 1) contributed to classes M1 and P1 (orange code in Fig. 2A,4A,6B). (A,B,C) Three representative Neurolucida reconstructions of class 1 neurons. Soma and dendrites are shown in black and the axon projections in the granule cell layer (gcl) are shown in red. Note, some class 1 cells show axon collaterals in the hilus. (D) Schematic representation of class 1 morphology (modified from Freund and Buzsáki, 1996). Soma and dendrites are depicted in black and the axon in gray. Numbers (n) represent the total number of (rigorously and visually) identified class 1 cells. Scale bar 100 μm; ml, molecular layer.
Supporting Information Figure 4. Hilar commissural associational pathway related (HICAP)-like cells (class 2) contributed to classes M2 and P3 (yellow code in Fig. 2A,4A,6B). (A,B) Two representative Neurolucida reconstructions are shown. Note, the axonal arborisation distributed in the inner part of the molecular layer (ml). Soma and dendrites are shown in black and the axon in red. A subset of cells showed axon projections in the hilus. (C) Schematic representation of class 2 morphology (modified from Freund and Buzsáki, 1996). Soma and dendrites are depicted in black and the axon in gray. Numbers (n) represent the total of rigorously and visually identified HICAP cells. Scale bar 100 μm; gcl, granule cell layer.
Supporting Information Figure 5. Total molecular layer (TML)-like cells (class 3) contributed to classes M3 and P3 (blue code in Fig. 2A,4A,6B). (A,B) Two representative Neurolucida reconstructions of class 3 cells are shown. Note, the axonal arborization distributed throughout the molecular layer (ml). Soma and dendrites are shown in black and the axon in red. (C) Schematic representation of TML morphology (modified from Freund and Buzsáki, 1996). Soma and dendrites are depicted in black and the axon in gray. Bright gray region in the hilus indicates low axonal projections in this area (< 0.5% of total axonal length). Numbers (n) represent the total of rigorously and visually identified TML-like cells. Scale bar 100 μm; gcl, granule cell layer.
Supporting Information Figure 6. Molecular layer (ML)-like cells (class 5) contributed to classes M4 and formed P2 (green code in Fig. 2A,4A,6B) with axon in the molecular layer, previously also termed MOPP cells (Han et al., 1993). (A,B) Two representative Neurolucida reconstructions of ML-like cells are shown. Note, soma, dendrites and the axonal arborization distributed throughout the molecular layer (ml) and in one case crossed the hippocampal fissure (Ceranik et al., 1997). Soma and dendrites are shown in black and the axon in red. (C) Schematic representation of class 4 morphology (modified from Freund and Buzsáki, 1996). Soma and dendrites are depicted in black and the axon in gray. Numbers (n) represent the total of rigorously and visually identified ML-like cells. Scale bar 100 μm; gcl, granule cell layer.
Supporting Information Figure 7. Hilar perforant path-associated (HIPP)-like cells (class 4) fall in classes M4, P1 and P3 (purple code in Fig. 2A,4A,6B) with axon predominantly located in the outer two thirds of the molecular layer. (A) Two reconstructions of HIPP-like cells are shown. Note, soma, dendrites are located at the gcl-hilus border and the axonal arborization is distributed in the molecular layer (ml). Close to the axon initial segment of the left cell the axon also arborizes in the inner molecular layer thereby representing a non-classical HIPP cell. Soma and dendrites are shown in black and the axon in red. (B) Schematic representation of a HIPP-like morphology (modified from Freund and Buzsáki, 1996). Soma and dendrites are depicted in black and the axon in gray. Bright gray area indicates that on average axon projections are weak in the inner molecular layer. Numbers (n) represent the total of rigorously and visually identified HIPP-like neurons. Scale bar 100 μm; gcl, granule cell layer.
Supporting Information Figure 8. Axonal Sholl distribution differs among classes. (A) Schematic illustration of the Sholl analysis. Concentric rings were centered at the centroid of the soma with a stepwise increasing radius of 100 μm. (B). Cumulative distribution of axonal length of each interneuron M class defined as the percentage of the total axonal length in each 100 μm concentric circle starting from the soma. Data points are averages from reconstructed interneurons (*p < 0.05; **p < 0.01).
Supporting Information Figure 9. Micrographs of representative class 1 - 5 cells. Micrographs of DAB-labeled interneurons are shown for class 1 - 5. Arrows point to axonal projections. Dotted lines represent borders between the hilus and the granule cell layer (gcl), between the gcl and the molecular layer (ml) and in case of the class 4 cell, the hippocampal fissure.
Supporting Information Table 1.
Supporting Information Table 2.
Supporting Information Table 3.
Supporting Information Table 4.
Supporting Information Table 5.
Supporting Information Table 6.
Supporting Information Table 7.