Abstract
Here we investigate a novel signal-on electrochemical DNA sensor based on the use of a clamp-like DNA probe that binds a complementary target sequence through two distinct and sequential events, which lead to the formation of a triplex DNA structure. We demonstrate that this target-binding mechanism can improve both the affinity and specificity of recognition as opposed to classic probes solely based on Watson–Crick recognition. By using electrochemical signaling to report the conformational change, we demonstrate a signal-on E-DNA sensor with up to 400% signal gain upon target binding. Moreover, we were able to detect with nanomolar affinity a perfectly matched target as short as 10 bases (KD = 0.39 nM). Finally, thanks to the molecular “double-check” provided by the concomitant Watson–Crick and Hoogsteen base pairings involved in target recognition, our sensor provides excellent discrimination efficiency toward a single-base mismatched target.
Biomolecular receptors such as proteins or nucleic acids that shift between two or more conformations upon binding to a specific target can be used to build robust, sensitive, and specific sensors.1,2 Because signal transduction is linked to the conformational change that occurs only upon binding, these receptors allow for detection of a specific target even within the incredibly complex media that exist within biological system. To create robust, rapid sensors that similarly link specificity and sensitivity, a number of structure-switching optical and electrochemical sensors have been reported in recent years for applications in the areas of diagnostics and imaging, and several different strategies have been employed in the design of binding-induced molecular switches.1−3
Among the various structure-switching strategies employed by naturally occurring receptors, the use of a clamp-like mechanism where the receptor comprises two recognition elements that both bind and recognize the target, remains one of the most effective.4 Inspired by this mechanism, we have recently explored the thermodynamics by which a DNA clamp-like molecular receptor that recognizes a specific complementary oligonucleotide target through both Watson–Crick and triplex-forming Hoogsteen interactions can improve both the affinity and specificity of recognition.4
In the present work, we fully realize and exploit the advantages of such molecular “double-check” mechanism, by adapting this clamp-like sensing strategy to a DNA-based electrochemical biosensor (hereafter named E-DNA). The classic E-DNA sensor, first proposed by Plaxco et al. in 2003,5 comprises a redox-labeled stem-loop or linear DNA probe immobilized on the surface of a gold electrode that, upon hybridization with its complementary target, leads to a rigid, duplex complex that brings the redox label a distance away from the electrode surface and thus suppresses the observed electrochemical signal (signal-off sensor).5 Such a strategy provides impressive advantages that include the reagentless nature of the platform, the adaptability to point-of-care approaches, and the possibility to use it with complex real samples.5−7 Here we have replaced the duplex-forming DNA probe (linear or stem-loop) utilized in the classic E-DNA sensors with a clamp-switch DNA probe, and we have developed an E-DNA sensor that while maintaining the above attributes will also provide a signal increase upon target binding (signal-on sensor) and, more importantly, a significantly improved affinity and specificity relative to the original duplex-based E-DNA sensors.5−7
Experimental Section
Materials
Reagent-grade chemicals, including (top-oligo(ethylene glycol), HS–(CH2)11–OEG6–OH) TOEG6 (from Prochimia, Poland), 6-mercapto-1-hexanol, tris[hydroxymethyl]aminomethane hydrochloride, tris(2-carboxyethyl) phosphine hydrochloride, sulfuric acid, potassium phosphate monobasic, dibasic, ethanol, and sodium chloride (all from Sigma-Aldrich, St. Louis, Missouri, USA) were used without further purification. The clamp-switch and the linear probe were obtained from Biosearch Technologies (Novato, USA) and employed without further purification. The clamp-switch probe sequence is as follows:
5′-HS-(CH2)6-TATTTTCTTTTCCCCCCAGTATTATTCCCCCTTTTCTTTTGT-MB-3′. The probe is modified at the 5′-end with a thiohexyl moiety and at the 3′-end with a methylene blue (MB) redox label. The linear probe sequence is as follows: 5′-HS-(CH2)6-CGTCAATCTTCTATTTCTCCACACTGCT-MB-3′. The probe is modified at the 5′-end with a thiohexylmoiety and at the 3′-end with a MB redox label.
Target DNA Sequences
For the clamp-switch probe, we have employed the following target DNA sequences of varying lengths, all of which were obtained via commercial synthesis (Sigma-Aldrich):
| PM13 mer (13-base target) | 5′-GGAAAAGAAAATA-3′ |
| PM12 mer (12-base target) | 5′-GAAAAGAAAATA-3′ |
| PM11 mer (11-base target) | 5′-AAAAGAAAATA-3′ |
| PM 10 mer (10-base target) | 5′-AAAGAAAATA-3′ |
| MM 10 mer (10-base mismatch target) | 5′-AAAGCAAATA-3′ |
The target sequences for the linear probe were as follows:
Linear PM-13 (13-base target, 5′-GGAGAAATAGAAG-3′) and linear MM-13 (13-base mismatch target, 5′-GGACAAATAGAAG-3′).
In the above sequences the underlined bases identify the mismatched bases.
Sensor Fabrication
The sensors were fabricated using standard approaches.8 Briefly, E-DNA sensors were fabricated on rod gold disk electrodes (3.0 mm diameter, BAS, West Lafayette, IN, USA). The disk electrodes were prepared by polishing with diamond and alumina (BAS), followed by sonication in water, and electrochemical cleaning (a series of oxidation and reduction cycles in 0.5 M H2SO4, 0.01 M KCl/0.1 M H2SO4, and 0.05 M H2SO4). Effective electrode areas were determined from the charge associated with the gold oxide reduction peak obtained after the cleaning process. The thiol-containing oligonucleotides we have employed are supplied as a mixed disulfide with 6-mercapto-1-hexanol in order to minimize the risk of oxidation. Thus, the first step in sensor fabrication is the reduction of the probe DNA (100 μM) for 1 h in a solution of 0.4 mM tris(2-carboxyethyl)phosphine hydrochloride (TCEP) in 100 mM NaCl/10 mM potassium phosphate pH 7. The so-reduced relevant probe DNA was immobilized onto the freshly cleaned electrodes by incubating for 5 min in a solution of 1 M NaCl/10 mM potassium phosphate buffer, pH 7. Different probe densities were obtained by controlling the concentration of probe DNA employed during the fabrication process ranging from 10 nM to 500 nM. Following probe immobilization, the electrode surface was rinsed with deionized water, passivated with 1 mM 6-mercaptohexanol in 1 M NaCl/10 mM potassium phosphate buffer, pH 7, overnight, and rinsed with deionized water before measurement.
Electrochemical Measurements
The sensors produced as described above were tested at room temperature using an Autolab potentiostat (EcoChemie, Utrecht, The Netherlands). Square wave voltammetry (SWV) was recorded from −0.1 V to −0.45 V versus an external Ag/AgCl reference electrode and a platinum counter electrode and amplitude of 25 mV with a frequency of 100 Hz (unless otherwise states). The sensors were first allowed to equilibrate for about 20 min in a buffer solution (10 mM tris[hydroxymethyl]aminomethane hydrochloride (TRIS) + 100 mM NaCl + 10 mM MgCl2). Once the sensor’s signal was stable, the desired target concentration was added to the solution, and the resulting signal decrease or increase was evaluated in real time by interrogating the electrode at regular intervals.
Calculation of Probe Surface Density
Probe surface density (i.e., the number of electroactive probe DNA moles per unit area of the electrode surface, Ntot) was determined using a previously established relationship with ACV peak current9a described in eq 1:
| 1 |
where Iavg (E0) is the average AC peak current in a voltammogram, n is the number of electrons transferred per redox event (with our MB label n = 2), F is the Faraday current, R is the universal gas constant, T is the temperature, Eac is the amplitude, and f is the frequency of the applied AC voltage perturbation. Perfect transfer efficiency was assumed (i.e., that all of the redox moieties participate in electron transfer); errors in this assumption would lead us to underestimate probe density. Experimentally, four frequency values were used (5, 10, 50, and 100 Hz), and the average current peak was calculated so as to give the value of Ntot.9b,9c
AFM Methods
Solutions
For all atomic force microscopy (AFM) experiments, DNA stocks preparation and monolayer were formed in a phosphate buffer solution (PBS, 10 mM phosphate, 1 M NaCl, 1 mM MgCl2, pH 7 in Milli-Q water (resistivity ≥18.2 MΩ·cm). DNA oligos (see the sequences above) were purchased from IDT, suspended in PBS to a final concentration of 100 μM, and stored at −20 °C. AFM imaging and target incubation were carried out in a TRIS solution (10 mM TRIS, 100 mM NaCl, 10 mM MgCl2), prepared with Milli-Q water, and adjusted to pH values of 5, 6, or 8. All solutions were filtered with a sterile 0.2 μm syringe filter (VWR, Italy).
Sample Preparation
Ultraflat gold surfaces were prepared following a modified procedure from ref (10). Briefly, a 100 nm thick film of gold was electron-beam deposited over a freshly cleaved mica surface sheet (Mica, New York, clear ruby muscovite). Gold-on-mica chips of 5 × 5 nm2 were glued on slightly smaller silicon chips by using an epoxy resist (SU-8 100, MicroChem, MA, U.S.A.), and cured at 130 °C for at least 24 h. The obtained samples were stored in ambient conditions without any further precaution. Self-assembled monolayers were allowed to form over freshly cleaved gold surfaces in a solution containing 30 nM ssDNA probe in PBS buffer for 5 min, followed by 5 min-long washing in fresh PBS. DNA-modified surfaces were backfilled with the TOEG6 monolayer for gold-surface stabilization with a 15 min incubation in a 100 μM TOEG6 solution in PBS/EtOH = 3:1, followed by washing in PBS. Samples were fixed in the AFM liquid cell with a cyclic olefin copolymer (TOPAS, TOPAS Advanced Polymers GmbH, Germany) on a glass support.
AFM Analysis
All AFM measurements were performed in liquid on an Asylum Research MFP-3D Stand-Alone AFM. Monolayer heights were measured relative to an internal reference provided by TOEG6 patches generated within the DNA monolayer by nanografting.11 Several 2 × 2 μm2 squared features were produced in a 10 μM TOEG6 solution in PBS buffer with relatively stiff cantilevers (NSC36/noAl by MikroMasch, nominal spring constant, k = 1.0 N/m) by applying 100–150 nN. The action of the loading tip lets surface-bound DNA molecules be exchanged with TOEG6 molecules present in solution. Nanostructures were AFM imaged in AC-Mode at low forces, at all experimental stages, and with the same cantilever that was utilized for nanografting.
The step-height of the DNA monolayer with respect to each TOEG6 patch was obtained from six different height profiles, each being the average of five adjacent line profiles. Absolute DNA height values were derived from the measured values by adding the average height of the TOEG6 monolayer (3.1 nm) and subtracting the average length of the thiol linker (1 nm):12Habs = Hrel + HTOEG – Hlinker = Hrel + 2.1 nm.
Results
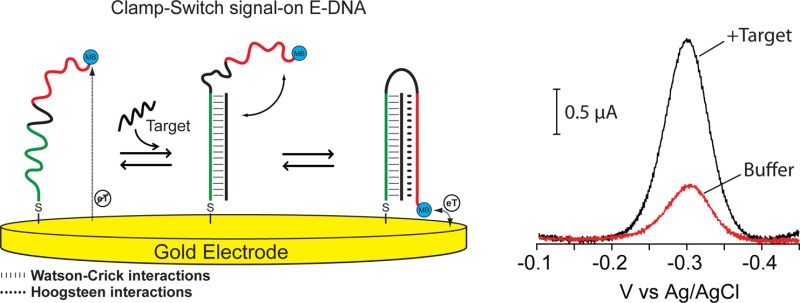
The signaling element we have used for our signal-on E-DNA sensor is a redox reporter (MB) conjugated at the 3′ end of our DNA-based clamp-switch probe. The probe is also labeled at the 5′ end with a thiol group to support stable attachment to an interrogating gold electrode. Our clamp-switch probe is composed of two recognition elements separated by an unstructured, 10-base loop (Figure 1a, black portion). The first recognition element, a 15-base polypyrimidine portion (Figure 1a, green portion), binds the target, a complementary polypurine sequence, via Watson–Crick base pairing. The second recognition element, a polypyrimidine sequence (Figure 1a, red portion), then binds the so-formed duplex via sequence-specific Hoogsteen base pairing.4,13 The formation of this triplex structure occurs through a conformational switch that leads to its closure (Figure 1a).4,14−21 In the absence of the oligonucleotide sequence complementary to the first recognition element, the probe, in its linear conformation, is flexible enough that the attached methylene blue maintains its mechanical freedom to remain, on average, very distant from the electrode surface, and thus exchanges electrons at a relatively low rate. Upon the addition of its specific DNA target, the E-DNA clamp probe folds into a triplex structure that confines the methylene blue near the electrode surface, thus increasing the electron transfer rate and the observed electrochemical voltammetric response (signal-on behavior) (Figure 1b).
Figure 1.
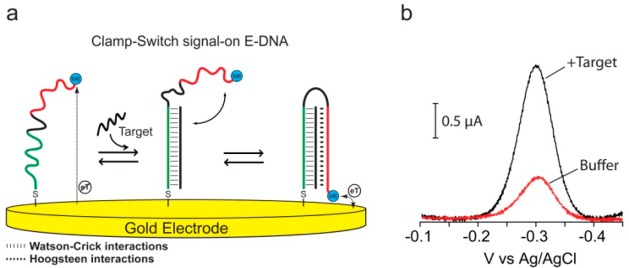
(a)Clamp-switch E-DNA sensor is composed of a DNA probe modified at its 3′-end with a methylene blue redox tag and at its 5′-end with a thiohexyl moiety for attachment on a gold electrode. The probe is designed with a first recognition element, a 15-base polypyrimidine portion (green portion) that can recognize a complementary target sequence via Watson–Crick base pairing. The second recognition element, a polypyrimidine sequence (red portion) can then fold back to form a triplex structure through Hoogsteen base pairing.4,13 This brings the redox label into close proximity with the electrode surface, increasing electron transfer efficiency and resulting in an increase in the observed current (b).
The signaling behavior of our E-DNA clamp-switch is directly linked to the closure of the clamp, which brings the methylene blue closer to the electrode surface and thus increases the electron transfer rate of the methylene blue redox reaction. To demonstrate this, we have measured the apparent electron transfer rates using SWV. The electron transfer rate is directly proportional to the “critical frequency”, which is the maximum frequency-corrected peak current in the ip/f versus f curve, where ip is the net peak current and f is the SWV frequency.22 Our E-DNA clamp-switch leads to a significant decrease in the critical frequency upon target binding, demonstrating a much faster electron transfer rate (Figure 2a). Crucially, this difference in electron transfer rate allows us to optimize measurement frequency to maximize signal gain.
Figure 2.
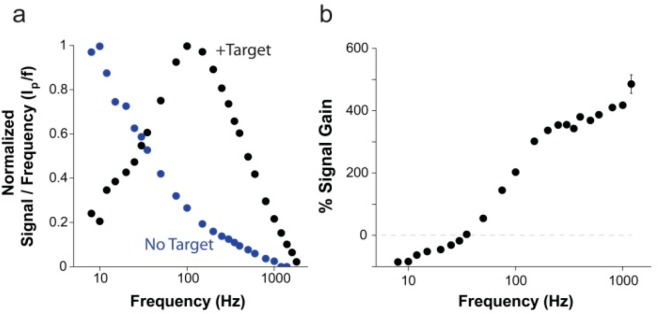
Change in electron transfer rate upon target binding provides a mechanism for tuning the signal gain of the E-DNA clamp-switch probe. Following target binding, the clamp-switch probe folds back to form a triplex structure, and the methylene blue reporter is held in close proximity to the electrode surface, providing faster electron transfer than the unbound probe, which has more freedom to occupy positions distant from the electrode surface. (a) The ratio of the measured peak current to SWV frequency (ip/f) as a function of frequency provides a way to measure the apparent electron transfer rate of the methylene blue reporter.22 The bound E-DNA triplex (black) has a critical frequency around 100 Hz, for an apparent electron transfer rate of ∼85 s–1.The unbound free probe (blue) has a critical frequency ≤10 Hz, showing much slower electron transfer. (b) By varying the SWV frequency used to measure the probe, the ratio of signal between bound and unbound states is variable, providing highly tunable signaling characteristics. For most measurement frequencies, the signal current increases upon target binding with signal gain of up to 400% for measured frequencies. Only when the frequency falls below 25 Hz, a time scale in which the rapid electron transfer of the bound state rapidly exhausts the signaling current, the observed signal of the unbound probe is higher than that in the presence of the target (signal-off behavior). For a matter of clarity in these binding curves and in those in the following figures, error bars have been depicted for only one point on each curve and represent the average and standard deviations of measurements performed on at least three independent sensors.
Despite the normally signal-on behavior of our clamp-switch sensor, we note that, similarly to other DNA-based architectures,23 at very low SWV frequencies (below ∼25 Hz) the behavior of the sensor is inverted, and the target-free state produces a signal higher than that of the target-bound clamp state (Figure 2a). This is probably due to the fact that at low-enough measurement time scales, the target-bound redox reaction proceeds faster than the unbound redox reaction. This leads to exhausting electron transfer from the faster reaction and, thus allows the slower reaction to dominate current measurements.
The behavior of the E-DNA clamp-switch sensor differs significantly from that of a classic E-DNA sensor based on a Watson–Crick linear hybridization probe.23 For the latter, the presence of the target leads to a reduction of the apparent electron transfer rate (Figure S1) because target binding produces a more rigid duplex DNA, in which the methylene blue approaches the surface less frequently than in the target-free, linear probe. In turn, a linear E-DNA sensor displays a signal-off behavior at frequencies for which the E-DNA clamp-switch sensor leads, in contrast, to signal increase upon target binding. The percentage signal increase observed upon target binding varies with the SWV frequency used to measure the probe. At high-enough frequencies (>50 Hz), the signal current increases upon target binding with a signal gain that reached a maximum of 400% at the highest frequencies we have investigated (Figure 2b).
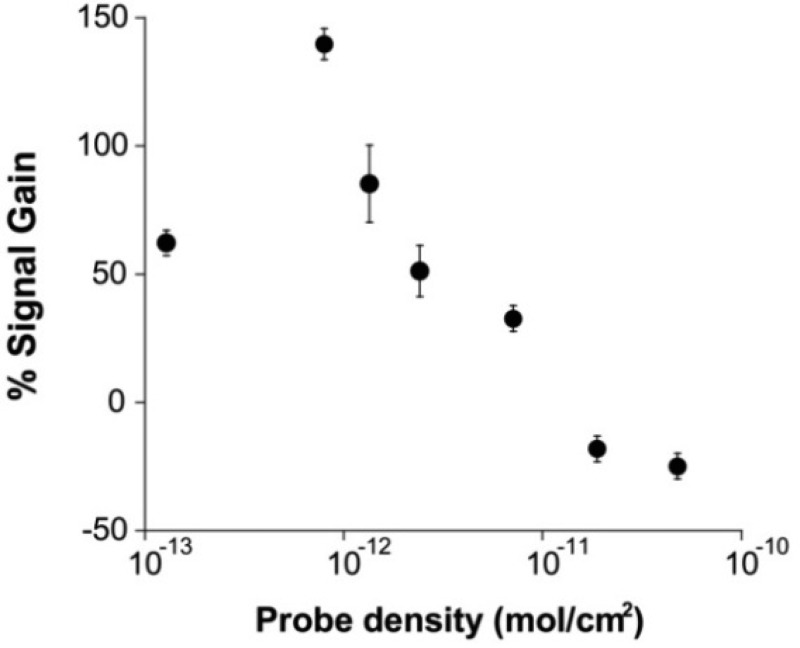
The signal of the E-DNA clamp-switch sensor strongly depends on probe density (Figure 3). Specifically, the signal-on behavior of the sensor is exclusively found at relatively low densities. At higher densities (>10–11 mol/cm2), target binding leads to a signal decrease (signal-off). Presumably, at higher densities, steric hindrance and/or electrostatic effects inhibit the formation of a compact triplex structure and favor the formation of the intermediate duplex-containing structure. We also note that the signal-to-noise ratio maximizes at intermediate probe densities, as it depends on absolute current intensity, which intrinsically depends on probe density.
Figure 3.
Because the E-DNA clamp-switch mechanism is based on the possibility of the probe to fold-back and form a triplex structure, its signal is strongly dependent on the probe surface density. We demonstrate this by fabricating E-DNA clamp-switch sensors of different probe densities by varying the concentration of the DNA clamp-switch probe employed during sensor fabrication and interrogating these sensors with a saturating amount of a complementary target (13-mer, 300 nM). At high probe densities, the triplex formation is so unfavored that we only observe a signal decrease (consistent with formation of the sole duplex DNA). As the probe surface density decreases below a critical value of 10–11 mol/cm2, the spacing between the probes increases enough to allow them to fold-back and form the triplex structure (signal-on behavior).
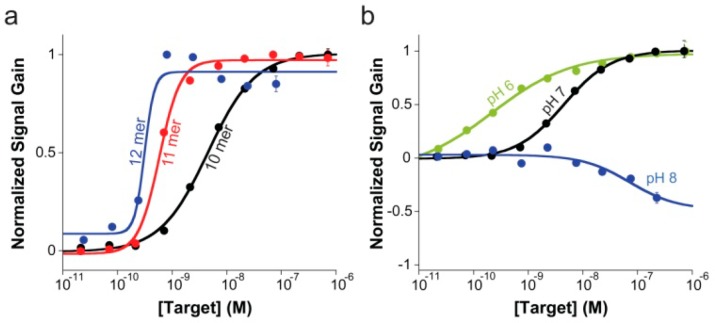
The E-DNA clamp-switch sensor supports the signal-on detection of oligonucleotide targets with high affinity (Figure 4a). We have studied the effect of target length on the signaling of our E-DNA sensor by using increasing concentrations of complementary targets of different length (Figure 4). We have observed signal-on behavior and nanomolar affinity for complementary targets as short as 10 bases. As the target length reaches 12 bases, we no longer see a difference in affinity (Figure 4a). This is due to the fact that with such longer targets we reach the ligand-depletion regime (i.e., the true KD for the target is lower than the effective probe concentration in the working solution), and the observed KD is not related anymore to the “true” probe-target KD.24 We also note that with targets longer than 17 bases, we no longer observe a signal-on behavior due to the fact that duplex formation is favored over triplex formation.
Figure 4.
(a) E-DNA clamp-switch sensor can detect specific complementary targets with high affinity. Here are shown binding curves obtained by using increasing concentration of complementary targets of different lengths (10, 11, and 12 bases). As expected, the affinity observed with longer targets is improved until we reach the ligand-depletion regime in which occupancy is no longer defined by the true affinity of the probe or the concentration of the target in solution but by the total number of ligand (target) molecules in the sample relative to the total number of probes on the sensor surface.24 In this latter case, a bilinear binding curve is observed with a midpoint at a target concentration half of the effective probe concentration ([P]eff/2). These binding curves were obtained by adding an increasing concentration of perfectly matched targets of different length in a 2 mL 10 mM TRIS buffer, 10 mM MgCl2, 100 mM NaCl pH 7.0. (b) Sensing mechanism of the E-DNA clamp-switch sensor is based on the formation of a triplex structure upon target binding. Consistent with this and considering that triplex formation is unfavored at basic pH,4,14−17 the affinity of our clamp-switch sensor becomes poorer as we increase the pH at which we interrogate the sensor. Interestingly, because a basic pH (here pH 8.0, blue curve) greatly inhibits triplex formation, we only observe duplex formation. These binding curves were obtained by adding an increasing concentration of a perfectly matched target (10-mer) in a 2 mL 10 mM TRIS buffer, 10 mM MgCl2, 100 mM NaCl (pH 6, 7 and 8).
The evidenced sensing mechanism based on triplex formation is also supported by results obtained on the behavior of sensor’s affinity as a function of pH (Figure 4b). As anticipated, the sensor’s affinity for a 10-base target gets gradually poorer with increasing pH because Hoogsteen interactions are less stable at basic pHs (Figure 4b).14,16 Interestingly, at pH 8, target binding does not lead anymore to signal increase, and a signal-off behavior is instead observed. Our interpretation is that at this pH, triplex formation is inhibited, and the target binding only leads to the intermediate duplex-containing structure,25 which in turn increases, on average, the distance between electrode surface and methylene blue leading to a signal-off behavior. The results obtained at pH 6 and pH 8 gives a direct comparison of the performance of an E-DNA clamp-switch probe with that of a simple hybridization probe, which is solely based on Watson–Crick interactions. Remarkably, the clamp-switch probe shows for the same 10-base target (KD= 0.39 nM at pH 6) a 180-fold improved affinity compared to a simple hybridization probe (KD = 72 nM, results obtained at pH 8). This difference in sensitivity between a triplex and a duplex formation is consistent with our previous observations achieved with fluorophore/quencher labeled clamp-switch probes.4
To further investigate the behavior of the E-DNA clamp-switch sensor at pH 6 and 8 and to provide direct evidence of the related structural motifs and of our above interpretation, we used AFM and an AFM-based nanolithographic technique termed nanografting.26 Using nanografting, we formed squared patches of monolayer of TOEG6. Such features provided with a reference monolayer for the quantification, by means of side-by-side topographic AFM imaging, of the height of the surrounding self-assembled monolayers (SAM) of DNA clamp molecules over an ultraflat gold surface (Figure 5a,b,d,e).
Figure 5.
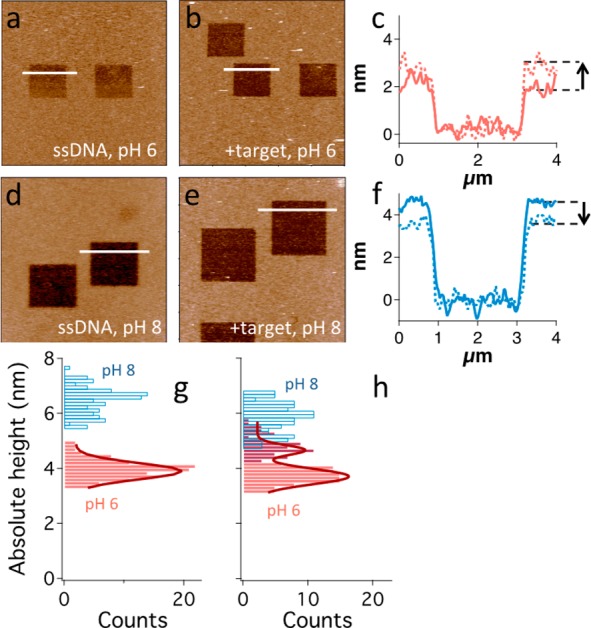
(a–f) Analysis of a representative sample that showcases the monolayer height change related to target binding at different pH values. (a, b, d, e) AFM topography images showing the DNA monolayer (light brown) and the nanografted 2 × 2 μm2 TOEG6 features (dark brown), produced for samples analyzed at pH 6 (a, b) and pH 8 (d, e), before and after target incubation (a, d and b, e, respectively). Images are color-coded in a brighter-is-higher fashion with a scale range of 10 nm. Bars = 4 μm. (c, f) Overlapped height profiles (relative to the TOEG6 layer) obtained for the samples analyzed at pH 6 (a, b, c, red profile) and pH 8 (d, e, f, blue profile). Solid and dashed lines represent SAM height profiles before and after target incubation, respectively. An arrow marks the height increase observed at pH 6 and the decrease at pH 8. (g, h) Absolute DNA height distributions obtained from each nanografted patch at pH 6 and pH 8 are represented in red and blue, respectively. The former are fitted with Gaussian functions (dark red curves). ssDNA SAM height at pH 8 is ∼3 nm higher than at pH 6 (g), and there is no overlapping between the two distributions. Height distribution at pH 6 can be well fitted by a single Gaussian curve. After hybridization with a 10-mer target (h), height distribution at pH 6 changes significantly, and a ∼ 25% higher component (dark red bars) appears from the background, which is centered at a height slightly lower than 4 nm. This distribution was fitted with a double Gaussian curve. pH 8 height distribution shows a less remarkable change, height values becoming ∼10% lower after hybridization. The two height distributions after target incubation clearly overlap for values around 5 nm.
Whereas the clamp-switch probe is 44 bases in length, and thus has an ideal end-to-end length >10 nm, the measured height of the optimally target-responsive SAMs (described above) varied, at pH 6, within a small range of a few nanometers (see height profiles in Figure 5c). The latter is consistent with the fact that effective SAM stiffness (and, therefore, the AFM-measured height) depends on SAM density.27,28 In particular, at very low densities, as in this case, DNA molecules can be easily tilted by a scanning AFM tip, thus leading to AFM-measured height values compatible with the axial width of the molecule instead of its end-to-end length. Figure 5g shows that, at pH 6, the hybridization with the 10-base-long target leads to a significant change of the height distribution, as a distinct and ∼25% higher component emerges with respect to a back ground distribution having a height peak at ∼4 nm (see also a representative patch and its corresponding line profiles in Figure 5a–c). At pH 8, the AFM-measured height of the ssDNA SAM is ∼3 nm higher than at pH 6, and after target hybridization, the measured height values are ∼10% lower, as shown in Figure 5h (see also a representative patch and its corresponding line profiles in Figure 5d–f).
It is likely that at pH 8, ssDNAs are more stretched than at pH 6 as a result of inherent electrostatic repulsion between phosphate groups along backbones, thus resulting in thicker SAMs. Therefore, the small percentage height decrease, measured at pH 8 after hybridization with a target ∼70% shorter than the surface-bound probe, is consistent with a small portion of the molecule becoming stiffer and shorter. On the contrary, at pH 6, a background distribution is unaltered after hybridization and is compatible with the expected strong disturbance of the AFM tip on a more flexible chain. However, after hybridization, the frequent detection of ∼25% higher SAMs, suggests that a longer portion of the molecule becomes stiffer. AFM results are, therefore, consistent with the interpretation that target hybridization leads to the formation of distinct motifs at pH 6 and 8, which are, respectively, a triplex and a duplex.
Beyond improving affinity, the E-DNA clamp-switch sensor also enhances specificity. To explore this, we have tested our E-DNA clamp-switch using increasing concentrations of a perfectly matched and a single-base mismatched target (10-base). Experimental limitations did not allow us to determine the KD for the single-base mismatch target. In fact, even at very high concentrations (i.e., 10–5 M, 4 orders of magnitude higher than the KD for a perfectly matched probe), we were unable to observe any significant signal change in the presence of the single-base mismatch target (Figure 6a). The E-DNA clamp-switch sensor thus provides a discrimination factor (ratio of the affinity constants, KDmismatch/KDperfect match) at least higher than 2000-fold (KDperfect match = 4.5 nM). As a comparison, a classic E-DNA sensor based on a simple linear hybridization probe shows only 20-fold discrimination efficiency. While the single-base mismatch, as expected, gave a poorer affinity (KDmismatch = 79 nM) than that achieved with a perfect-match target (KDperfect match = 3.7 nM), the discrimination efficiency is much smaller than that obtained with the clamp-switch sensor (Figure 6b). Because of the experimental limitations (i.e., the linear probe does not bind to a 10-base target with sufficient high affinity, see Figure 4b), the specificity of the E-DNA clamp-switch sensor was determined using a shorter target (10-base) than that employed with the E-DNA sensor using a linear probe (13-base). Simulations with the nearest–neighbor model,29−31 however, confirmed that the small difference in target length is not the reason for the large difference in specificity we observed. Also, in this case, the enhanced specificity of the E-DNA clamp-switch sensor is consistent with previous observations using similar DNA probes in solution.4
Figure 6.
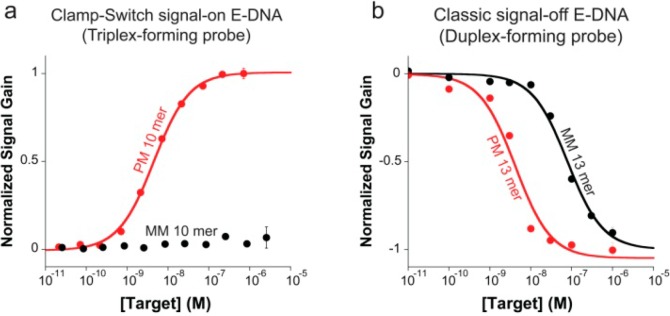
(a) Our E-DNA clamp-switch sensor is highly specific. We demonstrate this by interrogating the sensor with a perfect match and a one-base mismatch target (both 10-mer) at increasing concentrations. The affinity of the mismatch target is at least 2000-fold poorer than that of the perfect match target, thus demonstrating that the sequence-specific Hoogsteen base pairs in the clamp-switch offer an additional specificity check that increases the probe’s specificity compared to an equivalent E-DNA sensor based solely on Watson–Crick interactions. (b) As a further demonstration of this, we show here the binding curves obtained with a perfect match and a one-base mismatch using a classic E-DNA sensor based on a linear DNA probe. This sensor (signal-off) shows a separation between the perfect-match and mismatch affinity of only ∼20-fold. These binding curves were obtained by adding increasing concentration of a perfectly matched target and a one-base mismatch target (10-mer for the clamp-switch and 13-mer for the linear probe) in 2 mL of 10 mM TRIS buffer, 10 mM MgCl2, and 100 mM NaCl.
Conclusions
In this work, we have characterized a novel signal-on electrochemical sensor based on the use of a clamp-like DNA-based probe. We have demonstrated that by using such clamp-switch probe that binds a target through two distinct and sequential events, which leads to the formation of a triplex DNA structure, we can improve both the affinity and specificity of recognition compared to a classic Watson–Crick hybridization probe.
By turning this sensitive, specific architecture into an electrochemical probe, we have demonstrated that the signal-on E-DNA sensor studied here provides a robust signal gain of up to 400%. Moreover, we were able to measure with nanomolar affinity a specific target as short as 10 bases. Finally, as a result of the extraordinary efficient molecular “double-check” provided by the concomitant Watson–Crick and Hoogsteen base pairings involved in target recognition, our signal-on E-DNA sensor proves incredibly specific toward single-base mismatches because it provides an excellent, unexpected, and unprecedented (over 2000-fold) discrimination efficiency. A drawback of our approach might be represented by the fact that triplex forming sequences are usually limited to homopurine or homopyrimidine tracks. Although this can limit the possible number of measurable targets, we also note that such sequences are common enough that it is straightforward to find unique sites with sequences of 16–20 bases in human or pathogen genomes.32,33 Given the above attributes, the use of clamp-switch, triplex-based, electrochemical DNA probes holds great promise for the highly sensitive and sequence-specific detection of very short nucleic acids.
Acknowledgments
This work was supported by Associazione Italiana per la Ricerca sul Cancro, AIRC (project no. 14420) (F.R.), by the European Research Council, ERC (project no. 336493) (F.R.) and (project n.269051-Monalisa’s Quidproquo) (A.A., M.V., and M.C), by the Int. Research Staff Exchange Scheme (IRSES). J.F.-S. is supported by the National Cancer Institute of the National Institute of Health (NRSA F31CA183385).
Supporting Information Available
Information about the ip/f versus f curve for a linear probe. This material is available free of charge via the Internet at http://pubs.acs.org.
Author Contributions
▲ A.I. and A.A. contributed equally.
The authors declare no competing financial interest.
Funding Statement
National Institutes of Health, United States
Supplementary Material
References
- Vallé-Bélisle A.; Bonham A. J.; Reich N. O.; Ricci F.; Plaxco K. W. J. Am. Chem. Soc. 2011, 133, 13836–13839. [DOI] [PMC free article] [PubMed] [Google Scholar]
- Bonham A. J.; Hsieh K.; Ferguson B. S.; Vallée-Bélisle A.; Ricci F.; Soh H. T.; Plaxco K. W. J. Am. Chem. Soc. 2012, 134, 3346–3348. [DOI] [PMC free article] [PubMed] [Google Scholar]
- Cho E. J.; Lee J. W.; Ellington A. D. Annu. Rev. Anal. Chem. 2009, 2, 241–264. [DOI] [PubMed] [Google Scholar]
- Idili A.; Plaxco K. W.; Vallée-Bélisle A.; Ricci F. ACS Nano 2013, 7, 10863–10869. [DOI] [PMC free article] [PubMed] [Google Scholar]
- a Li D.; Song S.; Fan C. Acc. Chem. Res. 2010, 43, 631–641. [DOI] [PubMed] [Google Scholar]; b Fan C.; Plaxco K. W.; Heeger A. J. Proc. Natl. Acad. Sci. U.S.A. 2003, 100, 9134–9137. [DOI] [PMC free article] [PubMed] [Google Scholar]
- Kang D.; Vallee-Belisle A.; Porchetta A.; Plaxco K. W.; Ricci F. Angew. Chem., Int. Ed. 2012, 51, 6717–6721. [DOI] [PMC free article] [PubMed] [Google Scholar]
- a Lubin A. A.; Plaxco K. W. Acc. Chem. Res. 2010, 43, 496–505. [DOI] [PMC free article] [PubMed] [Google Scholar]; b Ricci F.; Lai R. Y.; Plaxco K. W. Chem. Commun. 2007, 36, 3768–3760. [DOI] [PubMed] [Google Scholar]
- Xiao Y.; Lai R. Y.; Plaxco K. W. Nat.Protoc. 2007, 2, 2875–2880. [DOI] [PubMed] [Google Scholar]
- a O’Connor S. D.; Olsen G. T.; Creager S. E. J. Electroanal. Chem. 1999, 466, 197–202. [Google Scholar]; b Creager S. E.; Wooster T. T. Anal. Chem. 1998, 70, 4257–4263. [Google Scholar]; c Sumner J. J.; Weber K. S.; Hockett L. A.; Creager S. E. J. Phys. Chem. B 2000, 104, 7449–7459. [Google Scholar]
- Gupta P.; Loos K.; Korniakov A.; Spagnoli C.; Cowman M.; Ulman A. Angew. Chem., Int. Ed. 2004, 43, 520–523. [DOI] [PubMed] [Google Scholar]
- Liu G. Y.; Xu S.; Qian Y. Acc. Chem. Res. 2000, 33, 457–466. [DOI] [PubMed] [Google Scholar]
- Castronovo M.; Lucesoli A.; Parisse P.; Kurnikova A.; Malhotra A.; Grassi M.; Grassi G.; Scaggiante B.; Casalis L.; Scoles G. Nat. Commun. 2011, 2, 297. [DOI] [PubMed] [Google Scholar]
- a Hoogsteen K. Acta Crystallogr. 1959, 12, 822–823. [Google Scholar]; b Hoogsteen K. Acta Crystallogr. 1963, 16, 907–916. [Google Scholar]
- Kandimalla E. R.; Agrawal S. Gene 1994, 149, 115–121. [DOI] [PubMed] [Google Scholar]
- Kandimalla E. R.; Agrawal S. Nucleic Acids Res. 1995, 23, 1068–1074. [DOI] [PMC free article] [PubMed] [Google Scholar]
- Kandimalla E. R.; Manning A.; Agrawal S. J. Biomol. Struct. Dyn. 1996, 14, 79–90. [DOI] [PubMed] [Google Scholar]
- Xodo L. E.; Manzini G.; Quadrifoglio F. Nucleic Acids Res. 1990, 18, 3557–3564. [DOI] [PMC free article] [PubMed] [Google Scholar]
- Lee I. B.; Lee J. Y.; Lee N. K.; Hong S. C. Curr. Appl. Phys. 2012, 12, 1027–1032. [Google Scholar]
- Giovannangeli C.; Thuong N. T.; Helene C. Proc. Natl. Acad. Sci. U.S.A. 1993, 90, 10013–10017. [DOI] [PMC free article] [PubMed] [Google Scholar]
- Trkulja I.; Biner S. M.; Langenegger S. M.; Häner R. ChemBioChem 2007, 8, 25–27. [DOI] [PubMed] [Google Scholar]
- Fatthalla M. I.; Pedersen E. B. Helv. Chim. Acta 2012, 95, 1538–1547. [Google Scholar]
- a Jeuken L. J. C.; McEvoy J. P.; Armstrong F. A. J. Phys. Chem. B 2002, 106, 2304–2313. [Google Scholar]; b Komorsky-Lovric S.; Lovric M. Anal. Chim. Acta 1995, 305, 248–255. [Google Scholar]
- White R. J.; Plaxco K. W. Anal. Chem. 2010, 82, 73–76. [DOI] [PMC free article] [PubMed] [Google Scholar]
- Esteban Fernández de Ávila B.; Watkins H. M.; Pingarrón J. M.; Plaxco K. W.; Palleschi G.; Ricci F. Anal. Chem. 2013, 85, 6593–6597. [DOI] [PubMed] [Google Scholar]
- a Patterson A.; Caprio F.; Vallée-Bélisle A.; Moscone D.; Plaxco K. W.; Palleschi G.; Ricci F. Anal. Chem. 2010, 82, 9109–9115. [DOI] [PMC free article] [PubMed] [Google Scholar]; b Ricci F.; Zari N.; Caprio F.; Recine S.; Amine A.; Moscone D.; Palleschi G.; Plaxco K. W. Bioelectrochemistry 2009, 76, 208–213. [DOI] [PMC free article] [PubMed] [Google Scholar]
- Liu G. Y.; Xu S.; Qian Y. Acc. Chem. Res. 2000, 33, 457–466. [DOI] [PubMed] [Google Scholar]
- Mirmomtaz E.; Castronovo M.; Grunwald C.; Bano F.; Scaini D.; Ensafi A. A.; Scoles G.; Casalis L. Nano Lett. 2008, 8, 4134–4139. [DOI] [PubMed] [Google Scholar]
- Bosco A.; Bano F.; Parisse P.; Casalis L.; De Simone A.; Micheletti C. Nanoscale 2012, 4, 1734–1741. [DOI] [PubMed] [Google Scholar]
- Santalucia J. Jr. Proc. Natl. Acad. Sci. U.S.A. 1998, 95, 1460–1465. [DOI] [PMC free article] [PubMed] [Google Scholar]
- Santalucia J. Jr.; Hicks D. Annu. Rev. Biophys. Biomol. Struct. 2004, 33, 415–440. [DOI] [PubMed] [Google Scholar]
- Owczarzy R.; Tataurov A. V.; Wu Y.; Manthey J. A.; Mc Quisten K. A.; Almabrazi H. G.; Pedersen K. F.; Lin Y.; Garretson J.; Mc Entaggart N. O.; Sailor C. A.; Dawson R. B.; Peek A. S. Nucleic Acids Res. 2008, 36, 163–169. [DOI] [PMC free article] [PubMed] [Google Scholar]
- Goni J. R.; de la Cruz X.; Orozco M. Nucleic Acids Res. 2004, 32, 354–360. [DOI] [PMC free article] [PubMed] [Google Scholar]
- Duca M.; Vekhoff P.; Oussedik K.; Halby L.; Arimondo P. B. Nucleic Acids Res. 2008, 36, 5123–5138. [DOI] [PMC free article] [PubMed] [Google Scholar]
Associated Data
This section collects any data citations, data availability statements, or supplementary materials included in this article.


