

Abstract
Background
In electroencephalogram (EEG) studies of auditory steady-state responses (ASSR), patients with schizophrenia show a deficit in power and/or phase-locking, particularly at the 40Hz frequency where these responses resonate. In addition, studies of the transient gamma band response (GBR) elicited by single tones have revealed deficits in gamma power and phase-locking in schizophrenia. We examined the degree to which the 40 Hz ASSR and the transient GBR to single tones are correlated and whether they assess overlapping or distinct gamma band abnormalities in schizophrenia.
Methods
EEG was recorded during 40 Hz ASSR and auditory oddball paradigms from 28 patients with schizophrenia or schizoaffective disorder (SZ) and 25 age- and gender-matched healthy controls (HC). The ASSR was elicited by 500 ms click trains, and the transient GBR was elicited by the standard tones from the oddball paradigm. Gamma phase and magnitude values, calculated using Morlet Wavelet transformations, were used to derive total power and phase-locking measures.
Results
Relative to HC, SZ patients had significant deficits in total gamma power and phase-locking for both ASSR- and GBR-based measures. Within both groups, the 40 Hz ASSR and GBR phase-locking measures were significantly correlated, with a similar trend evident for the total power measures. Moreover, co-varying for GBR substantially reduced 40 Hz ASSR power and phase-locking differences between the groups.
Conclusions
40 Hz ASSR and transient GBR measures provide very similar information about auditory gamma abnormalities in schizophrenia, despite the overall enhancement of 40 Hz ASSR total power and phase-locking values relative to the corresponding GBR values.
Keywords: Schizophrenia, gamma, Steady-state gamma-band response, Transient gamma-band response, EEG
Introduction
The auditory gamma band response (GBR) is a 40 Hz sinusoidal component that occurs in the first 100 ms of the auditory evoked potential or field in electroencephalographic (EEG) or magnetoencephalographic (MEG) recordings (Basar et al., 1987, Pantev et al., 1993, Pantev et al., 1991). When an auditory stimulus is repeated at a fixed rate or frequency, it drives the auditory steady-state response (ASSR) in EEG/MEG at the same rate (Galambos et al., 1981). Although higher and lower frequencies have been tested, the ASSR reaches a maximum at a 40 Hz repetition rate (Galambos, Makeig, 1981, O'Donnell et al., 2004, Pastor et al., 2002). This maximum could be due to the phase-synchronized overlap of individual GBRs that span 100 ms and linearly summate to produce a peak ASSR amplitude when stimuli are presented every 25 ms (i.e., at a 40 Hz frequency) (Bohorquez and Ozdamar, 2008). Alternatively, the 40 Hz ASSR may reflect distinct physiological properties of the circuitry subserving gamma band oscillations that only emerge when the circuits are externally driven at 40 Hz (Pantev, Elbert, 1993, Plourde, 2006, Ross et al., 2005). Synthetic 40 Hz ASSRs, constructed with auditory GBRs, have been compared to the 40 Hz ASSR in order to address whether they represent physiologically distinct phenomena (Bohorquez and Ozdamar, 2008, Plourde and Villemure, 1996, Presacco et al., 2010, Santarelli et al., 1995). However, we are unaware of any study that directly correlated the two measures. In addition, despite multiple reports of abnormal GBR (Hall et al., 2011, Hall et al., 2009, Hirano et al., 2008, Leicht et al., 2010, Lenz et al., 2010, Roach and Mathalon, 2008, Teale et al., 2008) and 40 Hz ASSR (Brenner et al., 2003, Hamm et al., 2011, Krishnan et al., 2009, Kwon et al., 1999, Light et al., 2006, Spencer et al., 2009, Spencer et al., 2008, Teale, Collins, 2008, Vierling-Claassen et al., 2008, Wilson et al., 2008) in schizophrenia, no study has examined the relationship between these measures in the same patient sample to determine if they reflect distinct pathophysiological processes. Accordingly, the present study examines the relationship between GBR and ASSR in healthy controls and patients with schizophrenia, and further compares the relative sensitivity of these measures to the pathophysiology underlying deficient gamma oscillations in schizophrenia.
The transient auditory GBR to the onset of a sound is of interest to multiple disciplines, including audiology, anesthesiology, cognitive neuroscience, and psychiatry. It was initially viewed as a reflection of sensory registration (Basar, 1972, Pantev, Makeig, 1991), having potential applications in audiology for determining hearing thresholds (Galambos, Makeig, 1981) and in anesthesiology for confirming consciousness (Dutton et al., 1999, Plourde and Villemure, 1996). The auditory GBR latency (20–100ms) and frequency (40 Hz) overlap with the auditory middle latency response (MLR) (Galambos, Makeig, 1981), but MEG studies have identified separate cortical generators of each (Pantev, Elbert, 1993, Ross et al., 2002). Throughout this text, GBR refers to the transient gamma oscillation that occurs in the MLR temporal window of the auditory evoked potential, which is typically estimated using some form of spectral decomposition to isolate the 40 Hz contribution to the signal. Research showing GBR sensitivity to physical stimulus characteristics (Schadow et al., 2007) as well as attention (Debener et al., 2003, Tiitinen et al., 1993) indicates both bottom-up and top-down influences on this component, broadening potential research applications. As described below, GBR abnormalities have also been observed in schizophrenia.
The ASSR, particularly when the rate of stimulation is 40 Hz, is also relevant to research in various fields. In the first report of the 40 Hz ASSR, Galambos et al (Galambos, Makeig, 1981) theorized that the 40 Hz ASSR was nothing more than the sum of overlapping GBRs that can be recorded efficiently by taking advantage of the phase overlap of successive GBRs when stimuli are presented every 25 ms, allowing a large number of stimuli to be presented in a relatively short time period (Galambos, Makeig, 1981). This initially made the measure appealing to audiology and anesthesiology researchers because it was a more efficient method of GBR data collection. However, Galambos’ seminal theory of 40 Hz ASSR generation was challenged by converging evidence: failed attempts to build ASSRs synthetically by superimposing GBRs (Plourde and Villemure, 1996, Santarelli, Maurizi, 1995); the differential effects of anesthetics on GBRs and ASSRs (Plourde and Villemure, 1996), and MEG evidence of non-overlapping generators in auditory cortex (Pantev, Elbert, 1993, Ross, Picton, 2002). Moreover, unlike the transient GBR, the ASSR takes 200–300ms to reach a stable magnitude and is perturbed for more than one gamma cycle if a short noise burst is presented within the driving stimulus (Krishnan, Hetrick, 2009, Ross, Herdman, 2005). However, a compelling quantitative approach using low-jitter steady-state stimulation and deconvolution to extract the transient GBR from within the ASSR has provided new support for the overlapping GBR theory of ASSR generation (Bohorquez and Ozdamar, 2008, Presacco, Bohorquez, 2010). Thus, whether the ASSR represents the summation of superimposed GBRs or the two components represent distinct neural phenomena is still a matter of some debate in the literature.
Despite the controversy over its relationship to GBR, the 40 Hz ASSR has continued to be of interest in many disciplines, especially because of the evidence implicating gamma oscillations in the synchronization of neural activity across distributed brain regions (Gray and Singer, 1989) and in the associated coding (Buzsaki and Draguhn, 2004) and binding of information necessary for the formation of percepts (Tallon-Baudry et al., 1997). This interest has been particularly prominent in schizophrenia research because of the dependence of gamma band oscillations on neurotransmitter receptors implicated in the illness, particularly gamma-aminobutryic acid (GABAA) (Deng and Huang, 2006, Gonzalez-Burgos and Lewis, 2008, Hashimoto et al., 2003, Impagnatiello et al., 1998, Lewis et al., 2008, Lewis et al., 2005, Sohal et al., 2009) and glutamatergic N-methyl-D-aspartate (NMDA) (Coyle et al., 2003, Doheny et al., 2000, Krystal et al., 2002, Roopun et al., 2008) receptors.
Selective deficits in 40 Hz ASSR in schizophrenia were first reported by Kwon et al (Kwon, O'Donnell, 1999). Subsequent ASSR studies have replicated this reduced 40 Hz ASSR deficit in schizophrenia (see (Brenner et al., 2009) for a review) except in one case (Hong et al., 2004). Early auditory GBR abnormalities in schizophrenia were first reported by Clementz et al (Clementz et al., 1997), a finding that has been replicated by some but not other subsequent studies (see (Gandal et al., 2012) for a review). Both 40 Hz ASSR and GBR abnormalities have been found in the first-degree relatives of schizophrenia patients (Hong, Summerfelt, 2004, Leicht et al., 2011), suggesting that abnormal gamma oscillations in response to auditory stimuli may be an endophenotypic marker of genetic risk for the illness. Despite this accumulating literature, few studies have reported both single stimulus GBR and 40 Hz ASSR abnormalities in the same sample of schizophrenia patients (Krishnan, Hetrick, 2009, Teale, Collins, 2008), with no studies to date providing direct comparisons of the two in terms of their sensitivity to schizophrenia. Moreover, no studies have reported on the correlation between the gamma abnormalities obtained from the two methods in the same patient sample. This issue is important because of the evidence described above suggesting that 40 Hz ASSR and the transient auditory GBR may reflect distinct physiological processes.
Accordingly, we asked if the ASSRs elicited by passive, steady-state stimulation at 40 Hz and the transient GBR elicited by a single auditory stimulus converge in patients with schizophrenia and in healthy controls. Furthermore, we asked whether gamma band oscillation abnormalities in schizophrenia are more pronounced when based on ASSR or GBR measures. Specifically, the following hypotheses were tested: 1) Schizophrenia patients show selective 40 Hz ASSR deficits in EEG power and phase synchrony, relative to 20 and 30 Hz ASSR conditions. 2) Schizophrenia patients show deficits in the power and phase synchrony of the transient GBR to single tones. 3) 40 Hz ASSR and the transient GBR measures are differentially sensitive to the pathophysiology of schizophrenia. 4) However, 40 Hz ASSR and the transient GBR show at least some correlation or convergence in schizophrenia patients and healthy controls. 5) Despite the relationship, the deficits in the 40 Hz ASSR in schizophrenia patients cannot be fully accounted for by their deficits intransient GBR, consistent with the measures being sensitive to at least some distinctive pathophysiological processes.
Methods and Materials
Participants
EEG data were acquired from 33 patients with schizophrenia or schizoaffective disorder and 26 healthy comparison subjects. Data from one patient and one control were excluded due to outlier EEG values (> 3 SD above group mean for multiple measures). Four other patients were excluded because more than 30% of trials in one or more conditions were rejected by automated artifact inspection routines. There were 28 patients with schizophrenia (n=18) or schizoaffective disorder (n=10) (SZ) and 25 healthy comparison (HC) subjects remaining. The demographic and clinical data for these subjects are summarized in Table 1.
Table 1.
Demographic and Clinical Data for Schizophrenia Patients and Healthy Controls.
| Schizophrenia Patients (N=28) | Healthy Controls (N=25) | |||||||
|---|---|---|---|---|---|---|---|---|
| Mean | S.D. | Min | Max | Mean | S.D. | Min | Max | |
| Age (years) | 39.3 | 10.7 | 22.1 | 56.1 | 36.1 | 12.5 | 21.8 | 59.3 |
| Average Parental SES‡ | 33.82 | 17.4 | 11 | 69 | 33.78 | 14.7 | 11 | 62 |
| Education (years)* | 13.7 | 1.7 | 10 | 16 | 16 | 2.3 | 12 | 20 |
| PANSSa Positive† | 15.4 | 5 | 7 | 25 | ||||
| PANSS Negative | 14.3 | 5.2 | 7 | 22 | ||||
| PANSS General | 30.4 | 9.1 | 17 | 54 | ||||
| Race | 22 Caucasian, 5 African American, 1 Asian | 16 Caucasian, 4 African American, 3 Hispanic, 2 Asian | ||||||
| Handedness | 27 Right, 1 Left | 22 Right, 2 Left, 1 Ambidextrous | ||||||
| Gender | 21 Male, 7 Female | 14 Male, 11 Female | ||||||
| Diagnosis | Paranoid Schizophrenia (16) | |||||||
| Undifferentiated Schizophrenia (2) | ||||||||
| Schizoaffective Depressed Type (6) | ||||||||
| Schizoaffective Bipolar Type (4) | ||||||||
| Antipsychotic Medication | 2 typical, 20 atypical, 6 both | |||||||
Socioeconomic status (SES) based on Hollingshead Scale; Higher scores indicate lower socioeconomic status.
p<.05 with independent samples t-test
Positive and Negative Syndrome Scale
Ratings not available for two patients
SZ patients were recruited from inpatient and outpatient services of the Connecticut Mental Health Center and the Veterans Affairs Healthcare System in West Haven, CT. All SZ were on stable doses of antipsychotic medications for at least two weeks prior to testing and met DSM-IV criteria for schizophrenia or schizoaffective disorder based either on the diagnosis from a Structured Clinical Interview for DSM-IV (First and Frances, 1995) conducted by a psychiatrist or psychologist, or by consensus of a SCID interview conducted by a trained research assistant and a clinical interview by a psychiatrist or psychologist. Patient symptom severity was assessed using the Positive and Negative Syndrome Scale (PANSS) (Kay et al., 1987). SZ were excluded if they met DSM-IV criteria for alcohol or drug abuse within one month prior to the recording session. In addition, SZ and HC subjects were excluded for head injuries resulting in a greater than 30 minute loss of consciousness, neurological disorders, significant hearing loss in either ear, or other medical illnesses compromising the central nervous system.
HC were recruited by posted advertisements and word-of-mouth, screened by telephone using SCID screening questions (First and Frances, 1995) and excluded for any history of a major Axis I psychiatric disorder based on the SCID. All subjects provided written informed consent to participate in this study approved by the Yale Human Investigation Committee.
Experimental Paradigms
Auditory Steady State Response Paradigm
The ASSR paradigm was similar to the one used by Kwon et al (Kwon, O'Donnell, 1999). Subjects were seated comfortably in a sound-attenuated booth and listened to sounds while maintaining visual fixation on a white cross centered on a black screen. The sounds consisted of trains of 1-millisecond rarefaction clicks presented at a frequency of 20 Hz (9 clicks, 1 every 50 ms), 30 Hz (14 clicks, 1 every 33.33 ms), or 40 Hz (19 clicks, 1 every 25 ms). Each frequency was presented in a separate block of 150 click trains with a 700 ms inter-stimulus interval, using a uniform block order (20 Hz, 30 Hz, 40 Hz) across subjects. Sounds were delivered via headphones at 80dB SPL through a STIM audio box (Compumedics Neuroscan).
Gamma Band Response Paradigm
We assessed the transient GBR elicited by the standard tones presented as part of a three-stimulus auditory oddball task, described in more detail elsewhere (Ford et al., 2008, Mathalon et al., 2010). The high probability (p=.7) standard stimuli were 500Hz, 50 ms tones presented with a stimulus-onset asynchrony of 1.25 sec 210 times over the course of the task. Sounds were delivered at 80dB SPL in the manner described above for the ASSR paradigm. In terms of paradigm order, the auditory oddball task was always presented first, and the ASSR paradigm was always last.
EEG Acquisition
EEG data were acquired at 1000 Hz from 26 sites (F7, F3, Fz, F4, F8, FT7, FC3, FC4, FT8, T3, C3, Cz, C4, T4, TP7, CP3, CP4, TP8, T5, P3, Pz, P4, T6, O1, Oz, O2), bandpass filtered between 0.05 Hz and 100 Hz, and referenced to linked ears. Additional electrodes were placed on the outer canthi of both eyes and above and below the left eye to record eye movements and blinks (vertical and horizontal electro-oculogram; VEOG, HEOG). All impedances were maintained at or below 10kOhm throughout the recording session with most EEG sites below 5kOhm.
Single trial EEG epochs were stimulus-locked to the onset of each click train or standard tone, including data from 300 ms before the start of the sound and 900 ms after it. Individual trials were baseline corrected using the 100 ms period preceding sound onset after correcting for eye movements and blinks using EOG data (Gratton et al., 1983). Finally, trials containing artifacts (voltages exceeding ±75 µV) in any of the central 9 electrodes examined in the present study (F3, Fz, F4, C3, Cz, C4, P3, Pz, or P4) were rejected.
EEG Time-Frequency Analysis: Phase-Locking Factor and Total Power
Time-frequency analysis of EEG single trial data was done with a Morlet wavelet decomposition using freely distributed FieldTrip (http://fieldtrip.fcdonders.nl/) software in Matlab (http://www.mathworks.com/products/matlab/). This method has been described previously (Tallon-Baudry, Bertrand, 1997), but it is important to note the specific parameters used here. The Morlet wavelet has a Gaussian shape that is defined by a ratio (σf = f/C) and a wavelet duration (6σt), where f is the center frequency and σt = 1/(2πσf). In a classic wavelet analysis, C is a constant, ensuring an equal number of cycles in the mother wavelet for each frequency. Such an approach was used to create wavelets for the GBR analysis, as was done in our prior study (Roach and Mathalon, 2008). In this approach, as the frequency (f) increases, the spectral bandwidth (6σf) increases. In the ASSR analysis, the constant (C) was varied (20 Hz C= 7; 30 Hz C=10.5; 40 Hz C=14) such that the spectral bandwidth was equal (6σf =17.1429 Hz) at 20, 30, and 40 Hz, minimizing frequency overlap without excessive loss of temporal resolution. For the remaining 1 Hz bins calculated, C was 7 for frequencies less than 20, 14 for frequencies greater than 40, and linearly spaced between 7 and 14 for frequencies between 20 and 40 Hz. This method was used to decompose single trial time-frequency values between 10 and 100 Hz for the central nine electrodes.
After applying this method, phase-locking factor (PLF) was calculated as 1-minus the circular phase angle variance, as described by Tallon-Baudry et al (Tallon-Baudry, Bertrand, 1997). PLF provides a measure of the phase consistency of frequency specific oscillations with respect to stimulus onset across trials on a millisecond basis. In addition, event-related total power was calculated by averaging the squared single trial magnitude values in each 1 Hz frequency bin on a millisecond basis. The average total power values were 10log10 transformed and then baseline corrected by subtracting the average of the pre-stimulus baseline (−100 to 0 ms) from each time point separately for every frequency. The resulting event-related change in total power values (relative to baseline) are in decibels (dB), as this calculation is equivalent to
Statistical Analysis
ASSR PLF and total power values were extracted by averaging the data across a 200–400 ms time window in 5 Hz bins centered on 20, 30, and 40 Hz, representing the response at each driving frequency. The time window was selected to capture a stable SSR period between onset and offset of the response. Each of these time-frequency measures was subjected to a 3-way repeated measures analysis of variance (ANOVA) with Group (SZ, HC) as a between-subjects factor, and Frequency (20, 30, 40 Hz) and Lead (Fz, Cz) as within-subjects factors.
Transient GBR PLF and total power values from the time-frequency analysis of oddball task standard tones were extracted by averaging across 35 to 50Hz frequencies within the 20 to 60 ms post-stimulus time window, as done previously (Roach and Mathalon, 2008). Each of these time-frequency measures was subjected to a 2-way repeated measures ANOVA with Group (SZ, HC) as the between-subjects factor and Lead (Fz, Cz) as the within-subjects factor.
To test the sensitivity of these paradigms to the presence of schizophrenia, 40 Hz ASSR and standard tone GBR time-frequency measures (PLF and total power) were analyzed using a 3-way ANOVA with Group (SZ, HC) as the between-subjects factor, and Paradigm (ASSR, GBR) and Lead (Fz, Cz) as within-subjects factors.
Analysis of Covariance (ANCOVA) models were applied to the 40 Hz ASSR measures with Group (SZ, HC) as the between-subjects factor and GBR as the covariate. This was done separately for PLF and total power measures averaged over the 2 electrodes. After first ruling out significant slope differences between the two groups, the ANCOVA model allowed us to assess a) whether there was a significant relationship between the 40 Hz ASSR and standard tone GBR, and b) whether the group difference in 40 Hz ASSR persisted after controlling for GBR.
In addition, based on a prior study showing intact or enhanced 40 Hz ASSR power and PLF in patients with schizoaffective disorder (Reite et al., 2010), ANOVA was used to compare the subgroup of schizoaffective disorder (SAD) patients with the remaining SZ patients and the HC subjects on both the 40 Hz ASSR and GBR total power and PLF measures.
To examine relationships between clinical symptoms and gamma band measures in the SZ group, we conducted Pearson correlations between PANSS positive and negative symptom sub-scale scores and the PLF and total power measures assessed in the 40 Hz ASSR and GBR paradigms.
All p-values are Greenhouse-Geisser corrected when appropriate and higher order interactions were parsed with lower order ANOVAs.
Results
ASSR
Results of the 3-way repeated measures ANOVAs for the PLF and total power measures from the ASSR paradigm are presented in Table 2. Because our focus was on examining group differences in these measures, we primarily describe the highest order significant interaction effects involving Group, or in the absence of interactions, the main effects of Group.
Table 2.
ANOVA Results for Auditory Steady State Response (ASSR) and Gamma Band Response (GBR) Phase Locking Factor (PLF) and Total Power.
| ASSR | ||||||
|---|---|---|---|---|---|---|
| Source | PLF |
Total Power |
||||
| df | F | p | df | F | p | |
| Group | 1,51 | 4.139 | 0.047 | 1,51 | 3.477 | 0.068 |
| Frequency | 2,102 | 135.541 | 0.000 | 2,102 | 82.824 | 0.000 |
| Group X Frequency | 2,102 | 2.720 | 0.072 | 2,102 | 4.225 | 0.033 |
| 20 Hz frequency: group | 1,51 | 0.131 | 0.719 | 1,51 | 0.050 | 0.824 |
| 30 Hz frequency: group | 1,51 | 1.909 | 0.173 | 1,51 | 0.058 | 0.810 |
| 40 Hz frequency: group | 1,51 | 5.298 | 0.025 | 1,51 | 4.459 | 0.040 |
| Lead | 1,51 | 75.028 | 0.000 | 1,51 | 46.270 | 0.000 |
| Group X Lead | 1,51 | 2.152 | 0.148 | 1,51 | 1.438 | 0.236 |
| Frequency X Lead | 2,102 | 12.419 | 0.000 | 2,102 | 23.394 | 0.000 |
| Group X Frequency X Lead | 2,102 | 0.570 | 0.558 | 2,102 | 1.145 | 0.317 |
|
GBR | ||||||
| Source | PLF |
Total Power |
||||
| df | F | p | df | F | p | |
| Group | 1,51 | 5.829 | 0.019 | 1,51 | 5.773 | 0.020 |
| Lead | 1,51 | 56.823 | 0.000 | 1,51 | 17.702 | 0.000 |
| Group X Lead | 1,51 | 2.978 | 0.090 | 1,51 | 1.491 | 0.228 |
significant effects are in bold font
PLF
As can be seen in Table 2, the 3-way Frequency X Lead X Group interaction was not significant. However, there was a trend (p=.072) towards a significant Frequency x Group interaction. To parse this interaction, separate ANOVAs were conducted for each Frequency. The models examining 20 Hz and 30Hz driving frequencies revealed no significant Group effects, but a significant effect did emerge for the 40 Hz model (p = 0.025). This effect was driven by greater 40 Hz ASSR in HC compared to SZ (Figure 2, left).
Figure 2.

Healthy control (HC, solid lines) and schizophrenia (SZ, dashed lines) group mean time-frequency data for 40 Hertz (Hz) (black), 30 Hz (green) and 20 Hz (orange) driving conditions are plotted for Phase-locking Factor (PLF) (left), and total power (right) measures on the top row. The rate of change (i.e. slope) in 20 millesecond (ms) increments from each measure in all conditions are plotted on the bottom row. All values are based on the group average taken in bands ±2Hz around the stimulated frequency. Gray shading between 200 and 400 ms highlights the period of the auditory steady-state response with greatest stability across all conditions, groups, and measures.
There were some additional significant effects worth noting. A significant main effect of Frequency indicated, as expected, that 40 Hz driving produces a significantly greater PLF than 30 and 20 Hz driving frequencies (p<.001), and further, that 30 Hz PLF was significantly greater than 20 Hz PLF (p<.001). There was a significant Lead effect due to greater responses at Fz than Cz (p<.001). A significant Frequency x Lead interaction indicated that the stronger Fz PLF relative to Cz PLF was most pronounced for the 40 Hz driving condition.
Total Power
Table 2 shows that, like PLF, the 3-way interaction was not significant. However, there was a significant Frequency x Group interaction. To parse this interaction, separate ANOVAs were conducted for each Frequency. The models examining 20 Hz and 30Hz driving frequencies revealed no significant Group effects, but a significant effect did emerge for the 40 Hz model (p=0.04) due to reduced 40 Hz total power in SZ (Figure 2, right).
A significant main effect of Frequency matched the PLF pattern with significantly greater 40 Hz driving power compared to 30 and 20 Hz driving frequencies (p<.001), while 30 Hz power was significantly greater than 20 Hz power (p<.001). Similar to PLF, a significant Frequency x Lead effect was due to enhanced Fz power relative to Cz, which was most pronounced for the 40 Hz driving condition.
GBR
Results of the 2-way repeated measures ANOVAs for the PLF and total power measures from the GBR paradigm are presented in Table 2.
PLF
There were main effects of Group and Lead. As previously reported (Roach and Mathalon, 2008), HC showed greater PLF GBRs than SZ, and Fz was greater than Cz (p< .001), but Lead did not interact with Group.
Total Power
Much like PLF, there was a group difference in total power (HC > SZ). A main effect of Lead was driven by greater power at Fz compared to Cz (p<.001), but Lead did not significantly interact with Group.
Comparing GBR and ASSR data
Results of the 3-way repeated measures ANOVAs for the PLF and total power from the paradigm comparison are presented in Table 3. We focus on the main effect of Paradigm and its interactions below because other effects are redundant with the individual paradigm models.
Table 3.
Group x Paradigm x Lead ANOVA Results for Phase Locking Factor (PLF) and Total Power.
| Source | PLF |
Total Power |
||||
|---|---|---|---|---|---|---|
| df | F | p | df | F | p | |
| Group | 1,51 | 7.438 | .009 | 1,51 | 6.072 | .017 |
| Paradigm | 1,51 | 288.057 | .000 | 1,51 | 123.446 | .000 |
| Group X Paradigm | 1,51 | 2.147 | .149 | 1,51 | 2.592 | .114 |
| Lead | 1,51 | 87.630 | .000 | 1,51 | 56.469 | .000 |
| Group X Lead | 1,51 | .287 | .595 | 1,51 | .001 | .978 |
| Paradigm X Lead | 1,51 | 13.708 | .001 | 1,51 | 38.607 | .000 |
| Group X Paradigm X Lead | 1,51 | 4.696 | .035 | 1,51 | .562 | .457 |
| Paradigm X Lead in each Group | ||||||
| HC: Paradigm X Lead | 1,24 | 1.174 | .289 | |||
| SZ: Paradigm X Lead | 1,27 | 17.480 | .000 | |||
| SZ Fz: Paradigm | 1,27 | 163.682 | .000 | |||
| SZ Cz: Paradigm | 1,27 | 73.188 | .000 | |||
| Group X Paradigm at each Lead | ||||||
| Fz: Group X Paradigm | 1,51 | 1.000 | .322 | |||
| Cz: Group X Paradigm | 1,51 | 3.152 | .082 | |||
| Cz GBR: Group | 1,51 | 4.212 | .045 | |||
| Cz ASSR: Group | 1,51 | 5.681 | .021 | |||
| Group X Lead in each Paradigm | ||||||
| GBR: Group X Lead | 1,51 | 2.978 | .090 | |||
| ASSR: Group X Lead | 1,51 | 2.152 | .148 | |||
significant effects are in bold font
PLF
There was a main effect of Paradigm driven by greater PLF in 40 Hz ASSR compared to GBR. While the Group X Paradigm interaction failed to reach significance, there was a significant Group X Paradigm X Lead interaction. This interaction was parsed by conducting 2-way ANOVAs for each level of the third factor (Table 3). The main source of the 3-way interaction was the presence of a significant Paradigm X Lead interaction in SZ (p < .001) but not HC (p = .289). Inspection of Figure 3 (bottom left) indicates that in SZ, that there was a greater drop off in PLF from Fz to Cz for the 40 Hz ASSR paradigm than for the GBR paradigm, resulting in a greater paradigm difference at Fz than at Cz. In contrast, HC showed comparable declines in PLF from Fz to Cz across the two paradigms, resulting in equivalent paradigm effects at each lead. Interestingly, when 2-way Group x Paradigm ANOVAs were run at each lead, there was only an interaction trend (p=.082) at Cz and a non-significant interaction at Fz. Thus, while there was a tendency for the Group effect at Cz to be larger for the ASSR paradigm (p=.021) than for the GBR paradigm (p=.045), the difference was quite modest and failed to reach statistical significance.
Figure 3.
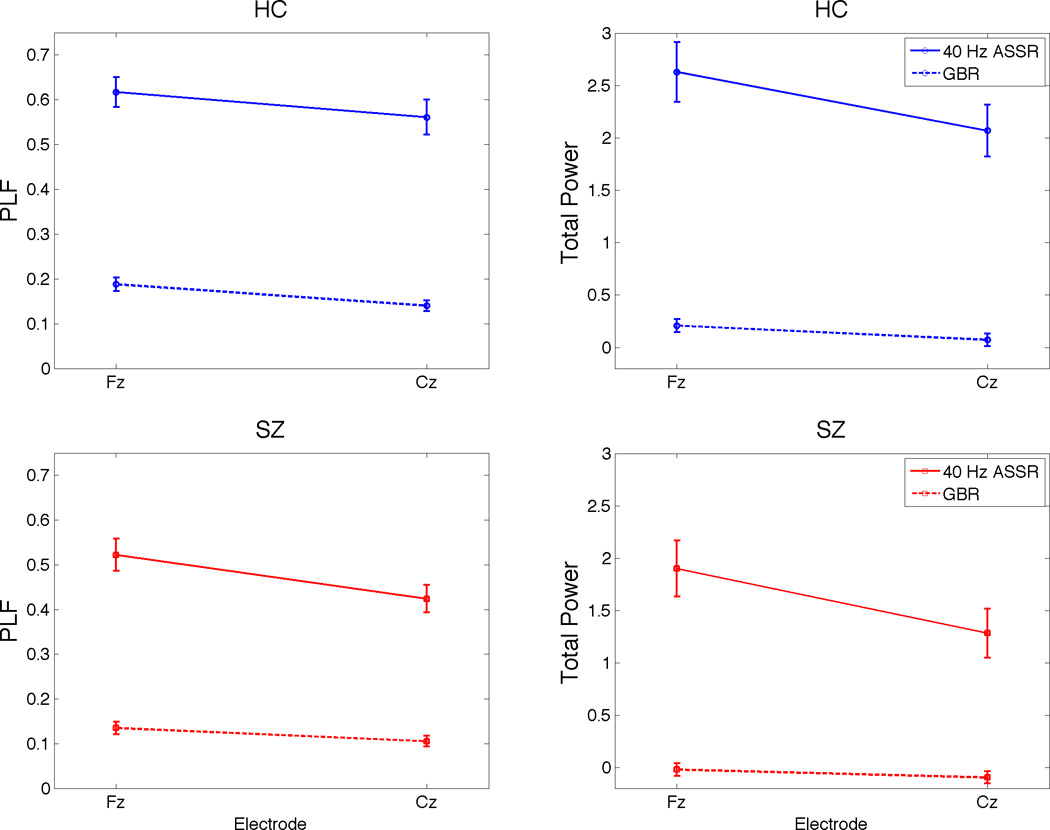
Healthy control (HC, blue lines) and schizophrenia (SZ, red lines) group means and standard error bars from gamma band response (GBR) and 40 Hertz auditory steady-state response (ASSR) conditions at electrodes Fz and Cz are plotted for phase-locking factor (PLF) (left) and total power (right).
Total Power
The total power model produced the same Paradigm effect as PLF (ASSR>GBR) (Figure 3, right panel). The Group X Paradigm and Group X Paradigm X Lead interactions both failed to reach significance.
Relationship Between GBR and ASSR
PLF
The group difference in the 40 Hz ASSR PLF, controlling for GBR PLF, was assessed using an ANCOVA after ruling out a group difference in the slopes of the ASSR vs. GBR regression lines (Group X GBR interaction: F(1,49) = .644, p = .426) and dropping the interaction term from the model. In the resulting model (See Table 4), GBR PLF was directly related to 40 Hz ASSR PLF (p = .018; Figure 4, left). Controlling for the GBR, the Group effect (i.e., group difference in regression line intercepts shown in Figure 4, left) did not reach significance (p = .139).
Table 4.
Group ANCOVA Results for 40 Hz Auditory Steady State Response (ASSR), Covarying for Auditory Gamma Band Response, for Phase Locking Factor (PLF) and Total Power Measures averaged over Electrodes Fz and Cz
| Source | PLF | Total Power | ||||
|---|---|---|---|---|---|---|
| df | F | p | df | F | p | |
| GBR | 1,50 | 5.952 | .018 | 1,50 | 3.453 | .069 |
| Group | 1,50 | 2.258 | .139 | 1,50 | 2.121 | .152 |
significant effects are in bold font
Figure 4.

The relationship between standard tone gamma band response (GBR: x-axis) and 40 Hertz (Hz) auditory steady-state response (ASSR: y-axis) is illustrated with separate scatter plots for phase-locking factor (PLF, left) and total power (right). Each point represents single subject (schizophrenia(SZ): red square; Healthy Control (HC): blue circle) data, averaged across 35–50 Hz and 20–60 milleseconds (ms) for the GBR or across 38–42 Hz and 200–400 ms for the ASSR. Regression lines are plotted separately using the common slope and separate intercepts for each group (SZ: red; HC: blue) to show the relationship between paradigms for PLF (partial r (controlling for Group) = .326, p = .018) and total power (partial r (controlling for Group) = .254, p = .069).
Total Power
After establishing that the ASSR vs. GBR regression line slopes were equivalent between the groups (Group X GBR interaction: F(1,49) = .313, p = 0.578) and dropping the interaction term, an ANCOVA model (see Table 4) examined group differences in 40 Hz ASSR total power while covarying for GBR. GBR total power showed a trend toward a significant positive relationship (p = .069) with ASSR total power (Figure 4, right). Controlling for this relationship, the Group effect (i.e., group difference in regression line intercepts shown in Figure 4, right) on 40 Hz ASSR total power was not significant (p = .152).
Schizoaffective Disorder Subgroup Analysis
The ANOVA planned contrasts comparing the subgroup of SAD patients with HC subjects showed significant or trend level reductions in the SAD patients across gamma measures and paradigms (40 Hz ASSR: PLF (p=.032), total power (p=.073); GBR: PLF (p=.009), total power (p=.032). The SAD and SZ patient subgroups did not significantly differ from each other on any of the gamma measures (40 Hz ASSR: PLF (p=.444), total power (p=.531); GBR: PLF (p=.176), total power (p=.394)).
Symptom Correlations
In the SZ patients, PANSS positive and negative symptom sub-scale scores were not significantly correlated with PLF or total power for the 40 Hz ASSR and GBR measures at Fz and Cz (all p-values > .29).
Discussion
In this study, we assessed 40 Hz ASSRs and GBRs in patients with schizophrenia (including schizoaffective patients) and healthy control subjects, comparing the groups on each paradigm and examining the relative sensitivity of each paradigm to schizophrenic pathophysiology. Patients showed abnormal reductions in auditory gamma band phase synchrony and total power when assessed as an ASSR to 40 Hz click trains or as a GBR to standard tones from an oddball task. These results indicate that schizophrenia is associated with both deficient phase resetting and diminished magnitude of gamma oscillations in response to auditory stimuli. In addition, the 40 Hz ASSR and auditory GBR were only modestly correlated, sharing only about 5–10% of their variance. Despite the limited overlap between the ASSR and GBR measures, they converged in their sensitivity to the pathophysiology of schizophrenia. The equivalent sensitivity to schizophrenia was demonstrated by the lack of a significant Group X Paradigm interaction as well as the elimination of the 40 Hz ASSR group effect after controlling for auditory GBR differences. Thus, while the 40 Hz ASSR and GBR measures are largely independent, they do not appear to provide unique information about auditory gamma oscillation phase consistency or magnitude abnormalities in schizophrenia.
In many respects, our independent ASSR and GBR results are consistent with other studies in the literature. Like most (Krishnan, Hetrick, 2009, Light, Hsu, 2006, Spencer, Niznikiewicz, 2009, Spencer, Salisbury, 2008, Teale, Collins, 2008), but not all (Hamm, Gilmore, 2011), prior reports, we found a reduction in the PLF, or phase consistency across trials, of the 40 Hz ASSR in SZ patients. We also found reduced auditory GBR PLF, consistent with our prior report (Roach and Mathalon, 2008) from a patient sample that partially overlapped with the current sample, and replicating some (Hall, Taylor, 2009, Hirano, Hirano, 2008, Leicht, Kirsch, 2010), but not all (Krishnan, Hetrick, 2009, Spencer et al., 2007, Teale, Collins, 2008), prior studies. Further, reduced total power in SZ relative to HC in both the 40 Hz ASSR and GBR measures replicates the findings of Krishnan et al (Krishnan, Hetrick, 2009).
Few prior studies have simultaneously examined the 40 Hz ASSR and transient auditory GBR in the same patient sample, and of those that have (Krishnan, Hetrick, 2009, Teale, Collins, 2008), none have directly compared their sensitivity to the SZ effect. We predicted that 40 Hz ASSR power and phase measures would better differentiate SZ from HC than auditory GBR, in part based on the stronger signal (i.e., greater phase synchrony across trials and greater magnitude) associated with the ASSR relative to the GBR paradigm. However, our results failed to support this hypothesis, instead showing the schizophrenia effect sizes to be statistically equivalent for the 40 Hz ASSR and GBR measures. Moreover, although the GBR and 40 Hz ASSR measures were only modestly related for PLF and total power measures, controlling for their shared variance eliminated the significant schizophrenia group difference in the 40 Hz ASSR phase and magnitude. This suggests that it is the physiological mechanisms shared by the GBR and 40 Hz ASSR, rather than the independent aspects of their underlying physiology, that are compromised in schizophrenia.
The relatively small correlation between the GBR and 40 Hz ASSR measures is not consistent with the view, originally proposed by Galambos and colleagues (Galambos, Makeig, 1981) that the 40 Hz steady-state response consists of nothing more than overlapping phase synchronized auditory GBRs (also referred to in the time domain as middle-latency responses; MLRs), or similarly, that the 40 Hz ASSR can be constructed by superimposition of MLRs evoked by auditory stimuli spaced roughly 25 ms apart (Bohorquez and Ozdamar, 2008). However, the small correlation between the ASSR and GBR is consistent with other lines of evidence suggesting that the measures are not equivalent. This evidence includes observations that the 40 Hz ASSR takes about 200 ms to plateau and is disrupted for multiple cycles when perturbed with irregular stimulation in the middle of an amplitude modulated steady-state tone (Krishnan, Hetrick, 2009, Ross, Herdman, 2005). Furthermore, even studies of deconvolved and synthetically constructed 40 Hz ASSRs have documented unpredictable onset characteristics in the response that must be further explored (Presacco, Bohorquez, 2010). Additional evidence of distinct processes contributing to the GBR and ASSR comes from source localization studies implicating different generators of each response in the primary auditory cortex (Pantev, Elbert, 1993, Ross, Picton, 2002) or ASSR-specific subcortical generators, such as bilateral posterolateral portions of the cerebellar hemispheres (Pastor, Artieda, 2002). In addition, differences in task features in our study may have weakened any intrinsic correlation between the GBR and ASSR measures. Bottom-up modulation of the GBR has been demonstrated by manipulating stimulus intensity (Schadow, Lenz, 2007), raising the possibility that differences between the physical characteristics of the auditory stimuli used in our GBR and ASSR paradigms may have attenuated the correlation between them. Specifically, because of the tonotopic organization of the auditory cortex, the broadband white noise clicks used to elicit ASSRs would be expected to activate a larger neural population than the pure tones used to elicit the GBRs, resulting in greater phase consistency across trials and larger event-related increases in power. Further attenuation of the relationship between the measures could have arisen from the top-down attentional processes directed toward the auditory stream during the oddball task used to assess the GBR, processes that would not have been engaged during the passive presentation of click trains used to assess the ASSR.
Yet another factor that may have attenuated the relationship between the GBR and ASSR and is the presence of more noise in the GBR signal relative to the ASSR, which benefits from enhanced signal-to-noise due to the overlapping MLRs. The literature on test-retest reliability of ASSR is limited to clinical studies of hearing levels in audiology research (Kaf et al., 2006), or frequency-based fast-Fourier transformation measurements of evoked power (van Deursen et al., 2011). However, reliability of evoked power and phase consistency across repeated test sessions has been demonstrated in the visual domain (Frund et al., 2007). Future studies are needed to assess test-retest reliability of the PLF and total power of 40Hz ASSR and GBR since unreliability of one or both measures may account for their modest correlation. Moreover, establishing that these measures are reliable in schizophrenia patients is a pre-requisite for using them to track treatment response or illness progression.
A prior study of the 40 Hz ASSR that specifically compared SAD patients to SZ patients and HC found that while SZ patients had abnormally reduced PLF, SAD patients had normal PLF, and further, had greater 40 Hz evoked power than both HC and SZ (Reite, Teale, 2010). Examining the sub-group of SAD patients included in our patient sample (n=10), we failed to replicate this pattern of results. In our sample, the SAD patients showed significant reductions in both 40 Hz ASSR and GBR PLF relative to HC. Similar effects were observed for the total power measures. In no case did the SAD and SZ patient sub-groups differ from each other. In both the current study and the prior report by Reite and colleagues (Reite, Teale, 2010), the number of SAD patients was relatively small, suggesting that sampling error may account for the conflicting results between the two studies. However, our results in SAD patients are broadly consistent with reports of 40 Hz ASSR reductions in patients with affective psychoses (Spencer, Salisbury, 2008) and bipolar disorder (O'Donnell, Hetrick, 2004), suggesting that disturbances in gamma oscillations may be associated with psychotic syndromes across the schizophrenia-affective disorder spectrum.
In addition to gamma oscillations in response to auditory stimuli, EEG gamma activity has been implicated in registration of stimuli in other sensory modalities, as well as in higher order cognitive processes like perceptual binding (Tallon-Baudry, Bertrand, 1997) and cognitive control (Cho et al., 2006, Lewis, Cho, 2008, Minzenberg et al., 2010). It remains unclear whether the 40 Hz ASSR and auditory GBR measures of gamma oscillations assessed in the current study are correlated with the gamma activity elicited by stimuli presented in other sensory modalities or during more cognitively demanding tasks. If visual, olfactory, and somatosensory GBRs, as well as gamma responses elicited by higher order cognitive tasks, correlate with the auditory GBR, the hypothesis that gamma oscillations measured by EEG reflect ubiquitous pan-cortical assemblies of similar local circuits, such as interneuron-pyramidal cell networks, would be supported. This might suggest that auditory gamma band measures could serve as proxies for measures of gamma activity across cortical regions, regardless of the sensory system or cognitive process engaged. Arguing against this possibility are the roles attention (Ross et al., 2004, Skosnik et al., 2007) and arousal (Griskova et al., 2007) play in modulating the phase consistency of the 40 Hz ASSR across trials and its event-related change in power. Skosnik et al (Skosnik, Krishnan, 2007) used 20Hz and 40Hz steady-state stimuli as frequent and infrequent stimuli in an oddball paradigm, revealing 40Hz ASSR PLF and evoked power enhancement on 40Hz targets relative to 40Hz standards even after matching the trial numbers for each stimulus type. These results support the literature showing gamma-band ASSR enhancement with increased attention (Bidet-Caulet et al., 2007, Ross, Picton, 2004, Saupe et al., 2009a, Saupe et al., 2009b). Thus, if ASSRs or GBRs are a proxy for other methods of eliciting gamma band responses, attention must be controlled. Krishnan et al (Krishnan, Hetrick, 2009) used a visual task to address potential differences in attention between patient and control groups during passive listening and found phase-locking and power reductions in SZ similar to those described here and elsewhere (Brenner, Sporns, 2003, Kwon, O'Donnell, 1999, Light, Hsu, 2006, Spencer, Niznikiewicz, 2009, Spencer, Salisbury, 2008) despite the failure to control attention with a visual distracter task in these latter studies. However, to our knowledge, there have been no studies comparing the ASSR between SZ and HC while explicitly directing subject attention to the auditory stimuli by making them task relevant. Thus, it remains uncertain whether the schizophrenia deficits in the 40 Hz ASSR can be ameliorated by enhancing attention to the auditory stimuli.
All patients in our study were on either typical, atypical, or a combination of typical and atypical antipsychotic medications, creating a medication confound for the patient vs. control comparisons. Prior literature addressing the role of antipsychotic medication in modulating gamma oscillations is sparse and equivocal. One study of 40 Hz ASSR showed enhanced evoked power in SZ on atypical antipsychotics relative to both SZ on typical antipsychotics and HC (Hong, Summerfelt, 2004). However, these differences were not replicated in a larger sample (Light, Hsu, 2006).
In conclusion, patients with schizophrenia show deficits across time-frequency decompositions of gamma oscillations in both steady-state and oddball paradigms. Both phase and power measures of 40 Hz ASSR and GBR seem to be sensitive to the same pathophysiological process in schizophrenia, despite only being modestly correlated. Indeed, results from our study suggest that each paradigm provides essentially the same information about auditory gamma band abnormalities in schizophrenia, despite the overall enhancement of both phase-resetting and event-related changes in power in the 40 Hz ASSR relative to the GBR. Thus, collecting both paradigms appears to offer little or no advantage relative to using just one of the paradigms, an important consideration when developing an EEG/ERP battery for schizophrenia studies.
Figure 1.
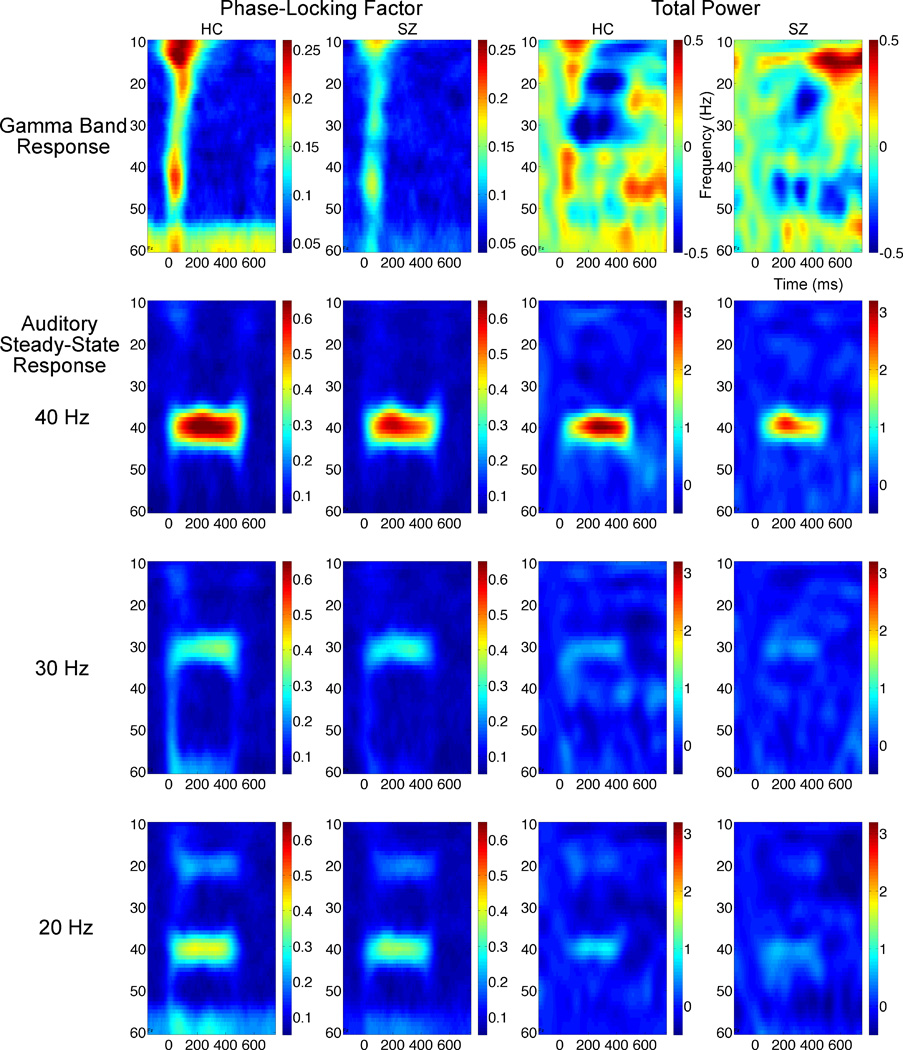
Grand average time-frequency maps from 25 healthy controls (HC) and 28 schizophrenia patients (SZ) are plotted with frequencies on the y-axis and time on the x-axis. Gamma Band Responses are plotted on the top row while Auditory Steady-State Responses for 20, 30, and 40 Hertz (Hz) driving conditions are shown on the second, third, and fourth rows respectively. Dark red colors indicate little phase variance across trials in the first two columns, whereas dark blue colors indicate equally distributed phase variance across trials. In the third and fourth columns, total power data are plotted in deciBel units, with dark red and blue showing magnitude increases or decreases relative to a 100 millisecond baseline.
References
- Basar E. A study of the time and frequency characteristics of the potentials evoked in the acoustical cortex. Kybernetik. 1972;10:61–64. doi: 10.1007/BF00292231. [DOI] [PubMed] [Google Scholar]
- Basar E, Rosen B, Basar-Eroglu C, Greitschus F. The associations between 40 Hz-EEG and the middle latency response of the auditory evoked potential. Int J Neurosci. 1987;33:103–117. doi: 10.3109/00207458708985933. [DOI] [PubMed] [Google Scholar]
- Bidet-Caulet A, Fischer C, Besle J, Aguera PE, Giard MH, Bertrand O. Effects of selective attention on the electrophysiological representation of concurrent sounds in the human auditory cortex. J Neurosci. 2007;27:9252–9261. doi: 10.1523/JNEUROSCI.1402-07.2007. [DOI] [PMC free article] [PubMed] [Google Scholar]
- Bohorquez J, Ozdamar O. Generation of the 40-Hz auditory steady-state response (ASSR) explained using convolution. Clin Neurophysiol. 2008;119:2598–2607. doi: 10.1016/j.clinph.2008.08.002. [DOI] [PubMed] [Google Scholar]
- Brenner CA, Krishnan GP, Vohs JL, Ahn WY, Hetrick WP, Morzorati SL, et al. Steady state responses: electrophysiological assessment of sensory function in schizophrenia. Schizophr Bull. 2009;35:1065–1077. doi: 10.1093/schbul/sbp091. [DOI] [PMC free article] [PubMed] [Google Scholar]
- Brenner CA, Sporns O, Lysaker PH, O'Donnell BF. EEG synchronization to modulated auditory tones in schizophrenia, schizoaffective disorder, and schizotypal personality disorder. The American Journal of Psychiatry. 2003;160:2238–2240. doi: 10.1176/appi.ajp.160.12.2238. [DOI] [PubMed] [Google Scholar]
- Buzsaki G, Draguhn A. Neuronal oscillations in cortical networks. Science. 2004;304:1926–1929. doi: 10.1126/science.1099745. [DOI] [PubMed] [Google Scholar]
- Cho RY, Konecky RO, Carter CS. Impairments in frontal cortical gamma synchrony and cognitive control in schizophrenia. Proc Natl Acad Sci U S A. 2006;103:19878–19883. doi: 10.1073/pnas.0609440103. [DOI] [PMC free article] [PubMed] [Google Scholar]
- Clementz BA, Blumenfeld LD, Cobb S. The gamma band response may account for poor P50 suppression in schizophrenia. Neuroreport. 1997;8:3889–3893. doi: 10.1097/00001756-199712220-00010. [DOI] [PubMed] [Google Scholar]
- Coyle JT, Tsai G, Goff D. Converging evidence of NMDA receptor hypofunction in the pathophysiology of schizophrenia. Ann N Y Acad Sci. 2003;1003:318–327. doi: 10.1196/annals.1300.020. [DOI] [PubMed] [Google Scholar]
- Debener S, Herrmann CS, Kranczioch C, Gembris D, Engel AK. Top-down attentional processing enhances auditory evoked gamma band activity. Neuroreport. 2003;14:683–686. doi: 10.1097/00001756-200304150-00005. [DOI] [PubMed] [Google Scholar]
- Deng C, Huang XF. Increased density of GABAA receptors in the superior temporal gyrus in schizophrenia. Exp Brain Res. 2006;168:587–590. doi: 10.1007/s00221-005-0290-9. [DOI] [PubMed] [Google Scholar]
- Doheny HC, Faulkner HJ, Gruzelier JH, Baldeweg T, Whittington MA. Pathway-specific habituation of induced gamma oscillations in the hippocampal slice. Neuroreport. 2000;11:2629–2633. doi: 10.1097/00001756-200008210-00005. [DOI] [PubMed] [Google Scholar]
- Dutton RC, Smith WD, Rampil IJ, Chortkoff BS, Eger EI., 2nd Forty-hertz midlatency auditory evoked potential activity predicts wakeful response during desflurane and propofol anesthesia in volunteers. Anesthesiology. 1999;91:1209–1220. doi: 10.1097/00000542-199911000-00010. [DOI] [PubMed] [Google Scholar]
- First MB, Frances A. DSM-IV handbook of differential diagnosis. Washington, DC: American Psychiatric Press; 1995. [Google Scholar]
- Ford JM, Roach BJ, Hoffman RS, Mathalon DH. The dependence of P300 amplitude on gamma synchrony breaks down in schizophrenia. Brain research. 2008;1235:133–142. doi: 10.1016/j.brainres.2008.06.048. [DOI] [PMC free article] [PubMed] [Google Scholar]
- Frund I, Schadow J, Busch NA, Korner U, Herrmann CS. Evoked gamma oscillations in human scalp EEG are test-retest reliable. Clin Neurophysiol. 2007;118:221–227. doi: 10.1016/j.clinph.2006.09.013. [DOI] [PubMed] [Google Scholar]
- Galambos R, Makeig S, Talmachoff PJ. A 40-Hz auditory potential recorded from the human scalp; Proceedings of the National Academy of Sciences of the United States of America; 1981. pp. 2643–2647. [DOI] [PMC free article] [PubMed] [Google Scholar]
- Gandal MJ, Edgar JC, Klook K, Siegel SJ. Gamma synchrony: towards a translational biomarker for the treatment-resistant symptoms of schizophrenia. Neuropharmacology. 2012;62:1504–1518. doi: 10.1016/j.neuropharm.2011.02.007. [DOI] [PMC free article] [PubMed] [Google Scholar]
- Gonzalez-Burgos G, Lewis DA. GABA neurons and the mechanisms of network oscillations: implications for understanding cortical dysfunction in schizophrenia. Schizophr Bull. 2008;34:944–961. doi: 10.1093/schbul/sbn070. [DOI] [PMC free article] [PubMed] [Google Scholar]
- Gratton G, Coles MG, Donchin E. A new method for off-line removal of ocular artifact. Electroencephalogr Clin Neurophysiol. 1983;55:468–484. doi: 10.1016/0013-4694(83)90135-9. [DOI] [PubMed] [Google Scholar]
- Gray CM, Singer W. Stimulus-specific neuronal oscillations in orientation columns of cat visual cortex. Proc Natl Acad Sci U S A. 1989;86:1698–1702. doi: 10.1073/pnas.86.5.1698. [DOI] [PMC free article] [PubMed] [Google Scholar]
- Griskova I, Morup M, Parnas J, Ruksenas O, Arnfred SM. The amplitude and phase precision of 40 Hz auditory steady-state response depend on the level of arousal. Exp Brain Res. 2007;183:133–138. doi: 10.1007/s00221-007-1111-0. [DOI] [PubMed] [Google Scholar]
- Hall MH, Taylor G, Salisbury DF, Levy DL. Sensory gating event-related potentials and oscillations in schizophrenia patients and their unaffected relatives. Schizophrenia bulletin. 2011;37:1187–1199. doi: 10.1093/schbul/sbq027. [DOI] [PMC free article] [PubMed] [Google Scholar]
- Hall MH, Taylor G, Sham P, Schulze K, Rijsdijk F, Picchioni M, et al. The Early Auditory Gamma-Band Response Is Heritable and a Putative Endophenotype of Schizophrenia. Schizophr Bull. 2009 doi: 10.1093/schbul/sbp134. [DOI] [PMC free article] [PubMed] [Google Scholar]
- Hamm JP, Gilmore CS, Picchetti NA, Sponheim SR, Clementz BA. Abnormalities of Neuronal Oscillations and Temporal Integration to Low- and High-Frequency Auditory Stimulation in Schizophrenia. Biol Psychiatry. 2011 doi: 10.1016/j.biopsych.2010.11.021. [DOI] [PMC free article] [PubMed] [Google Scholar]
- Hashimoto T, Volk DW, Eggan SM, Mirnics K, Pierri JN, Sun Z, et al. Gene expression deficits in a subclass of GABA neurons in the prefrontal cortex of subjects with schizophrenia. J Neurosci. 2003;23:6315–6326. doi: 10.1523/JNEUROSCI.23-15-06315.2003. [DOI] [PMC free article] [PubMed] [Google Scholar]
- Hirano S, Hirano Y, Maekawa T, Obayashi C, Oribe N, Kuroki T, et al. Abnormal neural oscillatory activity to speech sounds in schizophrenia: a magnetoencephalography study. J Neurosci. 2008;28:4897–4903. doi: 10.1523/JNEUROSCI.5031-07.2008. [DOI] [PMC free article] [PubMed] [Google Scholar]
- Hong LE, Summerfelt A, McMahon R, Adami H, Francis G, Elliott A, et al. Evoked gamma band synchronization and the liability for schizophrenia. Schizophr Res. 2004;70:293–302. doi: 10.1016/j.schres.2003.12.011. [DOI] [PubMed] [Google Scholar]
- Impagnatiello F, Guidotti AR, Pesold C, Dwivedi Y, Caruncho H, Pisu MG, et al. A decrease of reelin expression as a putative vulnerability factor in schizophrenia. Proc Natl Acad Sci U S A. 1998;95:15718–15723. doi: 10.1073/pnas.95.26.15718. [DOI] [PMC free article] [PubMed] [Google Scholar]
- Kaf WA, Sabo DL, Durrant JD, Rubinstein E. Reliability of electric response audiometry using 80 Hz auditory steady-state responses. Int J Audiol. 2006;45:477–486. doi: 10.1080/14992020600753197. [DOI] [PubMed] [Google Scholar]
- Kay SR, Fiszbein A, Opler LA. The positive and negative syndrome scale (PANSS) for schizophrenia. Schizophr Bull. 1987;13:261–276. doi: 10.1093/schbul/13.2.261. [DOI] [PubMed] [Google Scholar]
- Krishnan GP, Hetrick WP, Brenner CA, Shekhar A, Steffen AN, O'Donnell BF. Steady state and induced auditory gamma deficits in schizophrenia. NeuroImage. 2009;47:1711–1719. doi: 10.1016/j.neuroimage.2009.03.085. [DOI] [PMC free article] [PubMed] [Google Scholar]
- Krystal JH, Anand A, Moghaddam B. Effects of NMDA receptor antagonists: implications for the pathophysiology of schizophrenia. Arch Gen Psychiatry. 2002;59:663–664. doi: 10.1001/archpsyc.59.7.663. [DOI] [PubMed] [Google Scholar]
- Kwon JS, O'Donnell BF, Wallenstein GV, Greene RW, Hirayasu Y, Nestor PG, et al. Gamma frequency-range abnormalities to auditory stimulation in schizophrenia. Archives of General Psychiatry. 1999;56:1001–1005. doi: 10.1001/archpsyc.56.11.1001. [DOI] [PMC free article] [PubMed] [Google Scholar]
- Leicht G, Karch S, Karamatskos E, Giegling I, Moller HJ, Hegerl U, et al. Alterations of the early auditory evoked gamma-band response in first-degree relatives of patients with schizophrenia: hints to a new intermediate phenotype. J Psychiatr Res. 2011;45:699–705. doi: 10.1016/j.jpsychires.2010.10.002. [DOI] [PubMed] [Google Scholar]
- Leicht G, Kirsch V, Giegling I, Karch S, Hantschk I, Moller HJ, et al. Reduced early auditory evoked gamma-band response in patients with schizophrenia. Biol Psychiatry. 2010;67:224–231. doi: 10.1016/j.biopsych.2009.07.033. [DOI] [PubMed] [Google Scholar]
- Lenz D, Fischer S, Schadow J, Bogerts B, Herrmann CS. Altered evoked gamma-band responses as a neurophysiological marker of schizophrenia? Int J Psychophysiol. 2010 doi: 10.1016/j.ijpsycho.2010.08.002. [DOI] [PubMed] [Google Scholar]
- Lewis DA, Cho RY, Carter CS, Eklund K, Forster S, Kelly MA, et al. Subunit-selective modulation of GABA type A receptor neurotransmission and cognition in schizophrenia. Am J Psychiatry. 2008;165:1585–1593. doi: 10.1176/appi.ajp.2008.08030395. [DOI] [PMC free article] [PubMed] [Google Scholar]
- Lewis DA, Hashimoto T, Volk DW. Cortical inhibitory neurons and schizophrenia. Nat Rev Neurosci. 2005;6:312–324. doi: 10.1038/nrn1648. [DOI] [PubMed] [Google Scholar]
- Light GA, Hsu JL, Hsieh MH, Meyer-Gomes K, Sprock J, Swerdlow NR, et al. Gamma band oscillations reveal neural network cortical coherence dysfunction in schizophrenia patients. Biol Psychiatry. 2006;60:1231–1240. doi: 10.1016/j.biopsych.2006.03.055. [DOI] [PubMed] [Google Scholar]
- Mathalon DH, Hoffman RE, Watson TD, Miller RM, Roach BJ, Ford JM. Neurophysiological Distinction between Schizophrenia and Schizoaffective Disorder. Front Hum Neurosci. 2010;3:70. doi: 10.3389/neuro.09.070.2009. [DOI] [PMC free article] [PubMed] [Google Scholar]
- Minzenberg MJ, Firl AJ, Yoon JH, Gomes GC, Reinking C, Carter CS. Gamma oscillatory power is impaired during cognitive control independent of medication status in first-episode schizophrenia. Neuropsychopharmacology. 2010;35:2590–2599. doi: 10.1038/npp.2010.150. [DOI] [PMC free article] [PubMed] [Google Scholar]
- O'Donnell BF, Hetrick WP, Vohs JL, Krishnan GP, Carroll CA, Shekhar A. Neural synchronization deficits to auditory stimulation in bipolar disorder. Neuroreport. 2004;15:1369–1372. doi: 10.1097/01.wnr.0000127348.64681.b2. [DOI] [PubMed] [Google Scholar]
- Pantev C, Elbert T, Makeig S, Hampson S, Eulitz C, Hoke M. Relationship of transient and steady-state auditory evoked fields. Electroencephalogr Clin Neurophysiol. 1993;88:389–396. doi: 10.1016/0168-5597(93)90015-h. [DOI] [PubMed] [Google Scholar]
- Pantev C, Makeig S, Hoke M, Galambos R, Hampson S, Gallen C. Human auditory evoked gamma-band magnetic fields. Proc Natl Acad Sci U S A. 1991;88:8996–9000. doi: 10.1073/pnas.88.20.8996. [DOI] [PMC free article] [PubMed] [Google Scholar]
- Pastor MA, Artieda J, Arbizu J, Marti-Climent JM, Penuelas I, Masdeu JC. Activation of human cerebral and cerebellar cortex by auditory stimulation at 40 Hz. J Neurosci. 2002;22:10501–10506. doi: 10.1523/JNEUROSCI.22-23-10501.2002. [DOI] [PMC free article] [PubMed] [Google Scholar]
- Plourde G. Auditory evoked potentials. Best Pract Res Clin Anaesthesiol. 2006;20:129–139. doi: 10.1016/j.bpa.2005.07.012. [DOI] [PubMed] [Google Scholar]
- Plourde G, Villemure C. Comparison of the effects of enflurane/N2O on the 40-Hz auditory steady-state response versus the auditory middle-latency response. Anesth Analg. 1996;82:75–83. doi: 10.1097/00000539-199601000-00013. [DOI] [PubMed] [Google Scholar]
- Presacco A, Bohorquez J, Yavuz E, Ozdamar O. Auditory steady-state responses to 40-Hz click trains: relationship to middle latency, gamma band and beta band responses studied with deconvolution. Clin Neurophysiol. 2010;121:1540–1550. doi: 10.1016/j.clinph.2010.03.020. [DOI] [PubMed] [Google Scholar]
- Reite M, Teale P, Collins D, Rojas DC. Schizoaffective disorder - a possible MEG auditory evoked field biomarker. Psychiatry Res. 2010;182:284–286. doi: 10.1016/j.pscychresns.2010.02.007. [DOI] [PMC free article] [PubMed] [Google Scholar]
- Roach BJ, Mathalon DH. Event-related EEG time-frequency analysis: an overview of measures and an analysis of early gamma band phase locking in schizophrenia. Schizophr Bull. 2008;34:907–926. doi: 10.1093/schbul/sbn093. [DOI] [PMC free article] [PubMed] [Google Scholar]
- Roopun AK, Cunningham MO, Racca C, Alter K, Traub RD, Whittington MA. Region-specific changes in gamma and beta2 rhythms in NMDA receptor dysfunction models of schizophrenia. Schizophr Bull. 2008;34:962–973. doi: 10.1093/schbul/sbn059. [DOI] [PMC free article] [PubMed] [Google Scholar]
- Ross B, Herdman AT, Pantev C. Stimulus induced desynchronization of human auditory 40-Hz steady-state responses. J Neurophysiol. 2005;94:4082–4093. doi: 10.1152/jn.00469.2005. [DOI] [PubMed] [Google Scholar]
- Ross B, Picton TW, Herdman AT, Pantev C. The effect of attention on the auditory steady-state response. Neurol Clin Neurophysiol. 2004;2004:22. [PubMed] [Google Scholar]
- Ross B, Picton TW, Pantev C. Temporal integration in the human auditory cortex as represented by the development of the steady-state magnetic field. Hear Res. 2002;165:68–84. doi: 10.1016/s0378-5955(02)00285-x. [DOI] [PubMed] [Google Scholar]
- Santarelli R, Maurizi M, Conti G, Ottaviani F, Paludetti G, Pettorossi VE. Generation of human auditory steady-state responses (SSRs). II: Addition of responses to individual stimuli. Hear Res. 1995;83:9–18. doi: 10.1016/0378-5955(94)00185-s. [DOI] [PubMed] [Google Scholar]
- Saupe K, Schroger E, Andersen SK, Muller MM. Neural mechanisms of intermodal sustained selective attention with concurrently presented auditory and visual stimuli. Front Hum Neurosci. 2009a;3:58. doi: 10.3389/neuro.09.058.2009. [DOI] [PMC free article] [PubMed] [Google Scholar]
- Saupe K, Widmann A, Bendixen A, Muller MM, Schroger E. Effects of intermodal attention on the auditory steady-state response and the event-related potential. Psychophysiology. 2009b;46:321–327. doi: 10.1111/j.1469-8986.2008.00765.x. [DOI] [PubMed] [Google Scholar]
- Schadow J, Lenz D, Thaerig S, Busch NA, Frund I, Herrmann CS. Stimulus intensity affects early sensory processing: sound intensity modulates auditory evoked gamma-band activity in human EEG. Int J Psychophysiol. 2007;65:152–161. doi: 10.1016/j.ijpsycho.2007.04.006. [DOI] [PubMed] [Google Scholar]
- Skosnik PD, Krishnan GP, O'Donnell BF. The effect of selective attention on the gamma-band auditory steady-state response. Neurosci Lett. 2007;420:223–228. doi: 10.1016/j.neulet.2007.04.072. [DOI] [PubMed] [Google Scholar]
- Sohal VS, Zhang F, Yizhar O, Deisseroth K. Parvalbumin neurons and gamma rhythms enhance cortical circuit performance. Nature. 2009;459:698–702. doi: 10.1038/nature07991. [DOI] [PMC free article] [PubMed] [Google Scholar]
- Spencer KM, Niznikiewicz MA, Nestor PG, Shenton ME, McCarley RW. Left auditory cortex gamma synchronization and auditory hallucination symptoms in schizophrenia. BMC Neurosci. 2009;10:85. doi: 10.1186/1471-2202-10-85. [DOI] [PMC free article] [PubMed] [Google Scholar]
- Spencer KM, Niznikiewicz MA, Shenton ME, McCarley RW. Sensory-Evoked Gamma Oscillations in Chronic Schizophrenia. Biol Psychiatry. 2007 doi: 10.1016/j.biopsych.2007.10.017. [DOI] [PMC free article] [PubMed] [Google Scholar]
- Spencer KM, Salisbury DF, Shenton ME, McCarley RW. gamma-Band Auditory Steady-State Responses Are Impaired in First Episode Psychosis. Biological psychiatry. 2008 doi: 10.1016/j.biopsych.2008.02.021. [DOI] [PMC free article] [PubMed] [Google Scholar]
- Tallon-Baudry C, Bertrand O, Delpuech C, Permier J. Oscillatory gamma-band (30–70 Hz) activity induced by a visual search task in humans. J Neurosci. 1997;17:722–734. doi: 10.1523/JNEUROSCI.17-02-00722.1997. [DOI] [PMC free article] [PubMed] [Google Scholar]
- Teale P, Collins D, Maharajh K, Rojas DC, Kronberg E, Reite M. Cortical source estimates of gamma band amplitude and phase are different in schizophrenia. NeuroImage. 2008;42:1481–1489. doi: 10.1016/j.neuroimage.2008.06.020. [DOI] [PMC free article] [PubMed] [Google Scholar]
- Tiitinen H, Sinkkonen J, Reinikainen K, Alho K, Lavikainen J, Naatanen R. Selective attention enhances the auditory 40-Hz transient response in humans. Nature. 1993;364:59–60. doi: 10.1038/364059a0. [DOI] [PubMed] [Google Scholar]
- van Deursen JA, Vuurman EF, van Kranen-Mastenbroek VH, Verhey FR, Riedel WJ. 40-Hz steady state response in Alzheimer's disease and mild cognitive impairment. Neurobiology of aging. 2011;32:24–30. doi: 10.1016/j.neurobiolaging.2009.01.002. [DOI] [PubMed] [Google Scholar]
- Vierling-Claassen D, Siekmeier P, Stufflebeam S, Kopell N. Modeling GABA alterations in schizophrenia: a link between impaired inhibition and altered gamma and beta range auditory entrainment. J Neurophysiol. 2008;99:2656–2671. doi: 10.1152/jn.00870.2007. [DOI] [PMC free article] [PubMed] [Google Scholar]
- Wilson TW, Hernandez OO, Asherin RM, Teale PD, Reite ML, Rojas DC. Cortical gamma generators suggest abnormal auditory circuitry in early-onset psychosis. Cereb Cortex. 2008;18:371–378. doi: 10.1093/cercor/bhm062. [DOI] [PMC free article] [PubMed] [Google Scholar]