

SUMMARY
Memory traces are believed to be ensembles of cells used to store memories. To visualize memory traces, we created a transgenic line that allows for the comparison between cells activated during encoding and expression of a memory. Mice re-exposed to a fear-inducing context froze more and had a greater percentage of reactivated cells in the dentate gyrus (DG) and CA3 than mice exposed to a novel context. Over time, these differences disappeared, in keeping with the observation that memories become generalized. Optogenetically silencing DG or CA3 cells that were recruited during encoding of a fear-inducing context prevented expression of the corresponding memory. Mice with reduced neurogenesis displayed less contextual memory and less reactivation in CA3 but, surprisingly, normal reactivation in the DG. These studies suggest that distinct memory traces are located in the DG and in CA3 but that the strength of the memory is related to reactivation in CA3.
INTRODUCTION
The hippocampal circuit is essential for episodic and contextual memory formation, storage, and retrieval. Many models have stressed the importance of the hippocampus (HPC) subregions in distinguishing similar patterns (pattern separation) and in completing partial patterns (pattern completion) (Bakker et al., 2008; Leutgeb et al., 2007; Marr, 1971; McHugh et al., 2007; O’Reilly and McClelland, 1994; Treves and Rolls, 1992). It has been suggested that the dentate gyrus (DG) disambiguates similar inputs coming from the entorhinal cortex via sparse, strong mossy fiber projections from the granule cells to CA3. In contrast, CA3 pyramidal cells have been proposed to be involved in pattern completion because of their abundant recurrent collaterals (Treves and Rolls, 1992). Within the DG and CA3, immediate early genes (IEGs) are typically expressed in a sparse pattern (Guzowski et al., 1999). One particular IEG, Arc/Arg3.1, has been widely implicated in synaptic plasticity and HPC-dependent memory (Link et al., 1995; Lyford et al., 1995; Plath et al., 2006).
In this study, we utilized the IEG Arc in order to understand how a memory trace is formed and retrieved in the HPC under a number of conditions. We designed the ArcCreERT2 bacterial artificial chromosome (BAC) transgenic mice to test this hypothesis not just on a short timescale (Lyford et al., 1995; Reijmers et al., 2007) but also on a long timescale (indefinitely). This system allows for the comparison of cells activated during the encoding of a memory versus cells activated during the expression of that memory. Our hypothesis was that the cells reactivated during expression of a memory are a component of the memory trace.
In order to directly test this hypothesis, we optogenetically inactivated DG and CA3 cells that were recruited during contextual fear conditioning (CFC) and show that this manipulation inhibited expression of the corresponding memory. In addition, we find that mice with reduced adult neurogenesis display less contextual memory and less reactivation in CA3 but, surprisingly, normal reactivation in the DG. Together, these results suggest that levels of reactivation in CA3 are related to the strength of the memory and that young adult-born granule cells in the DG contribute to the formation of the memory trace in CA3.
RESULTS
Generation and Characterization of the ArcCreERT2 Line
For generation of transgenic animals, ArcCreERT2 BAC DNA was linearlized by PI-SceI enzyme digestion (New England Biolabs) and injected into fertilized eggs from CBA/C57Bl/6J mice. Two founders (one female [F line] and one male [M line]) resulted from this injection, and both lines have been maintained. Mice derived from the M line are described within this text. ArcCreERT2 mice were initially bred with the R26R-STOP-floxed-enhanced yellow fluorescent protein (EYFP) line to allow for a direct comparison between the permanently labeled EYFP+ cells that are activated during encoding and the recently activated Arc+ cells following memory expression (Figure 1). Ninety-nine percent of cells immunoreactive for Arc expressed nuclear Cre-recombinase following administration of tamoxifen (TAM) and CFC (Figure S1 available online), indicating high fidelity between the expression of endogenous Arc protein and the CreERT2 transgene.
Figure 1. Indelible Labeling of Arc+ Cells following Learning.
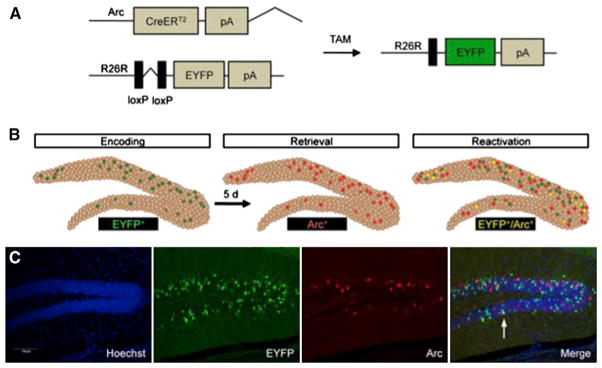
(A) Administration of TAM to ArcCreERT2 x R26R-STOP-floxed-EYFP mice results in an indelible EYFP label in the initially activated Arc+ cells.
(B) The ArcCreERT2 line allows for a comparison between the indelibly labeled cells activated during memory encoding and memory expression.
(C) Representative 10× images. The scale bar represents 100 μm.
See also Figure S1.
In order to minimize any nonspecific EYFP label, we performed a number of manipulations to control the stimuli before and after the TAM injection (Figure 2). In the protocol that resulted in the lowest background of EYFP label, mice were dark housed the night before and then for 3 days following the TAM injection (Figure 2A). These results are consistent with previous studies showing that after a single intraperitoneal injection of TAM, there is a significant nuclear accumulation of CreER within 24 hr and that this nuclear signal disappears by 48 hr, indicating that TAM is no longer active 48 hr postinjection. In these experiments, the appearance of the reporter is detected at approximately 12 hr after the injection and these cells continue to accumulate for about 36 hr (Hayashi and McMahon, 2002).
Figure 2. Indelible, Specific Labeling of Arc+ Cells following Context Exposure and Contextual Fear Conditioning.

(A) Experimental design. Mice that were dark housed for 3 days following the TAM injection had the least number of EYFP+ DG cells.
(B) Experimental design to assess the impact of context exposure and one-shock CFC on behavior and cell labeling. Mice exposed to the context without a foot shock did not freeze, whereas mice administered a one-shock CFC paradigm froze approximately 20% of the time.
(C–J) The numbers of EYFP+, Arc+, and c-fos+ cells were assessed in both conditions. The number of EYFP+ cells increased with context exposure and with one-shock CFC from the number of EYFP+ cells labeled in the home cage. n = 4–7 mice per group. Error bars represent ± SEM.
See also Figure S2.
To examine whether the EYFP label is a reliable marker of a CFC experience, we assessed reactivation in the HPC of ArcCreERT2 mice that were exposed to context A with and without a foot shock and then were re-exposed 5 days later to context A (Figure S2). As expected, mice administered CFC exhibited markedly higher levels of freezing than did mice exposed to the context without foot shock (Figure 2B). CFC resulted in an increase in the number of EYFP+ cells in the DG (2.5-fold; p < 0.03) and in CA3 (6.6 fold; p = 0.05) when compared to context presentation alone (Figures 2C, 2E, 2G, 2I, and S2). These data indicate that the majority of EYFP+ cells are specific for the CFC experience.
Effect of Context and Time on Memory Traces in the DG and CA3
First, we determined how context specificity affects hippocampal memory traces. Mice were administered CFC in context A and then exposed to context A or a novel context B 5 days later to determine whether reactivation is associated with CFC memory (Figure 3A). In these conditions, ArcCreERT2 mice froze significantly more in context A than in B (Figure 3B) (F(1,17) = 22.4398, p < 0.001). In the DG, the number of EYFP+ (Figure 3C) and Arc+ cells (Figure 3D) did not differ between groups. However, the percent of colabeled EYFP+/Arc+ cells was significantly greater in mice re-exposed to context A than to context B (Figure 3E) (p < 0.0001). We confirmed these results by using c-fos to label the cells activated during memory expression. The percent of colabeled EYFP+/c-fos+ DG cells was likewise significantly greater in mice re-exposed to context A than to context B (data not shown). The fact that we obtained similar results with c-fos, as with Arc, is consistent with the fact that there is approximately an 80% overlap between Arc+ and c-fos+ in the DG cells following behavioral testing (Stone et al., 2011). To assess reactivation in CA3, we used c-fos, rather than Arc, because Arc labeling in CA3 is primarily dendritic (Figure S3). Like in the DG, in CA3, the number of EYFP+ (Figure 3F) and c-fos+ (Figure 3G) cells were similar between the groups, while the percent of colabeled EYFP+/c-fos+ was significantly greater in mice re-exposed to context A than to context B (Figure 3H) (p = 0.03). Interestingly, levels of activity during encoding (number of EYFP+ cells; for recent DG versus CA3: p < 0.001; for remote DG versus CA3: p < 0.001) are higher in the DG than in CA3, which may reflect a preferential role of the DG in encoding (Kheirbek et al., 2013; Lee and Kesner, 2004).
Figure 3. Recent and Remote Re-exposure to a Fearful Environment Differentially Reactivates DG and CA3 Cells.

(A) Experimental design.
(B) In the recent exposure, context-elicited freezing was significantly greater in mice exposed to context A compared to context B (F(1,17) = 22.4398, p < 0.001). In the remote exposure, mice did not differ in their levels of context-elicited freezing (F(1,9) = 1.217, p = 0.30).
(C and D) For the recent exposure, the number of (C) EYFP+ and (D) Arc+ DG cells did not differ between groups.
(E) Mice re-exposed to context A had a greater percent of colabeled EYFP+/Arc+ DG cells than did mice exposed to context B (p < 0.0001).
(F and G) The number of (F) EYFP+ and (G) c-fos+ CA3 cells was similar between the groups.
(H) The percent of colabeled EYFP+/c-fos+ was significantly greater in mice re-exposed to context A (p = 0.03). n = 9–10 mice per group.
(I–K) For the remote exposure, the number of (I) EYFP+ and (J) Arc+ DG cells and (K) the percent of colabeled EYFP+/Arc+ DG cells did not differ between the groups.
(L–N) The number of (L) EYFP+ and (M) c-fos+ CA3 cells and (N) the percent of colabeled EYFP+/c-fos+ was similar between the groups. n = 5–6 mice per group. Error bars represent ± SEM.
See also Figure S3.
Second, we assessed the effect of time on reactivation by re-exposing the mice to contexts A or B 30 days after encoding (rather than 5 days). During remote exposure, mice froze to a similar high degree in both contexts A and B (Figure 3B) (F(1,9) = 1.217, p = 0.30), which is indicative of memory generalization (Frankland et al., 2006; Goshen et al., 2011). In the DG, the two groups neither differed in the number of EYFP+ (Figure 3I) or Arc+ (Figure 3J) cells nor in the percent of colabeled EYFP+/Arc+ cells (Figure 3K). In CA3, the number of EYFP+ (Figure 3L) and c-fos+ (Figure 3M) cells and the percent of colabeled EYFP+/c-fos+ were also similar in both groups of mice (Figure 3N). However, there was a trend for a decrease in the percent of colabeled EYFP+/c-fos+ cells in context A at the remote time point when compared with the recent time point (1.63% versus 4.04%; p = 0.1). The fact that memory remains strong, while reactivation in CA3 decreases, is consistent with the observation that after 4 weeks, HPC memories are redistributed to cortical areas (Frankland et al., 2006; Goshen et al., 2011).
Optogenetic Inhibition of DG and CA3 Context-Specific Cells Impairs Memory Expression
To determine whether the cells labeled during CFC are necessary for the behavioral expression of contextual fear, ArcCreERT2 mice were bred with the optogenetic inhibitory line R26R-CAG-STOP-floxed-Archaerhodopsin-3 (Arch)-GFP (Ai35) (Figures 4, 5, and S4). In whole-cell recordings from ex vivo brain slices, photostimulation (593.5 nm) of Arch-GFP+ DG granule cells and CA3 pyramidal neurons elicited a robust and sustained hyperpolarizing current that effectively blocked spiking evoked by current injection (Figure 4B–4J).
Figure 4. In Vitro Optogenetic Inhibition of the DG and CA3 in ArcCreERT2 x R26R-CAG-STOP-floxed-Arch-GFP Mice.

(A) Genetic design.
(B) Representative Arch-GFP+ DG cell.
(C and D) In vitro photostimulation (500 ms, yellow bar) of DG cells resulted in 162.49 ± 38.26 pA steady-state current in Arch-GFP+ neurons (n = 18). This corresponds to −13.1 ± 2.5 mV hyper-polarization, when the cells were current clamped at their resting potentials (−73.47 ± 1 mV) (n = 18).
(E) Photostimulation-evoked hyperpolarization was able to abolish current injection-induced action potentials (APs). Example traces represent 150 pA somatic current injection without or with light stimulation (n = 5).
(F) Arch photostimulation was able to abolish trains of current injection-evoked APs.
(G) The graph represents the increasing amount of steady-state current as a function of laser power (n = 3).
(H) Representative Arch-GFP+ CA3 neuron.
(I and J) In CA3, in vitro photostimulation also resulted in complete inhibition of APs. Voltage (upper trace) and current clamp (lower trace) recording of an Arch-GFP+ CA3 neuron. In vitro photostimulation resulted in 408.23 ± 54.79 pA steady-state current in all of the Arch-GFP+ CA3 neurons, which corresponds to −25.93 ± 6.66 mV hyperpolarization (n = 3). Error bars represent ± SEM.
Figure 5. In Vivo Optogenetic Inhibition of the DG and CA3 Impairs Expression of Initially Encoded Memory.

(A) Genetic design.
(B–D) Representative images of the (B) hippocampus (the scale bar represents 200 μm), (C) DG (the scale bar represents 100 μm), and (D) CA3 (the scale bar represents 100 μm).
(E) The experimental design consisted of all mice being trained in four-shock CFC paradigm and then being re-exposed to context A and B Each context exposure consisted of 3 min of laser stimulation and 3 min without laser stimulation.
(F and G) Optogenetic inhibition of Arch-GFP+ DG neurons impaired expression of the corresponding fear memory in context A (F) in ArcCreERT2(+) mice when compared with ArcCreERT2(−) mice (p = 0.02) but had no effect in (G) context B (n = 6–9 mice per group).
(H and I) Optogenetic inhibition of Arch-GFP+ CA3 neurons impaired expression of the corresponding fear memory in context A (H) in ArcCreERT2(+) mice when compared with ArcCreERT2(−) mice (p < 0.02) but had no effect in (I) context B (n = 9–12 mice per group).
(J–L) Experimental design. Optogenetic inhibition of Arch-GFP+ DG neurons labeled in context C (J) did not impair freezing in ArcCreERT2(+) mice when compared with ArcCreERT2(−) mice in (K) context A or in (L) context B (n = 4–5 mice per group).
(M and N) Optogenetic inhibition of Arch-GFP+ CA3 neurons labeled in context C had no effect on memory expression in ArcCreERT2(+) mice when compared with ArcCreERT2(−) mice in (M) context A or in (N) context B (n = 5 mice per group). Error bars represent ± SEM.
See also Figures S4 and S5.
We optogenetically inhibited DG or CA3 cells that were labeled during CFC encoding, to assess their impact on subsequent memory expression. ArcCreERT2 x Arch-GFP mice were implanted with fiber optics directly above the DG or CA3, and 2 weeks later, mice were injected with TAM and administered CFC in context A 5 hr later (Figure 5E). Two weeks later, mice were placed back into context A for 6 min. The first 3 min of context A exposure were with light ON (593.5 nm, constant light, 15 mW), and the following 3 min were with light OFF. Two days later, mice were placed into a novel context B with the same light epochs. When comparing minute 1 (light ON) and minute 4 (light OFF), optogenetic inhibition of DG neurons impaired expression of the fear memory as evidenced by the lower percent of freezing in context A in ArcCreERT2(+) mice when compared with ArcCreERT2(−) mice (Figure 5F) (p = 0.02). We additionally performed analyses of the minutes 1–3 (light ON) versus minutes 4–6 (light OFF), which gave similar results (repeated measures ANOVA, genotype effect, F(1,13) = 3.682, p = 0.08; light ON/OFF effect, F(1,13) = 36.646, p < 0.0001; genotype x light ON/OFF, F(1,13) = 13.681, p = 0.0027, unpaired t test for light ON: p = 0.0093, unpaired t test for light OFF: p = 0.68). Notably, when optogenetic inhibition ceased, freezing levels were comparable in both groups (Figure 5F) (repeated-measures ANOVA, genotype effect, F(1,13) = 6.965, p = 0.02; light ON/OFF effect, F(1,13) = 56.910; p < 0.0001; genotype x light ON/OFF, F(1,13) = 4.973, p = 0.04). In context B, the effect of optogenetic inhibition was not significant (Figure 5G).
Similar effects were seen in mice with fiber optics implanted directly above CA3. When comparing minute 1 (light ON) and minute 4 (light OFF), optogenetic inhibition of CA3 neurons impaired expression of the corresponding fear memory in context A (Figure 5H) (repeated measures ANOVA, genotype effect, F(1,19) = 6.928, p < 0.02; light ON/OFF effect, F(1,19) = 51.709; p < 0.0001; genotype x light ON/OFF, F(1,19) = 2.054, p = 0.17, planned comparisons: p < 0.02) but had no effect in context B (Figure 5I). The effect did not reach significance when we performed analyses of the minutes 1–3 (light ON) versus minutes 4–6 (light OFF) (repeated measures ANOVA, genotype effect, F(1,19) = 1.848, p = 0.19; light ON/OFF effect, F(1,19) = 38.373, p < 0.0001; genotype x light ON/OFF, F(1,19) = 3.216, p = 0.09; planned comparison for light ON, p = 0.14). These results were further supported in an independent experiment in which we used halorhodopsin, which primarily labels cell bodies, instead of Arch, to silence CA3 cells (comparison of minute 1 [light ON] versus minute 4 [light OFF]: repeated measures ANOVA, genotype effect, F(1,16) = 5.278, p = 0.04; light ON/OFF effect, F(1,16) = 3.912; p = 0.07; genotype x light ON/OFF, F(1,16) = 5.073, p = 0.04) (Figure S5). Moreover, the effect did reach significance when we performed analyses of the minutes 1–3 (light ON) versus minutes 4–6 (light OFF) (repeated measures ANOVA, genotype effect, F(1,16) = 5.176, p = 0.04; light ON/OFF effect, F(1,16) = 1.360, p = 0.2606; genotype x light ON/OFF, F(1,16) = 2.523, p = 0.13; planned comparison for light ON, p = 0.0085, planned comparison for light OFF, p = 0.24). Therefore, it is likely that the optogenetic inhibition we see in the DG and CA3 is due to inhibition of the corresponding neurons rather than inhibition of axon terminals or passing fibers. However, we cannot completely exclude the possibility that inhibition of axons contributes to the phenotype we see in the DG and CA3. In summary, these experiments suggest that the DG and CA3 neurons that are active during encoding of a CFC memory are necessary for the expression of that memory.
To test for the specificity of the cells involved in this memory suppression, we assessed the effect of silencing a population of cells unrelated to the CFC memory. Mice were again injected with TAM but 5 hr later were placed in a larger novel environment C in the absence of a foot shock; such conditions recruit a similar number of cells as CFC (Figure 5J). One week later, mice were exposed to CFC in context A without TAM, and one week later, mice were exposed to contexts A and B as above. When comparing minute 1 (light ON) and minute 4 (light OFF), optogenetic inhibition of DG neurons labeled in context C did not impair freezing in either context A (Figure 5K) (repeated measures ANOVA, genotype effect, F(1,7) = 0.660, p = 0.44; light ON/OFF effect, F(1,7) = 16.316; p = 0.0049; genotype x light ON/OFF, F(1,7) = 0.420, p = 0.54) or B (Figure 5L). Similarly, when comparing minute 1 (light ON) and minute 4 (light OFF), optogenetic inhibition of CA3 neurons labeled in context C had no effect on memory expression in either context A (Figure 5M) (repeated measures ANOVA, genotype effect, F(1,8) = 1.001, p = 0.35; light ON/OFF effect, F(1,8) = 27.231; p = 0.0008; genotype x light ON/OFF, F(1,8) = 0.0489, p = 0.50) or B (Figure 5N). In another control experiment, we implanted fiber optics in a more medial and more dorsal position, which resides right above dorsal CA2 and reaches therefore only a small fraction of CA3 (Figure S4). When comparing minute 1 (light ON) and minute 4 (light OFF), optogenetic inhibition of this region did not impair expression of the CFC memory in context A (Figure S4F) or in context B (Figure S4G), suggesting that a partial CA3 suppression is not sufficient for memory inhibition. Taken together, these optogenetic experiments suggest that the DG and CA3 cells recruited during CFC encoding are necessary for memory expression and are therefore a component of this fearful memory trace.
Effect of Adult Hippocampal Neurogenesis on Memory Traces
Adult neurogenesis, a process in which new neurons are continuously generated in adulthood, occurs in the subgranular zone of the DG and in the subventricular zone of the olfactory bulb. Adult-born DG neurons functionally integrate into the hippocampal circuit, are activated during HPC-dependent learning, and exhibit heightened synaptic plasticity (Ge et al., 2006). A variety of studies have assessed the influence of adult neuro-genesis on behavior by utilizing loss- (Saxe et al., 2006; Deng et al., 2010; Denny et al., 2012) and gain-of-function models (Sahay et al., 2011b). However, the mechanisms underlying the impact of adult neurogenesis on long-term memory encoding and memory expression are unknown. Therefore, we used x-irradiation to ablate adult-born hippocampal neurons in ArcCreERT2 x EYFP mice and tested these mice 6 weeks later, because this time point is within the critical period during which adult-born neurons contribute to behavior (Figure 6A) (Denny et al., 2012).
Figure 6. The X-Irradiation Impairment in One-Shock CFC Is Paralleled by Decreased CA3 Reactivation, and Both Impairments Can be Rescued by Using a Three-Shock CFC Paradigm.

(A) Experimental design
(B) In one-shock CFC, context-elicited freezing was significantly reduced in x-irradiated mice (F(1,22) = 4.509, p < 0.05) (n = 11–13 mice per group). In three-shock CFC, context-elicited freezing was comparable in both groups (F(1,25) = 1.063, p = 0.31) (n = 13–14 mice per group).
(C and D) The number of DCX+ cells was significantly reduced in x-irradiated mice.
(E and F) In the one-shock CFC cohort, (E) the number of EYFP+ and (F) Arc+ DG cells was similar.
(G) Both groups had a comparable percent of colabeled EYFP+/Arc+ cells.
(H and I) The number of (H) EYFP+ and (I) c-fos+ CA3 cells was similar.
(J) X-irradiated mice had a significantly smaller percent of colabeled EYFP+/c-fos+ CA3 cells (p < 0.01).
(K–M) In the three-shock CFC cohort, (K) the number of EYFP+ and (L) Arc+ cells and (M) the percent of colabeled EYFP+/Arc+ DG cells did not differ between the groups.
(N–P) In CA3, the number of (N) EYFP+ and (O) c-fos+ cells and (P) the percent of colabeled EYFP+/c-fos+ cells did not differ between the groups. Error bars represent ± SEM.
We previously showed that mice with ablated neurogenesis are impaired in single-trial CFC, but not in multiple-trial CFC, suggesting that adult hippocampal neurogenesis is required for CFC only when brief training is provided (Drew et al., 2010). In keeping with these previous studies, in the one-shock CFC paradigm, x-irradiated mice exhibited significantly less context-elicited freezing when compared with sham mice (F(1,22) = 4.509, p < 0.05) (Figures 6B–6D). In the DG, the number of EYFP+ (Figure 6E) and Arc+ cells (Figure 6F) and the percent of colabeled EYFP+/Arc+ (Figure 6G) were comparable in sham and x-irradiated mice. In contrast, in CA3, although sham and x-irradiated mice had similar levels of EYFP+ (Figure 6H) and c-fos+ (Figure 6I) cells, the percent of EYFP+/c-fos+ cells was significantly lower in x-irradiated mice than in sham mice (Figure 6J) (p < 0.01). These data suggest that the behavioral impairments exhibited by x-irradiated mice may be due to altered reactivation in CA3 rather than in the DG. Interestingly, when a three-shock CFC was used, there was no longer any difference between sham and x-irradiated mice, both in freezing and in reactivation in the DG and CA3, indicating that a strong training paradigm can rescue the deficit that results from an absence of adult hippocampal neurogenesis (Figures 6K–6P).
We also used a social defeat (SD) paradigm to induce a depressed-like state and to decrease adult hippocampal neurogenesis in ArcCreERT2 x EYFP mice (Figure S6). When compared with control mice, SD mice were impaired in dominant interaction, exhibited increased time with a novel object, spent less time in the open arms of the elevated plus maze, and displayed increased immobility in the tail-suspension test. The number of BrdU+ cells was significantly reduced in SD mice in the most ventral DG sections (p < 0.01). These data show that SD produces a robust submissive and depressive-like phenotype in the ArcCreERT2 mice. Ten days after the cessation of SD, control and SD mice were administered a one-shock CFC paradigm, and memory traces were analyzed (Figure 7). In these conditions, like in x-irradiated mice, we observed a memory deficit in the one-shock CFC paradigm, as well as a decreased reactivation in CA3, but not in the DG.
Figure 7. Social Defeat Causes Impairments in One-Shock CFC and CA3 Reactivation.

(A) Mice were socially defeated (SD) for 2 weeks. Ten days following the end of SD, mice were administered a one-shock CFC paradigm, re-exposed to context A 5 days later, and sacrificed 1 hr later.
(B) Context-elicited freezing was significantly reduced in SD mice when compared with Ctrl mice (F(1,18) = 11.717, p < 0.01).
(C and D) In the DG, (C) the number of EYFP+ (p = 0.69) and (D) Arc+ cells (p = 0.10) did not differ between Ctrl and SD mice.
(E) Ctrl and SD mice had a comparable percent of colabeled EYFP+/Arc+ DG cells (p = 0.63).
(F) Representative image of the immunohistochemistry in the DG. The scale bar represents 100 μm.
(G and H) In CA3, the number of (G) EYFP+ (p = 0.45) and (H) c-fos+ (p = 0.33) cells did not differ between the groups.
(I) SD mice exhibited a significantly smaller percent of colabeled EYFP+/c-fos+ CA3 cells than did Ctrl mice (p < 0.05).
(J) Representative image of immunohistochemistry in CA3. The scale bar represents 100 μm. n = 4–10 mice per group. *p < 0.05, **p < 0.01. Error bars represent ± SEM.
See also Figure S6.
Overall, our combined data suggest that the level of reactivation in CA3, rather than in the DG, is related to the strength of the memory trace (Table 1). The only situation in which there is no relation between memory strength and level of reactivation in CA3 is in the remote condition (30 days), where the memory has probably moved out of the HPC.
Table 1.
CA3 Reactivation Is Correlated with the Strength of a Memory
| Reactivation
|
Memory Expression | |||
|---|---|---|---|---|
| DG | CA3 | |||
| Recent | A | + | + | + |
|
| ||||
| B | − | − | − | |
|
| ||||
| Social Defeat | A | + | − | − |
|
| ||||
| X-ray (1-shock) | A | + | − | − |
|
| ||||
| X-ray (3-shock) | A | + | + | + |
|
| ||||
| Remote | A | +/− | − | + |
|
| ||||
| B | +/− | − | + | |
DISCUSSION
We have shown that optogenetic inhibition of cells that were activated during encoding of a fearful memory in the DG and in CA3 inhibits expression of the corresponding memory. Based on these results, we propose that the cells that are reactivated during memory expression in the DG and in CA3 are a component of the memory trace. Our DG data are in accord with a recent study, which assessed sufficiency rather than necessity, and showed that stimulation of a specific population of DG cells recruited during memory encoding was sufficient to elicit partial expression of the corresponding memory (Liu et al., 2012). While we demonstrate that a small percentage of the cells in the DG and CA3 are reactivated upon recall of a fearful memory, many of the initially activated cells are not reactivated upon memory expression, indicating that of a given collection of activated cells, only a small percentage may be dedicated to a particular memory trace. These results are somewhat surprising given the reported stability usually observed in place field recordings over time (Leutgeb et al., 2007, but see also Neunuebel and Knierim, 2012 for a different interpretation). It is possible that ensembles of cells activated during memory expression are different from the cells recruited during encoding because these ensembles correspond to the reactivation of multiple-related memories (Bartlett, 1932).
In the remote experiment, although mice generalize and freeze at a high level in both contexts A and B, there is an overall decrease in CA3 reactivation, which may be related to the fact that the memory has moved out of the HPC. Most animal studies have suggested a time-limited role for the HPC in memory retrieval and expression (Kim and Fanselow 1992; Winocur et al., 2009, but see also Frankland et al., 2006). Our data suggest that at the remote time point, the DG and CA3 are differentially recruited. The DG appears to be still somewhat involved because reactivation remains at an intermediate level, while CA3 may no longer be involved, possibly because this component of the memory trace is no longer in the HPC.
The neurogenesis data are somewhat surprising since levels of DG reactivation are not affected by the arrest of adult neurogenesis, although neurogenesis occurs exclusively in the DG. Recent studies have looked at the recruitment of young versus mature neurons during encoding and indicate that there is no preferential recruitment of young neurons (Stone et al., 2011). Since young neurons represent only 5%–10% of the total granule cell population, it is therefore not surprising that the total number of EYFP+ DG cells is not significantly different between control mice and mice with arrested neurogenesis. What is interesting is that the percent of reactivated cells is reduced in CA3. These results are in agreement with a recent study showing altered CA3 activity in mice without neurogenesis (Niibori et al., 2012). The unique properties of young adult-born hippocampal neurons are likely responsible for their impact on the transmission of information from the DG to CA3 (Lacefield et al., 2012; Marín-Burgin et al., 2012). These data may also be related to the recent hypothesis that young adult-born neurons modulate the activity of the entire DG, which in turn impacts CA3 (Sahay et al., 2011a; Lacefield et al., 2012). The ability of adult-born hippocampal neurons in the DG to modulate the strength of the memory trace in CA3 may be adaptive in a changing environment that exerts variable levels of cognitive demands on hippocampal function (Sahay et al., 2011b).
In summary, these ArcCreERT2 mice have allowed us to identify components of the memory trace in the DG and CA3 and to study the impact of various environmental manipulations on memory traces and the evolution of these traces over time. Such studies will hopefully be helpful in characterizing the deteriorations of memory that often accompany both normal aging and age-related disorders, such as Alzheimer’s disease.
EXPERIMENTAL PROCEDURES
Generation of BAC Transgene and Transgenic Animals
A BAC clone (RP23-429N15) that contained the entire mouse Arc/Arg3.1 gene was obtained from the BACPAC Resources Center (BPRC; http://bacpac.chori.org). The pBADTcTypeG plasmid (a gift from Dr. Manabu Nakayama, Kazusa Institute) was transferred into DH10B cells, which contained the BAC clone, enabling Red/ET homologous recombination system. A DNA fragment containing a Rpsl-Zeo cassette (a gift from Dr. Hisashi Mori, Toyama University), with 50 bp homology arms, was electroporated into cells, and the Rpsl-Zeo cassette was then inserted into the translation initiation site of the Arc/Arg3.1 gene, resulting in Zeocin-resistant and streptomycin-sensitive cells. A DNA fragment containing the CreERT2-SV40 polyA cassette (a gift from Dr. Pierre Chambon) with 300 bp homology arms was electroporated, and streptomycin-resistant clones were selected. The Rpsl-Zeo cassette was replaced with CreERT2-SV40 polyA cassette, resulting in CreERT2 being expressed under the control of the Arc promoter.
To remove loxP sites that were present in the BAC backbone, which, if present, could result in interchromosomal recombination between loxP sites in the reporter allele and BAC transgene upon activation of CreERT2, an additional modification of the Arc BAC was made. The loxP site in the pBACe3.6 was replaced with a Zeo cassette (p23loxZeo) (a gift from Kousuke Yusa, Osaka University) by recombination. After a targeting procedure was completed, removal of the loxP site was confirmed by PCR.
For generation of transgenic animals, ArcCreERT2 BAC DNA was linearlized by PI-SceI enzyme digestion (New England Biolabs) and injected into fertilized eggs from CBA/C57Bl/6J mice. Two founders (one female [F line] and one male [M line]) resulted from this injection, and both lines have been maintained. Mice derived from the M line are described within this text.
Mice
ArcCreERT2(+) mice were bred with R26R-STOP-floxed-EYFP homozygous (−/−) mice (Srinivas et al., 2001), a gift from Dr. Stephen Rayport. These crosses generated ArcCreERT2 (+) or (−)/R26R-STOP-floxed-EYFP heterozygous (+/−) pups. Male mice were used in all experiments.
ArcCreERT2(+) mice were also bred with either (1) R26R-CAG-STOP-floxed-Archaerhodopsin-3 (Arch)-GFP (Ai35) mice or (2) R26R-CAG-STOP-floxed-eNpHR3.0-EYFP (Ai39) mice. These mice were generated as previously described (Madisen et al., 2010). In order to allow for sufficient expression of the reporter, mice were bred as follows: ArcCreERT2(+)/R26R-CAG-STOP-floxed-Arch-GFP homozygous (−/−) x R26R-CAG-STOP-floxed-Arch-GFP homozygous (−/−) mice to generate ArcCreERT2(+) or (−)/R26R-CAG-STOP-floxed-Arch-GFP homozygous (−/−) experimental mice. The same breeding strategy occurred in eNpHR3.0-EYFP mice. Male mice were used in all experiments.
All experimental mice were maintained on a mixed background consisting of mostly 129SvEv/Tac, C57Bl/6J, and CBA.
CD-1 mice were purchased from Charles River Laboratories at 8–10 weeks of age and housed individually.
Genotyping
Founders and subsequent offspring were genotyped using the following primer sets. For genotyping, we performed the following PCR reactions: Cre (for all mice): 5′-GCC TGC ATT ACC GGT CGA TGC AAC G-3′; 5′-AAA TCC ATC GCT CGA CCA GTT TAG TTA CCC-3′. R26R (for EYFP mice) 5′-GGA GCG GGA GAA ATG GAT ATG-3′; 5′-AAA GTC GCT CTG AGT TGT TAT-3′; 5′-AAG ACC GCG AAG AGT TTG TC-3′. Channelrhodopsin-multiplex (ChR2-M) (for Arch-GFP and eNpHR3.0-YFP mice) 5′-GCACTTGCTCTCCCAAAGTC-3′; 5′-GGGCGTACTTGGCATATGAT-3′; 5′-CTTTAAGCCTGCCCAGAAGA-3′. The Cre, R26R, and ChR2-M genotyping were performed separately. The R26R genotyping was performed in accordance with The Jackson Laboratory genotyping protocol.
Standard Housing and Dark Housing
Mice were housed four to five per cage in a 12 hr (06:00–18:00) light-dark colony room at 22°C. Food and water were provided ad libitum. Behavioral testing was performed during the light phase. For all experiments, cages were changed, and mice were placed into a separate housing room the night before the TAM injection (day 1). The next day, mice were injected with TAM and administered a behavioral task (e.g., CFC) 5 hr later (day 2). Following the behavioral task, mice were placed into the dark for that night and the following three days (days 3–5). Mice were taken out of the dark, cages were changed, and they were returned to the normal colony room. For memory expression experiments, mice were returned to the testing room (day 7). It was imperative that their cages were not changed the day of or the day before the memory expression test. All precautions to prevent disturbances to the ArcCreERT2 mice were taken. The procedures described herein were conducted in accordance with National Institutes of Health regulations and approved by the Institutional Animal Care and Use Committees of Columbia University and the New York State Psychiatric Institute.
Drugs
Recombination in ArcCreERT2 x R26R-STOP-floxed-EYFP, x R26R-CAG-STOP-floxed-Arch-GFP, or x R26R-CAG-STOP-floxed-eNpHR3.0-YFP transgenic mice was induced using TAM (Sigma, T5648). TAM was dissolved by sonication in 10% EtOH/90% corn oil at a concentration of 10 mg/ml. One injection of 200 μl (2 mg) was injected intraperitoneally (i.p.) into adult mice.
Ctrl and SD mice were injected with 5′-bromo-2′-deoxyuridine (BrdU) (Roche) (150 mg/kg) twice a day i.p. for 5 days (300 mg/kg per day in 0.9% NaCl).
Behavioral Methods
Apparati
Context A was a chamber obtained from Coulbourn Instruments with the internal dimensions of 7 × 7 × 12 in. The chambers had clear plastic front and back walls, stainless steel walls on each side, and stainless steel bars on the floor. A house light was mounted directly above the chamber. Each chamber was located inside a larger, insulated plastic cabinet that provided protection from outside light and noise. Each cabinet contained a ventilation fan that was operated during the sessions. A paper towel dabbed with lemon solution was placed under the stainless steel bars. The scent was refreshed every fourth run. Mice were held outside the experimental room in their home cages prior to testing and transported to the conditioning apparatus in standard mouse cages. Chambers were cleaned with 70% ethanol between each run.
Context B was a modified context A. The stainless steel bars were covered with a white plastic insert, the walls of the chambers were covered with colored plastic inserts so as to change the shape of the chamber, and the chamber was then filled with bedding. The chamber was scented with anise, the room lighting was much dimmer and was illuminated with red lights, and the mice were transported to the apparatus in a white bucket.
Context C was a clear plastic container (Sterilite, #1758; http://www.sterilite.com/) with internal dimensions of 16 1/4 in x 23 1/2 in x 12 1/4 in. The container was filled with bedding to a height of approximately 1 in. Context C was in a completely different room than context A or B, consisted of a different handler, different transport container, extremely low lighting conditions, and had no detectable scent associated with it. Between runs, context C was cleaned using PDI Sani-Cloth HB Germicidal Disposable Wipes.
CFC
The one- and three-shock CFC procedures were based on those of Wiltgen et al. (2006), Drew et al. (2010), and Denny et al. (2012). For the one-shock CFC, mice were placed into the conditioning chamber, received one shock at 180 s (2 s, 0.75 mA), and were removed 15 s following the shock. For the three-shock CFC procedure, mice were placed in the conditioning chamber, received three shocks 180, 240, and 300 s later (2 s, 0.75 mA), and were removed 15 s following the last shock. For the four-shock procedure, mice were placed in the conditioning chamber, received four shocks 180, 240, 300, and 360 s later (2 s, 0.75 mA), and were removed 15 s following the last shock.
For context A exposures, CFC training and context exposure were conducted with the conditioning chambers configured exactly as during the CFC training in context A. For context B exposure, CFC training occurred in context A and context exposure occurred in context B. The length of context exposure was dependent upon the length of CFC training. For example, the length of context exposure for mice trained using a one-shock CFC paradigm was 180 s, whereas the length of context exposure for mice trained using a four-shock CFC paradigm was 360 s. The data sets from CFC training and encoding were subjected to Training x Group repeated measures ANOVA (Figure S7). Freezing was scoring for the 180 s before the onset of the first shock and for the 15 s following the last shock.
The data sets from context exposure were subjected to a two (treatment: A versus B; ArcCreERT2(+) versus ArcCreERT2(−); sham versus X-ray; or Ctrl versus SD) x 3–6 (min) repeated measures ANOVA with minutes as the repeated measure. The number of minutes varied depending on the cohort (e.g., one shock CFC = 3 min; 4–shock CFC = 6 min).
The training and memory expression recent experiments for the ArcCreERT2 x EYFP mice took place on day 2 and day 7, respectively, as described above. However, for the ArcCreERT2 x Arch-GFP and the ArcCreERT2 x eNpHR3.0-YFP mice, the training and memory expression recent experiments were separated by 2 weeks. This allowed for increased expression of the optogenetic reporter and for more time to attach the mice to the patch cables in their home cages.
Novel Object Recognition
Novel object recognition was performed as previously described (Denny et al., 2012).
Open Field
Exploration in response to a novel open field (OF) was measured as previously described (Richardson-Jones et al., 2010). The percent center distance was calculated as a ratio (center distance (C dist)/(center + periphery distance (C + P dist)).
Tail-Suspension Test
Mice were suspended by the tail using tape to secure them to a horizontal bar as previously described (Richardson-Jones et al., 2010). Briefly, animals were suspended for 5 min, and immobility during this period was assessed using an automated Viewpoint Videotrack software package.
Dominant Interaction
Dominant interaction was performed as previously described (Schloesser et al., 2010), with the exception that mice were allowed to explore for 30 min, and the first 10 min were later analyzed. Sessions were videotaped and analyzed using behavioral tracking software (TopScan, CleverSys). This software reliably scores the frequency and duration of interactions on either object or mouse through identification of the shape of a mouse, to include nose, body, and tail. Interaction ratios were calculated using an interaction quotient (interaction with CD-1/(interaction with CD-1 + interaction with empty enclosure)).
Elevated Plus Maze
The elevated plus maze was performed as previously described (Saxe et al., 2006).
Immunohistochemistry
Mice were deeply anesthetized, and brains were processed as previously described (Denny et al., 2012). For Arc, c-fos, Cre-recombinase, and YFP single immunohistochemistry, floating sections were used. Sections were rinsed three times in 1× PBS and blocked in 1× PBS with 0.5% Triton X-100 and 10% normal donkey serum for 2 hr at room temperature (RT). Incubation with primary antibody was performed at 4°C overnight (mouse anti-Arc, 1:1,000, Santa Cruz, sc-17839, rabbit anti-c-fos, 1:5,000, Calbiochem, rabbit anti-Cre-recombinase, 1:1,000, Covance, or chicken anti-GFP, 1:500, Abcam, ab13970) in 1× PBS with 0.5% Triton X-100. Sections were then washed in 1× PBS and incubated with a biotinylated secondary antibody (donkey anti-mouse, donkey anti-rabbit, donkey anti-chicken, 1:500, Jackson ImmunoResearch) for 2 hr at RT. Sections were then washed three times in 1× PBS and treated with avidin-biotin-peroxidase complex (ABC Elite Kit, Vector Labs), followed by a 3,3′ diaminobenzidine as substrate for staining (Vector).
For Arc and Cre-recombinase double immunohistochemistry, floating sections were used. Sections were first rinsed three times in 1× PBS and then blocked in 1× PBS with 0.5% Triton and 10% normal donkey serum (NDS) for 30 min at RT. Incubation with primary antibody was performed at 4°C overnight (rabbit anti-Arc, 1:1,000, SySy, 156 003) in 1× PBS. The next day, sections were then washed three times in 1× PBS and incubated with secondary antibody (donkey anti-rabbit Cy3, 1:500, Jackson ImmunoResearch) for 2 hr at RT. Sections were washed three times in 1× PBS and blocked in 1× PBS with 10% normal rabbit serum (NRS) for 2 hr at RT to saturate the open binding sites on the first secondary antibody with immunoglobulin G (IgG). Sections were then washed three times in 1× PBS and incubated with an excess of unconjugated AffiniPure Fab Fragments (donkey anti-rabbit IgG [H+L], 0.16 mg/ml, Jackson ImmunoResearch) for 2 hr at RT. Sections were again washed three times in 1× PBS. Incubation with the second primary antibody was performed at 4°C overnight (rabbit anti-Cre-recombinase, 1:1,000, Covance) in 1× PBS. On the following day, sections were washed three times in 1× PBS and incubated with the second secondary antibody (donkey anti-rabbit Cy2, 1:500, Jackson ImmunoResearch) for 2 hr at RT. Sections were washed three times in 1X PBS, mounted on slides, and coverslipped with ProLong Gold (Invitrogen). Control tissue without the primary antibody to Cre-recombinase was included.
For Arc and YFP/GFP double immunohistochemistry, or c-fos and YFP/GFP double immunohistochemistry, floating sections were used. Sections were first rinsed three times in 1×PBS and then blocked in 1×PBS with 0.5% Triton and 10% NDS for 2 hr at RT. Incubation with primary antibodies was performed at 4°C overnight (rabbit anti-Arc, 1:1000, SySy, Göttingen, Germany, 156 003; chicken anti-GFP 1:500, Abcam, Cambridge, MA, ab13970, rabbit anti-c-fos, 1:5000, Calbiochem, Darmstadt, Germany) in 1X PBS with 0.5% Triton X-100. Sections were then washed three times in 1X PBS and incubated with secondary antibodies (donkey anti-rabbit Cy3; biotinylated donkey anti-chicken; 1:500, Jackson ImmunoResearch, West Grove, PA) for 2 hr at RT. Sections were then washed three times in 1X PBS and incubated with a tertiary antibody (avidin-Cy2, 1:250, Jackson ImmunoResearch, West Grove, PA) and Hoechst (1:1000) for 1 hr at RT. Sections were washed three times in 1X PBS, mounted on slides, and coverslipped with ProLong Gold (Invitrogen).
Doublecortin (DCX) immunohistochemistry was performed as previously described (Denny et al., 2012).
BrdU immunohistochemistry was performed as previously described (Denny et al., 2012).
For CD68 immunohistochemistry, floating sections were used. Sections were first rinsed three times in 1X PBS and then placed in 0.3 H2O2 in 1X PBS for 30 min at RT. Sections were washed in 1X PBS and then blocked in 1X PBS with 0.5% Triton and 10% NDS for 2 hr at RT. Incubation with primary antibody was performed at 4°C overnight (rat anti-CD68, 1:500, Serotec, MCA 1957) in blocking solution. The next day, sections were then washed three times in 1× PBS and incubated with secondary antibody (donkey anti-rat biotin, 1:500, Jackson ImmunoResearch) for 2 hr at RT. Sections were then washed three times in 1× PBS and treated with avidin-biotin-peroxidase complex (ABC Elite Kit, Vector Labs), followed by a 3,3′ diaminobenzidine as substrate for staining (Vector).
For Iba immunohistochemistry, floating sections were used. Sections were first rinsed three times in 1× PBS and then placed in formamide: 2× saline-sodium citrate (SSC) (1:1) for 2 hr at 65°C. Sections were washed in 2× SSC for 5 min and then placed in 2 N HCl for 30 min at 37°C. Sections were then immediately placed in 0.1 M boric acid for 10 min and then blocked in 1× PBS with 0.5% Triton and 10% NDS for 2 hr at RT. Incubation with primary antibody was performed at 4°C overnight (rat anti-iba1, 1:1,000, a gift from Dr. Hohsaka, National Institute of Neuroscience) in blocking solution. The next day, sections were then washed three times in 1× PBS and incubated with secondary antibody (donkey anti-rat-Cy3; 1:500, Jackson ImmunoResearch) for 2 hr at RT.
Cell Quantification
For individual counts, an investigator blind to treatment used a Zeiss Axioplan-2 upright microscope to count EYFP+, Arc+, Brdu+, and c-fos+ immunoreactive cells bilaterally in the granule cell layer (GCL) of the DG and in CA3 throughout the entire rostrocaudal axis of the HPC (Santarelli et al., 2003). Every sixth section throughout the entire extent of the HPC was included in the analysis. Cells were counted bilaterally using the 20× objective. The average EYFP +, Arc+, and c-fos+ cells per section are presented throughout the text.
Confocal Microscopy
For colabeled cells, fluorescent confocal micrographs were captured with an Olympus Fluoview FV1000 confocal microscope with the aid of Olympus Fluoview 1000 (v. 1.5) software. Identification of coexpressing cells in the DG (EYFP+/Arc+, EYFP+/c-fos+, Cre-recombinase+/Arc+) entailed scanning approximately 24 sections throughout the HPC of each mouse at 20×. Phenotyping of coexpressing cells in CA3 (EYFP+/c-fos+) entailed scanning approximately ten sections throughout CA3 of each mouse at 20×. All individual panels were acquired at a thickness of 1.41 mm. Each channel was acquired in “Sequential Mode, Frame” so as to only excite that particular fluorophore, avoid bleedthrough, and prevent emission spectral overlap. All scans were acquired using the “Integration Type, Line Kalman,” in order to significantly increase the signal-to-noise ratio. Furthermore, we utilized the carbocyanine (Cy series) dyes (e.g., Cy2 and Cy3), as these designed organic molecules have a narrow emission spectra when compared with older probes.
Split-panel and z stack analysis was performed using the Olympus Fluoview (v. 2.0c) Viewer to determine ratios of EYFP+/Arc+, EYFP+/c-fos+, or Cre-recombinase+/Arc+ double-labeled cells. To identify colabeled cells, we looked at images one channel at a time (e.g., Arc labeled with Cy3). Cells that had signals above background were marked as positive and counted. Separate Cy2- and Cy3-filtered images were digitally combined to produce composite images. Throughout the experiment, the investigator was blind to the treatment status. Representative images were edited using Adobe Photoshop CS4, and all images were treated identically.
To obtain the percent of reactivation cells, we counted the total number of Arc or c-fos in a confocal image. The number of Arc+ or c-fos+ cells that were colabeled with EYFP was then counted. The ratio is expressed as ((EYFP+/Arc+)/Arc+) × 100%.
Arch-GFP Intensity Analysis
ImageJ software (National Institutes of Health) was used to quantify fluorescence intensity in arbitrary units (a.u.) of immunostaining in Arch-GFP(−/−) mice. Two high-magnification (20×) images of the entire DG were obtained from three-matched coronal 35 mm sections from each mouse. The images were stitched together using Adobe Photoshop CS4. The DG was outlined, and the mean intensity and area were obtained. Arch-GFP+ cells were not counted in the DG, as Arch is primarily dendritic and determining the number of Arch-GFP+ cells was impossible in this bigenic line. Student’s t test was used to determine p values.
Slice Preparation and Electrophysiology
Coronal slices (350 μm) were prepared from the dorsal HPC of adult mice, as described previously (Lovett-Barron et al., 2012). Slices were perfused with artificial cerebrospinal fluid (ACSF) containing 125 mM NaCl, 25 mM NaHCO3, 3 mM KCl, 1.25 mM NaH2PO4, 1 mM MgCl2, 2 mM CaCl2, 22.5 mM glucose, 3 mM sodium pyruvate, and 1 mM ascorbate and saturated with 95% O2 and 5% CO2. Experiments were done at 32°C–33°C. Slices were visualized with Dodt contrast optics using a Zeiss Examiner.Z1 with a 63× objective (numerical aperture [na] = 1.0) for somatic recordings. Neurons expressing GFP or YFP were selected for targeted patch-clamp recordings with a two-photon scanning upright microscope (Prairie Technologies). Whole-cell patch-clamp recordings from somata were obtained using a DaganBVC-700A amplifier in the active “bridge” mode, filtered at 1–10 kHz and digitized at 50 kHz. Recording pipettes were pulled from borosilicate glass to tip resistances of ~7–9 MΩ and contained 140 mM potassium gluconate, 4 mM NaCl, 10 mM HEPES, 4 mM Mg2ATP, 0.3 mM Tris2GTP, 14 mM phosphocreatine, and 0.05 mM Alexa 594 (pH 7.25). In current-clamp recordings, cells were held at their resting membrane potential (−73.4 ± 1 mV; n = 18), and in voltage-clamp recordings, the holding potential was −55 mV.
Electrophysiological Photostimulation
For Arch-GFP/eNpHR3.0-YFP photostimulation, a yellow laser (593.5 nm, OEM Laser Systems) was coupled to an optical fiber positioned above the DG, CA3, or CA1/2/3 with a micromanipulator. Photostimuli consisted of 500 ms pulses, and timing and intensity of the laser pulses were controlled using the laser’s analog modulation circuitry (PrairieView-TriggerSync, Prairie Technologies).
Electrophysiology Data Analysis
After establishing the whole-cell configuration, 500 ms laser stimuli were delivered ten times in voltage-clamp and current-clamp modes. Raw traces were imported to Igor Pro (v. 6) (WaveMetrics), averaged, and low-pass filtered at 1 kHz. Steady-state average current and potential values were determined from the last 100 ms of the 500 ms long stimulus. Data are given as the mean ± SEM.
Stereotactic Surgery
Male mice were surgically implanted with fiber optics at approximately 8–12 weeks of age, and behavioral experiments commenced >2 weeks after surgery to allow for recovery. For surgical implantation, mice were anesthetized with 100 mg/kg ketamine and 10 mg/kg xylazine and placed in a stereotaxic frame (Stoelting). Mice were implanted bilaterally with chronically dwelling optical fibers targeted to the DG (+/−1.0 mm ML, −1.5 mm AP, −1.7 mm DV), CA3 (+/−1.9 mm ML, −1.34 mm AP, −1.82 mm DV), or CA1/2/3 (mainly CA2) (+/−1.7 mm ML, −1.4 mm AP, −1.6 mm DV). Optical fibers were secured with anchoring screws and dental cement. After surgery, mice were returned to their home cage and monitored until recovery from surgery.
Construction of Optical Fibers
We employed use of published techniques for the construction of chronically dwelling optical fibers and patch cables for behavioral procedures (Sparta et al., 2012). Briefly, a 200 mm core, with a 0.37 numerical aperture (na) multimode fiber (ThorLabs), was threaded through and glued with epoxy to a 230 mm core stainless steel or zirconia multimode ferrule (Fiber Instrument Sales and Precision Fiber Products), polished, and cut at ~4 mm for implantation. They were then were tested for light output (~80%–95% light recovery) and clean scoring of the fiber; each implant was numbered, and the percent light recovery was noted for calibration of output for behavioral experiments. Optical patch cables were generated the same way, with the free end (~1–2 m from ferrule) connected to a multimode FC ferrule assembly for connecting to a 1X2 Optical rotary joint (Doric lenses). The other end of the rotary joint was connected via a patch cable to a 100 mW 593.5 nm yellow laser (OEM Laser Systems) via a non-contact-style laser to fiber coupler (OZ optics).
Optogenetic Inhibition during Behavior
During CFC training, mice were attached to the fiber optic patch cables (bilaterally) via zirconia sleeves. Optogenetic inhibition did not occur during CFC training. Mice were attached to the fiber optic patch cables (bilaterally) via zirconia sleeves four more times between CFC training and CFC expression in their home cages to allow the mice to become adjusted to the process. During CFC expression, mice were attached to the fiber optic patch cables (bilaterally) via a zirconia sleeve. The CFC memory expression sessions lasted 6 min and consisted of two 3 min epochs, with the laser ON for the first 3 min epoch and the laser OFF for the last 3 min epoch. The patch cables were interfaced to an FC/PC rotary joint (Doric lenses), which was attached on the other end to a 593.5 nm laser diode. During the light ON epoch, yellow light was provided for the full 3 min at a light power of 15 mW at the tip of the implanted fiber optic. CFC behavioral data were analyzed for the first minute in the light ON and light OFF epochs for the ArcCreERT2(+) x R26R-CAG-STOP-floxed-Arch-GFP mice (min 1 and 4). We additionally performed analyses for min 1–3 (light ON) versus min 4–6 (light OFF).
X-Irradiation
This procedure was performed as previously described (Denny et al., 2012; Drew et al., 2010; Santarelli et al., 2003), with the exception that the ArcCreERT2 mice were x-irradiated with an X-RAD 320 Biological Irradiator (Precision X-Ray). Briefly, male ArcCreERT2(+) x R26R-STOP-floxed-EYFP(+/−) mice (approximately 9 weeks of age) were x-irradiated three times (approximately 2.5 Gy per dose) in the course of 1 week, for a cumulative dose of 7.5 Gy. Mice were anesthetized with pentobarbital sodium (Nembutal sodium solution) (6 mg/kg), placed in a stereotaxic frame, and exposed to cranial x-irradiation. Sham mice were treated identically but did not receive x-irradiation.
SD
Repeated SD was used to induce a depressive-like phenotype in intruder mice during the SD induction phase. Adult aggressor CD-1 male mice were single-housed in a Macrolon polycarbonate resin cages (15.25 × 7.8 × 9.5 in) (Animal Care Systems). Male ArcCreERT2(+) x R26R-STOP-floxed-EYFP(+/−) (approximately 8.5 weeks of age) were subsequently placed into the resident CD-1 mouse’s cage. Three antagonistic encounters were allowed between the CD-1 mouse and the intruder. Following the encounters, a polished stainless steel cage divider (Animal Care Systems, P/N C79171), which allowed for olfactory and auditory communication, but not for visual or tactile contact to occur, was placed down the middle to separate the two mice. The partition was removed daily for 2 weeks, and three antagonistic encounters were allowed between the mice each day. This procedure consistently yielded a submissive phenotype in the experimental intruder mice. Control (Ctrl) mice were group housed in the same cages.
Statistical Analysis
In general, the effect of treatment or context was analyzed using ANOVA, using repeated measures where appropriate. Significant ANOVAs were followed up with Fisher’s PLSD tests where appropriate. All main effects and interactions are noted in the text.
For analyses on EYFP+, Arc+, c-fos+, EYFP+/Arc+, or EYFP+/c-fos+ counts, statistical significance was assessed by using an unpaired two-tailed Student’s t test. p values are noted throughout the text.
For the regression analyses, the average freezing across the context exposure versus the average percent of colabeled EYFP+/c-fos+ cells were plotted for each individual mouse. The R2 and p values are noted.
All data were analyzed using StatView (v. 5.0) software (SAS Institute). Alpha was set to 0.05 for all analyses. Data are expressed as means ± SEM. * p < 0.05, ** p < 0.01, *** p < 0.001.
Supplementary Material
Acknowledgments
C.A.D. was supported by grants from the National Institutes of Research (NIH) (F31MH084529-01, T32 MH015174-36, and T32 GM008798-8). M.A.K. was supported by a NIH grant (K01MH099371-01), a U.S. National Alliance for Research in Schizophrenia and Depression (NARSAD) Young Investigator Award, and a Sackler Institute Award. K.F.T. was supported by a NARSAD 2008 Young Investigator Award. R.H. was supported by a NARSAD, the New York Stem Cell Initiative, and a NIH grant (R01 MH068542). We thank members of the Hen laboratory, R. Axel, S.A. Siegelbaum, S. Fusi, A.A. Fenton, K. Martinowich, and J.V. Kupferman for insightful comments on this project and manuscript and M. Thomsen, A. Jonathan, and M.R. Drew for technical assistance early in this project. Cognitive and behavioral phenotyping experiments utilized the facilities of the Rodent Models Neurobehavioral Analysis Core of the Lieber Center for Schizophrenia Research at Columbia University and the New York State Psychiatric Institute (NYSPI).
Footnotes
Supplemental Information includes seven figures and can be found with this article online at http://dx.doi.org/10.1016/j.neuron.2014.05.018.
References
- Bakker A, Kirwan CB, Miller M, Stark CEL. Pattern separation in the human hippocampal CA3 and dentate gyrus. Science. 2008;319:1640–1642. doi: 10.1126/science.1152882. [DOI] [PMC free article] [PubMed] [Google Scholar]
- Bartlett FC. Remembering: A Study in Experimental and Social Psychology. Cambridge: Cambridge University Press; 1932. [Google Scholar]
- Deng W, Aimone JB, Gage FH. New neurons and new memories: how does adult hippocampal neurogenesis affect learning and memory? Nat Rev Neurosci. 2010;11:339–350. doi: 10.1038/nrn2822. [DOI] [PMC free article] [PubMed] [Google Scholar]
- Denny CA, Burghardt NS, Schachter DM, Hen R, Drew MR. 4- to 6-week-old adult-born hippocampal neurons influence novelty-evoked exploration and contextual fear conditioning. Hippocampus. 2012;22:1188–1201. doi: 10.1002/hipo.20964. [DOI] [PMC free article] [PubMed] [Google Scholar]
- Drew MR, Denny CA, Hen R. Arrest of adult hippocampal neurogenesis in mice impairs single- but not multiple-trial contextual fear conditioning. Behav Neurosci. 2010;124:446–454. doi: 10.1037/a0020081. [DOI] [PMC free article] [PubMed] [Google Scholar]
- Frankland PW, Ding HK, Takahashi E, Suzuki A, Kida S, Silva AJ. Stability of recent and remote contextual fear memory. Learn Mem. 2006;13:451–457. doi: 10.1101/lm.183406. [DOI] [PMC free article] [PubMed] [Google Scholar]
- Ge S, Goh EL, Sailor KA, Kitabatake Y, Ming GL, Song H. GABA regulates synaptic integration of newly generated neurons in the adult brain. Nature. 2006;439:589–593. doi: 10.1038/nature04404. [DOI] [PMC free article] [PubMed] [Google Scholar]
- Goshen I, Brodsky M, Prakash R, Wallace J, Gradinaru V, Ramakrishnan C, Deisseroth K. Dynamics of retrieval strategies for remote memories. Cell. 2011;147:678–689. doi: 10.1016/j.cell.2011.09.033. [DOI] [PubMed] [Google Scholar]
- Guzowski JF, McNaughton BL, Barnes CA, Worley PF. Environment-specific expression of the immediate-early gene Arc in hippocampal neuronal ensembles. Nat Neurosci. 1999;2:1120–1124. doi: 10.1038/16046. [DOI] [PubMed] [Google Scholar]
- Hayashi S, McMahon AP. Efficient recombination in diverse tissues by a tamoxifen-inducible form of Cre: a tool for temporally regulated gene activation/inactivation in the mouse. Dev Biol. 2002;244:305–318. doi: 10.1006/dbio.2002.0597. [DOI] [PubMed] [Google Scholar]
- Kheirbek MA, Drew LJ, Burghardt NS, Costantini DO, Tannenholz L, Ahmari SE, Zeng H, Fenton AA, Hen R. Differential control of learning and anxiety along the dorsoventral axis of the dentate gyrus. Neuron. 2013;77:955–968. doi: 10.1016/j.neuron.2012.12.038. [DOI] [PMC free article] [PubMed] [Google Scholar]
- Kim JJ, Fanselow MS. Modality-specific retrograde amnesia of fear. Science. 1992;256:675–677. doi: 10.1126/science.1585183. [DOI] [PubMed] [Google Scholar]
- Lacefield CO, Itskov V, Reardon T, Hen R, Gordon JA. Effects of adult-generated granule cells on coordinated network activity in the dentate gyrus. Hippocampus. 2012;22:106–116. doi: 10.1002/hipo.20860. [DOI] [PMC free article] [PubMed] [Google Scholar]
- Lee I, Kesner RP. Encoding versus retrieval of spatial memory: double dissociation between the dentate gyrus and the perforant path inputs into CA3 in the dorsal hippocampus. Hippocampus. 2004;14:66–76. doi: 10.1002/hipo.10167. [DOI] [PubMed] [Google Scholar]
- Leutgeb JK, Leutgeb S, Moser MB, Moser EI. Pattern separation in the dentate gyrus and CA3 of the hippocampus. Science. 2007;315:961–966. doi: 10.1126/science.1135801. [DOI] [PubMed] [Google Scholar]
- Link W, Konietzko U, Kauselmann G, Krug M, Schwanke B, Frey U, Kuhl D. Somatodendritic expression of an immediate early gene is regulated by synaptic activity. Proc Natl Acad Sci USA. 1995;92:5734–5738. doi: 10.1073/pnas.92.12.5734. [DOI] [PMC free article] [PubMed] [Google Scholar]
- Liu X, Ramirez S, Pang PT, Puryear CB, Govindarajan A, Deisseroth K, Tonegawa S. Optogenetic stimulation of a hippocampal engram activates fear memory recall. Nature. 2012;484:381–385. doi: 10.1038/nature11028. [DOI] [PMC free article] [PubMed] [Google Scholar]
- Lovett-Barron M, Turi GF, Kaifosh P, Lee PH, Bolze F, Sun XH, Nicoud JF, Zemelman BV, Sternson SM, Losonczy A. Regulation of neuronal input transformations by tunable dendritic inhibition. Nat Neurosci. 2012;15:423–430. doi: 10.1038/nn.3024. [DOI] [PubMed] [Google Scholar]
- Lyford GL, Yamagata K, Kaufmann WE, Barnes CA, Sanders LK, Copeland NG, Gilbert DJ, Jenkins NA, Lanahan AA, Worley PF. Arc, a growth factor and activity-regulated gene, encodes a novel cytoskeleton-associated protein that is enriched in neuronal dendrites. Neuron. 1995;14:433–445. doi: 10.1016/0896-6273(95)90299-6. [DOI] [PubMed] [Google Scholar]
- Madisen L, Zwingman TA, Sunkin SM, Oh SW, Zariwala HA, Gu H, Ng LL, Palmiter RD, Hawrylycz MJ, Jones AR, et al. A robust and high-throughput Cre reporting and characterization system for the whole mouse brain. Nat Neurosci. 2010;13:133–140. doi: 10.1038/nn.2467. [DOI] [PMC free article] [PubMed] [Google Scholar]
- Marín-Burgin A, Mongiat LA, Pardi MB, Schinder AF. Unique processing during a period of high excitation/inhibition balance in adult-born neurons. Science. 2012;335:1238–1242. doi: 10.1126/science.1214956. [DOI] [PMC free article] [PubMed] [Google Scholar]
- Marr D. Simple memory: a theory for archicortex. Philos Trans R Soc Lond B Biol Sci. 1971;262:23–81. doi: 10.1098/rstb.1971.0078. [DOI] [PubMed] [Google Scholar]
- McHugh TJ, Jones MW, Quinn JJ, Balthasar N, Coppari R, Elmquist JK, Lowell BB, Fanselow MS, Wilson MA, Tonegawa S. Dentate gyrus NMDA receptors mediate rapid pattern separation in the hippocampal network. Science. 2007;317:94–99. doi: 10.1126/science.1140263. [DOI] [PubMed] [Google Scholar]
- Neunuebel JP, Knierim JJ. Spatial firing correlates of physiologically distinct cell types of the rat dentate gyrus. J Neurosci. 2012;32:3848–3858. doi: 10.1523/JNEUROSCI.6038-11.2012. [DOI] [PMC free article] [PubMed] [Google Scholar]
- Niibori Y, Yu TS, Epp JR, Akers KG, Josselyn SA, Frankland PW. Suppression of adult neurogenesis impairs population coding of similar contexts in hippocampal CA3 region. Nat Commun. 2012;3:1253. doi: 10.1038/ncomms2261. [DOI] [PMC free article] [PubMed] [Google Scholar]
- O’Reilly RC, McClelland JL. Hippocampal conjunctive encoding, storage, and recall: avoiding a trade-off. Hippocampus. 1994;4:661–682. doi: 10.1002/hipo.450040605. [DOI] [PubMed] [Google Scholar]
- Plath N, Ohana O, Dammermann B, Errington ML, Schmitz D, Gross C, Mao X, Engelsberg A, Mahlke C, Welzl H, et al. Arc/Arg3.1 isessential for the consolidation of synaptic plasticity and memories. Neuron. 2006;52:437–444. doi: 10.1016/j.neuron.2006.08.024. [DOI] [PubMed] [Google Scholar]
- Richardson-Jones JW, Craige CP, Guiard BP, Stephen A, Metzger KL, Kung HF, Gardier AM, Dranovsky A, David DJ, Beck SG, et al. 5-HT1A autoreceptor levels determine vulnerability to stress and response to antidepressants. Neuron. 2010;65:40–52. doi: 10.1016/j.neuron.2009.12.003. [DOI] [PMC free article] [PubMed] [Google Scholar]
- Reijmers LG, Perkins BL, Matsuo N, Mayford M. Localization of a stable neural correlate of associative memory. Science. 2007;317:1230–1233. doi: 10.1126/science.1143839. [DOI] [PubMed] [Google Scholar]
- Sahay A, Wilson DA, Hen R. Pattern separation:a commonfunction for new neurons in hippocampus and olfactory bulb. Neuron. 2011a;70:582–588. doi: 10.1016/j.neuron.2011.05.012. [DOI] [PMC free article] [PubMed] [Google Scholar]
- Sahay A, Scobie KN, Hill AS, O’Carroll CM, Kheirbek MA, Burghardt NS, Fenton AA, Dranovsky A, Hen R. Increasing adult hippocampal neurogenesis is sufficient to improve pattern separation. Nature. 2011b;472:466–470. doi: 10.1038/nature09817. [DOI] [PMC free article] [PubMed] [Google Scholar]
- Santarelli L, Saxe M, Gross C, Surget A, Battaglia F, Dulawa S, Weisstaub N, Lee J, Duman R, Arancio O, et al. Requirement of hippocampal neurogenesis for the behavioral effects of antidepressants. Science. 2003;301:805–809. doi: 10.1126/science.1083328. [DOI] [PubMed] [Google Scholar]
- Saxe MD, Battaglia F, Wang JW, Malleret G, David DJ, Monckton JE, Garcia AD, Sofroniew MV, Kandel ER, Santarelli L, et al. Ablation of hippocampal neurogenesis impairs contextual fear conditioning and synaptic plasticity in the dentate gyrus. Proc Natl Acad Sci USA. 2006;103:17501–17506. doi: 10.1073/pnas.0607207103. [DOI] [PMC free article] [PubMed] [Google Scholar]
- Schloesser RJ, Lehmann M, Martinowich K, Manji HK, Herkenham M. Environmental enrichment requires adult neurogenesis to facilitate the recovery from psychosocial stress. Mol Psychiatry. 2010;15:1152–1163. doi: 10.1038/mp.2010.34. [DOI] [PMC free article] [PubMed] [Google Scholar]
- Sparta DR, Stamatakis AM, Phillips JL, Hovelsø N, van Zessen R, Stuber GD. Construction of implantable optical fibers for long-term optogenetic manipulation of neural circuits. Nat Protoc. 2012;7:12–23. doi: 10.1038/nprot.2011.413. [DOI] [PMC free article] [PubMed] [Google Scholar]
- Srinivas S, Watanabe T, Lin CS, William CM, Tanabe Y, Jessell TM, Costantini F. Cre reporter strains produced by targeted insertion of EYFP and ECFP into the ROSA26 locus. BMC Dev Biol. 2001;1:4. doi: 10.1186/1471-213X-1-4. [DOI] [PMC free article] [PubMed] [Google Scholar]
- Stone SS, Teixeira CM, Zaslavsky K, Wheeler AL, Martinez-Canabal A, Wang AH, Sakaguchi M, Lozano AM, Frankland PW. Functional convergence of developmentally and adult-generated granule cells in dentate gyrus circuits supporting hippocampus-dependent memory. Hippocampus. 2011;21:1348–1362. doi: 10.1002/hipo.20845. [DOI] [PubMed] [Google Scholar]
- Treves A, Rolls ET. Computational constraints suggest the need for two distinct input systems to the hippocampal CA3 network. Hippocampus. 1992;2:189–199. doi: 10.1002/hipo.450020209. [DOI] [PubMed] [Google Scholar]
- Wiltgen BJ, Sanders MJ, Anagnostaras SG, Sage JR, Fanselow MS. Context fear learning in the absence of the hippocampus. J Neurosci. 2006;26:5484–5491. doi: 10.1523/JNEUROSCI.2685-05.2006. [DOI] [PMC free article] [PubMed] [Google Scholar]
- Winocur G, Frankland PW, Sekeres M, Fogel S, Moscovitch M. Changes in context-specificity during memory reconsolidation: selective effects of hippocampal lesions. Learn Mem. 2009;16:722–729. doi: 10.1101/lm.1447209. [DOI] [PubMed] [Google Scholar]
Associated Data
This section collects any data citations, data availability statements, or supplementary materials included in this article.