

Significance
Many cell decisions depend on precise measurements of external ligands reversibly bound to receptors. Yeast cells orient in gradients of sex pheromone detecting differences in the amount of ligand-receptor complex. However, yeast can orient in gradients with nearly all receptors occupied. We describe a general systems-level mechanism, pre-equilibrium sensing and signaling (PRESS), which overcomes this saturation limit by shifting and expanding the input dynamic range to which cells can respond. PRESS requires that events downstream of the receptor be transient and faster than the time required for the receptor to reach equilibrium binding. Experiments and simulations show that PRESS operates in yeast and may help cells orient in gradients. Many ligand-receptor interactions are slow, suggesting that PRESS is widespread throughout eukaryotes.
Keywords: cellular signaling, binding kinetics, dose–response
Abstract
Cell signaling systems sense and respond to ligands that bind cell surface receptors. These systems often respond to changes in the concentration of extracellular ligand more rapidly than the ligand equilibrates with its receptor. We demonstrate, by modeling and experiment, a general “systems level” mechanism cells use to take advantage of the information present in the early signal, before receptor binding reaches a new steady state. This mechanism, pre-equilibrium sensing and signaling (PRESS), operates in signaling systems in which the kinetics of ligand-receptor binding are slower than the downstream signaling steps, and it typically involves transient activation of a downstream step. In the systems where it operates, PRESS expands and shifts the input dynamic range, allowing cells to make different responses to ligand concentrations so high as to be otherwise indistinguishable. Specifically, we show that PRESS applies to the yeast directional polarization in response to pheromone gradients. Consideration of preexisting kinetic data for ligand-receptor interactions suggests that PRESS operates in many cell signaling systems throughout biology. The same mechanism may also operate at other levels in signaling systems in which a slow activation step couples to a faster downstream step.
Detecting and responding to a chemical gradient is a central feature of a multitude of biological processes (1). For this behavior, organisms use signaling systems that sense information about the extracellular world, transmit this information into the cell, and orchestrate a response. Measurements of the direction and proximity of the extracellular stimuli usually rely on the binding of diffusing chemical particles (ligands) to specific cell surface receptors. Different organisms have evolved different strategies to make use of this information. Small motile organisms, including certain bacteria, use a temporal sensing strategy, measuring and comparing concentration signals over time along their swimming tracks (2). In contrast, some eukaryotic cells, including Saccharomyces cerevisiae, are sufficiently large to implement a spatial sensing mechanism, measuring concentration differences across their cell bodies (3).
The observation that some eukaryotes that use spatial sensing exhibit remarkable precision in response to shallow gradients (1–2% differences in ligand concentration between front and rear) (4, 5) has led to several proposed models in which large amplification is achieved by positive feedback loops in the signaling pathways triggered by the ligand-receptor binding (6, 7). Here, we describe a different mechanism, dependent on ligand-receptor binding dynamics, which improves gradient sensing when the concentration of external ligand is close to saturation. We use the budding yeast S. cerevisiae to study the efficiency of this mechanism.
Haploid yeast cells exist in two mating types, MATa and MATα (also referred to as a and α cells). Mating occurs when a and α cells sense each other’s secreted mating pheromones: a-factor and α-factor (αF) (8). The pheromone secreted by the nearby mating partner diffuses, forming a gradient surrounding the sensing cell. Pheromone binds a membrane receptor, Ste2, in MATa yeast (9) that activates a pheromone response system (PRS), which cells use to decide whether to fuse with a mating partner or not. At high enough αF concentrations, cells develop a polarized chemotropic growth toward the pheromone source (4). To do that, the nonmotile yeast determines the direction of the potential mating partner measuring on which side there are more bound pheromone receptors, which are initially distributed homogeneously on the cell surface (10). However, this sensing modality can only work when external pheromone is nonsaturating: If all receptors are bound, cells should not be able to determine the direction of the gradient. Surprisingly, even at high pheromone concentrations, yeast tend to polarize in the correct direction (4, 11). Different amplification mechanisms have been proposed to account for the conversion of small differences in ligand concentration across the yeast cell, as is the case for dense mating mixtures, into chemotropic growth (6).
We previously studied induction of reporter gene output by the PRS after step increases in the concentration of αF. We found large cell-to-cell variability, the bulk of which was due to large differences in the ability of individual cells to send signal through the system and in their general capacity to express proteins (12). The level of induced gene expression matches well the equilibrium binding curve of αF to receptor (13, 14), a phenomenon known as dose–response alignment (DoRA), common to many other signaling systems (14). In the PRS, DoRA persists for several hours of stimulation.
During these studies, we realized that the binding dynamics of αF to its receptor is remarkably slow: At concentrations near the dissociation constant (Kd), binding takes about 20 min to reach 90% of the equilibrium level (15, 16). This dynamics is slow relative not only to the 90-min cell division cycle but also to the pheromone-dependent activation of the mitogen-activated protein kinase (MAPK) Fus3, which takes 2 to 5 min to reach steady-state levels (14). An unavoidable conclusion is that the machinery downstream of the αF receptor must be using pre-equilibrium binding information for its operation.
This observation led us to study the consequences of fast and slow ligand-receptor dynamics on the ability of cells to sense extracellular cues. In biology, the rates of ligand binding and unbinding to membrane receptors span a large range, including many cases with dynamics similar to, or even slower than, that of mating pheromone (e.g., rates for EGF, insulin, glucagon, IFN-α1a, and IL-2 in Table 1).
Table 1.
Sample receptor/ligand binding parameters
| Receptor | Ligand | Cell type | k− (1/s) | Kd (M) | τ (at L = Kd), s | Ref. |
| Fcε | IgE | Human basophils | 2.50E-05 | 4.80E-10 | 20,000.00 | (17) |
| Fcγ | 2.4G2 monoclonal Fab | Mouse macrophage | 3.80E-05 | 7.70E-10 | 13,157.89 | (18) |
| Canabinoid receptor | CP55,940 | Rat brain | 1.32E-04 | 2.10E-08 | 3,787.88 | (19) |
| IL-2 receptor | IL-2 | T cells | 2.00E-04 | 7.40E-12 | 2,500.00 | (20) |
| α1-Adrenergic | Prazosin | BC3H1 | 3.00E-04 | 7.50E-11 | 1,666.67 | (21) |
| Glucagon receptor | Glucagon | Rat hepatocytes | 4.30E-04 | 3.06E-10 | 1,162.79 | (22) |
| Formyl peptide receptor (FPR) | fMLP | Rat neutrophils | 5.50E-04 | 3.45E-08 | 909.09 | (23) |
| Ste2 (αF receptor) | αF | S. cerevisiae | 1.00E-03 | 5.50E-09 | 500.00 | (15, 16) |
| IFN | Human IFN-α1a | A549 | 1.20E-03 | 3.30E-10 | 416.67 | (24) |
| Transferrin | Transferrin | HepG2 | 1.70E-03 | 3.30E-08 | 294.12 | (25) |
| EGF receptor | EGF | Fetal rat lung | 2.00E-03 | 6.70E-10 | 250.00 | (26) |
| TNF | TNF | A549 | 2.30E-03 | 1.50E-10 | 217.39 | (24) |
| Insulin receptor | Insulin | Rat fat cells | 3.30E-03 | 2.10E-08 | 151.52 | (27) |
| FPR | FNLLP | Rabbit neutrophils | 6.70E-03 | 2.00E-08 | 74.63 | (28) |
| Total fibronectin receptors | Fibronectin | Fibroblasts | 1.00E-02 | 8.60E-07 | 50.00 | (29) |
| T-cell receptor | Class II MHC-peptide | 2B4 T-cells | 5.70E-02 | 6.00E-05 | 8.77 | (30) |
| FPR | N-formyl peptides | Human neutrophils | 1.70E-01 | 1.20E-07 | 2.94 | (31) |
| cAMP receptor | cAMP | D. discoideum | 1.00E+00 | 3.30E-09 | 0.50 | (32) |
| IL-5 receptor | IL-5 | COS | 1.47E+00 | 5.00E-09 | 0.34 | (33) |
| NMDA receptor | Glutamate | Hippocampal neurons | 5.00E+00 | 1.00E-06 | 0.10 | (34) |
| Adenosine A2A | Adenosine | HEK 293 (human) | 1.75E+01 | 5.20E-08 | 0.03 | (35) |
| AMPA receptor | Glutamate | HEK 293 (human) | 2.00E+03 | 5.00E-04 | 2.50E-04 | (36) |
A549, human lung alveolar carcinoma; BC3H1, smooth muscle-like cell line; COS, fibroblast-like cell line derived from monkey kidney tissue; 2.4G2 Fab, Fab portion of 2.4G2 antibody against receptor; fMLP, N-formyl-methionyl-leucyl-phenylalanine; FNLLP, N-formylnorleucylleucylphenylalanine; HepG2, human hepatoma cell line; τ, time it takes the binding reaction to reach 63% of its final (equilibrium) value. The value of τ depends on the concentration of the ligand (Fig. 1). Thus, we show the data for a concentration of ligand equal to the Kd of each reaction. Prazosin is an antagonist to the receptor.
Our study revealed a mode of sensing that can greatly increase the ability of cells to discriminate doses at high ligand concentrations.
Results
Ligand-Receptor Binding Dose–Response Curve Changes Over Time.
We consider the time evolution of occupied receptor at different doses of ligand for the simple case of one-step binding described by
where L is the ligand, R is the receptor, C is the ligand-receptor complex, and k+ and k− are the binding and unbinding rates, respectively. Assuming free L is not significantly affected by the reaction, binding over time may be described by
with
and
Ceq is the equilibrium value of C, Rtot is the total of amount of receptor, and τ is the exponential time constant (time at which C reaches ∼63.2% of the steady-state value). Thus, the time evolution of C depends on ligand concentration: The higher the concentration of ligand, the faster binding reaches equilibrium (Fig. 1A). Similarly, plotting C vs. L at different times shows that the EC50 (concentration of the ligand that occupies 50% of the receptors) of the binding curve is high at early times but becomes progressively lower as time passes (Fig. 1B). As a result, before binding reaches equilibrium (t∞), the receptor is sensitive in a region of ligand concentrations that will later saturate the receptor (SI Appendix, section 1). For example, in the case of αF, two high concentrations, L1 and L2 (55 Kd and 80 Kd), result in a 12.7% difference in occupied receptors at 10 s, and in only a 0.56% difference at equilibrium (Fig. 1B).
Fig. 1.
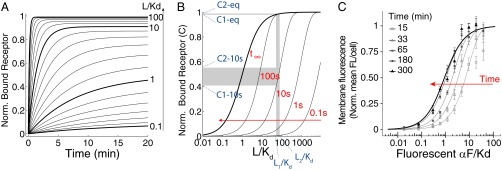
Time-dependent shift of the binding dose–response curve. (A) Time course of receptor/ligand complex formation for different ligand concentrations (relative to the affinity dissociation constant, Kd), in the range 0.1–100 Kd. We computed values for the case of one-step binding using the reaction , with the following αF binding reaction rates: k+ = 1.9 105 M−1⋅s−1 and k− = 0.001 s−1 (15, 16). We assumed that the concentration of free L over time is constant. Norm., normalized. (B) Dose–response curves for the receptor/ligand reaction computed at different times, as indicated over the curves (and with a red arrow). Two concentrations, L1 and L2, result in well-separated levels of occupied receptor C1 and C2 at 10 s (0.4211 and 0.5483, respectively), but not at the equilibrium values C1-eq and C2-eq (0.9821 and 0.9877, respectively). (C) Yeast cells of strain YAB3725 [∆bar1, PSTE2 STE2(T305)-CFP] were grown and stimulated with the indicated amounts of a fluorescent αF derivative (37), and the binding was determined by fluorescence microscopy as explained in Materials and Methods. The mean and 95% confidence interval for the mean are shown for each concentration and time. A simple binding model was globally fitted to the data, resulting in Kd = 23 ± 3 nM and k− = 1.0 ± 0.2 10−4⋅s−1 (solid lines).
To verify experimentally our theoretical analysis suggesting a slow reduction over time in the EC50 of the dose–response curve for receptor binding, we measured the binding dynamics of fluorescently tagged αF (37) to live yeast by fluorescence cytometry (Fig. 1C). To minimize ligand depletion at low concentrations, we used low numbers of yeast in a rather large volume. To block receptor turnover, we performed the experiment in the presence of the translation inhibitor cycloheximide and used a strain expressing a truncated receptor that is not endocytosed (T305) (38). As predicted, the dose–response curve for receptor binding exhibited a high EC50 at early times (184 ± 60 nM) that slowly decreased to its low equilibrium value (23 ± 3 nM).
Utilization of Pre-equilibrium Information Modulates the Input Dynamic Range.
This slow decrease in the EC50 of the response curve for receptor binding suggested that cells that could activate signaling rapidly, before ligand-receptor binding reaches equilibrium, might be able to discriminate ligand doses that would be otherwise indistinguishable. This idea has not been previously explored and it may potentially be very important. We refer to such signaling as pre-equilibrium sensing and signaling (PRESS) and to the operation of signaling systems before reaching equilibrium as operation in PRESS mode. In PRESS mode, such systems could determine downstream responses using quantities different from equilibrium occupancy levels, such as absolute receptor occupancy at a given moment or the time derivative of receptor occupancy, which, at short times, is proportional to ligand concentration. We will show below that operation of signaling systems in PRESS mode can have two consequences. Operation in PRESS mode can shift the input dynamic range (the range of input concentrations that elicit distinguishable outputs, usually quantified by the EC90 and EC10) to a region of higher dose concentrations. Operation in PRESS mode can also expand the input dynamic range, permitting better discrimination at high concentrations, although still maintaining a good response at low doses. Response curves with enlarged input dynamic ranges are also called “subsensitive” (39) (SI Appendix, section 3).
We reasoned that if the downstream signaling is transient, as well as fast, the system should have the extra advantage of avoiding the transmission of occupancy levels during equilibrium, which convey no information useful to discriminate high doses. To introduce PRESS and describe its effects, we considered the behavior of a “toy model” system (Fig. 2A). Here, occupied receptor activates effector X, then active X (X*) converts into an inactive refractory state (X^), which slowly converts back to the inactive form (X), closing the cycle. In this toy model, when X activation (X → X*) and inactivation (X* → X^) reaction rates are fast relative to the reset reaction (X^ → X), the value of X* peaks and declines; that is, activation of X is transient [reactions that generate transient activation are sometimes referred to as “pulse-generators” (40)]. In addition, when activation and inactivation of X are fast relative to the speed of the binding reaction of L, the output of this system (peak X*) depends on receptor occupancy before equilibrium. With the rates we used, the overall system exhibited a large shift in the output EC50 to high doses relative to the EC50 of the receptor binding reaction at equilibrium. In this case, there was also a large expansion of the input dynamic range relative to binding equilibrium (65-fold shift and 4.4-fold expansion, with the rates used in Fig. 2B). Note that, as expected, the shift of the EC50 and the expansion of the input dynamic range result from an increased ability of the system to discriminate high doses (Fig. 2B).
Fig. 2.
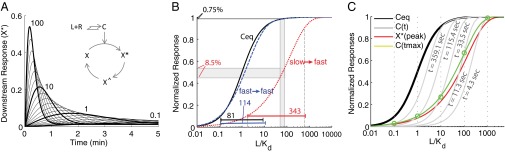
PRESS. Coupling a slow binding reaction to a fast and transient response can expand the input dynamic range beyond equilibrium saturation. (A) Inset shows a toy model with a downstream response activated by the ligand-receptor complex computed in Fig. 1A. Occupied receptor activates effector X; then, X* converts into X^, which slowly converts back to X, closing the cycle (details are provided in SI Appendix, section 2). The plot shows X* vs. time for all of the concentrations of L included in Fig. 1A. (B) Shift and expansion of the input dynamic range are due to PRESS. L-receptor complex at equilibrium (Ceq, solid black line), as well as peak X* resulting from using slow (red dotted line) or fast (blue dashed line) binding/unbinding rates of L to R, vs. input L, are shown. The resulting input dynamic ranges (the fold change required in input to elicit a change from 10 to 90% of maximum output) are indicated. The two doses indicated, L1 = 55 Kd and L2 = 80 Kd, result in an 8.5% difference in peak X* for slow-fast coupling, and only a 0.75% difference for fast-fast coupling. (C) Graphical description of the expansion of the input dynamic range in the toy model. The plot shows L-receptor complex at equilibrium (Ceq, solid black line), or at the indicated times before equilibrium (C(t), solid gray line), as well as peak X* (solid red line), all as a function of input L. Note, as shown in A, that peak X* occurs at different times for different concentrations of input L. Therefore, the values of C at the time when X* peaks (Ctmax, solid green line) correspond to different C(t) gray curves for each dose of L (green ○). The Ctmax curve is itself shifted to higher doses than Ceq, and it has a larger input dynamic range (less steep) than either Ceq or any C(t) curves [EC50 = 17.7 and sensitivity (nH) = 0.9]. In B and C, the x axis corresponds to L normalized by the Kd of the ligand-receptor reaction. All data correspond to simulations, done using the following parameters for the X cycle: r1 = 0.1, r2 = 0.08, r3 = 0.001, and Xtot = 10 (Xtot being the total amount of X). Binding/unbinding rates were k− = 0.001 1/s, k+ = 0.00019 (nM · s)−1 for slow binding (A, red line in B and C) and 100-fold those values for fast binding (blue line in B) (SI Appendix, Fig. S1).
In this toy model, PRESS shifts the input dynamic range because the peak of X* occurs at a time when the dose–response binding curve has not yet reached the receptor binding equilibrium curve; thus, it has a higher EC50 (Fig. 1B). To understand how it is that PRESS may also expand the input dynamic range, consider that the peak of X* occurs at different times for different concentrations of L (Fig. 2 A and C). In particular, when L is large, the peak of X* occurs earlier than when L is small. Now, at the same time that the X cycle is taking place, the EC50 of the binding dose–response curve is decreasing over time (Fig. 1 and Fig. 2D, gray curves). Thus, the effective ligand-receptor curve at the time of the peak of X* is obtained by linking the values of the ligand-receptor complex at the time of the peak of X* (Ctmax). This curve across times (green line in Fig. 2C) has a larger input dynamic range than that of C at any given time. It is for this reason that the overall system with PRESS has an expanded dynamic range (SI Appendix, section 3).
To test whether the observed expansion and displacement of the input dynamic range required PRESS (i.e., to test if ligand binding needed to be slower than downstream signaling), we increased the binding reaction rates. This change largely eliminated the expansion of the input dynamic range and the shift of the EC50 (Fig. 2B, compare red and blue curves). We also tested the requirement of PRESS by making the downstream response less transient. We decreased the X* inactivation rate, making the transient X* response peak later, and we obtained a smaller shift of the output EC50 (SI Appendix, Fig. S1A).
A number of general signaling architectures can generate transient responses, and thus would be expected to bring about PRESS when coupled to a relatively slow binding receptor (SI Appendix, section 2). In SI Appendix, Fig. S1 B and C, we tested two additional architectures, systems with incoherent feed-forward or negative feedback control. In models based on these architectures, for the rates used, PRESS resulted in a large (up to two orders) displacement in the output EC50, which was lost when we increased the ligand binding rates. Thus, we conclude that pre-equilibrium signaling can operate in at least the three signaling architectures we presented as toy models (Fig. 2 and SI Appendix, Fig. S1). These signaling topologies are found throughout prokaryotes and eukaryotes (41–43).
We wondered if the transient response from signaling systems that operated in PRESS mode might amplify upstream noise due, for example, to stochastic differences in the occupation of the receptor by ligand. A large effect of noise on the transient response might reduce the precision by which systems using PRESS can distinguish between different input concentrations. To determine the effect of upstream noise on signaling in PRESS mode, we ran stochastic simulations of the toy model in Fig. 2A, using different number of receptors (SI Appendix, Fig. S2), and then compared the coefficient of variation (CV; the SD divided by the mean) of peak X* and of receptor occupancy at the time of that peak. Surprisingly, even in the case of a very small number of receptors (30 per cell), which introduced a significant noise at the level of the occupied receptor, peak X* had a smaller CV than receptor occupancy (SI Appendix, Fig. S2G). This result suggested that in the context of PRESS, a transient response downstream of the receptor does not amplify noise, and therefore the benefits of enlarged and shifted input dynamic range are not lost or otherwise masked (SI Appendix, section 4).
PRESS Can Operate During Yeast Polarization in a Chemical Gradient.
We began this investigation with a system that causes yeast polarization toward a mating pheromone source, whose architecture suggested that it could function in PRESS mode. We tested this idea by modeling using experimentally based parameters. To do so, we modeled yeast cells as impermeable spheres exposed to a steady-state αF gradient generated by a point source (Fig. 3A and SI Appendix, section 5.1). We considered two cells located in gradients of different strengths at the same distance from the source, where cell 1 received an average input of αF ∼10 Kd and cell 2 received an average input of αF ∼1 Kd (Fig. 3 A and B). Cells receive more αF on the side proximal to the source (front) than on the distal side (back). The difference in αF between the front and back is the information cells have in order to determine gradient direction (8). Cells convert this information into a difference in occupied receptor via the binding reaction. The maximum difference in each cell occurs between points f and b, located at opposite sides of each cell. We call this difference, normalized to total receptor, Delta. In principle, larger values of Delta should improve the ability of the downstream machinery to detect the gradient. At equilibrium, cell 2 was in a location (∼1 Kd) with a Delta of ∼0.23. Cell 1 was closer to the saturating region of the binding dose–response curve (∼10 Kd); therefore, Delta was smaller, about 0.07. If gradient orientation were dependent on the value of Delta at equilibrium only, cell 1 would have just about no information to differentiate front from back (SI Appendix, Fig. S3A and section 5). However, analysis of the αF binding dynamics revealed an altogether different situation. Cell 1 reached 90% of the value of equilibrium binding in about 3.5 min, whereas cell 2 reached it in about 19 min (Fig. 3C). Notably, in both cells, Delta overshot: It peaked (Deltamax) and then declined to the equilibrium value (Deltaeq) (Fig. 3D). For cell 1, Deltamax occurred at about 1.7 min and was around 4.3-fold higher than Deltaeq. Cell 2 had a similar but much smaller overshoot (Deltamax occurred at about 17 min and was only 1.1-fold greater than Deltaeq).
Fig. 3.

Mathematical framework to study the detection of a stationary spatial gradient. (A, Left) Cell modeled as an impermeable sphere. a, radius; b, back (θ = π); d, distance to the point source of the ligand (αF); f, front (θ = 0); θ, angle away from the line connecting the center of the sphere to the point source. (A, Right) αF profile as a function of θ for two cells located at the same d from a strong (cell 1, black) or weak (cell 2, red) source, modeled with the following parameters: q/(4πDd) = 10 Kd and 1 Kd, respectively, and a/d = 0.3 (for details and definitions for q and D, see SI Appendix, section 5.1). The maximum and minimum concentrations of αF on the cell surface are 16.7 Kd and 6.6 Kd for cell 1, and 1.7 Kd and 0.7 Kd for cell 2. (B) Normalized equilibrium bound receptor (C) vs. αF concentration, in units of Kd, for cell 1 (○; f1, b1) and cell 2 (□; f2, b2). Dotted lines indicate the difference in normalized bound receptor between the front and back for both cells (Deltaeq-1 and Deltaeq-2) at equilibrium binding. (C) Normalized bound receptor vs. time at the front (solid lines) and back (dashed lines) for cell 1 (black, 10 Kd) and cell 2 (red, 1 Kd). Maximum Delta (Deltamax) is indicated by dotted lines. (D) Delta vs. time for cell 1 (black) and cell 2 (red). The amplitude and duration of the overshoot for cell 1 are indicated with dotted lines. (E) Time derivative (the rate of receptor occupation) vs. time of the data presented in C, for cell 1 (black) and cell 2 (red) at the front (solid line) and back (dashed line). Close to t = 0, the rate is directly proportional to the αF concentration (kon * αF, ○). Deltamax (the peak of the overshoot) occurs at tmax (x), when the curves corresponding to the rates at the front and back cross (become equal). (Inset) Zoomed-in view of the same plot showing tmax for cell 2. (F) Fast polarization of the αF pathway machinery in living yeast. We stimulated yeast expressing the MAPK scaffold protein Ste5 fused to YFPx3 with 1 μM αF (isotropic stimulation) at time 0 and then followed cells by time-lapse confocal fluorescence microscopy at the time points indicated. Images show polarization (formation of an Ste5 patch) in one cell, which is evident starting at 1 min. Numbers correspond to time after αF addition (Movie S1 and SI Appendix, Fig. S4). (G) Fast relocalization of the polarization site in response to an external cue. We stimulated yeast expressing Bem1 fused to three mNeonGreen fluorescent proteins (mNG) with a 0–50 nM linear gradient (high on the right side), such that cells experience a 1 nM difference in pheromone concentration from “front” to “back” (SI Appendix, Fig. S5). Then, we followed cells by time-lapse confocal fluorescence microscopy at the time points indicated. Images show the location of the Bem1 patch. Light blue and yellow arrows mark the initial and new Bem1 patch, respectively. The white arrow marks the daughter cell bud-neck Bem1 patch. Red bar marks spans the repositioning time. (Scale bars: F and G, 2 μm.)
We noted that the transient behavior of Delta (the difference in receptor occupancy on the front and back sides) is functionally equivalent to the transient behavior of X* in our toy model (Fig. 2A). In the case of gradient sensing, Delta overshot because the time derivative of the occupied receptor at the front was initially larger than at the back (because the concentration at the front was larger than at the back), but it reached zero (steady state) faster at the front than at the back (Fig. 3E). Therefore, cells have greater sensitivity for differences between the front and back during a time window (Fig. 3D) before binding equilibrium, and PRESS operating during this time window provides an opportunity for the cell to extract more information from the gradient than after equilibrium is reached. The slower the binding dynamics of the receptor, the longer is the time window for accurate gradient detection (SI Appendix, Fig. S3C and section 5), potentially providing a selective advantage over evolutionary time for cells carrying mutations that resulted in slower binding αF receptors.
Yeast Can Polarize Fast, Within the Time Window Compatible with PRESS.
The spatial differences in receptor occupation result in differential recruitment of the polarization machinery to the region of higher binding, thus initiating cell polarization at that site. We again considered cell 1 in the model. For cell 1, there are ∼6 min (Fig. 3D) during which it would be possible to improve polarization in the direction of an αF gradient using PRESS. We tested experimentally whether the downstream machinery coupled to bound receptor operated quickly enough to polarize during this time. To do so, we performed two experiments. In the first, we measured the timing of polarization in yeast stimulated with 1 μM αF (∼200 Kd). We used such a high level of αF to saturate its receptors within a few seconds, thus allowing us to follow the dynamics of the polarization process itself, independent of the dynamics of receptor binding. We applied αF isotropically. During isotropic stimulation, cells use the same core machinery as they do in gradients but use the internal marks otherwise utilized for budding to choose the site to polarize (44). To assay polarization, we used cells expressing the MAPK scaffold protein Ste5 fused to three YFPs, which localizes to the active G protein βγ dimer (Ste4/Ste18) (14, 45, 46) (Fig. 4A). Although the timing of YFP accumulation to a single pole was somewhat variable (partly due to differences among cells in their position in the cell cycle), cells with polarized Ste5 were visible within 1 min (Fig. 3F, Movie S1, and SI Appendix, Fig. S4). We obtained the same result when following the polarization of a second marker protein Ste20-YFP (SI Appendix, Fig. S4). These experimental results argued that the recruitment of polarization machinery downstream of the αF receptor is sufficiently rapid to use binding information within the time window of the overshoot of Delta, and is thus compatible with PRESS.
Fig. 4.

Slow binding receptors efficiently convey gradient information to a cell polarization model. (A) Schema of the early events in the PRS (αF) related to gradient detection. αF stimulates recruitment and activation of Cdc42 to sites of receptor activation. αF binds to the receptor (Ste2), causing dissociation of the G protein into Gα (Gpa1) and Gβγ (Ste4–Ste18) heterodimers. Gβγ recruits the MAPK scaffold (Ste5) to the membrane, leading to the activation of the MAPK Fus3. Gβγ also recruits Far1. Far1 recruits Cdc24, the activator of the small G protein Cdc42 (55, 56, 83). Cdc42 stimulates its own activation by binding to Bem1. Bem1 binds Cdc24, which further activates Cdc42 (7, 49). αF stimulates this positive feedback loop further via recruited Ste5, which also binds Bem1 (green dotted line) (84). Active Cdc42 directs the assembly of actin filaments in a later phase of the gradient sensing process. Solid arrows correspond to activation, dotted arrows correspond to molecule movement (e.g., membrane recruitment), dotted lines correspond to protein–protein interactions, and the double arrow indicates dissociation. (B) Schema of the Altschuler model for spontaneous emergence of cell polarity (54). It has four reactions: binding/unbinding of Cdc42 to/from the plasma membrane, recruitment of cytoplasmic Cdc42 to sites where Cdc42 has already been recruited (positive feedback), and lateral diffusion of Cdc42 through the membrane. The associated parameters spontaneous association rate (kon), random dissociation rate (koff), recruitment rate (kfb), lateral diffusion (D), and the total number of signaling molecules (N) were estimated by Altschuler et al. (54) from experimental data. (C, Left) Input to the gradient sensing model: Steady-state αF spatial profile, as in Fig. 3A, corresponds to a cell located at a point in a gradient with an average αF concentration of 10 Kd. (C, Center) Sensing [C(θ,t)], representing normalized bound receptor. Plots correspond using a color scale on the right, at different angles θ (as in Fig. 3A) vs. time, for slow [WT (wt), Left] or fast binding (fast, Right) receptors. For slow dynamics, we used published binding rates of αF to Ste2, k+ = 1.9 × 10⁵ M−1⋅s−1 and k− = 0.001 s−1 (15). For fast dynamics, we used k+ and k− that are 100-fold greater, maintaining the same Kd. Thus, the parameters are = 10, a/d = 0.3, and k− = 0.001 (slow) or 0.1 (fast) (SI Appendix, section 5.1). (C, Right) Example of simulation output: Plot corresponds to particle density at the membrane using a color scale, indicated by a bar on the right, at different angles θ (as in Fig. 3A) vs. time. (D, Left) Percentage of polarizations in the front quadrant as a function of binding dynamics (rate k− at constant Kd) for a cell located as in C after 5 min (black ●) or 15 min (red ■) of simulation. Of the tested k− rates, only those rates lower than or equal to 0.001 1/s resulted in polarizations in the front quadrant that were significantly different from random (25%, black line), P < 0.05. Arrows indicate the results shown in the histograms. At the slowest rate tested, there were no polarizations in the first 5 min. (D, Right) Histograms showing the number of stochastic simulations with polarization at the indicated angles , using slow (Left) or fast (Right) ligand-receptor binding dynamics (2,000 simulation runs each). The size of the bins is π/6.5. The polarization state was measured at t = 5 min. Coupling between occupied receptor and this model was done through parameters kon and kfb as follows: and where Aon and Afb are the coupling parameters. Aon = 0.0012, Afb = 23, koff = 9 min−1, D = 1.2 μm2, and N = 103 (SI Appendix, Fig. S6).
In the second experiment, we asked if polarization was also fast when cells do not use their internal cues, such as when they have to use gradient information. To answer this question, we performed measurements in a gradient device (47), which exposed cells to a linear gradient from 0 to 50 nM across a chamber of 200 μm (SI Appendix, Fig. S5). Yeast could determine the gradient vector in these gradients (in the central region of the chamber, 54.8% yeast polarized in the front quadrant vs. 24.3% in the corresponding region of a control nongradient chamber; SI Appendix, Fig. S5D). We monitored early events in polarization by observing the localization of the polarization machinery using cells expressing Bem1 fused to a tandem repeat of three mNeonGreen fluorescent proteins (SI Appendix, section 7) (48). Bem1 is a scaffold protein that activates and clusters Cdc42, leading to the formation of the “polarity patch,” both during the cell cycle and during the mating response (49–51). We looked in cells that had finished budding but in which mother and daughter were still connected, in which the polarization machinery was initially localized to the bud neck. Two things happened to such cells in such gradients. Some cells relocalized their polarization machinery to one of two internal marks, which lie on each pole along the major axis of the cell (52, 53). Other cells relocalized the Bem1 patch to a new site that did not correspond to either mark (SI Appendix, Fig. S5). We scored cells as having relocalized Bem1 to either internal mark or to a new site. This latter group represented yeast that had repositioned their “internal compass.” We found that the average time to relocalize the bud-neck Bem1 patch to these new sites was fast (10.8 ± 8.1 min). The fastest times were less than 5 min, in the time window during which PRESS could benefit the cell. These results support the idea that yeast should be able to take advantage of PRESS when making the gradient direction determination.
Slow Binding Receptors Efficiently Convey Gradient Information to a Cell Polarization Model.
To investigate further if PRESS could guide the yeast polarization machinery to orient in pheromone gradients, we fed the level of bound receptor at every position and at every time point generated by our model to a downstream model of cell polarization (Fig. 4). For this model, we chose the stochastic neutral drift model developed by Altschuler et al. (54) because (i) it models the polarization of the very molecule (Cdc42) that operates during yeast mating (55, 56) (Fig. 4A); (ii) the model is modular, making it easy to couple to our input; and (iii) there are only four parameters (that have been estimated experimentally) describing four reactions: binding/unbinding of Cdc42 to/from the plasma membrane, recruitment of cytoplasmic Cdc42 to sites where Cdc42 has already been recruited (positive feedback), and lateral diffusion of Cdc42 on the membrane. Thus, the simplicity of this model limited the number of decisions we needed to make about how to couple information from the receptor binding model to it. We decided to use linear coupling, the simplest, and arguably the most restrictive, method. For the coupling coefficient, we chose the smallest value that resulted in polarizations in 100% of the simulations run with an average αF concentration of 1 Kd (Fig. 4, legend) because this output is what is observed experimentally.
Our model predicted that for the αF gradient detection system, in which PRESS is favored over equilibrium signaling, faster than normal binding dynamics [in which the overshoot has a shorter duration (details are provided in SI Appendix, Fig. S3 and section 5)] should result in fewer polarizations oriented correctly. Our model also predicted that the increased ability to discriminate between the front and back of the cell provided by PRESS should be most pronounced at concentrations of αF close to the receptor saturation region. To test this prediction, we simulated a range of αF binding rates, from slower to faster than the published rates (15), spanning time windows for PRESS from ∼90 min to ∼6 s. In Fig. 4C, we show the time course of binding for the published rates, in which PRESS can operate, and for 100-fold faster rates, in which PRESS cannot operate. We then ran thousands of stochastic simulations of a cell located in a gradient with an average αF concentration of 10 Kd for each binding rate (Fig. 4D and SI Appendix, Fig. S6). In Fig. 4D, we show the polarization states arising in the first 5 min of simulation (t ≤ 5 min) for the two conditions shown in Fig. 4C. After 5 min, for the WT receptor the advantage gained by PRESS has nearly disappeared (Figs. 3C and 4C). As predicted, simulations that used slow binding kinetics resulted in significantly better-oriented polarizations than those simulations using fast kinetics (Fig. 4D and SI Appendix, Fig. S5A). Specifically, using WT receptor dynamics, 34% of the simulated polarizations localized to the front quadrant of the cell. This value is similar to what has been observed experimentally (11). In contrast, using fast dynamics, only 25.3% of the polarizations localized to the front quadrant (WT vs. fast; P < 10−6), which is the value expected if polarization quadrant choice was random. Rates slower than WT rates further increased the percentage of outputs in the front quadrant (SI Appendix, Fig. S6A). These results indicate that in conditions where cells with fast receptors are unable to use the gradient information, cells with slow receptors can polarize significantly better than expected by chance. These results also suggest that PRESS is helpful for gradient sensing at high concentrations of αF.
Discussion
In some cell signaling systems, including the yeast PRS, ligands bind and unbind receptors relatively slowly. Here, we asked what might be gained from this slowness. We showed by simple mathematical analysis that in cells exposed to a sudden increase in ligand, the EC50 of the dose–response curve for receptor occupation becomes progressively smaller as binding approaches equilibrium over time (Fig. 1 B and C). When receptor binding/unbinding is slow, the EC50 changes correspondingly slowly. We realized that signaling system architectures that coupled the slow shift in the dose–response curve to faster events could enable the cell to react to information about the extracellular environment, which would be obscured after equilibrium was achieved. We called this ability to extract information from the time-evolving dose–response curve PRESS. For many system architectures, PRESS can modulate the input dynamic range, simply by the difference in timing between ligand-receptor binding equilibrium and faster acting events. When it operates, PRESS can shift the input dynamic range to higher doses, and it can also expand the input dynamic range, allowing cells to discriminate between high concentrations of extracellular ligand that would otherwise be indistinguishable. We showed by simulation, and supported by experimentation, that PRESS improves the orientation of yeast cells in response to pheromone gradients.
Downstream Systems That Couple to Slow Receptors to Enable PRESS.
We simulated the operation of PRESS in three toy models (Fig. 2 and SI Appendix, Fig. S1) to illustrate the idea that PRESS works with different downstream signaling architectures that produce a transient response, which are ubiquitous in eukaryotes. The toy model in Fig. 2 was inspired by the operation of fast-inactivating ligand-gated ion channels, common in the nervous system (57). The other two toy models corresponded to incoherent feedforward and negative feedback loops, respectively, which are commonly found in cellular signaling pathways (42, 43). These toy models had in common that their outputs were transient. None of the toy models reflected the transient behavior during gradient sensing that enables PRESS in the mating pheromone pathway. In this last case, the role of the transient downstream signaling is played by the difference in ligand concentration at the front and at the back, which causes a transient difference in receptor occupancy in different parts of the cell, enabling gradient direction detection.
PRESS Expands and Shifts the Input Dynamic Range.
The transient response enables the exploitation of pre-equilibrium information. It does so by bringing about a shift in input dynamic range, an expansion of input dynamic range, or both. The shift occurs because the peak in the transient response in the toy models takes place at a time when the binding dose–response curve has itself a higher EC50 than at binding equilibrium (Fig. 1B). The earlier that these peaks occur, the larger is the shift in the output EC50. The expansion happens when the peak of X* occurs at different times for different stimulus levels: earlier when the stimulus is big and later when it is small. This time shift for the maximum response, convolved with the slow shift in the binding dose–response curve, expands the input dynamic range, as illustrated in Fig. 2C.
Other Ways Systems Modulate Input Dynamic Range.
The enlargement of the dynamic range in PRESS mode comes at a cost: The response becomes subsensitive; therefore, the difference in the output for two different stimuli is smaller than it would have been otherwise (39). Cells use other mechanisms to regulate input dynamic range. For example, during its life cycle, the amoeba Dictyostelium discoideum detects gradients of cAMP in a broad range of cAMP concentrations. Here, binding of cAMP to its receptors is very quick (32), precluding PRESS. Dictyostelium uses a different approach that expands the input dynamic range: It has four homologous cAMP receptors with different Kd values for cAMP (58). This multiple receptor solution has the advantage over PRESS that it does not reduce the system’s sensitivity.
Another way of increasing the input dynamic range beyond receptor saturation is to avoid saturation directly by modulating receptor affinity, as in the case of the Escherichia coli chemotaxis system, where the affinity of receptors for the ligand diminishes as cells adapt to higher concentrations of attractants (59, 60), or by fast turnover of the receptors, such as in the case of the erythropoietin receptor (61). Alternatively, a broad input dynamic range might be achieved if the concentration of a ligand is transformed into the duration of the signal. This transformation may be achieved, for example, by depleting or degrading the ligand at a constant rate, resulting in longer signaling times for higher doses (62, 63). Signal duration may, in turn, be converted back into amplitude by the signaling pathway. In more general terms, it has been shown in theory and by experimentation (64, 65) that negative feedback could help to expand the input dynamic range.
Stimulus Dynamics and PRESS.
In this work, for simplicity (and to match to earlier experiments), we focused our analysis of PRESS on cases where the ligand concentration outside the cell (or the gradient) increases suddenly and stays stable thereafter (i.e., a step increase). However, in many physiological conditions, ligand concentrations (and gradients) might change over time in the time scale of receptor activation. In these cases, the advantage of the PRESS mechanism (namely, the modulation of the input dynamic range) is still present.
PRESS Enables Signaling Systems to Match Different Input Dynamic Ranges to Different Outputs.
Other outputs of the yeast PRS, such as αF-induced gene expression, exhibit DoRA (i.e., match well the equilibrium binding curve of pheromone to the receptor) for several hours of continued stimulation (13, 14). This result suggests that the pheromone response pathway, using a single type of receptor, operates simultaneously in two modes to elicit different outputs: PRESS for gradient sensing and equilibrium signaling for determining the level of steady-state gene expression. We suggest that yeast evolved a system with slow binding dynamics that combines PRESS with equilibrium binding, thus enabling the PRS to cover a broad input dynamic range, from the high concentrations sensed during orientation in gradients to the lower concentrations affecting fate choices and gene expression. We speculate that a similar combination of PRESS with equilibrium signaling operates in other signaling systems with multiple outputs, providing the ability to shift the input dynamic range according to physiological function.
PRESS and Other Mechanisms.
We note that PRESS, which we have described in cells responding to a steady spatial gradient, is not the same as a mechanism(s) that enables sensing slowly changing spatial ligand gradients. During Drosophila melanogaster embryo development, before cellularization, the dividing nuclei decode the concentration of the morphogen Bicoid (start to express the Bicoid target gene Hunchback) before the Bicoid anteroposterior gradient reaches steady state. This process in known as “pre–steady-state decoding” (66, 67).
PRESS mode may combine with other mechanisms postulated to improve gradient sensing. Previous modeling studies suggested that the secreted protease Bar1 might improve mating pheromone gradient sensing. This protease degrades pheromone (68), and by doing so, it changes the shape of the gradient, potentially facilitating discrimination between similar partners (69, 70). However, gradient detection is not significantly affected in strains deleted for bar1 (11). In any case, PRESS provides an independent mechanism by which cells might sense gradients more efficiently. In addition, positive feedback loops (6, 7), together with negative feedbacks (71, 72), have been shown to help yeast establish a single polarization site. These mechanisms operate downstream of receptor binding, and therefore downstream of PRESS. In fact, we have used a polarization model in our work that incorporates positive feedback (Fig. 4), and we have shown that it interacts appropriately with PRESS. Thus, PRESS does not rule out other mechanisms that have been proposed.
PRESS Mechanism Might Be Widespread.
Systems with PRESS may be widespread, given that many cell signaling systems have slow binding receptors (73) (Table 1) and that there are several downstream network topologies that can result in transient signal responses (74). A number of candidates are in the central nervous system, where fast-inactivating, ligand-gated ion channels are commonplace (41), enabling the pairing of neurotransmitter binding to fast and transient responses. PRESS may also operate in signaling systems at points other than ligand-receptor binding. The key necessary requirement is, as explained above, that the dose–response at a given step shifts over time. For example, cycles of activation and inactivation of substrates by phosphorylation and dephosphorylation are ubiquitous in signaling systems (75). Such cycles are similar to binding/unbinding reactions in the sense that the time to reach state–state concentrations of phosphorylated substrate after a step increase in the input (in this case, the kinase) depends on the size of the increase. If the slowly increasing concentration of activated substrate, in turn, activates a faster transient response, the overall system is capable of PRESS.
Materials and Methods
Mathematical Models.
The toy model (Fig. 2) and the ligand-receptor model formulation and analysis for the case of an αF gradient (Figs. 3 and 4) are given in SI Appendix, sections 2 and 5.
Numerical Simulations.
Stochastic simulations (Fig. 4) were performed using the routines kindly provided by S. Altschuler (University of California, San Francisco) and modified by us to receive the ligand-receptor information, as described. Simulations were done using custom MATLAB (MathWorks) software. The number of simulations needed for the histograms was determined by increasing the sample size until obtaining no changes in the overall output. Polarization in simulations was determined following the same criteria as Altschuler et al. (54); the position of polarizations was computed at the time when polarization first appeared, and histograms contain the polarizations that appeared in the first 5 min.
Experimental Procedures.
S. cerevisiae strains were of the W303a genetic background, derived from ACL379 (12) (MATa, ∆bar1) by standard nucleic acid and yeast manipulation procedures (76). More information on strains used and their construction is provided in SI Appendix, section 6.1.
Binding Dose–Response Curve Measurement.
Yeast [strain YAB3725, ∆bar1 PSTE2-STE2(T305)-CFP] was grown to exponential phase in synthetic complete medium and briefly sonicated, and cycloheximide was added to a final concentration of 100 μg/mL to block protein translation. The carboxyl-terminal domain of Ste2 was truncated to eliminate receptor endocytosis (38). At time 0, cells were imaged using the CFP filter cube to estimate total Ste2 abundance, immediately followed by the addition of various amounts of a Hilyte488-labeled αF (37). Images were then taken approximately every 15 min for up to 5 h. To calculate αF binding dynamics, images were first analyzed using Cell-ID software (77), which calculates the fluorescence density at the membrane for each cell. Then, a simple binding model (αF + R ↔ C) was globally fitted to the data, resulting in Kd = 23 ± 3 nM and k− = 1.0 ± 0.2 10−4⋅s−1.
Assay of Polarization.
We used S. cerevisiae W303a strains MWY003 and ESY3136 [relevant genotypes: STE5-YFP(3x) and STE20-YFP, respectively], which are derivatives of ACL379 expressing the fusions under the control of their respective native promoters. For image cytometry, we affixed exponentially growing cells to the bottom of wells in a glass-bottomed 96-well plate, as described (12), and stimulated them with 1 μM αF. We performed image acquisition essentially as described (78) and quantified the results as described in SI Appendix, section 6.2.
Chemotropism Assay in Microfluidic Devices.
We fabricated microfluidic devices designed for the generation of stable gradients in open chambers using standard protocols for polydimethylsiloxane (PDMS) microfluidic device construction (47). Briefly, we generated silicon molds by three-layer SU-8 photolithography, which were then used for making PDMS replicas of the device, by excluding PDMS from the tallest features of the mold, thereby producing open (roofless) chambers. After polymerization, we peeled off the patterned PDMS structure and bonded it onto glass cover slides by plasma-oxygen treatment (660 mtorr, 60 W, 60 s).
To improve adherence of cells to the glass, we treated the bottom of the chambers with poly-d-lysine (1 mg/mL; Sigma) at room temperature for at least 3 h and then incubated the chambers with Con A (1 mg/mL; Sigma) overnight at 4 °C. We then filled the device with 0.22 μm of sterile, filtered water using a vacuum-assisted method (79). Subsequently, we connected the two ports of the device with tubing and syringes filled with filtered synthetic complete medium alone or with 50 nM αF and 0.1 mg/mL bromophenol blue (BPB) as tracking dye [DBPB = 4.4 10−6⋅cm2⋅s−1 (3), DαF = 3.2 10−6⋅cm2⋅s−1 (4)]. All media contained 100 ppm PEG3000 (Sigma) to prevent nonspecific αF binding to the container’s surfaces (80). Water hydrostatic pressure (H = 5 cm) drove all flow. We evaluated the formation of the gradients by monitoring BPB fluorescence. Finally, we stopped the flow, washed the chambers with media, and loaded a mildly sonicated yeast exponential culture on top of the device. We allowed cells to settle and bind to the bottom glass before resuming the flow. We performed imaging using an Olympus IX-81 microscope, with an Olympus UplanSapo objective with a magnification of 63× (N.A. = 1.35) coupled with an HQ2 (Roper Scientific) cooled CCD camera.
Quantification of Repositioning Time.
We loaded a yeast strain expressing BEM1-3×–mNeonGreen (48) fusion integrated at the endogenous locus (YGV5097, derived from ACL379) in the microfluidic device. We monitored the Bem1 polarization patch imaging approximately every 3 min. We then quantified polarization times as explained for Ste5, with the additional analysis of the angle of the different polarizations. We considered patches as using “internal marks” (proximal or distal), or “no internal cue” based on the angle between the position of the polarization at the neck and the new site. We measured repositioning time as the interval between the last frame with Bem1 at the bud-neck and the first frame where it appeared as a patch elsewhere.
Statistics.
P values and SEs for the mean were calculated using bootstrap methods (81, 82).
Supplementary Material
Acknowledgments
We thank C. G. Pesce, P. Aguilar, Peter Pryciak, Alberto Kornblihtt, M. González Gaitán, and Andreas Constantinou for helpful discussions and comments on the manuscript; Peter Pryciak (University of Massachusetts) and Eduard Serra (Institute of Predictive and Personalized Medicine of Cancer) for providing yeast strains YPP3662 and ESY3136; S. Altschuler (University of California, San Francisco) for providing the simulation code that was the basis for our simulations; and D. G. Drubin (University of California, Berkeley) for kindly providing the fluorescent αF. Work was supported by Grant PICT2010-2248 from the Argentine Agency of Research and Technology (to A.C.-L.) and Grant 1R01GM097479-01 from the National Institute of General Medical Sciences, National Institutes of Health (to R.B. and A.C.-L.).
Footnotes
The authors declare no conflict of interest.
This article is a PNAS Direct Submission.
This article contains supporting information online at www.pnas.org/lookup/suppl/doi:10.1073/pnas.1322761111/-/DCSupplemental.
References
- 1.Li R, Bowerman B. Symmetry breaking in biology. Cold Spring Harb Perspect Biol. 2010;2(3):a003475. doi: 10.1101/cshperspect.a003475. [DOI] [PMC free article] [PubMed] [Google Scholar]
- 2.Macnab RM, Koshland DE., Jr The gradient-sensing mechanism in bacterial chemotaxis. Proc Natl Acad Sci USA. 1972;69(9):2509–2512. doi: 10.1073/pnas.69.9.2509. [DOI] [PMC free article] [PubMed] [Google Scholar]
- 3.Swaney KF, Huang CH, Devreotes PN. Eukaryotic chemotaxis: A network of signaling pathways controls motility, directional sensing, and polarity. Annu Rev Biophys. 2010;39:265–289. doi: 10.1146/annurev.biophys.093008.131228. [DOI] [PMC free article] [PubMed] [Google Scholar]
- 4.Segall JE. Polarization of yeast cells in spatial gradients of alpha mating factor. Proc Natl Acad Sci USA. 1993;90(18):8332–8336. doi: 10.1073/pnas.90.18.8332. [DOI] [PMC free article] [PubMed] [Google Scholar]
- 5.Zigmond SH. Chemotactic response of neutrophils. Am J Respir Cell Mol Biol. 1989;1(6):451–453. doi: 10.1165/ajrcmb/1.6.451. [DOI] [PubMed] [Google Scholar]
- 6.Arkowitz RA. Chemical gradients and chemotropism in yeast. Cold Spring Harb Perspect Biol. 2009;1(2):a001958. doi: 10.1101/cshperspect.a001958. [DOI] [PMC free article] [PubMed] [Google Scholar]
- 7.Slaughter BD, Smith SE, Li R. Symmetry breaking in the life cycle of the budding yeast. Cold Spring Harb Perspect Biol. 2009;1(3):a003384. doi: 10.1101/cshperspect.a003384. [DOI] [PMC free article] [PubMed] [Google Scholar]
- 8.Jackson CL, Hartwell LH. Courtship in S. cerevisiae: Both cell types choose mating partners by responding to the strongest pheromone signal. Cell. 1990;63(5):1039–1051. doi: 10.1016/0092-8674(90)90507-b. [DOI] [PubMed] [Google Scholar]
- 9.Jenness DD, Burkholder AC, Hartwell LH. Binding of alpha-factor pheromone to yeast a cells: Chemical and genetic evidence for an alpha-factor receptor. Cell. 1983;35(2 Pt 1):521–529. doi: 10.1016/0092-8674(83)90186-1. [DOI] [PubMed] [Google Scholar]
- 10.Ayscough KR, Drubin DG. A role for the yeast actin cytoskeleton in pheromone receptor clustering and signalling. Curr Biol. 1998;8(16):927–930. doi: 10.1016/s0960-9822(07)00374-0. [DOI] [PubMed] [Google Scholar]
- 11.Moore TI, Chou CS, Nie Q, Jeon NL, Yi TM. Robust spatial sensing of mating pheromone gradients by yeast cells. PLoS ONE. 2008;3(12):e3865. doi: 10.1371/journal.pone.0003865. [DOI] [PMC free article] [PubMed] [Google Scholar]
- 12.Colman-Lerner A, et al. Regulated cell-to-cell variation in a cell-fate decision system. Nature. 2005;437(7059):699–706. doi: 10.1038/nature03998. [DOI] [PubMed] [Google Scholar]
- 13.Yi TM, Kitano H, Simon MI. A quantitative characterization of the yeast heterotrimeric G protein cycle. Proc Natl Acad Sci USA. 2003;100(19):10764–10769. doi: 10.1073/pnas.1834247100. [DOI] [PMC free article] [PubMed] [Google Scholar]
- 14.Yu RC, et al. Negative feedback that improves information transmission in yeast signalling. Nature. 2008;456(7223):755–761. doi: 10.1038/nature07513. [DOI] [PMC free article] [PubMed] [Google Scholar]
- 15.Jenness DD, Burkholder AC, Hartwell LH. Binding of alpha-factor pheromone to Saccharomyces cerevisiae a cells: Dissociation constant and number of binding sites. Mol Cell Biol. 1986;6(1):318–320. doi: 10.1128/mcb.6.1.318. [DOI] [PMC free article] [PubMed] [Google Scholar]
- 16.Bajaj A, et al. A fluorescent alpha-factor analogue exhibits multiple steps on binding to its G protein coupled receptor in yeast. Biochemistry. 2004;43(42):13564–13578. doi: 10.1021/bi0494018. [DOI] [PubMed] [Google Scholar]
- 17.Pruzansky JJ, Patterson R. Binding constants of IgE receptors on human blood basophils for IgE. Immunology. 1986;58(2):257–262. [PMC free article] [PubMed] [Google Scholar]
- 18.Mellman IS, Unkeless JC. Purification of a functional mouse Fc receptor through the use of a monoclonal antibody. J Exp Med. 1980;152(4):1048–1069. doi: 10.1084/jem.152.4.1048. [DOI] [PMC free article] [PubMed] [Google Scholar]
- 19.Herkenham M, et al. Cannabinoid receptor localization in brain. Proc Natl Acad Sci USA. 1990;87(5):1932–1936. doi: 10.1073/pnas.87.5.1932. [DOI] [PMC free article] [PubMed] [Google Scholar]
- 20.Wang HM, Smith KA. The interleukin 2 receptor. Functional consequences of its bimolecular structure. J Exp Med. 1987;166(4):1055–1069. doi: 10.1084/jem.166.4.1055. [DOI] [PMC free article] [PubMed] [Google Scholar]
- 21.Hughes RJ, Boyle MR, Brown RD, Taylor P, Insel PA. Characterization of coexisting alpha 1- and beta 2-adrenergic receptors on a cloned muscle cell line, BC3H-1. Mol Pharmacol. 1982;22(2):258–266. [PubMed] [Google Scholar]
- 22.Horwitz EM, Jenkins WT, Hoosein NM, Gurd RS. Kinetic identification of a two-state glucagon receptor system in isolated hepatocytes. Interconversion of homogeneous receptors. J Biol Chem. 1985;260(16):9307–9315. [PubMed] [Google Scholar]
- 23.Marasco WA, Feltner DE, Ward PA. Formyl peptide chemotaxis receptors on the rat neutrophil: Experimental evidence for negative cooperativity. J Cell Biochem. 1985;27(4):359–375. doi: 10.1002/jcb.240270406. [DOI] [PubMed] [Google Scholar]
- 24.Bajzer Z, Myers AC, Vuk-Pavlović S. Binding, internalization, and intracellular processing of proteins interacting with recycling receptors. A kinetic analysis. J Biol Chem. 1989;264(23):13623–13631. [PubMed] [Google Scholar]
- 25.Ciechanover A, Schwartz AL, Dautry-Varsat A, Lodish HF. Kinetics of internalization and recycling of transferrin and the transferrin receptor in a human hepatoma cell line. Effect of lysosomotropic agents. J Biol Chem. 1983;258(16):9681–9689. [PubMed] [Google Scholar]
- 26.Waters CM, Oberg KC, Carpenter G, Overholser KA. Rate constants for binding, dissociation, and internalization of EGF: Effect of receptor occupancy and ligand concentration. Biochemistry. 1990;29(14):3563–3569. doi: 10.1021/bi00466a020. [DOI] [PubMed] [Google Scholar]
- 27.Lipkin EW, Teller DC, de Haën C. Kinetics of insulin binding to rat white fat cells at 15 degrees C. J Biol Chem. 1986;261(4):1702–1711. [PubMed] [Google Scholar]
- 28.Zigmond SH, Sullivan SJ, Lauffenburger DA. Kinetic analysis of chemotactic peptide receptor modulation. J Cell Biol. 1982;92(1):34–43. doi: 10.1083/jcb.92.1.34. [DOI] [PMC free article] [PubMed] [Google Scholar]
- 29.Akiyama SK, Yamada KM. The interaction of plasma fibronectin with fibroblastic cells in suspension. J Biol Chem. 1985;260(7):4492–4500. [PubMed] [Google Scholar]
- 30.Matsui K, Boniface JJ, Steffner P, Reay PA, Davis MM. Kinetics of T-cell receptor binding to peptide/I-Ek complexes: Correlation of the dissociation rate with T-cell responsiveness. Proc Natl Acad Sci USA. 1994;91(26):12862–12866. doi: 10.1073/pnas.91.26.12862. [DOI] [PMC free article] [PubMed] [Google Scholar]
- 31.Sklar LA, Sayre J, McNeil VM, Finney DA. Competitive binding kinetics in ligand-receptor-competitor systems. Rate parameters for unlabeled ligands for the formyl peptide receptor. Mol Pharmacol. 1985;28(4):323–330. [PubMed] [Google Scholar]
- 32.Ueda M, Sako Y, Tanaka T, Devreotes P, Yanagida T. Single-molecule analysis of chemotactic signaling in Dictyostelium cells. Science. 2001;294(5543):864–867. doi: 10.1126/science.1063951. [DOI] [PubMed] [Google Scholar]
- 33.Morton T, Li J, Cook R, Chaiken I. Mutagenesis in the C-terminal region of human interleukin 5 reveals a central patch for receptor alpha chain recognition. Proc Natl Acad Sci USA. 1995;92(24):10879–10883. doi: 10.1073/pnas.92.24.10879. [DOI] [PMC free article] [PubMed] [Google Scholar]
- 34.Clements JD, Lester RA, Tong G, Jahr CE, Westbrook GL. The time course of glutamate in the synaptic cleft. Science. 1992;258(5087):1498–1501. doi: 10.1126/science.1359647. [DOI] [PubMed] [Google Scholar]
- 35.Hoffmann C, et al. A FlAsH-based FRET approach to determine G protein-coupled receptor activation in living cells. Nat Methods. 2005;2(3):171–176. doi: 10.1038/nmeth742. [DOI] [PubMed] [Google Scholar]
- 36.Krampfl K, et al. Control of kinetic properties of GluR2 flop AMPA-type channels: Impact of R/G nuclear editing. Eur J Neurosci. 2002;15(1):51–62. doi: 10.1046/j.0953-816x.2001.01841.x. [DOI] [PubMed] [Google Scholar]
- 37.Toshima JY, et al. Spatial dynamics of receptor-mediated endocytic trafficking in budding yeast revealed by using fluorescent alpha-factor derivatives. Proc Natl Acad Sci USA. 2006;103(15):5793–5798. doi: 10.1073/pnas.0601042103. [DOI] [PMC free article] [PubMed] [Google Scholar]
- 38.Konopka JB, Jenness DD, Hartwell LH. The C-terminus of the S. cerevisiae alpha-pheromone receptor mediates an adaptive response to pheromone. Cell. 1988;54(5):609–620. doi: 10.1016/s0092-8674(88)80005-9. [DOI] [PubMed] [Google Scholar]
- 39.Koshland DE, Jr, Goldbeter A, Stock JB. Amplification and adaptation in regulatory and sensory systems. Science. 1982;217(4556):220–225. doi: 10.1126/science.7089556. [DOI] [PubMed] [Google Scholar]
- 40.Basu S, Mehreja R, Thiberge S, Chen M-TT, Weiss R. Spatiotemporal control of gene expression with pulse-generating networks. Proc Natl Acad Sci USA. 2004;101(17):6355–6360. doi: 10.1073/pnas.0307571101. [DOI] [PMC free article] [PubMed] [Google Scholar]
- 41.Jones MV, Westbrook GL. The impact of receptor desensitization on fast synaptic transmission. Trends Neurosci. 1996;19(3):96–101. doi: 10.1016/s0166-2236(96)80037-3. [DOI] [PubMed] [Google Scholar]
- 42.Tyson JJ, Novák B. Functional motifs in biochemical reaction networks. Annu Rev Phys Chem. 2010;61:219–240. doi: 10.1146/annurev.physchem.012809.103457. [DOI] [PMC free article] [PubMed] [Google Scholar]
- 43.Alon U. An Introduction to Systems Biology: Design Principles of Biological Circuits. London: Chapman & Hall; 2006. [Google Scholar]
- 44.Dorer R, Pryciak PM, Hartwell LH. Saccharomyces cerevisiae cells execute a default pathway to select a mate in the absence of pheromone gradients. J Cell Biol. 1995;131(4):845–861. doi: 10.1083/jcb.131.4.845. [DOI] [PMC free article] [PubMed] [Google Scholar]
- 45.Whiteway MS, et al. Association of the yeast pheromone response G protein beta gamma subunits with the MAP kinase scaffold Ste5p. Science. 1995;269(5230):1572–1575. doi: 10.1126/science.7667635. [DOI] [PubMed] [Google Scholar]
- 46.Pryciak PM, Huntress FA. Membrane recruitment of the kinase cascade scaffold protein Ste5 by the Gbetagamma complex underlies activation of the yeast pheromone response pathway. Genes Dev. 1998;12(17):2684–2697. doi: 10.1101/gad.12.17.2684. [DOI] [PMC free article] [PubMed] [Google Scholar]
- 47.Keenan TM, Hsu C-H, Folch A. Microfluidic “jets” for generating steady-state gradients of soluble molecules on open surfaces. Appl Phys Lett. 2006;89(11):114103-1–114103-3. [Google Scholar]
- 48.Shaner NC, et al. A bright monomeric green fluorescent protein derived from Branchiostoma lanceolatum. Nat Methods. 2013;10(5):407–409. doi: 10.1038/nmeth.2413. [DOI] [PMC free article] [PubMed] [Google Scholar]
- 49.Butty AC, et al. A positive feedback loop stabilizes the guanine-nucleotide exchange factor Cdc24 at sites of polarization. EMBO J. 2002;21(7):1565–1576. doi: 10.1093/emboj/21.7.1565. [DOI] [PMC free article] [PubMed] [Google Scholar]
- 50.Irazoqui JE, Gladfelter AS, Lew DJ. Scaffold-mediated symmetry breaking by Cdc42p. Nat Cell Biol. 2003;5(12):1062–1070. doi: 10.1038/ncb1068. [DOI] [PubMed] [Google Scholar]
- 51.Chenevert J, Corrado K, Bender A, Pringle J, Herskowitz I. A yeast gene (BEM1) necessary for cell polarization whose product contains two SH3 domains. Nature. 1992;356(6364):77–79. doi: 10.1038/356077a0. [DOI] [PubMed] [Google Scholar]
- 52.Casamayor A, Snyder M. Bud-site selection and cell polarity in budding yeast. Curr Opin Microbiol. 2002;5(2):179–186. doi: 10.1016/s1369-5274(02)00300-4. [DOI] [PubMed] [Google Scholar]
- 53.Zahner JE, Harkins HA, Pringle JR. Genetic analysis of the bipolar pattern of bud site selection in the yeast Saccharomyces cerevisiae. Mol Cell Biol. 1996;16(4):1857–1870. doi: 10.1128/mcb.16.4.1857. [DOI] [PMC free article] [PubMed] [Google Scholar]
- 54.Altschuler SJ, Angenent SB, Wang Y, Wu LF. On the spontaneous emergence of cell polarity. Nature. 2008;454(7206):886–889. doi: 10.1038/nature07119. [DOI] [PMC free article] [PubMed] [Google Scholar]
- 55.Nern A, Arkowitz RA. A GTP-exchange factor required for cell orientation. Nature. 1998;391(6663):195–198. doi: 10.1038/34458. [DOI] [PubMed] [Google Scholar]
- 56.Nern A, Arkowitz RA. A Cdc24p-Far1p-Gbetagamma protein complex required for yeast orientation during mating. J Cell Biol. 1999;144(6):1187–1202. doi: 10.1083/jcb.144.6.1187. [DOI] [PMC free article] [PubMed] [Google Scholar]
- 57.Lisman JE, Raghavachari S, Tsien RW. The sequence of events that underlie quantal transmission at central glutamatergic synapses. Nat Rev Neurosci. 2007;8(8):597–609. doi: 10.1038/nrn2191. [DOI] [PubMed] [Google Scholar]
- 58.Kim JY, Borleis JA, Devreotes PN. Switching of chemoattractant receptors programs development and morphogenesis in Dictyostelium: Receptor subtypes activate common responses at different agonist concentrations. Dev Biol. 1998;197(1):117–128. doi: 10.1006/dbio.1998.8882. [DOI] [PubMed] [Google Scholar]
- 59.Sourjik V, Wingreen NS. Responding to chemical gradients: Bacterial chemotaxis. Curr Opin Cell Biol. 2012;24(2):262–268. doi: 10.1016/j.ceb.2011.11.008. [DOI] [PMC free article] [PubMed] [Google Scholar]
- 60.Friedlander T, Brenne N. Adaptive response and enlargement of dynamic range. Math Biosci Eng. 2011;8(2):515–528. doi: 10.3934/mbe.2011.8.515. [DOI] [PubMed] [Google Scholar]
- 61.Becker V, et al. Covering a broad dynamic range: Information processing at the erythropoietin receptor. Science. 2010;328(5984):1404–1408. doi: 10.1126/science.1184913. [DOI] [PubMed] [Google Scholar]
- 62.Behar M, Hao N, Dohlman HG, Elston TC. Dose-to-duration encoding and signaling beyond saturation in intracellular signaling networks. PLOS Comput Biol. 2008;4(10):e1000197. doi: 10.1371/journal.pcbi.1000197. [DOI] [PMC free article] [PubMed] [Google Scholar]
- 63.Edelstein SJ, Stefan MI, Le Novère N. Ligand depletion in vivo modulates the dynamic range and cooperativity of signal transduction. PLoS ONE. 2010;5(1):e8449. doi: 10.1371/journal.pone.0008449. [DOI] [PMC free article] [PubMed] [Google Scholar]
- 64.Nevozhay D, Adams RM, Murphy KF, Josic K, Balázsi G. Negative autoregulation linearizes the dose-response and suppresses the heterogeneity of gene expression. Proc Natl Acad Sci USA. 2009;106(13):5123–5128. doi: 10.1073/pnas.0809901106. [DOI] [PMC free article] [PubMed] [Google Scholar]
- 65.Madar D, Dekel E, Bren A, Alon U. Negative auto-regulation increases the input dynamic-range of the arabinose system of Escherichia coli. BMC Syst Biol. 2011;5:111. doi: 10.1186/1752-0509-5-111. [DOI] [PMC free article] [PubMed] [Google Scholar]
- 66.Bergmann S, et al. Pre-steady-state decoding of the Bicoid morphogen gradient. PLoS Biol. 2007;5(2):e46. doi: 10.1371/journal.pbio.0050046. [DOI] [PMC free article] [PubMed] [Google Scholar]
- 67.Tamari Z, Barkai N. Improved readout precision of the Bicoid morphogen gradient by early decoding. J Biol Phys. 2012;38(2):317–329. doi: 10.1007/s10867-011-9250-8. [DOI] [PMC free article] [PubMed] [Google Scholar]
- 68.MacKay VL, et al. The Saccharomyces cerevisiae BAR1 gene encodes an exported protein with homology to pepsin. Proc Natl Acad Sci USA. 1988;85(1):55–59. doi: 10.1073/pnas.85.1.55. [DOI] [PMC free article] [PubMed] [Google Scholar]
- 69.Andrews SS, Addy NJ, Brent R, Arkin AP. Detailed simulations of cell biology with Smoldyn 2.1. PLOS Comput Biol. 2010;6(3):e1000705. doi: 10.1371/journal.pcbi.1000705. [DOI] [PMC free article] [PubMed] [Google Scholar]
- 70.Rappaport N, Barkai N. Disentangling signaling gradients generated by equivalent sources. J Biol Phys. 2012;38(2):267–278. doi: 10.1007/s10867-011-9240-x. [DOI] [PMC free article] [PubMed] [Google Scholar]
- 71.Kuo C-CC, et al. Inhibitory GEF phosphorylation provides negative feedback in the yeast polarity circuit. Curr Biol. 2014;24(7):753–759. doi: 10.1016/j.cub.2014.02.024. [DOI] [PMC free article] [PubMed] [Google Scholar]
- 72.Wu C-FF, Lew DJ. Beyond symmetry-breaking: Competition and negative feedback in GTPase regulation. Trends Cell Biol. 2013;23(10):476–483. doi: 10.1016/j.tcb.2013.05.003. [DOI] [PMC free article] [PubMed] [Google Scholar]
- 73.Lauffenburger DA, Linderman JJ. Receptors: Models for Binding, Trafficking, and Signaling. New York: Oxford Univ Press; 1993. [Google Scholar]
- 74.Ma W, Trusina A, El-Samad H, Lim WA, Tang C. Defining network topologies that can achieve biochemical adaptation. Cell. 2009;138(4):760–773. doi: 10.1016/j.cell.2009.06.013. [DOI] [PMC free article] [PubMed] [Google Scholar]
- 75.Kholodenko BN, Hancock JF, Kolch W. Signalling ballet in space and time. Nat Rev Mol Cell Biol. 2010;11(6):414–426. doi: 10.1038/nrm2901. [DOI] [PMC free article] [PubMed] [Google Scholar]
- 76.Guthrie C, Fink GR. Methods in Enzymology, Guide to Yeast Genetics and Molecular Biology. San Diego: Academic; 1991. [PubMed] [Google Scholar]
- 77.Gordon , et al. Single-cell quantification of molecules and rates using open-source microscope-based cytometry. Nat Methods. 2007;4(2):175–181. doi: 10.1038/nmeth1008. [DOI] [PubMed] [Google Scholar]
- 78.Bush A, Colman-Lerner A. Quantitative measurement of protein relocalization in live cells. Biophys J. 2013;104(3):727–736. doi: 10.1016/j.bpj.2012.12.030. [DOI] [PMC free article] [PubMed] [Google Scholar]
- 79.Monahan J, Gewirth AA, Nuzzo RG. A method for filling complex polymeric microfluidic devices and arrays. Anal Chem. 2001;73(13):3193–3197. doi: 10.1021/ac001426z. [DOI] [PubMed] [Google Scholar]
- 80.Liu B, et al. Parts-per-million of polyethylene glycol as a non-interfering blocking agent for homogeneous biosensor development. Anal Chem. 2013;85(21):10045–10050. doi: 10.1021/ac4024654. [DOI] [PubMed] [Google Scholar]
- 81.Efron B, Tibshirani R. An Introduction to the Bootstrap. New York: Chapman & Hall; 1994. [Google Scholar]
- 82.Cedersund G, Roll J. Systems biology: Model based evaluation and comparison of potential explanations for given biological data. FEBS J. 2009;276(4):903–922. doi: 10.1111/j.1742-4658.2008.06845.x. [DOI] [PubMed] [Google Scholar]
- 83.Butty AC, Pryciak PM, Huang LS, Herskowitz I, Peter M. The role of Far1p in linking the heterotrimeric G protein to polarity establishment proteins during yeast mating. Science. 1998;282(5393):1511–1516. doi: 10.1126/science.282.5393.1511. [DOI] [PubMed] [Google Scholar]
- 84.Leeuw T, et al. Pheromone response in yeast: Association of Bem1p with proteins of the MAP kinase cascade and actin. Science. 1995;270(5239):1210–1213. doi: 10.1126/science.270.5239.1210. [DOI] [PubMed] [Google Scholar]
Associated Data
This section collects any data citations, data availability statements, or supplementary materials included in this article.