Abstract
Characterisation of the structure and dynamics of large biomolecules and biomolecular complexes by NMR spectroscopy is hampered by increasing overlap and severe broadening of NMR signals. As a consequence, the number of available NMR spectroscopy data is often sparse and new approaches to provide complementary NMR spectroscopy data are needed. Paramagnetic relaxation enhancements (PREs) obtained from inert and soluble paramagnetic probes (solvent PREs) provide detailed quantitative information about the solvent accessibility of NMR-active nuclei. Solvent PREs can be easily measured without modification of the biomolecule; are sensitive to molecular structure and dynamics; and are therefore becoming increasingly powerful for the study of biomolecules, such as proteins, nucleic acids, ligands and their complexes in solution. In this Minireview, we give an overview of the available solvent PRE probes and discuss their applications for structural and dynamic characterisation of biomolecules and biomolecular complexes.
Keywords: magnetic properties, NMR spectroscopy, proteins, solvent effects, structural biology
1. Introduction
With the development of NMR techniques that enabled the spectroscopic characterisation of larger biomolecules, conventional structural approaches that relied mainly on NOE-based distance information reached their limits due to increasing signal overlap and the need for deuteration, which reduced the number of observable 1H–1H NOE cross-peaks. Recent achievements in advanced sample preparation strategies, and the incorporation of alternative restraints, such as residual dipolar couplings,[1] and paramagnetic data[2] have overcome some of these limitations and provide a toolbox that can complement and, in some favourable cases, replace sparse NOE-based distance data. However, these approaches require sample modifications, such as the addition of external alignment media, in the case of residual dipolar couplings (RDCs), or the placement of covalently attached tags, in the case of paramagnetic data. In contrast, paramagnetic relaxation enhancements (PREs) obtained from soluble and freely diffusing agents [solvent PREs (sPREs)], such as ions, organic radicals or metal chelates yield long-range distance information that can be used in structural and dynamic characterisation of biomolecules and biomolecular complexes. Additionally, sPREs can be tuned by variation of probes and/or concentration. Although this technique has been known for several decades, a rapidly growing number of developments and applications have been published in recent years. Herein, we provide an overview of available sPRE probes, their application in structural and dynamic studies of biomolecules and their complexes, and potential future applications in biomolecular science.
Nuclear paramagnetism is mediated by the magnetic moment of unpaired electron spins. This electron gyromagnetic ratio is approximately 660 times larger than the gyromagnetic ratio of protons. Various paramagnetic effects have been exploited for NMR spectroscopy studies, of which the PRE, the pseudo-contact shift (PCS) and the RDC are the most commonly used paramagnetic data.[2] The possibility of obtaining any of the data depends on the magnetic susceptibility tensor (χ) of the paramagnetic centre, reflecting the variation of its magnetic moment with different orientations of the molecule in the magnetic field[2] (i.e. isotropic, no variation; anisotropic, variation) and the nature of the interaction between the paramagnetic agent and the co-solute diamagnetic molecule.[3] In the case of soluble paramagnetic probes, the probe can either form a transient, non-specific, yet rotationally correlated, complex with the diamagnetic molecule (i.e. the biomolecule) or freely diffuse in solution. Depending on which of these interactions applies, either the inner- (rotationally correlated) or outer-sphere (purely diffusive) relaxation model is used to quantitatively describe the sPRE. Whereas the outer-sphere model has to be applied to certain small molecules, sPREs of biomolecules and their complexes are best described by the inner-sphere model.[4]
The PRE is governed by two mechanisms: the pure dipole–dipole Solomon–Bloembergen contribution[5] and the Curie spin contribution.[2, 6] The degree to which the relaxation enhancement is affected by either of these contributions depends on the relative magnitudes of the spin relaxation time of the electron, T1e, the lifetime of the intermolecular complex, τm, and the rotational tumbling of the solute molecule, τR [Eq. (1)].
Tobias Madl is BioSysNet and Emmy Noether group leader at the Technical University and Helmholtz Zentrum München, Germany (2012–present). He received his doctoral degree at the University of Graz, Austria, and was a postdoctoral fellow at the Technical University München (2007–2010) and at Utrecht University, The Netherlands (2010–2011). His major research interests lie in the development of integrated structure determination approaches, combining NMR spectroscopy, SAXS/SANS and modeling, to study the structure and dynamics of large protein complexes involved in signal transduction.

Klaus Zangger received his Ph.D. degree in chemistry in 1996 at the University of Graz, Austria. After post-doctoral work in the lab of Prof. Ian M. Armitage at the University of Minnesota, he returned to the University of Graz in 1999, first to the Institute of Pharmaceutical Chemistry and in 2000 moved to the Institute of Chemistry. He received an Associate Professor position of chemistry in 2003. His scientific interests are in the field of solution NMR spectroscopy of biomolecules and methods’ development. He was awarded an Erwin Schrödinger fellowship from the Austrian Science Foundation twice (in 1997 and 1998) and an APART habilitation fellowship from the Austrian Academy of Sciences in 2000.

Henry Hocking graduated from the University of Melbourne in 2004 with a B.Sc. in biochemistry. In 2008 he completed his Ph.D. studies in chemistry at the University of Edinburgh under the supervision of Prof. P. Barlow. His thesis focused on the NMR solution structure of Factor H; an immune regulator of complement activation. In 2008 he joined Prof. Boelens at the Bijvoet Center for Biomolecular Research in Utrecht working on various European-funded FP6 projects, including NMR structural studies of neurotoxic conopeptides from the cone snail venom. Currently with the Madl research group at the Technical University München, he is studying intrinsically disordered proteins involved in signal transduction.

| (1) |
The Curie relaxation component, also known as χ relaxation, only becomes important if T1e is at least four orders of magnitude shorter than the rotational correlation time, τR.[7] In the case of most ideal solvent paramagnetic probes, the Solomon–Bloembergen contribution predominates, in part, due to a long lifetime of the electronic spin state. In this case, assuming that the Curie spin contribution can be ignored, the PRE is defined as an additional contribution to relaxation [Eq. (2)]:
| (2) |
in which  and
and  are the longitudinal (i=1) and transverse (i=2) relaxation rates for the biomolecule in the diamagnetic and paramagnetic states, respectively.
The overall Γ1 relaxation rate of the nucleus can be written as (inner-sphere relaxation model) shown in Equation (3):[3b]
| (3) |
and the Γ2 relaxation rate of the nucleus can be written as shown in Equation (4):
| (4) |
in which μ0 is the magnetic permeability of a vacuum, γI is the gyromagnetic ratio of the spin of interest, gJ is the Landé factor, μB is the Bohr magneton, J is the total angular momentum of the paramagnetic centre (e.g. J=7/2 for Gd3+), r is the distance between the nucleus and the paramagnetic centre (Figure 1), τ1C is the effective correlation time for longitudinal relaxation, τ2C is the effective correlation time for transverse relaxation, and ωI and ωS are the nuclear and electronic Larmor frequencies, respectively, with the approximation that ωS≫ωI.
Figure 1.
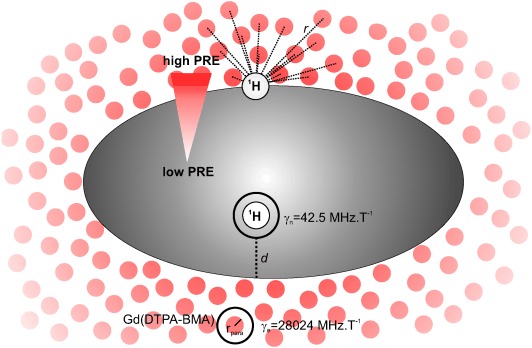
The sPRE effect on a macromolecule. Paramagnetic centres {e.g. gadolinium diethylenetriaminepentaacetic acid–bismethylamide [Gd(DTPA-BMA)]} are shown as red spheres. The red arrow indicates increasing PREs from the interior to the solvent-accessible area of the biomolecule. Key parameters of Equations (3), (4), (7) and (8) are shown.
In cases for which the paramagnetic agent and the co-solute do not interact, a purely diffusive model, also referred to as the outer-sphere model,[8] needs to be considered in which the observed PRE effects are only dependent on the steric accessibility of the observed nuclei and the molar concentration of the paramagnetic agent.[3b]
In this model, Γ1 and Γ2 can be written as shown in Equations (5) and (6):
| (5) |
| (6) |
in which jj(ω) is defined by Equation (7):
 |
(7) |
NA is the Avogadro number, [S] is the molar concentration of electron spins, P is a steric factor that accounts for the accessibility of the nuclear spin, TjS is the electron spin relaxation time, b is the distance of closest approach between the electron and nuclear spin, D is the relative translational diffusion constant, τ=b2/D is the diffusion correlation time, and Re represents the real component of the spectral density function jj(ω). Notably, in some cases, predictions based on the diffusional relaxation model might not correlate well with experimental data due to the approximation that treats molecules as rigid and spherical and neglects electrostatic interactions.[4a]
The dipole–dipole relaxation mechanism between the lone electron and the nucleus, as described in the Solomon–Bloembergen contribution, increases the relaxation rate of the nucleus. Because the resonance linewidth is proportional to the transverse relaxation rate R2, resonances of nuclei in proximity to the paramagnetic centre will broaden. An increase in R1 leads to faster recovery of magnetisation. For a single paramagnetic probe, and assuming the inner-sphere relaxation model, this effect has a r−6 distance dependence [Eq. (8)]. The constant aj accounts for the combination of all terms in either Equation (3) or (4), depending on the type of relaxation [Eq. (8)]:[4b]
| (8) |
For sPREs, under conditions that approximate the inner-sphere model, the sPRE values are determined from the integral over the entire solvent volume. The sPRE can be analytically derived for a few special cases, such as for a planar surface, including, to a good approximation, the surface of a large spherical system, such as a micelle. By using a coordinate transformation to spherical coordinates, the volume integration yields Equation (9):
 |
(9) |
in which θ and φ are the angles in the spherical coordinate system, r is the distance between the nucleus and the paramagnetic centre, d is the sum of the distance of the nucleus from the surface of the sphere and the radius of the sphere, and rpara is the hydrodynamic radius of the paramagnetic compound. Although the sPRE drops off rapidly with increasing distance, much larger distances (>15 Å) can be extracted than those measurable by more conventionally used 1H–1H NOE.[4b] Because the sPRE scales linearly with the concentration of the paramagnetic probe, higher distances can be resolved with higher concentrations of the probe and are, in principle, only bound by the solubility limit of the probe itself.
Back-calculation (or prediction) of sPREs is an essential step in assessing the accuracy of a sPRE-derived model. Pintacuda and Otting predicted R1 values from Equation (2) by using a grid based approach, in which the effective distance, r, between each protein proton and all probe accessible sites within 10 Å of the protein was determined.[4a] This effective distance is derived from the average value of ri−6 in a given NMR conformer, where ri is the distance between a proton and a grid point i (1 Å point spacing). This method can be implemented in a computationally fast way (Hartlmüller, Madl, unpublished data) and is generally applicable to a wide variety of applications, including structure validation, structure calculation and docking of biomolecular complexes. Varrazzo et al. found a weak correlation between the atom depth and its paramagnetic attenuation that was restricted mainly to the innermost atoms of a biomolecule.[9] In the protocol used by Tjandra et al. (see below) the back-calculation of sPRE values (Γ) was obtained from an implicit energy function relating a metric for solvent accessibility of a nucleus to its sPRE value.[10] This metric can be readily derived from each NMR conformer because it directly reflects the level of ‘crowdedness’ of a nucleus from neighbouring heavy atoms [see Eq. (11)]. The great advantage of this approach is that the formulae can be differentiated and used in molecular dynamics based structure calculations (see Section 3. Applications of sPREs).
2. sPRE Probes
To obtain high-quality sPRE data for further structural and dynamic studies of biomolecules and their complexes, sPRE probes have to meet several criteria: 1) chemical inertness over a wide range of pH and buffer conditions, 2) lack of specific interaction with certain functional groups (e.g. charged amino acids of proteins), and 3) high water solubility.
The choice of the size of the probe can influence the granularity of mapping of the solvent accessibility. In the most extreme cases, the probe can be small enough to partially penetrate a lipid membrane environment or the hydrophobic regions of a protein, for example, leading to concentration gradients that can be harnessed to monitor protein or peptide membrane insertion depths. In this section, we present an overview of the various probes used to this effect.
2.1. Oxygen
Oxygen presents distinct advantages as a sPRE probe owing to its small size and ubiquitous nature. However, one needs to bear in mind that significant PREs on 1H and 19F can only be observed at pressures of 20–60 bar.[11] Additionally, analysis can be obscured by the inherent electrostatic bias that predominates the interaction between oxygen and the solute. A range of applications have been published in recent years, such as studies of the solvent exposure of folded and unfolded protein states,[12] surface free energy differences of proteins,[13] and immersion depths of membrane-bound peptides and proteins.[14]
2.2. First-Row Transition-Metal Ions
The use of paramagnetic metal ions in NMR spectroscopy has predominantly been borne out of the study of metalloproteins. First-row transition-metal complexes exhibit linewidth broadening through PRE; the degree of line broadening is dependent on the electron spin correlation time (e.g. Mn2+ long τ1e, strong broadening; Ni2+, short τ1e, weak broadening).[15] However, the contact shift tends to be very large, even predominating over the pseudocontact mechanism, which makes these metal ions useful as shift reagents.[16] The small size of the first-row transition-metal ions allows for their diffusion into lipid membranes. This diffusion, although somewhat limited, establishes a concentration gradient across the water–lipid interface. A corresponding paramagnetic gradient is established, which allows for the probing of peptide and protein membrane insertion. Various metals and metal chelates (Table 1) have been used in different applications to determine the localisation of peptides and proteins in micelles or lipid bilayers,[17] and to enhance the sensitivity of NMR spectroscopy experiments.[17a]
Table 1.
Common paramagnetic probes
| Probe name[a] | Paramagnetic group | Molecular structures[b] | T1e [s] | Reference |
|---|---|---|---|---|
| oxygen | .O2− | ≈10−12 | [11–13, 14b] | |
| manganese chloride | manganese(II) | 10−8–10−9 | [15, 17b,c] | |
| nickel acetylacetonate | nickel(II) |  |
≈10−12 | [17a] |
| nickel 1,7-dicarboxymethyl-1,4,7,10-tetraazacyclododecane (Ni2+-DO2A) | nickel(II) |  |
≈10−12 | [30] |
| di-tert-butylaminoxyl (DTNB) | R2NO. |  |
≈10−7 | [18a] |
| 3-oxyl-2,2,4,4-tetramethyloxazolidine | R2NO. |  |
≈10−7 | [18b] |
| 4-hydroxy-2,2,6,6-tetramethylpiperidin-1-oxyl (TEMPOL) | R2NO. |  |
≈10−7 | [4a, 20, 22, 23, 31] |
| 4-amino-2,2,6,6-tetramethylpiperidin-1-oxyl | R2NO. |  |
≈10−7 | [24, 26a] |
| 4-carboxy 2,2,6,6-tetramethylpiperidin-1-oxyl | R2NO. |  |
≈10−7 | [26a] |
| 3-carboxy 2,2,5,5-tetramethylpyrrolidine-1-oxyl | R2NO. |  |
≈10−7 | [24] |
| 16-doxyl stearic acid (16-DSA) | R2NO. |  |
≈10−7 | [17b,c, 27] |
| 5-doxyl stearic acid (5-DSA) | R2NO. |  |
≈10−7 | [17b,c, 27] |
| gadolinium ethylenediaminetetraacetic acid [Gd(EDTA)−] | gadolinium(III) |  |
≈10−8 | [32] |
| gadolinium diethylenetriaminepentaacetic acid [Gd(DTPA)2−] | gadolinium(III) | 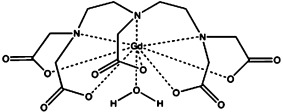 |
≈10−8 | [29, 31] |
| gadolinium tetraazacyclododecanetetraacetic acid [Gd(DOTA)−] | gadolinium(III) | 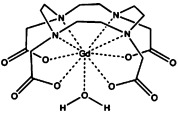 |
≈10−8 | [27, 33] |
| Gd(DTPA-BMA) | gadolinium(III) | 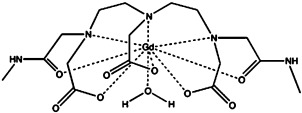 |
≈10−8 | [4a, 34] |
| gadolinium 4,7,10,23,26,29-hexakis(carboxylmethyl)-2,12,21,31-tetraoxo-1,4,7,10,13,-20,23,26,29,32-decaazatricyclo[14,20]-p-xylene [Gd2(L7)] | gadolinium(III) | 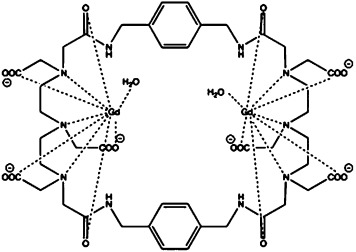 |
≈10−8 | [20g, 35] |
Commonly used abbreviations are given in parentheses.
Molecular structures were generated by using ChemDraw.
2.3. Aminoxyl Radicals
Aminoxyl radicals, generally incorrectly referred to as nitroxide radicals, comprise a class of compounds that have the aminoxyl moiety R2NO. in common[3a] (Table 1). Early studies of paramagnetic relaxation effects on small biomolecules, such as DNA and cyclic peptides, used relatively simple organic aminoxyl radicals as PRE probes, such as DTBN and 3-oxyl-2,2,4,4-tetramethyloxazolidine (Table 1).[18] TEMPO-derived compounds have long been used as a covalent spin label in paramagnetic NMR spectroscopy studies.[19] For use as a sPRE probe, the hydrophobic propensity of TEMPO has been reduced by the addition of polar functional groups to the ring structure. Several of these TEMPO derivatives and their use in sPRE studies are presented in Table 1. The stable aminoxyl radical TEMPOL is a hydroxy derivative of TEMPO sometimes referred to as HyTEMPO. TEMPOL is uncharged but more water soluble than TEMPO; this makes it a better-suited probe for sPRE studies of biomolecules such as proteins,[4a, 20] RNA[21] and enzyme–inhibitor complexes.[22] However, in addition to inducing PREs, TEMPOL has been shown to induce chemical shift changes[4a, 23] at low mM concentrations, indicating transient specific binding consistent with the inner-sphere model described above. A preferential binding for exposed negatively charged amino acids has been observed for 4-amino-TEMPO, whereas 3-carboxy-PROXYL was more prone to bind a solvent-accessible positive patch on the protein.[24] Owing to weak electrostatic interactions with the protein, these charged radicals were thought to be more efficient in penetrating the hydration shell that surrounds the protein compared with more hydrophobic TEMPOL and, as such, a comparison of the sPRE profile induced by each of these agents could provide a powerful means of investigating protein hydration.[25] Despite the failure of these compounds to act as neutral sPRE probes, they are nonetheless thought to be useful as a coarse tool to map local electrostatic fields of proteins by NMR spectroscopy.[26] Aminoxyl radicals attached to lipophilic anchors have also been developed to monitor amphipathic peptides and membrane proteins in lipid micelle environments.[17b,c, 27]
2.4. GdIII Chelates
Gadolinium is a paramagnetic lanthanide and is the only element in the lanthanide series to have a vanishing anisotropic component in its magnetic susceptibility tensor, and thus, does not induce PCS.[2, 3b, 28] Of all lanthanides, it also has the largest radius of influence for PRE. It is thus well suited as a probe for the measurement of PREs. Various stabilising chelating cages have been developed to shield the toxicity of GdIII in magnetic resonance imaging (MRI) applications.[29] The high chemical stability, high molar relaxivity and low hydrophobicity of GdIII chelates has led to their development as safe MRI contrast agents with suitable in vivo diffusion properties.[36] The stronger paramagnetism of GdIII agents, compared with aminoxyl radicals (J=7/2 for Gd3+, J=1/2 for aminoxyls), allows the use of lower concentrations of the former to obtain the same effect. In most cases, the chelated GdIII ion presents a free coordination site that can be occupied by water (Table 1). The charged GdIII chelates commonly used as sPRE probes include Gd(EDTA)−,[32] Gd(DTPA)2−[29, 31] and Gd(DOTA)− (Table 1).[33] Gd(DOTA)− is a cyclic GdIII chelate with greater in vitro stability than that of Gd(DTPA)2− or Gd(EDTA)−.[33] However, all compounds possess strongly ligating carboxylate groups that are likely to increase crowding at the water-binding site to facilitate water exchange.[29] Under such a regime, the free coordination site would be available for protein binding, which could explain the observed preferential binding, for example, of Gd(DTPA)2− to carboxyl and amide groups.[31] Indeed, supporting this view of an inner-sphere model of binding is the fact that the DTPA chelator has been successfully used in the development of shift agents using other lanthanides, for example, Dy(DTPA).[37]
To avoid the intrinsic charge interaction bias found in aminoxyl radicals and charged GdIII chelates, the more neutral Gd(DTPA-BMA) is often preferred. A derivative of Gd(DTPA)2−, Gd(DTPA-BMA) is currently the most commonly used of the GdIII chelates (Table 1). Unlike Gd(DTPA)2− and other charged chelates, Gd(DTPA-BMA) presents no interaction bias towards certain functional groups.[4a] Furthermore, owing to its low hydrophobicity and high stability, Gd(DTPA-BMA) has been adopted as an intravenous MRI contrast agent under the commercial name of Omniscan (GE Healthcare). Compared with TEMPOL, and most likely other aminoxyl radicals, Gd(DTPA-BMA) correlated better with predicted sPRE values based on an inner-sphere interaction model.[4a] In the same study, the authors demonstrated, with a shift-inducing lathanide, Dy(DTPA-BMA), that no shift perturbations, and thus, no intermolecular adducts were formed between the lanthanide chelate and ubiquitin; this is also unlikely in the case of Gd(DTPA-BMA). A similar conclusion regarding the merits of Gd(DTPA-BMA) over TEMPOL in correlating predicted sPRE values to those observed was reached in a study of the surface accessibility of the archaeal protein Sso7d.[34a] To facilitate probe exclusion from intermolecular surfaces in macromolecular complex studies, a larger neutral GdIII chelate, Gd2(L7), with two lanthanide ions for higher relaxivity has been developed (Table 1).[20g, 35] Similar to Gd(DTPA-BMA), Gd2(L7) did not show preferential amino acid interactions when mapping protein surface accessibility.
3. Applications of sPREs
sPREs of biomolecules are typically measured as differences in relaxation rates (R1, R2) or signal intensities in the presence of increasing concentrations of the paramagnetic probe and can be obtained for any type of NMR-active nucleus (e.g. 1H, 13C, 31P; Figure 2).[38] Any type of NMR spectroscopy experiment can be used, as long as an R1 or R2 measurement block is appended to the pulse program (Figure 3). Typically, R1 relaxation measurements are obtained from a saturation-recovery block, whereas R2 measurements are obtained from a CPMG block. In many cases, more than one paramagnetic probe is used to gain a more accurate description of the system studied.[4a, 20g, 24, 31, 34] Although many seminal studies of sPRE were performed by using proton 1D NMR spectroscopy (see above), more commonly 2D NMR spectroscopy has been the method of choice in the detection of sPRE effects. These 2D experiments include CleanTOCSY,[20a] DQF-COSY,[31] inversion recovery 1H–13C HMQC,[22] 1H–13C HSQC,[4, 20c,g] 1H–15N HSQC,[4b, 10, 24, 34, 39] 2D NOESY,[34b] 1H–15N TROSY[27] and 1H–15N CRINEPT-HMQC.[40]
Figure 2.

a) Paramagnetic relaxation as a function of Gd(DTPA-BMA) concentration. The increase of R1 is shown for selected protons of the 42 kDa maltose-binding protein (MBP). Relaxation rates were measured by using a saturation-recovery scheme, preceding an HSQC-based detection block. b) The residues for which R1 enhancements are shown in a) are labelled. All available experimental PREs are mapped onto the structure of MBP (red=low PRE, blue=high PRE).[4b]
Figure 3.
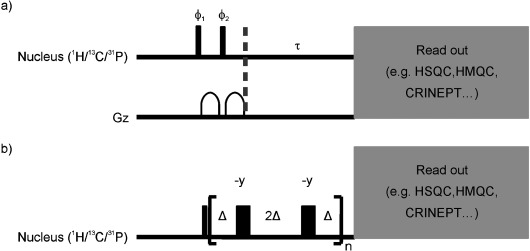
a) Saturation recovery and b) Carr–Purcell–Meiboom–Gill (CPMG) building blocks used for R1 and R2 measurements. All narrow (wide) shaped pulses are applied with flip angles of 90° (180°) along the x axis, unless indicated otherwise. Phase cycling was as follows: ϕ1 8(x), 8(−x); ϕ2 8(y), 8(−y), Δ=455 μs. Any readout building block can be appended after the saturation recovery delay, τ, or the CPMG cascade. All gradients were applied along the z axis.
PREs of transverse relaxation (Γ2) can be further obtained from fitting signal intensities I at different probe concentrations to Equation (10):
| (10) |
in which  is the transverse relaxation rate in a diamagnetic environment, c is the concentration of the paramagnetic agent, and τ is the total time during which nuclear spin magnetisation is transverse (e.g. during the INEPT steps of the pulse sequence). Substituting Γ2 into Equation (4), and through rearrangement, one obtains the distance to the surface when assuming that an analytical solution can be derived (e.g. in case of a planar surface). Although an analytical expression cannot be obtained for a molecule of arbitrary shape, a minimal boundary for the distance to the surface can be obtained.[4b]
3.1. Structure Validation
sPRE can be a useful means of validating structures. In a study of a membrane-embedded antimicrobial peptide using sPRE, Respondek et al. observed a periodical wave-like pattern in the paramagnetic relaxation data that corresponded to the helical region of the peptide and were able to use this to determine the orientation of the peptide in a micelle (see below).[34b] This observation can be generalised to any α-helix that is exposed to two environments that differ in their level of solvent accessibility (e.g. in a micelle or in a soluble protein). An example of this periodicity can be seen for the Qua1 homodimer in the helical region spanning residues 119 to 131 (Figure 4). The accuracy for any given structure can be generally assessed by comparing back-calculated sPRE data to observed sPRE data.
Figure 4.
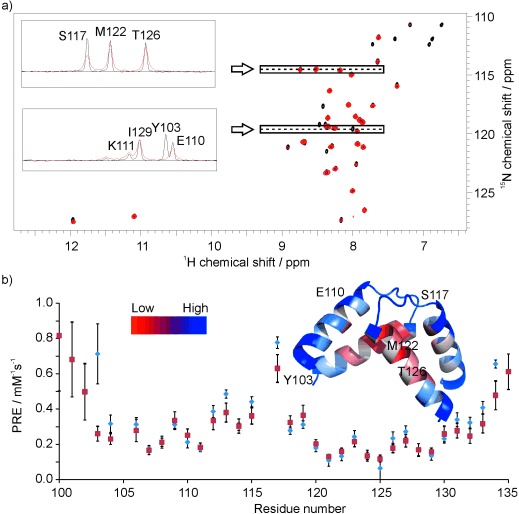
a) 1H–15N HSQC of the Qua1 domain from the Sam68 protein in the presence of 0 (black) and 10 mm Gd(DTPA-BMA) (red), 1D traces of selected resonances are shown in the inset; NMR spectra were recorded at 600 MHz and 298 K, with 2048×200 points, 8 scans and a 15N dimension spectral width set to δ=20 ppm and centred at δ=119 ppm. b) Observed (blue circles) and back-calculated (red squares) PRE values per residue and their mapping on the Qua1 structure (red=low PRE, blue=high PRE). Selected amide resonance traces from a) are mapped on the structure. sPREs were obtained from the 1H R1 values measured by using a saturation-recovery scheme preceding a 1H–15N HSQC-based detection block (recovery times between 0.01 and 4.0 s) at concentrations of 0, 1, 2, 3, 4, 5, 7 and 10 mm of the soluble paramagnetic agent Gd(DTPA-BMA). Back-calculation and data analysis was carried out according to the procedure reported by Madl et al.[4b]
3.2. Spectral Editing by Using sPREs
The directly observable broadening effect of sPRE agents on the signals of solvent-accessible solute protons has led to their convenient use as a tool for spectral editing. This can be beneficial in the study of biomolecular systems for which significant signal overlap can hamper the assignment process, as is often the case in large systems or disordered regions of proteins. Another use for this type of spectral editing can be in monitoring transient biomolecular interactions. Using yeast ubiquitin in the presence of different concentrations of Gd(DTPA-BMA), Kellner et al. demonstrated that 15N-HSQC-type spectra (including 15N-edited NOESY) could be readily simplified to selectively distinguish ordered globular domains from disordered and solvent-accessible tails or linkers; thus facilitating the interpretation of the otherwise crowded region of the spectra that corresponded to the disordered regime of the chemical shift (δ≈8–9 ppm for 1HN).[39b] In the case of Qua1 (see above), residues located at the solvent-exposed termini can be readily distinguished from residues buried in the solvent-protected dimer interface by monitoring differences in their intensity profiles at short recovery times in paramagnetic and diamagnetic environments (Figure 5).
Figure 5.
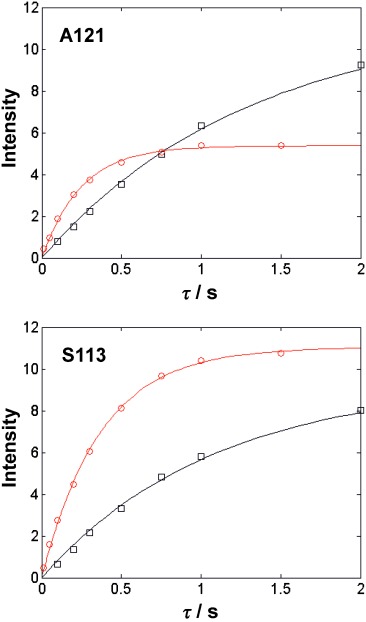
Recovery of equilibrium magnetisation for A121 and S133 amide resonances of Qua1 in 0 (black squares) and 10 mm of Gd(DTPA-BMA) (red circles).
3.3. Enhancement of NMR Signals by Using sPREs
The “enhancement” of NMR signals of large or intrinsically disordered proteins has been investigated by using various sPRE agents.[15, 30, 40b, 41] For biological macromolecules, T1 relaxation times are typically much longer than those of T2. With a choice of suitable paramagnetic agent, T1 can be shortened without having a significant effect on line broadening. However, it is important to note that signal enhancement strongly depends on the surface accessibility of residues, which translates into a great enhancement on the surface, and a low enhancement in the interior of biomolecules. In the presence of Gd3+, the reduced 13C T1 relaxation times of a uniformly deuterated and 15N–13C labelled 44 kDa trimer enabled the use of shorter recycling delays in direct carbon-detected experiments without compromising 13C T2 relaxation times.[41] However, for 1H resonances, the use of Gd3+ complexes can cause significant line broadening owing to the long electronic relaxation time of the agent (nano- to microseconds). This was observed in a study of the 800 kDa GroEL when using Gd(DOTA)− as an additive to assist in selective water suppression.[40b] In the presence of 1 mm Gd(DOTA)−, the water T1 value is reduced tenfold without a significant reduction in the protein signals. However, at larger concentrations of the sPRE agent, significant line broadening from increased transverse relaxation rates of protein resonances, particularly those originating from surface-exposed residues, countered the benefits obtained from water suppression. Notably, sPRE-induced water suppression was not as pronounced in a solvent that comprised uncomplexed Gd3+.
In the presence of paramagnetic agents with short electronic relaxation times (pico- to nanoseconds), such as Ni2+, the proton-detected experiments do not suffer from the line-broadening effect observed with Gd3+ complexes. Cai et al. used the paramagnetic Ni2+ chelate, Ni2+(DO2A), to allow faster recovery of the protein equilibrium magnetisation; thus allowing a shortened interscan delay (0.5 s) for HSQC, HNCA and CBCA(CO)NH experiments with water-flip back pulses.[15] Ni2+(DO2A) also significantly decreased the T1 of water, and thus, provided additional sensitivity gain by eliminating the saturation of labile amide resonances. The authors noted that Mn2+(DO2A) induced a similar degree of proton R1 enhancement at lower concentrations than that of Ni2+(DO2A), but also significantly decreased the proton T2 for most residues. They also noted that using the Ni(EDTA)2− complex resulted in specific interactions of the paramagnetic species with the protein and speculated that the non-neutral chelator EDTA was more likely to form electrostatic interactions with the protein.
Fast 2D NMR spectroscopy experiments, 1H–15N SOFAST-HMQC and carbon-detected (H-flip) 13CO–15N, use selective excitation pulses on the protein signals to enhance the rate of recovery of longitudinal magnetisation.[42] As a result, these methods allow shortened interscan delays, which in turn translate into improved signal intensities per unit of experimental time. In the presence of Ni2+(DO2A), an even faster recovery of equilibrium magnetisation was induced by the sPRE agent on the NMR signals of intrinsically disordered proteins when using these 2D methods.[30] Reported signal enhancements were about 1.9-fold for 1H–15N SOFAST-HMQC[42a] and about 1.7-fold for H-flip 13CO–15N.[42b]
3.4. Structure Determination by Using sPREs
Several methods have been developed to implement the sPRE as a distance restraint in protein structure calculations (Figure 6).[4, 10, 34b] When an inert paramagnetic probe is used, the inner-sphere relaxation (or second-sphere interaction) model is used to relate the distances between the probe and the solute with the PRE.
Figure 6.
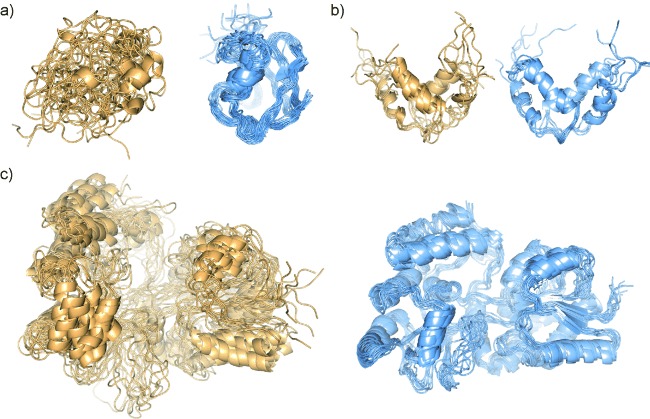
NMR structural ensembles for a) ubiquitin[4b] b) Qua1 homodimer[43] and c) maltose binding protein in a complex with β-cyclodextrin[4b] before (left panels, light orange) and after (right panels, light blue) sPRE refinement.
The most recent approach for structure calculation by using sPRE data uses an empirically determined solvent accessibility potential developed for the use of PRE data in Xplor-NIH.[10] This approach removes the need for an explicit probe in the annealing protocol by replacing it with an implicit energy term that reflects the solvent accessibility (directly related to the “crowding” of neighbouring atoms) for each residue. Residues that are located near or at the protein surface tend to have fewer heavy atoms within a certain distance cutoff (Rc) compared with buried residues. This can be expressed in terms of a simple metric that could stand-in for solvent accessibility [Eq. (11)]:
| (11) |
in which ri is the distance (in Å) between and amide proton and a non-intra-residue heavy atom i. By using well-defined ubiquitin structures and a cutoff distance, Rc, of 20 Å, the calculated solvent accessibility correlates well (R=0.86) with sPRE data, ΓPRE (in s−1 mm−1), yielding an empirical function for the effective surface area [Eq. (12)]:
| (12) |
By using this empirical function, a solvent accessibility potential can be implemented as a new energy term EAcc within the Xplor-NIH structure calculation protocol [Eq. (13)]:
| (13) |
in which the force constant, k, was optimal at 300 kcal Å−1.
Using NMR spectroscopy structures of the homodimer Qua1, the authors further expanded the methodology to protein complexes. The empirical function correlating ΓPRE to effective surface area yielded the linear relationship given by Equation (14) with an R of 0.82:
| (14) |
In both the ubiquitin and Qua1 examples, the accuracy and convergence increased with the inclusion of the potential (Figure 6 b). The authors noted that the use of the new potential helped with convergence from a random coil in the initial stages of the calculation when relatively few restraints were available.
3.5. Localisation of Protein Complex Interfaces
sPRE has also shown promising advances in the determination of macromolecular complex structures. To probe the binding interface between the catalytic domain of human matrixmetalloproteinase 3 (MMP3) and its binding partner tissue inhibitor of metalloproteinases 1 (TIMP-1), Arumugam et al. monitored amide line broadening in the presence of the GdIII chelate Gd(EDTA)−.[32a] Because the binding interface is protected from the sPRE agent when the ligand is bound, residues at the interface were identified by taking the difference of the 1H–15N HSQC spectra in the absence and presence of the ligand TIMP-1. However, they noted that conformational changes upon ligand binding could be located outside the binding recognition site, but still be affected by the broadening reagent, and thus, complicating the analysis. Gd(EDTA)− was similarly used to map the binding site of another matrixmetalloproteinase, MMP12, to a triple helical peptide model of collagen[32b] and of the focal adhesion targeting domain of focal adhesion kinase (FAK) to a paxillin LD peptide.[32c]
More recently, in a study of a 150 kDa ternary nuclear export complex in the presence of Gd(DTPA-BMA), a protocol that incorporated sPRE data into in silico docking procedures by using the program HADDOCK (high ambiguity driven docking) was developed.[40a] In this protocol, a rigid-body assembly of the template structures (with or without experimental data) generated a set of initial solutions. The best subset, based on the HADDOCK score, were then refined with a semi-flexible interface region in explicit solvent and clustered based on root-mean-square deviation (RMSD) criteria. In the second step, the docking clusters were scored according to the agreement between the back-calculated sPRE and the experimentally determined sPRE data. For that, a grid of spherical dummy atoms (probes) of defined radius, for example, 3.5 Å for Gd(DTPA-BMA), was placed uniformly around the initial structure to simulate the paramagnetic environment and the PREscore is calculated with Equation (15):
| (15) |
in which s is a factor that scales the average PREscore to the average energy/score of the docking models, Nres is the number of restaints, Ngrid is the number of grid points, and dij,min−dij,grid is the difference between the minimal (observed) and calculated distance between the nucleus and the dummy atoms. These scores are then added to the docking energy score. The more violations above 1 Å for a given nucleus to various points on the grid, the higher the PREscore, but larger violations have less influence on the overall score. Clusters with large RMSD from the reference crystal structure will tend to have more violations, and thus, larger Haddock scores relative to the cluster with lowest RMSD to the crystal structure, and thus, after rescoring with the PREscore much of the docking ambiguity that results from sparse restraint density is removed.
The low convergence, still present after rescoring, is resolved in the third step, during which all restraints (including PRE data) are used to refine the top ten rescored structures directly against the cloud of pseudo atoms by using simulated annealing/molecular dynamics in ARIA/CNS[44] with standard NOE potential and force constants. An iterative approach, similar to a previously used protocol,[4b] repeats the process of rescoring, ensemble selection and introduction of additional pseudo atoms around the biomolecular structure to satisfy restraint violations and before performing the next simulated annealing step.[4b, 34b] This iterative procedure was carried out until the backbone RMSD to the previous model decreased below 1.0 Å. In the fourth and final step, back-calculated PREs were then obtained for the final structures by r−6-weighted integration of the protein-free volume within the grid and compared to experimentally observed PREs to assess accuracy.
By using this approach, the accuracy and precision of the quaternary arrangement of complexes can be improved and the quality of the ensuing structural models can be validated directly against the sPRE data.
3.6. Dynamics
The characterisation of the conformational dynamics of biomolecules from soluble PRE was first reported over thirty years ago.[45] PRE can report on conformational exchange in biomolecules and biomolecular complexes (e.g. domain reorientation, alternative binding modes, transient encounter complexes). A recent review by Clore discussed, in detail, detection by PRE of these short-lived sparsely populated species when using covalent paramagnetic spin labels.[46] The same principles can be applied when using sPREs, and the information content of paramagnetic relaxation profiles, whether obtained from sPRE or PRE, captures, in both cases, the population weighted average between the conformational species present in solution. In a ligand-binding study of the Tudor domain of human survival motor neuron (SMN), a dynamic process that had not been detected in an available crystal structure was uncovered by using sPRE data (Tripsianes and Madl, unpublished data).[47] This dynamic process involves the rotation of a dimethylarginine side chain of the ligand in a complex with the Tudor domain. Conformational averaging seen in the NOE data between the arginine methyl groups and the recognition site was not immediately apparent because the NOE amalgamated both distance and conformational exchange information. By measuring sPRE, both methyl groups were seen to be buried from the solvent. Back-calculated PREs from the NMR structure are in agreement with this dynamic model, whereas those from X-ray are not (Figure 7).
Figure 7.
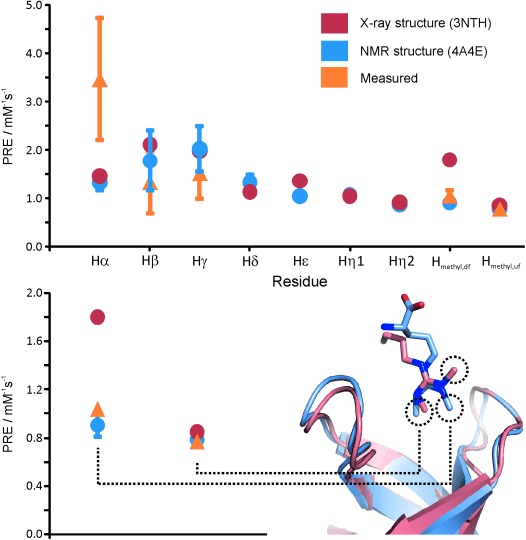
Dynamic dimethylarginine binding of Tudor domains. Comparisons of experimental sPREs with sPREs back-calculated from the structures determined by NMR spectroscopy and X-ray analysis are shown. The localisation of the dimethylarginine methyl groups in the structures determined by NMR spectroscopy and X-ray analysis is highlighted. sPREs were obtained from the 1H R1 values measured by using a saturation-recovery scheme preceding an F2/F1 15N/13C-filtered 2D NOESY spectra recorded on samples containing unlabeled ligand and five molar excess of 15N/13C-labeled SMN Tudor with a mixing time of 100 ms. Recovery times were between 0.01 and 4.0 s at concentrations of 0, 0.5, 1, 2, 3 and 5 mm of the soluble paramagnetic agent Gd(DTPA-BMA). Back-calculation and data analysis was carried out according to a procedure reported by Madl et al.[4b]
3.7. Structure Determination of Proteins/Peptides in Micelles
PREs are an invaluable tool in solution NMR spectroscopy for the monitoring of the insertion of proteins and peptides in micelle environments[48] and, although beyond the scope of this review, solid-state NMR spectroscopy has extended the possibilities of using PRE in bilayer systems. Large sPRE probes monitor the solvent-exposed part of the membrane proteins[27] or amphipathic peptides,[17b,c, 32a, 34b] whereas oxygen[14b, 17a] and paramagnetic labels attached to lipid anchors[17b,c, 27] can probe the depth of insertion. Localisation (orientation/immersion depth) is essential for the understanding of the mode of action of membrane proteins. Because very often only sparse data is available for membrane-bound peptides and proteins, sPREs promise to provide a class of valuable complementary data.
Owing to the size limit of solution NMR spectroscopy, the number of suitable membrane-mimetic systems is restricted. Membrane-mimetic environments typically used for solution NMR spectroscopy studies are mainly small micelles, although bicelles and small unilamellar vesicles have also been used.[49] Most commonly, sodium dodecylsulfate (SDS), dodecylphosphocholine (DPC) or dimyristoylphosphatodylcholine (DMPC) have been employed as lipids/detergents because they are commercially available in deuterated form. Whereas the negatively charged detergent SDS is often not used for larger peptides and membrane-bound proteins[50] due to its potential to destroy the secondary structure, zwitterionic DPC and DMPC more closely resemble naturally occurring lipids and typically show no influence on the structure and catalytic activity of embedded proteins.
Information about localisation within the membrane can, for example, be obtained by using paramagnetically tagged lipids.[17b,c, 27] This approach was pioneered by Wüthrich et al. on the 29-residue peptide glucagon.[51] Through the introduction of 5-, 12- or 16-doxylstearate into dodecylphosphocholine micelles, the interior of the micelles is made paramagnetic. When a peptide binds to the micelle, its relaxation rates are enhanced with a r−6 dependency. The PRE on glucagon was evaluated qualitatively by determining the relative line broadening for individual doxyl probes. By using these rough estimates, α-helical glucagon was found to be oriented parallel to the micelle surface with the N- and C-terminal residues pointing outwards.
A more quantitative approach to obtain the orientation and location inside a micelle is the use of the depth-dependent partitioning of oxygen towards hydrophobic environments.[14a, 48, 52] Oxygen is applied at a partial pressure of 20 to 100 atm and produces, due to vastly different oxygen solubility across the micelle, a pronounced paramagnetic gradient inside the micelle. This gradient leads to increased PREs in the interior of the micelle and allows qualitative determination of the orientation of peptides and proteins in membrane mimetics, such as the relative orientation of secondary structure elements with respect to the surface of the micelle.[14a]
Instead of introducing a paramagnetic probe into the micelle, it is also possible to add a paramagnetic compound to the solution surrounding the micelle. In this case, the spins close to the surface of the micelle experience a higher sPRE. The summation for the PRE of a nucleus immersed under the solvent-exposed surface, such as a micelle, yields Equation (16):[34b]
| (16) |
in which d is the distance to the closest point on the surface, l accounts for the solvent layer and radius of the paramagnetic probe, k is a constant combining terms from Equations (3) or (4) with the probe concentration. The PRE is the r−6-integrated volume containing the paramagnetic agent.[34b] For a flat surface, and to a good approximation for large spherical systems, this integrated PRE depends on d−3, for which d is the closest distance to the surface or immersion depth.[34b] Adding Gd(DTPA-BMA) to a solution of a peptide bound to a micelle consequently leads to PREs that depend purely on the distance to the surface of the micelle. For an α-helical peptide bound parallel to the surface of the micelle, this results in a wave with a 3.6 residue periodicity.[34b] The tilt and azimuth angles of the peptide are obtained by least-squares fitting of experimental PREs to this wave-like function (Figure 8).
Figure 8.
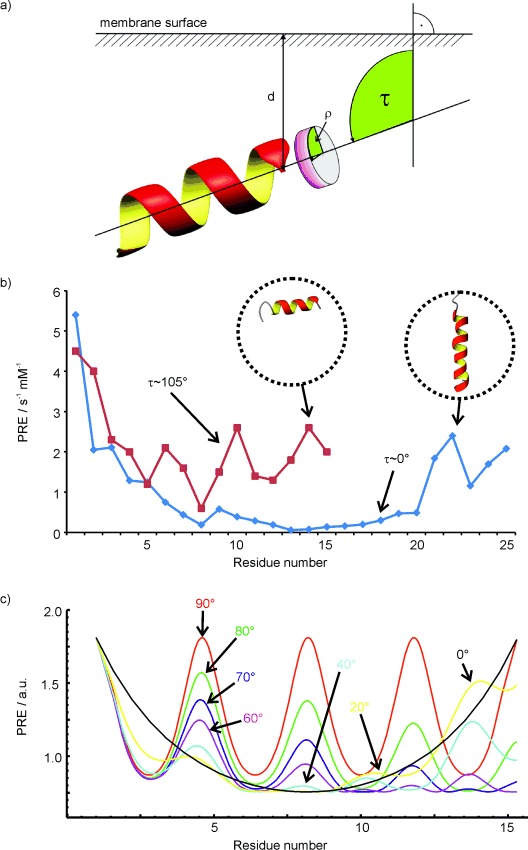
The tilt (τ) and azimuth (ρ) angles that describe the orientation of helical peptides in membrane mimetics can be obtained by measuring sPREs of a peptide along the backbone. The resulting experimental paramagnetic relaxation waves of the 15-residue peptide CM15 and the transmembrane helix TM7 of yeast V-ATPase are shown in the centre in red and blue, respectively. Theoretical paramagnetic relaxation waves for various different tilt angles are shown in the bottom panel. sPREs were obtained from saturation-recovery 2D TOCSY spectra at Gd(DTPA-BMA) concentrations of 0.5 1, 1.5, 2, 3, 4 and 5 mm. The delay between saturation and the start of the TOCSY block varied between 0.1 and 3 s. The obtained 1H R1 relaxation rates were least-squares fitted against the paramagnetic concentration and the slope yielded the PRE.
Originally, divalent metal ions (Mn2+ or Ni2+) were used along with soluble aminoxyl radical labels.[23, 31] One limitation of this approach was that these ions and labels interacted with some amino acids, as previously mentioned, or even the micelles.[53] In particular, the positively charged manganese ions possess high binding affinity to negatively charged areas on the membrane mimetic or protein. These interactions and rough estimates of sPREs through signal intensity changes can only differentiate surface-bound from transmembrane orientations of a peptide.
In contrast, Gd(DTPA-BMA) is inert in aqueous solutions.[4a] NMR and EPR spectroscopy showed no specific binding of Gd(DTPA-BMA) to micelles or peptides.[4a, 54] In addition, the stronger paramagnetism of gadolinium versus aminoxyl allows the use of lower concentrations to achieve the same sPREs. PREs from membrane-embedded paramagnetic tags and soluble paramagnetic agents are often combined to obtain a picture of the orientation with respect to the micelle.[27, 55] Additionally, sPRE information can also be used together with molecular modelling results in defining the orientation of a membrane-bound peptide.[49a] Although only qualitative information of sPREs on membrane-bound peptides has been used in most studies, sPREs obtained from Gd(DTPA-BMA) can be converted into distance restraints to describe the localisation and orientation within the membrane by using Equation (16)[34b, 54, 56] and can be used for structure calculations of the bound peptide.[34b, 56] Given that the structure of the peptide is known, and that a sufficient number of experimental sPREs are available, both the complete orientation and immersion depth of the peptide in the micelle can be calculated.[34b, 54, 56, 57]
4. Summary and Outlook
We have demonstrated the recent developments and applications for using sPREs for structural and dynamic characterisation of biomolecules and biomolecular complexes. One of the most promising aspects of this work may result from the combination of sPREs with sparse structural data from other NMR spectroscopy and complementary methods (e.g. small-angle X-ray/neutron scattering) to characterise the structure and dynamics of large protein complexes. To make sPRE data even more generally applicable for these purposes, they need to be deeply integrated into commonly used structure calculation, de novo structure prediction and docking programs. We have shown that dynamic processes can be detected and characterised, in principle, by using sPREs. In the future we expect that the use of sPREs will be further extended with this respect to provide detailed quantitative insight into dynamic properties and interactions of biomolecules and biomolecular complexes.
Acknowledgments
K.Z. gratefully acknowledges the Doktoratskolleg Molecular Enzymology and the Austrian Science Foundation FWF (project number 20020) for financial support. This work was supported by the Bavarian Ministry of Sciences, Research and the Arts (Bavarian Molecular Biosystems Research Network, to T.M.), the Austrian Academy of Sciences (APART-fellowship, to T.M.), and the German Research Foundation (Emmy Noether program MA 5703/1-1, to T.M.).
References
- 1.Lipsitz RS, Tjandra N. Annu. Rev. Biophys. Biomol. Struct. 2004;33:387–413. doi: 10.1146/annurev.biophys.33.110502.140306. [DOI] [PubMed] [Google Scholar]
- 2.Otting G. Annu. Rev. Biophys. 2010;39:387–405. doi: 10.1146/annurev.biophys.093008.131321. [DOI] [PubMed] [Google Scholar]
- 3a.Bernini A, Venditti V, Spiga O, Niccolai N. Prog. Nucl. Magn. Reson. Spectrosc. 2009;54:278–289. [Google Scholar]
- 3b.Peters JA, Huskens J, Raber DJ. Prog. Nucl. Magn. Reson. Spectrosc. 1996;28:283–350. [Google Scholar]
- 4a.Pintacuda G, Otting G. J. Am. Chem. Soc. 2002;124:372–373. doi: 10.1021/ja016985h. [DOI] [PubMed] [Google Scholar]
- 4b.Madl T, Bermel W, Zangger K. Angew. Chem. 2009;121:8409–8412. doi: 10.1002/anie.200902561. [DOI] [PubMed] [Google Scholar]
- Angew. Chem. Int. Ed. 2009;48:8259–8262. doi: 10.1002/anie.200902561. [DOI] [PubMed] [Google Scholar]
- 5.Solomon I. Phys. Rev. 1955;99:559–565. [Google Scholar]
- 6.Gueron M. J. Magn. Reson. 1975;19:58–66. [Google Scholar]
- 7.Vega AJ, Fiat D. Mol. Phys. 1976;31:347–355. [Google Scholar]
- 8a.Freed JH. J. Chem. Phys. 1978;68:4034–4037. [Google Scholar]
- 8b.Hwang L-P, Freed JH. J. Chem. Phys. 1975;63:118–130. [Google Scholar]
- 9.Varrazzo D, Bernini A, Spiga O, Ciutti A, Chiellini S, Venditti V, Bracci L, Niccolai N. Bioinformatics. 2005;21:2856–2860. doi: 10.1093/bioinformatics/bti444. [DOI] [PubMed] [Google Scholar]
- 10.Wang Y, Schwieters CD, Tjandra N. J. Magn. Reson. 2012;221:76–84. doi: 10.1016/j.jmr.2012.05.020. [DOI] [PMC free article] [PubMed] [Google Scholar]
- 11.Bezsonova I, Forman-Kay J, Prosser RS. Concepts Magn. Reson. Part A. 2008;32A:239–253. [Google Scholar]
- 12.Bezsonova I, Evanics F, Marsh JA, Forman-Kay JD, Prosser RS. J. Am. Chem. Soc. 2007;129:1826–1835. doi: 10.1021/ja065173o. [DOI] [PubMed] [Google Scholar]
- 13.Teng C-L, Hinderliter B, Bryant RG. J. Phys. Chem. A. 2006;110:580–588. doi: 10.1021/jp0526593. [DOI] [PubMed] [Google Scholar]
- 14a.Luchette PA, Prosser RS, Sanders CR. J. Am. Chem. Soc. 2002;124:1778–1781. doi: 10.1021/ja016748e. [DOI] [PubMed] [Google Scholar]
- 14b.Evanics F, Hwang PM, Cheng Y, Kay LE, Prosser RS. J. Am. Chem. Soc. 2006;128:8256–8264. doi: 10.1021/ja0610075. [DOI] [PubMed] [Google Scholar]
- 15.Cai S, Seu C, Kovacs Z, Sherry AD, Chen Y. J. Am. Chem. Soc. 2006;128:13474–13478. doi: 10.1021/ja0634526. [DOI] [PubMed] [Google Scholar]
- 16.Mayo BC. Chem. Soc. Rev. 1973;2:49–74. [Google Scholar]
- 17a.Al-Abdul-Wahid MS, Neale C, Pomès R, Prosser RS. J. Am. Chem. Soc. 2009;131:6452–6459. doi: 10.1021/ja808964e. [DOI] [PubMed] [Google Scholar]
- 17b.Porcelli F, Buck B, Lee D-K, Hallock KJ, Ramamoorthy A, Veglia G. J. Biol. Chem. 2004;279:45815–45823. doi: 10.1074/jbc.M405454200. [DOI] [PMC free article] [PubMed] [Google Scholar]
- 17c.Schievano E, Calisti T, Menegazzo I, Battistutta R, Peggion E, Mammi S, Palù G, Loregian A. Biochemistry. 2004;43:9343–9351. doi: 10.1021/bi0496438. [DOI] [PubMed] [Google Scholar]
- 18a.Morishima I, Inubushi T, Yonezawa T, Kyogoku Y. J. Am. Chem. Soc. 1977;99:4299–4305. doi: 10.1021/ja00455a016. [DOI] [PubMed] [Google Scholar]
- 18b.Kopple KD, Schamper TJ. J. Am. Chem. Soc. 1972;94:3644–3646. doi: 10.1021/ja00765a074. [DOI] [PubMed] [Google Scholar]
- 19.Keizers PHJ, Ubbink M. Protein NMR Spectroscopy: Practical Techniques and Applications. Chichester: Wiley; 2011. pp. 193–219. [Google Scholar]
- 20a.Esposito G, Molinari H, Pegna M, Niccolai N, Zetta L. J. Am. Chem. Soc. Perkin Trans. 2. 1993:1531–1534. [Google Scholar]
- 20b.Niccolai N, Bonci A, Rustici M, Scarselli M, Neri P, Esposito G, Mascagni P, Motta A, Molinari H. J. Am. Chem. Soc. Perkin Trans. 2. 1991:1453–1457. [Google Scholar]
- 20c.Molinari H, Esposito G, Ragona L, Pegna M, Niccolai N, Brunne RM, Lesk AM, Zetta L. Biophys. J. 1997;73:382–396. doi: 10.1016/S0006-3495(97)78078-0. [DOI] [PMC free article] [PubMed] [Google Scholar]
- 20d.Bernini A, Spiga O, Ciutti A, Venditti V, Prischi F, Governatori M, Bracci L, Lelli B, Pileri S, Botta M, Barge A, Laschi F, Niccolai N. Biochim. Biophys. Acta Proteins Proteomics. 2006;1764:856–862. doi: 10.1016/j.bbapap.2006.02.013. [DOI] [PubMed] [Google Scholar]
- 20e.Improta S, Molinari H, Pastore A, Consonni R, Zetta L. Eur. J. Biochem. 1995;227:78–86. doi: 10.1111/j.1432-1033.1995.tb20361.x. [DOI] [PubMed] [Google Scholar]
- 20f.Improta S, Molinari H, Pastore A, Consonni R, Zetta L. Eur. J. Biochem. 1995;227:87–96. doi: 10.1111/j.1432-1033.1995.tb20362.x. [DOI] [PubMed] [Google Scholar]
- 20g.Bernini A, Spiga O, Venditti V, Prischi F, Bracci L, Tong AP-L, Wong W-T, Niccolai N. J. Am. Chem. Soc. 2006;128:9290–9291. doi: 10.1021/ja062109y. [DOI] [PubMed] [Google Scholar]
- 21.Venditti V, Niccolai N, Butcher SE. Nucleic Acids Res. 2008;36:e20. doi: 10.1093/nar/gkm1062. [DOI] [PMC free article] [PubMed] [Google Scholar]
- 22.Fesik SW, Gemmecker G, Olejniczak ET, Petros AM. J. Am. Chem. Soc. 1991;113:7080–7081. [Google Scholar]
- 23.Esposito G, Lesk AM, Molinari H, Motta A, Niccolai N, Pastore A. J. Mol. Biol. 1992;224:659–670. doi: 10.1016/0022-2836(92)90551-t. [DOI] [PubMed] [Google Scholar]
- 24.Deschamps ML, Pilka ES, Potts JR, Campbell ID, Boyd J. J. Biomol. NMR. 2005;31:155–160. doi: 10.1007/s10858-004-7912-6. [DOI] [PubMed] [Google Scholar]
- 25.Niccolai N, Ciutti A, Spiga O, Scarselli M, Bernini A, Bracci L, Di Maro D, Dalvit C, Molinari H, Esposito G, Temussi PA. J. Biol. Chem. 2001;276:42455–42461. doi: 10.1074/jbc.M107387200. [DOI] [PubMed] [Google Scholar]
- 26a.Likhtenshtein GI, Adin I, Novoselsky A, Shames A, Vaisbuch I, Glaser R. Biophys. J. 1999;77:443–453. doi: 10.1016/S0006-3495(99)76902-X. [DOI] [PMC free article] [PubMed] [Google Scholar]
- 26b.Teng C-L, Bryant RG. J. Magn. Reson. 2006;179:199–205. doi: 10.1016/j.jmr.2005.12.001. [DOI] [PubMed] [Google Scholar]
- 27.Hilty C, Wider G, Fernández C, Wüthrich K. ChemBioChem. 2004;5:467–473. doi: 10.1002/cbic.200300815. [DOI] [PubMed] [Google Scholar]
- 28.Bleaney B. J. Magn. Reson. 1972;8:91–100. [Google Scholar]
- 29.Powell DH, Dhubhghaill OMN, Pubanz D, Helm L, Lebedev YS, Schlaepfer W, Merbach AE. J. Am. Chem. Soc. 1996;118:9333–9346. [Google Scholar]
- 30.Theillet F-X, Binolfi A, Liokatis S, Verzini S, Selenko P. J. Biomol. NMR. 2011;51:487–495. doi: 10.1007/s10858-011-9577-2. [DOI] [PubMed] [Google Scholar]
- 31.Petros AM, Mueller L, Kopple KD. Biochemistry. 1990;29:10041–10048. doi: 10.1021/bi00495a005. [DOI] [PubMed] [Google Scholar]
- 32a.Arumugam S, Hemme CL, Yoshida N, Suzuki K, Nagase H, Berjanskii M, Wu B, Van Doren SR. Biochemistry. 1998;37:9650–9657. doi: 10.1021/bi980128h. [DOI] [PubMed] [Google Scholar]
- 32b.Bhaskaran R, Palmier MO, Lauer-Fields JL, Fields GB, Van Doren SR. J. Biol. Chem. 2008;283:21779–21788. doi: 10.1074/jbc.M709966200. [DOI] [PMC free article] [PubMed] [Google Scholar]
- 32c.Gao G, Prutzman KC, King ML, Scheswohl DM, DeRose EF, London RE, Schaller MD, Campbell SL. J. Biol. Chem. 2004;279:8441–8451. doi: 10.1074/jbc.M309808200. [DOI] [PubMed] [Google Scholar]
- 33.Bousquet JC, Saini S, Stark DD, Hahn PF, Nigam M, Wittenberg J, Ferrucci JT. Radiology. 1988;166:693–698. doi: 10.1148/radiology.166.3.3340763. [DOI] [PubMed] [Google Scholar]
- 34a.Bernini A, Venditti V, Spiga O, Ciutti A, Prischi F, Consonni R, Zetta L, Arosio I, Fusi P, Guagliardi A, Niccolai N. Biophys. Chem. 2008;137:71–75. doi: 10.1016/j.bpc.2008.07.003. [DOI] [PubMed] [Google Scholar]
- 34b.Respondek M, Madl T, Göbl C, Golser R, Zangger K. J. Am. Chem. Soc. 2007;129:5228–5234. doi: 10.1021/ja069004f. [DOI] [PubMed] [Google Scholar]
- 35.Bernini A, Spiga O, Venditti V, Prischi F, Botta M, Croce G, Tong AP-L, Wong W-T, Niccolai N. J. Inorg. Biochem. 2012;112:25–31. doi: 10.1016/j.jinorgbio.2012.03.004. [DOI] [PubMed] [Google Scholar]
- 36a.McNamara MT, Higgins CB, Ehman RL, Revel D, Sievers R, Brasch RC. Radiology. 1984;153:157–163. doi: 10.1148/radiology.153.1.6473777. [DOI] [PubMed] [Google Scholar]
- 36b.Eichstaedt HW, Felix R, Danne O, Dougherty FC, Schmutzler H. Cardiovasc. Drugs Ther. 1989;3:779–788. doi: 10.1007/BF01857631. [DOI] [PubMed] [Google Scholar]
- 37.Sattler M, Fesik SW. J. Am. Chem. Soc. 1997;119:7885–7886. [Google Scholar]
- 38.Madl T, Felli IC, Bertini I, Sattler M. J. Am. Chem. Soc. 2010;132:7285–7287. doi: 10.1021/ja1014508. [DOI] [PubMed] [Google Scholar]
- 39a.Liepinsh E, Baryshev M, Sharipo A, Ingelman-Sundberg M, Otting G, Mkrtchian S. Structure. 2001;9:457–471. doi: 10.1016/s0969-2126(01)00607-4. [DOI] [PubMed] [Google Scholar]
- 39b.Kellner R, Mangels C, Schweimer K, Prasch SJ, Weiglmeier PR, Rösch P, Schwarzinger S. J. Am. Chem. Soc. 2009;131:18016–18017. doi: 10.1021/ja905412z. [DOI] [PubMed] [Google Scholar]
- 40a.Madl T, Güttler T, Görlich D, Sattler M. Angew. Chem. 2011;123:4079–4083. doi: 10.1002/anie.201007168. [DOI] [PubMed] [Google Scholar]
- Angew. Chem. Int. Ed. 2011;50:3993–3997. doi: 10.1002/anie.201007168. [DOI] [PubMed] [Google Scholar]
- 40b.Hiller S, Wider G, Etezady-Esfarjani T, Horst R, Wüthrich K. J. Biomol. NMR. 2005;32:61–70. doi: 10.1007/s10858-005-3070-8. [DOI] [PubMed] [Google Scholar]
- 41.Eletsky A, Moreira O, Kovacs H, Pervushin K. J. Biomol. NMR. 2003;26:167–179. doi: 10.1023/a:1023572320699. [DOI] [PubMed] [Google Scholar]
- 42a.Schanda P, Brutscher B. J. Am. Chem. Soc. 2005;127:8014–8015. doi: 10.1021/ja051306e. [DOI] [PubMed] [Google Scholar]
- 42b.Bermel W, Bertini I, Felli IC, Pierattelli R. J. Am. Chem. Soc. 2009;131:15339–15345. doi: 10.1021/ja9058525. [DOI] [PubMed] [Google Scholar]
- 43.Meyer NH, Tripsianes K, Vincendeau M, Madl T, Kateb F, Brack-Werner R, Sattler M. J. Biol. Chem. 2010;285:28893–28901. doi: 10.1074/jbc.M110.126185. [DOI] [PMC free article] [PubMed] [Google Scholar]
- 44.Linge JP, Habeck M, Rieping W, Nilges M. Bioinformatics. 2003;19:315–316. doi: 10.1093/bioinformatics/19.2.315. [DOI] [PubMed] [Google Scholar]
- 45.Niccolai N, Valensin G, Rossi C, Gibbons WA. J. Am. Chem. Soc. 1982;104:1534–1537. [Google Scholar]
- 46.Clore GM. Protein Sci. 2011;20:229–246. doi: 10.1002/pro.576. [DOI] [PMC free article] [PubMed] [Google Scholar]
- 47.Tripsianes K, Madl T, Machyna M, Fessas D, Englbrecht C, Fischer U, Neugebauer KM, Sattler M. Nat. Struct. Mol. Biol. 2011;18:1414–1420. doi: 10.1038/nsmb.2185. [DOI] [PubMed] [Google Scholar]
- 48.Prosser RS, Evanics F, Kitevski JL, Patel S. Biochim. Biophys. Acta Biomembr. 2007;1768:3044–3051. doi: 10.1016/j.bbamem.2007.09.011. [DOI] [PubMed] [Google Scholar]
- 49a.Göbl C, Kosol S, Stockner T, Röckert HM, Zangger K. Biochemistry. 2010;49:6567–6575. doi: 10.1021/bi1005128. [DOI] [PMC free article] [PubMed] [Google Scholar]
- 49b.Kallick DA, Tessmer MR, Watts CR, Li CY. J. Magn. Reson. Ser. B. 1995;109:60–65. doi: 10.1006/jmrb.1995.1146. [DOI] [PubMed] [Google Scholar]
- 49c.Keifer PA, Peterkofsky A, Wang G. Anal. Biochem. 2004;331:33–39. doi: 10.1016/j.ab.2004.03.074. [DOI] [PubMed] [Google Scholar]
- 49d.Traaseth NJ, Verardi R, Torgersen KD, Karim CB, Thomas DD, Veglia G. Proc. Natl. Acad. Sci. USA. 2007;104:14676–14681. doi: 10.1073/pnas.0701016104. [DOI] [PMC free article] [PubMed] [Google Scholar]
- 50a.Langelaan DN, Rainey JK. J. Phys. Chem. B. 2009;113:10465–10471. doi: 10.1021/jp904562q. [DOI] [PMC free article] [PubMed] [Google Scholar]
- 50b.Seddon AM, Curnow P, Booth PJ. Biochim. Biophys. Acta Biomembr. 2004;1666:105–117. doi: 10.1016/j.bbamem.2004.04.011. [DOI] [PubMed] [Google Scholar]
- 51.Brown LR, Bösch C, Wüthrich K. Biochim. Biophys. Acta. 1981;642:296–312. doi: 10.1016/0005-2736(81)90447-8. [DOI] [PubMed] [Google Scholar]
- 52.Prosser RS, Luchette PA, Westerman PW. Proc. Natl. Acad. Sci. USA. 2000;97:9967–9971. doi: 10.1073/pnas.170295297. [DOI] [PMC free article] [PubMed] [Google Scholar]
- 53a.Fazal MA, Roy BC, Sun S, Mallik S, Rodgers KR. J. Am. Chem. Soc. 2001;123:6283–6290. doi: 10.1021/ja003193z. [DOI] [PubMed] [Google Scholar]
- 53b.Niccolai N, Spiga O, Bernini A, Scarselli M, Ciutti A, Fiaschi I, Chiellini S, Molinari H, Temussi PA. J. Mol. Biol. 2003;332:437–447. doi: 10.1016/s0022-2836(03)00852-0. [DOI] [PubMed] [Google Scholar]
- 54.Zangger K, Respondek M, Göbl C, Hohlweg W, Rasmussen K, Grampp G, Madl T. J. Phys. Chem. B. 2009;113:4400–4406. doi: 10.1021/jp808501x. [DOI] [PubMed] [Google Scholar]
- 55.Jarvet J, Danielsson J, Damberg P, Oleszczuk M, Gräslund A. J. Biomol. NMR. 2007;39:63–72. doi: 10.1007/s10858-007-9176-4. [DOI] [PubMed] [Google Scholar]
- 56.Franzmann M, Otzen D, Wimmer R. ChemBioChem. 2009;10:2339–2347. doi: 10.1002/cbic.200900347. [DOI] [PubMed] [Google Scholar]
- 57.Kosol S, Zangger K. J. Struct. Biol. 2010;170:172–179. doi: 10.1016/j.jsb.2009.12.026. [DOI] [PMC free article] [PubMed] [Google Scholar]


