

Abstract
Proton transfer plays an important role in the optical properties of green fluorescent protein (GFP). While much is known about excited-state proton transfer reactions (ESPT) in GFP occurring on ultrafast time scales, comparatively little is understood about the factors governing the rates and pathways of ground-state proton transfer. We have utilized a specific isotopic labeling strategy in combination with one-dimensional 13C nuclear magnetic resonance (NMR) spectroscopy to install and monitor a 13C directly adjacent to the GFP chromophore ionization site. The chemical shift of this probe is highly sensitive to the protonation state of the chromophore, and the resulting spectra reflect the thermodynamics and kinetics of the proton transfer in the NMR line shapes. This information is complemented by time-resolved NMR, fluorescence correlation spectroscopy, and steady-state absorbance and fluorescence measurements to provide a picture of chromophore ionization reactions spanning a wide time domain. Our findings indicate that proton transfer in GFP is described well by a two-site model in which the chromophore is energetically coupled to a secondary site, likely the terminal proton acceptor of ESPT, Glu222. Additionally, experiments on a selection of GFP circular permutants suggest an important role played by the structural dynamics of the seventh β-strand in gating proton transfer from bulk solution to the buried chromophore.
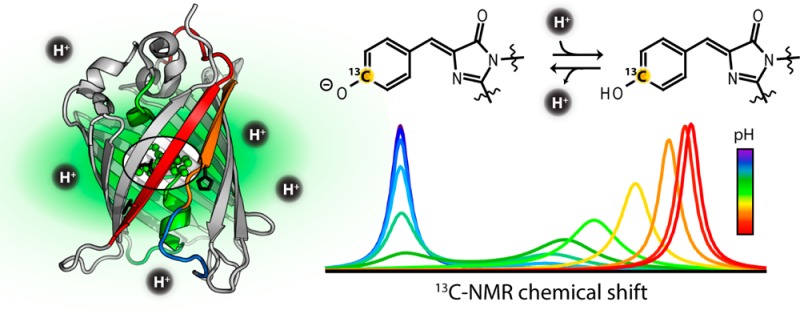
The green fluorescent protein (GFP) and its variants have found broad application in molecular and cellular biology for fluorescence imaging and chemical sensing. This widespread use is owed in large part to the richness and tunability of the photophysics and photochemistry of the autocatalytically formed chromophore.1 Proton transfer is an important player in this respect and is central to the use of fluorescent proteins (FPs) as pH indicators2,3 and as reversibly photoswitchable dyes utilized in super-resolution microscopy.4 A better understanding of the factors influencing the rates and pathways of proton transfer in FPs in both the ground and excited states can aid in rationally developing increasingly robust probes and, more generally, offer insight into proton transfer in biology. In the following, we introduce a 13C NMR probe into the chromophore whose chemical shift is highly sensitive to the protonation state of the chromophore and to the dynamics of ground-state proton transfer.
The GFP chromophore is comprised of a 4-hydroxybenzylidene imidazolinone structure formed from a self-catalyzed cyclization, dehydration, and oxidation of residues Ser65, Tyr66, and Gly67. The chromophore is located within the central α-helix and surrounded by 11 β-strands that form the compact β-barrel fold (Figures 1 and 2A). Many mutations that affect the absorbance and fluorescence spectra, the quantum yield, and the isomerization efficiency via direct and indirect interactions with the chromophore have been identified. The most dramatic examples of these effects involve those mutations that perturb the chromophore ionization state.
Figure 1.
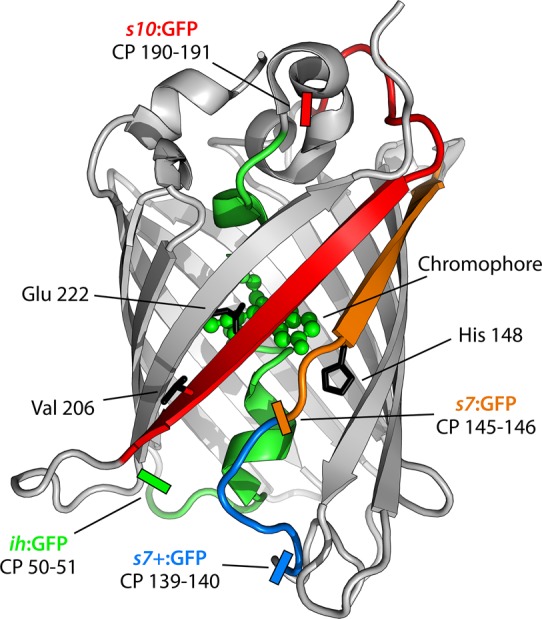
Ribbon structure of Superfolder GFP (Protein Data Bank entry 2B3P(30)). The central helix and β-strands 7 and 10 are colored green, orange, and red, respectively. Important residues are labeled and displayed as black sticks. Circular permutation sites are indicated by colored rectangles and the residue numbers between which the new termini were located. For all circular permutants, the native N- and C-termini are linked by the sequence GGTGGS. Image created with PyMOL (Schrödinger, LLC).
Figure 2.
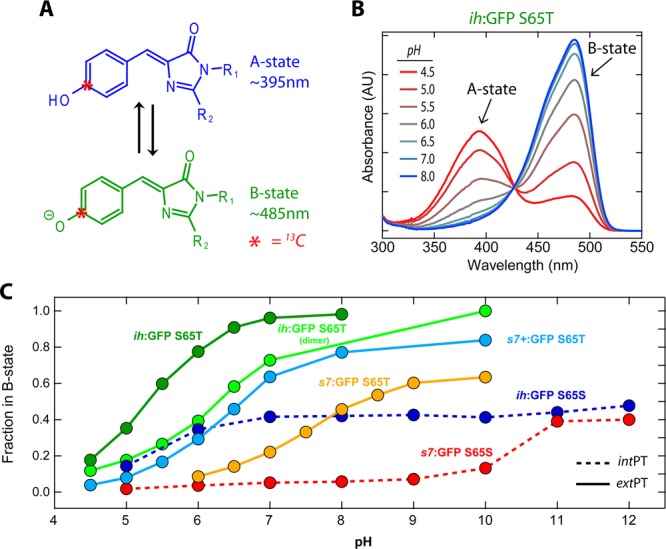
(A) Protonated and deprotonated states of the GFP chromophore result in two visible absorbance bands that can be titrated by pH. The carbon atom that originates from [13Cζ]-l-Tyr66 and has the 13C label is highlighted with a red asterisk. (B) UV–vis absorbance pH titration of ih:GFP S65T showing the electronic absorbance bands for the A and B states. These spectra are representative of all variants presented. (C) Fractions of the population in the B state vs pH for a selection of mutants and circular permutants. The titrations demonstrate behavior characteristic of coupled sites with apparent negative cooperativity and some values not converging to 100% B state in the high-pH limit. ih:GFP S65S and s7:GFP S65S are classified as intPT, while all others are classified as extPT.
The GFP chromophore is known to exist in a protonation–deprotonation equilibrium at the phenoxy position, which manifests itself as two electronic absorbance bands in the visible: a neutral form (A state) at ∼395 nm and an anionic form (B state) at ∼470 nm. Interestingly, the ratio of the A and B states in wild-type GFP (wtGFP) is largely independent of solution pH over a wide range (∼6–12). Upon excitation of the A state, wtGFP exhibits fluorescence emission with an anomalously large apparent Stokes shift. Early work in our lab established the origin of this behavior in an excited-state proton transfer (ESPT),5 and subsequent structural and spectroscopic experiments by others revealed the internal proton transfer network through which this proton is shuttled.6,7 In contrast to wtGFP, most of the commonly used variants (EGFP, YFP, Superfolder, etc.) interrupt this ESPT pathway and the A-state excitations result in neither ESPT nor direct A* emission. Moreover, in these variants, the ratio of the A to B states can be titrated by the solution pH.8 The titration curves resulting from many FP variants, however, do not exhibit simple single-site behavior and can show features such as negative cooperativity and spectra with mixed states in the limits of high or low pH. These nonideal situations have been attributed to electrostatic coupling between the chromophore and additional ionizable sites in its proximity. A two-site thermodynamic model has been shown to give satisfactory agreement across the range of titratable FPs and can even account for the pH insensitivity of the wild-type protein.9,10
The kinetics of proton transfer in FPs has been a subject of extensive study. The PT is important for many FP applications, and the unique chromophore provides a convenient optical handle by which to follow PT within proteins in a more generic sense. Ultrafast pump–probe experiments have elucidated the details of ESPT in wtGFP6 and have provided information about the mechanism of reversible photoswitching in photoactivatable FPs such as Dronpa.11,12 Ground-state proton transfer has also been investigated using techniques of fluorescence correlation spectroscopy (FCS),13−16 pump–dump–probe transient absorption,17 nanosecond pH-jump kinetics,18−20 and stopped-flow fluorescence.3,21 Many of these data have been interpreted through the single-site titration model and have led to a relatively wide range of estimates for the protonation and deprotonation rate constants. For example, the microscopic deprotonation constant for the widely used EGFP variant has been variously reported to have values as low as 45 s–119 and as high as 4500 s–1.13
The chromophore is cradled within a compact β-barrel in which it is physically isolated from the solution as evidenced by the inefficacy of external fluorescence quenchers.22 A recurring theme then, in previous publications, has been to rationalize the communication of the solution pH to the chromophore via gross protein dynamics, specific residue-mediated proton transfers, or some combination of the two.19,20 Strand 7 and, in particular, residue His148 have received attention as a likely “gatekeeper” of PT.20,23 Crystal structures show that His148 is directly hydrogen-bonded to the ionizable phenoxy of the chromophore;8 consistent with this, NMR studies have revealed strand 7 to be particularly dynamic from H/D exchange experiments relative to the other β-strands.24
NMR has long been used as a powerful tool to assess residue-specific pH titrations within complex biomolecules.25−27 In this study, we have focused on direct 13C NMR spectroscopy of the GFP chromophore as a method possessing high resolution, chemical specificity, sensitivity to the chemical exchange time scale, and independence from, but potential correlation with, the optical properties. Recent work in our lab and others has utilized direct carbon detection of tyrosine isotopically labeled at position ζ [adjacent to the hydroxyl group (see the asterisks in Figure 2A)] to study the thermodynamic properties and qualitative kinetics of PT.26,28,29 After the GFP chromophore maturation process, 13Cζ of Tyr66 is located directly adjacent to the ionizable site and provides a convenient and nonperturbative spectator with which to follow PT. We utilize this approach to look at the widely used Superfolder GFP,30 a particularly stable and fast-folding GFP variant, and some select circular permutants (Figure 1) to analyze the interplay between structural rigidity and PT from this new nonoptical observable. Moreover, we combine the information from NMR with absorbance and fluorescence pH titrations and FCS measurements to offer a more complete picture of the underlying mechanism.
Materials and Methods
Protein Expression and Purification
All circular permutant genes were designed by us and then synthetically prepared by Genscript. The genes were inserted into the pET-15b vector along with hexahistidine tags and were cloned into BL21(DE3) Escherichia coli (Invitrogen). The point mutations and insertion mutations were performed with the Stratagene QuikChange mutagenesis kit according to the manufacturer’s protocol.
The proteins were expressed from cells grown in minimal M9 salts medium supplemented with each of the common l-amino acids (Sigma) at 25 mg/L with the exception of tyrosine, which was replaced with [13Cζ]-l-tyrosine (Cambridge Isotopes, 95–99% 13C). The cells were grown at 37 °C until the OD600 reached 0.4–0.6 before being induced with 0.25 g/L isopropyl β-d-1-thiogalactopyranoside. The cells were harvested 4 h after induction and lysed. The supernatant was purified by nickel affinity with Ni-NTA agarose resin (Qiagen) and further with anion exchange chromatography (HiTrap Q HP column, GE Healthcare). The purity of all the proteins was verified via electrospray ionization mass spectrometry.
Absorbance and Fluorescence pH Titrations
The pH titrations were performed using a master buffer consisting of 20 mM phosphate, 30 mM citrate, and 150 mM NaCl, each adjusted to the desired pH with additions of a HCl or NaOH solution. The proteins were exchanged with these buffers and the absorbance spectra collected at approximately 2 μM with a PerkinElmer Lambda 25 UV–vis spectrometer. The fluorescence spectra were collected at protein concentrations of 0.1–0.2 μM in right angle detection mode on a PerkinElmer LS 55 fluorescence spectrometer.
One-Dimensional (1D) 13C NMR Measurements
The protein was concentrated to ∼2 mM using 10 kDa molecular mass cutoff spin filters (Amicon), made to 7% D2O for locking, and loaded into a 5 mm Shigemi low-volume NMR tube. 1D 13C NMR spectra were all recorded with 1H decoupling on a Varian Inova 300 MHz spectrometer unless otherwise noted. The T1 relaxation time was measured for the chromophore 13Cζ resonance using standard inversion recovery techniques. The best duty cycle in the 1D spectra was achieved empirically using a 50° pulse and a delay time of 4.0 s. All experiments were performed with the temperature control set to 25 °C. The typical samples for NMR contained 40 mM buffer (HEPES for high-pH samples and MES for lower-pH samples) and 40 mM NaCl. Phosphate and citrate buffers and higher salt concentrations were also used for a limited set of spectra and found to give identical results for a given pH.
Saturation Transfer
The protein ih:GFP S65T at pH 6.70 was irradiated on the A-state basis resonance of 162 ppm (Figure 3C) with a soft pulse for 400 ms. The free induction decay was collected following a subsequent π/2 hard pulse. The same procedure was repeated off-resonance at the same frequency difference between the A- and B-state resonances but to the opposite direction downfield (see section S.6 of the Supporting Information for additional information).
Figure 3.
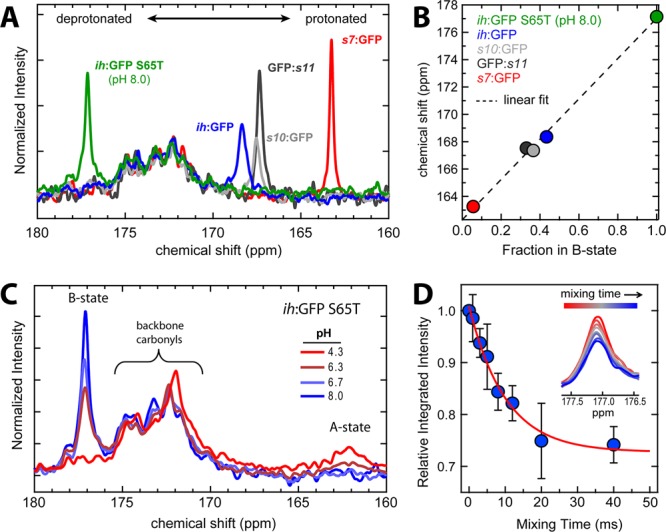
(A) 1D 13C NMR spectra of intPT Superfolder circular permutants with different B-state fractions at pH 8.0. ih:GFP S65T at pH 8.0 is also included as a pure B-state reference. All of these proteins result in a single NMR peak for the chromophore 13Cζ peak, albeit at very different chemical shifts [the other eight labeled Tyr residues clustered around 155 ppm are used for normalization (see section S.4 and Figure S1 of the Supporting Information)]. (B) Chemical shifts of the peaks plotted vs the fraction in the B state deduced from the absorbance spectrum (see Figure 2B and section S.2 of the Supporting Information). The near linearity of the points is indicative of fast exchange between protonated and deprotonated forms. Extrapolation of the fit gives 177.2 ppm as the B-state basis and 162.0 ppm as the A-state basis chemical shift. (C) 1D 13C NMR pH titration of ih:GFP S65T. The peak at 177.2 ppm decreases in intensity with a lower pH accompanied by the emergence of a broad peak near 162 ppm. (D) Integrated intensities of the B-state magnetization from the selective inversion experiment with ih:GFP S65T at pH 6.70 as a function of mixing time with error bars representing one standard deviation from triplicate measurements. The apparent chemical exchange rate constant is 99 s–1 at pH 6.70, which leads to a predicted deprotonation rate constant of 74 s–1. The inset is the B-state peak at increasing mixing times.
Chemical Exchange Rate from NMR Inversion Transfer
For the slow chemical exchange proteins, we employed the selective inversion transfer method of Robinson et al.31 with the pulse sequence [(π/2)x(13C)−τ1–(π/2)x(13C)−τmix–(π/2)x(13C)], where τ1 is the time required for the exchanging states to precess to antiphase (440 μs in these experiments) and τmix is the variable time in which the chemical exchange is allowed to proceed (0–40 ms). This experiment was repeated in triplicate for ih:GFP S65T at pH 6.70.
Fluorescence Correlation Spectroscopy
Protein samples were exchanged into buffers with 20 mM citric acid, 20 mM sodium phosphate, 10 mM glycine, and 150 mM NaCl all adjusted to the appropriate pH by additions of 1 M NaOH. The FCS measurements were taken with protein concentrations in the range of 0.2–5.0 nM and all performed at room temperature. The sample was excited with a 488 nm argon ion laser (Innova 70, Coherent) focused to a near-diffraction-limited spot. The fluorescence was filtered from the excitation beam with a dichroic mirror (z488rdc, Chroma) together with two emission filters (HQ535/70, Chroma) and passed through a 75 μm confocal pinhole and detected with an avalanche photodiode (SPCM-AQR-14 PerkinElmer). The typical irradiance was 10 kW/cm2; however, some trajectories were also recorded with an irradiance of 2.5 kW/cm2 to determine the effect of the light intensity. The dimensions of the fluorescence detection volume were experimentally measured by scanning a piezo stage over a sub-diffraction-limited fluorescent bead (100 nm in diameter) and confirmed by measurements on small dyes (Atto 488) with known diffusion coefficients (D = 400 μm2/s).32 This detection volume was determined to conform closely to a Gaussian profile in all three dimensions with a typical size of r0= 0.4 μm and z0= 1.6 μm. ACFs were calculated by an efficient photon-by-photon algorithm.33
Results
The proteins we investigated can be broadly grouped into two categories according to the residue at position 65. In wtGFP, Ser65 has an important role in stabilizing a hydrogen bond network through which ESPT occurs. When the protein is excited at the A-state band (∼395 nm) or B-state band (∼470 nm), both give rise to fluorescence that peaked at ∼505 nm. Furthermore, the ratio between the A and B states, based on their characteristic absorption bands, is relatively constant over a wide pH range. Superfolder GFP with Ser65 also displays these two features, including ESPT occurring in a matter of picoseconds as measured by ultrafast fluorescence upconversion (data not shown). In contrast, the original Superfolder GFP has Thr65.30 This mutation causes the chromophore to exist primarily in the deprotonated form at neutral pH and leads to seemingly single-site titration behavior with an apparent pKa of ∼5.7 (see Figure 2B,C). The A state that grows in at low pH is nonfluorescent because of efficient nonradiative decay of A*, and it is incapable of ESPT because of the disruption of the proton transfer wire by Thr65. We focus on these two classes of proteins because the Ser65 group exemplifies internal proton transfer (intPT) along a well-characterized proton transfer pathway, while the Thr65 group is in clear chemical communication with the solution via external proton transfer (extPT).
All circular permutants of Superfolder GFP bearing the Ser65 reversion presented herein show the characteristics diagnostic of internal proton transfer. More specifically, all have A:B ratios that are largely independent of pH, and both steady-state and time-resolved fluorescence spectroscopy reveal ESPT with the same kinetics and isotope effect that were observed in wtGFP, strong evidence of functional and structural similarity. Interestingly, the circular permutants that we have made differ in their A:B ratios. This unanticipated fact, discovered in the course of studies of split GFPs,34,35 has provided a convenient way to span the range of protonation states while maintaining internal PT. Throughout the text, the naming convention for the circular permutants is to give the N-terminal structural element (s1–s11 for the strands and ih for the interior helix) followed by a colon and GFP; e.g., s7:GFP is the protein with native termini fused and the seventh β-strand at the new N-terminus (see section S.1 of the Supporting Information for all protein sequences). In the construct s7+:GFP, the plus sign is used to distinguish a circular permutation site that includes a larger portion of strand 7. The locations of all circular permutants used are indicated in Figure 1.
The absorbance spectra as a function of the pH in the S65T extPT circular permutants were consistent with previous measurements of S65T GFPs in that they displayed A:B peak ratio changes and clean isosbestic points,3,8 e.g., ih:GFP S65T in Figure 2B, a clear indication of exactly two optical states. The fraction of the population in the B state at all pH values was calculated using extinction coefficients for the A and B basis states derived from absorbance and fluorescence titrations (as described in section S.2 of the Supporting Information).
The GFP constructs used in these experiments all have nine tyrosines, including Tyr66, which goes on to form the hydroxybenzyl portion of the chromophore (Figure 2A). The 1D 13C NMR spectra of the all of the proteins showed a cluster of eight peaks near 155 ppm corresponding to protonated tyrosine (Figure S1 of the Supporting Information). As seen in Figure 3A, the chemical shift of 13Cζ of the chromophore is shifted downfield away from the tyrosine cluster as a consequence of the chemical transformation involved in maturation that extends the conjugation. The very different chemical shifts for different circular permutants reflect the variations in chromophore ionization equilibria. Previous work on a model chromophore found the protonated 13Cζ resonance at 160 ppm,36 while a recent NMR study of photoswitching in the fluorescent protein Dronpa revealed a deprotonated chromophore 13Cζ chemical shift of 177 ppm in the cis isomer.37 These prior assignments provide additional confidence that we are indeed observing the chromophore resonance. The somewhat structured broad peak centered at ∼172 ppm is due to the ∼240 backbone carbonyl carbon resonances at natural abundance and is also present in unlabeled protein samples (Figure S3 of the Supporting Information). The location and width of the unique chromophore peak depend sensitively on the A:B ratio as deduced from the absorption spectra (Figure 2B) as well as the dynamical properties of the proton transfer discussed below. These characteristics varied markedly between proteins with intPT versus extPT and among different circular permutants.
Internal Proton Transfer
All of the intGFPs measured gave a single peak from the chromophore 13Cζ (Figure 3A). However, the location of this peak changed from protein to protein as a function of the A- and B-state occupancies (Figure 3A,B). Also included in Figure 3A is the titratable ih:GFP S65T in the limit of high pH to provide the fully deprotonated basis at a chemical shift of 177.1 ppm. s7:GFP S65S is ∼95% protonated and appears at 163.6 ppm, and linear extrapolation predicts a protonated basis of 162.0 ppm. This represents a chemical shift dispersion of >15 ppm, highlighting the sensitivity of this probe to the chromophore protonation state. Figure 3B shows that there is good linear agreement between the fraction in the B state calculated from UV–vis absorbance measurements and the 13C NMR chemical shifts. This single-peak behavior is indicative of fast exchange on the NMR time scale in which only one peak is observed at a population-weighted chemical shift value. For reference, the data in Figure 3A were collected with a 300 MHz NMR spectrometer, which makes the inverse of the frequency difference between the basis states approximately 1 ms. Systems undergoing much faster chemical exchange will appear as a single peak, while those exchanging much slower would result in two peaks.
External Proton Transfer
The protein ih:GFP S65T was selected as the model for external proton transfer. It exhibits fluorescence properties identical to those of the unpermuted protein and has simple single-site titration behavior with an apparent pKa of 5.9 (see Figure 2B,C, dark green). 1D 13C NMR spectra were collected over a range of pH values. In contrast to the intPT samples, in which the chemical shift was proportional to the ionization equilibrium, these spectra showed a single peak at the deprotonated basis frequency that did not shift but rather underwent a decrease in intensity with lower pH (Figure 3C). At the lowest pH values, another much broader peak begins to appear around 162 ppm, at the location predicted from the linear extrapolation for the protonated form of the chromophore from Figure 3B. This behavior suggests that the system is undergoing slow chemical exchange on the NMR time scale.
To verify in the ih:GFP S65T sample that the broad putative A-state peak at 162 ppm was in fact in chemical exchange with the peak at 177 ppm (Figure 3C), we performed saturation transfer experiments in which a soft 400 ms saturating pulse was applied at 162 ppm and another with the pulse at an equivalent distance upfield at 195 ppm. If, over the duration of the saturation pulse, chemical exchange were occurring between states with chemical shift bases of 177 and 162 ppm, then the intensity of the peak at 177 ppm should decrease because the population transiently converts its chemical shift to the frequency of irradiation. Indeed, only the on-resonance pulse caused the B-state peak to disappear, while the off-resonance pulse had no effect (Figure S6 of the Supporting Information). The slight changes occurring within the carbonyl band with pH are likely due to local perturbations due to additional ionizable groups throughout the protein (for additional details, see section S.6 of the Supporting Information).
To push beyond the more qualitative line shape and population connectivity analysis, we turned to time-resolved NMR. The kinetics of proton transfer were measured using the selective inversion transfer experiment introduced by Robinson et al.31 In particular, we investigated the ih:GFP S65T protein as it was our best model system for slow exchange. In brief, this technique prepares the spin system in such a way that the magnetization vectors caused by the respective populations of the A and B states are antiphase and parallel to the permanent magnetic field. During a subsequent mixing time prior to the acquisition pulse, the populations undergo chemical exchange and interconvert, thereby lowering the magnitude of the net magnetization vectors due to each state. This effect is manifested as a decrease in the magnitude of the well-resolved B-state peak as the mixing time delay grows larger (Figure 3D).a
The experiments were performed in triplicate at pH 6.70 where an appreciable A-state population exists and at pH 8.00 as a control for ∼100% B state (see Figure 3D and Figure S7 of the Supporting Information). The chemical exchange mixing times were varied from 0 to 40 ms. The pH 6.70 data revealed a decay constant of 99 s–1 (a lifetime of 10.1 ms). Bootstrap analysis was performed in which sets of data were randomly selected from the triplicate measurements and gave a range of 58–113 s–1 in the 90% confidence interval.38 In combination with the fraction deprotonated obtained from UV–vis spectroscopy, this yielded a predicted unimolecular deprotonation constant of 74 s–1. The same experiment at pH 8.00 for chemical exchange mixing times of 0 and 40 ms revealed no decrease in intensity. This result is consistent with expectations because the titration shows that the fraction of deprotonated chromophore is >99%. Additional data were taken at pH 6.30 and show a faster decay rate and with a larger net change in the B-state peak size with increasing time. A global model using a deprotonation rate constant of 74 s–1 and deprotonated fractions (pB) from UV–vis absorbance gave close quantitative agreement in the relative B-state magnetization magnitudes at all chemical exchange mixing times (Figure S7 of the Supporting Information) (for details on equations and fitting, see section S.7 of the Supporting Information).
As shown in Figure 4, another extPT protein, s7:GFP S65T, had a distinctly different pH response. For this construct, the chromophore contributed only a single peak. Furthermore, the chemical shift of the peak was sensitive to the pH and shifts in accordance with the titration population changes (Figure 4A). As with the intPT proteins, this behavior indicates that the system is also undergoing fast exchange on the NMR time scale. Interestingly, when the strand 7 circular permutation site is relocated six residues closer to the N-terminus, a construct we name s7+:GFP S65T (see Figure 1), the NMR spectra are remarkably different. Unlike the nonextended s7:GFP S65T that shows a single peak, this species has two clear peaks, one at the deprotonated basis of 177 ppm that undergoes a decrease in intensity as the pH is lowered and another further upfield whose chemical shift is sensitive to pH (see Figure 4B). The fact that the chromophore spectrum has features simultaneously exhibiting characteristics of both fast and slow exchange (cf. panels A and C of Figure 3, respectively) strongly suggests that a simple single-site model is inadequate to account for the proton transfer dynamics. The same saturation transfer procedure described above was employed for s7+:GFP S65T at pH 7.0 and likewise revealed population connectivity between the two peaks (see Figure S6 of the Supporting Information). This provides clear evidence that we are indeed observing interconverting protonation states.
Figure 4.
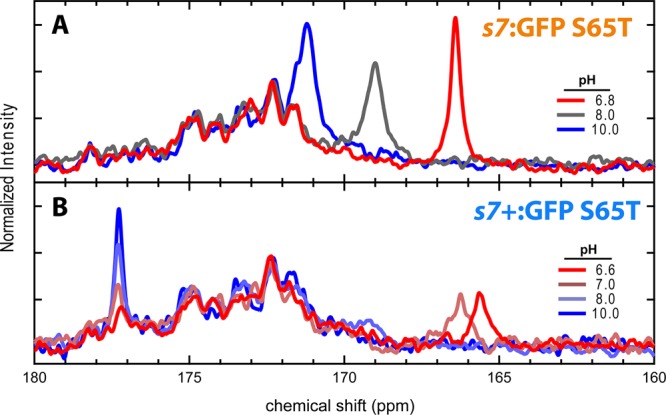
(A) 1D 13C NMR pH titration of s7:GFP S65T. The single peak with a chemical shift that changes as the pH increases indicates fast exchange. (B) 1D 13C NMR pH titration of s7+:GFP S65T. The peak at 177 ppm with a changing intensity is characteristic of slow exchange; however, another peak first appearing as a broad feature near 169 ppm at pH 8.0 and moving toward ∼165 ppm at pH 6.6 suggests a multisite model with fast exchanging components.
Fluorescence Correlation Spectroscopy (FCS) Measurements
FCS monitors stochastic fluorescence trajectories from a small illuminated volume and via autocorrelation analysis reveals information about the diffusional and internal dynamics of an ensemble of fluorophores. Like NMR, it is an equilibrium fluctuation technique. We performed FCS on all of the proteins, and as prior investigators have done, we attribute the decays in the autocorrelation function to three primary sources: (1) diffusion out of the focal volume, (2) light intensity-dependent dark states (e.g., triplet states), and (3) pH-dependent protonation–deprotonation chemical exchange. Autocorrelation functions (ACFs) were obtained for each protein over a range of pH values to determine the apparent chemical exchange rates (see section S.3 of the Supporting Information).
The results for all extPT proteins were very much in line with those of similar experiments performed on GFP S65T, EGFP, Superfolder GFP, and others.13−15 The ACF decay became markedly faster at lower pH, indicating faster chemical exchange for higher proton concentrations (Figure 5). Specifically, ih:GFP S65T (Figure 5A) had an apparent deprotonation rate constant of 3100 s–1 (see section S.3 of the Supporting Information). This is a 42-fold increase over the rate measured by dynamic NMR (74 s–1) that should, in principle, be reporting on the same chemical states.
Figure 5.
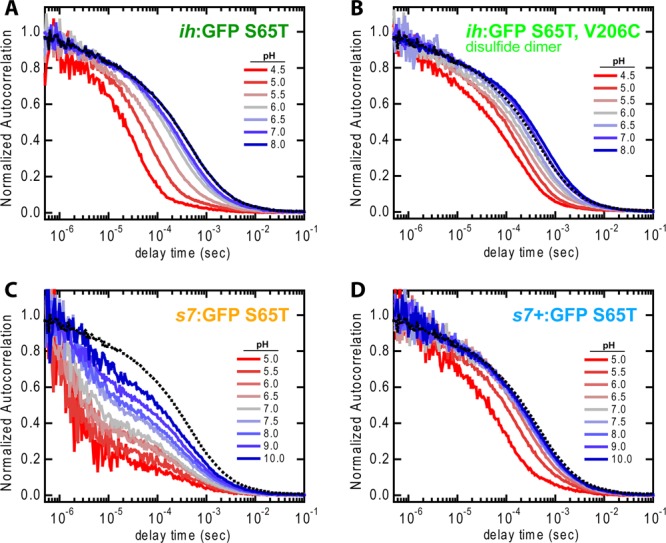
FCS ACFs for a selection of extPT proteins and a range of pH values. The dashed black line is ih:GFP S65T at pH 8.0 and is included as a reference for the typical monomer ACF in the absence of protonation–deprotonation flickering. The dimer in panel B is included for a more direct comparison with the NMR results for ih:GFP S65T (see section S.5.a of the Supporting Information). (C) s7:GFP S65T is notable for its heterogeneous ACF decay with components occurring significantly faster than the other species.
The wide discrepancy between these results induced us to further explore potential artifacts from which either technique may suffer. The two most significant differences between the experimental conditions are the concentration (∼500 pM for FCS and 1–2 mM for NMR) and the visible light illumination (∼10 kW/cm2 for FCS and 0 W/cm2 for NMR). The concentration-dependent oligomerization of FPs has long been appreciated and raised the possibility that the slow dynamics observed via NMR were a result of occlusion of the proton entry point due to protein dimerization. Furthermore, under the intense illumination in the FCS focal volume, there could be some light-driven dynamics. We performed a series of control experiments to test these possibilities. Briefly, the concentration issue was addressed both by creating a covalent dimer for FCS measurements and by performing NMR at low concentrations with a dimerization-suppressing mutant. The light effect was likewise approached from both angles by changing the illumination intensity in the FCS experiments as well as measuring NMR spectra with in situ laser illumination via an optical fiber inserted into the bore of the magnetic in a manner similar to that described by Mizuno et al.37 In summary, it was found that neither of these factors can account for the large rate differences (see section S.5 of the Supporting Information for details).
Discussion
The photophysical behavior of fluorescent proteins is quite diverse and exhibits a hierarchy of time scales (from picoseconds to minutes) and sensitivity to a range of external factors, including light intensity, ionic strength, and pH. Whereas a majority of studies concerning chromophore dynamics have used optical observables, we have complemented the optical techniques of absorption, fluorescence, and FCS with site-specific NMR spectroscopy to probe ground-state proton transfer. The results that we obtained indicate that the dynamics of dark PT are inconsistent with a single-site titration and imply kinetic and thermodynamic coupling between multiple sites. Protein variants differing by mutation or circular permutation were shown to diverge widely in their dynamic characteristics, many of which appeared to disagree internally. However, as described below within a two-site titration model, these divergent features can be reproduced in a comparatively parsimonious way.
Before we undertake the construction of a semiquantitative two-site model, it is important to highlight again precisely what needs to be modeled and which discrepancies need to be resolved. First, from a thermodynamic perspective, the model must account for the abnormal pH titration behaviors of negative cooperativity and apparent mixed-state asymptotes (Figure 2C). Second, the model should be able to unify the apparent slow proton exchange observed by NMR in certain proteins with the much faster chemical exchange indicated by FCS (compare, for example, Figure 3C,D with Figure 5A). Lastly, a successful model should be able to account for the presence of multiple chromophore NMR peaks in a single variant displaying contradictory dynamic signatures, that is, peaks simultaneously showing slow and fast exchange behaviors upon pH titration (see Figure 4B). An important assumption implicit in this treatment is that the same general kinetic form underlies all of the variants studied here. We take the sequence and functional similarities of the protein variants as justification for the use of this assumption as well as the resulting model’s concise form and relative success.
Kinetic Model of Proton Transfer
Because neither concentration nor illumination differences were able to reconcile the large discrepancy between the NMR and FCS for the proton transfer reaction, we must consider alternative models that accommodate both sets of observables. As mentioned above, a two-site model has been successfully applied to explain the noncanonical UV–vis pH titration results and to address the kinetic results of certain pH-jump experiments.10 We utilize such a model to critically analyze the varied phenomenology of the protein variants presented here and assess whether this framework can encompass all our observations (this two-site model is summarized in Figure 6).
Figure 6.
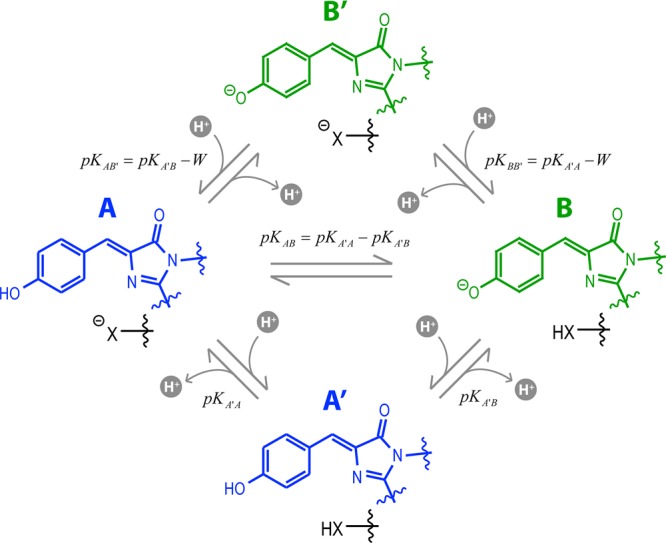
Two-site model for proton transfer. The protonated chromophore forms are colored blue and the deprotonated forms green. The second site is shown as a black “X”. The microscopic site pKa values are given for each transition and include the site coupling energy (W) where necessary. For both NMR and FCS, only chemical exchange linked to the chromophore ionization via transitions between A states (blue) and B states (green) can be observed.
The essence of the two-site model is that the behavior of the chromophore is connected to a second group, labeled “X” in Figure 6, whose ionization state influences the dynamical properties of proton transfer. The thermodynamics of this system can be conveniently and completely represented by the apparent pKa of the chromophore, the apparent pKa of the secondary site, and a coupling energy W between these two sites. Specifically, this means that the pKa of the chromophore (pKA′B) is related to its pKa in the presence of the ionized second site (pKAB′) as pKAB′ = pKA′B – W. The meaning of W can be rationalized as arising, in part, from the electrostatic energetic penalty of forming an anion in the proximity of another. Like the pKa, W is dimensionless but proportional to the standard free energy by the factor 2.303RT, where R is the ideal gas constant and T is the absolute temperature.
The UV–vis pH titration is completely specified by the thermodynamic parameters because it reports on only equilibrium concentrations. The FCS ACFs and NMR spectra, in contrast, are influenced by the system dynamics and require chemical exchange rates for prediction. Our convention is to define the kinetics of each reaction by the chemical exchange rate at a pH equal to its pKa. We chose to utilize the kinetic master equation formalism and treat all reactions as pseudounimolecular. This assumption is well justified for the experiments described herein because they are all equilibrium fluctuation measurements and therefore subject to constant pH. The calculations of predicted equilibrium pH titrations, FCS ACFs, and 1D 13C NMR spectra were performed numerically in Matlab (for additional details, see section S.8 of the Supporting Information).
Manual Modeling
The scheme in Figure 6 formally has ten parameters, of which eight are independent. Some of these parameters may be surmised, or at least bounded, by a careful consideration of experimental data. We found it to be convenient and intuitive to separate the parameters into two sets: those defining only the thermodynamics and those defining only the kinetics. The equilibrium UV–vis pH titration data are determined solely by the thermodynamic terms. Specifically, the thermodynamic parameters are the microscopic pKa values of the chromophore (pKA′B) and site “X” (pKA′A), provided that the other site is in its neutral form, and the energetic coupling between the sites upon ionization (W). These three parameters together fully define the equilibrium state and thus completely specify the pH titrations. Within this convention, the kinetics are independently described for each microscopic step by the apparent rate constant at a pH equal to the pKa where the forward and reverse pseudounimolecular rate constants are equal. The single exception is the apparent internal proton transfer rate (kAB) that is pH-independent. Collectively, all of these parameters allow the calculation of the microscopic protonation and deprotonation rate constants necessary for constructing the kinetic master equation (see section S.8 of the Supporting Information for details).
The FCS measurements are sensitive to chromophore protonation–deprotonation transitions occurring on time scales shorter than those that can be resolved by NMR and have an observation window extending out to the diffusional lifetime (∼0.5 ms in our geometry). The 1D NMR spectra are very rich in information because they offer clear limiting behavior for slow (>∼5 ms) and fast (<∼200 μs) chemical exchange as well as unique line shapes for intermediate exchange regimes. Furthermore, dynamic NMR experiments (as in Figure 3D) allow the acquisition of quantitative rate information about slow processes. Taken together, these collections of independent observables allow us to triangulate sensible parameter sets from which to build probable kinetic models. Again, the focus of this modeling is not to determine the most accurate values for every parameter of every variant but rather to assess the ability of the underlying scheme to encompass the range of observed behaviors and highlight the subtle differences among protein variants that cause them to occupy different regions of the parameter space.
Simulated spectra do indeed show that the diverse behavior among the proteins studied can be reproduced within different regions of the two-site model parameter space. The UV–vis, FCS, and NMR data from pH titrations of ih:GFP S65T, s7:GFP S65T, and s7+:GFP S65T exemplify these variations, and the simulated data are presented in Figure 7, with kinetic parameters listed in Table 1.
Figure 7.

Simulated pH titrations, FCS ACFs, and 1D 13C NMR spectra for all measured extPT proteins. In some cases, the B species (green) is partially obscured in the pH titrations. The NMR spectra are all normalized such that the integrated peak area is always unity.
Table 1.
| parameter | ih:GFP S65T (monomer) | ih:GFP S65T (dimer) | s7:GFP S65T | s7+:GFP S65T |
|---|---|---|---|---|
| pKA′B | 5.2 | 5.2 | 6.4 | 6.4 |
| pKA′A | 5.6 | 4.4 | 6.6 | 6.3 |
| W | 0.1 | 1.0 | 4.0 | 0.0 |
| kA′B (s–1) | 10000 | 100 | 50000 | 200 |
| kA′A (s–1) | 10000 | 1000 | 5000 | 20000 |
| kAB (s–1) | 8000 | 2000 | 500000 | 100000 |
| kAB′ (s–1) | 200 | 100 | 500 | 50 |
| kBB′ (s–1) | 200 | 1000 | 500 | 50 |
The two-site model is capable of replicating the full range of effects incompatible with the single-site framework. The contradictory chemical exchange time scales observed by FCS and NMR, particularly for ih:GFP S65T, can be reconciled under a two-site model and highlight the possibly misleading nature of either one taken separately because of their intrinsic sensitivity to chemical exchange processes on differing time scales. The simulations also reveal that phenomena in the NMR pH titrations such as disappearing peaks (e.g., Figure 3C and Figure S4B of the Supporting Information) and peaks simultaneously showing both fast and slow exchange characteristics (e.g., Figure 4B) are natural consequences of certain parameter sets. Interestingly, we recently observed a similar case of tyrosine 13C NMR peaks vanishing during pH titration in a study of hydrogen bond networks in the keto-steroid isomerase active site.39 Additionally, the UV–vis deviations from single-site titrations were neatly resolved through the influence of the site coupling parameter W. Small values of W result in stretched isotherms characteristic of negative cooperativity, while large values of W lead to strong internal buffering and titrations with mixed-state plateaus. In the following, we shift our attention toward the possible mechanistic implications of our observations when viewed through the lens of a two-state model.
Mechanistic Implications
The abnormal pH titration behaviors and heterogeneous kinetics of proton transfer in the GFP family have been noticed by others.10,13 Specifically, Scharnagl et al. were the first to offer the explanation of electrostatic coupling between ionizable sites on the basis of simulations,9 which was later empirically elaborated across many variants by Beltram and co-workers.10 Further work with pH-jump studies revealed multistep kinetics that has been commonly interpreted as involving a PT to the protein surface followed by migration to the interior gated by conformational fluctuations, often implicating His148.10,18−20,23 Our results are broadly consistent with this multisite ionization framework, and we find that the scheme in Figure 6 has good qualitative applicability across the mutants and circular permutants we investigated.
A handful of previous NMR studies on FPs may provide clues about the presence and nature of the long-lived species we report herein. Holak and co-workers have observed slow structural exchange processes occurring on millisecond time scales in two different contexts. In the first, they measured 19F NMR of fluoro-substituted tryptophan in CFP and observed two well-resolved chromophore fluorine peaks that were fit to a two-state chemical exchange model with a lifetime of 1.2–1.4 ms.40 In the other, they observed twinning in a number of 1H–15N HSQC peaks induced by the H148G mutation (on s7) in GFPuv, indicating two conformers in slow exchange.24 These results highlight the unique structural role of strand 7 and its participation in slow dynamics.
Our experiments have indicated that the location of the circular permutation site with respect to s7 has a dramatic effect on the observed ground-state proton transfer dynamics even while leaving sensitive photophysical properties such as quantum yield and ESPT largely unchanged (data not shown). In particular, CP at position 146 (s7:GFP S65T) significantly increases the rate of proton transfer as evidenced by the characteristic fast exchange NMR spectra obtained from pH titrations (Figure 4A).b Relocation of the CP by six residues upstream to position 140 (s7+:GFP S65T) completely alters the exchange dynamics on both long and short time scales and restores a long-lived B state (Figure 4B). We hypothesize that the CP at 146, just two residues upstream of His148 that is hydrogen bonded to the chromophore phenoxy, allows for greater flexibility and “fraying” of β-strand 7, thus accelerating the proton transfer processes.
Figure 6 details a kinetic model in which only one additional ionizable site, “X”, is strongly coupled to the chromophore. In reality, there are probably many sites collectively modifying the chromophore proton affinity. UV–vis absorbance pH titration curves, however, suggest that only a single site is responsible for most of the thermodynamic coupling. Several investigators9,10 have speculated that Glu222 is playing this role because of both its proximity to the chromophore and its position as the terminal proton acceptor for ESPT. Moreover, the isosteric E222Q mutation results in pH titrations that are fit well by a simple single-site model (Figure S9 of the Supporting Information). Thus, as further mechanistic speculation, we will provisionally assume that “X” is Glu222.
The two most important thermodynamic parameters dictating the character of the titrations are the difference between the intrinsic pKa values (pKA′A – pKA′B), which determines the internal proton transfer equilibrium, and the coupling (W), which determines the degree of internal buffering. A property shared by the intPT proteins is a very high W. This factor causes them to have a very flat response to pH changes (dashed curves in Figure 2C). Furthermore, the high value for W can be rationalized by recognizing that these proteins have a direct hydrogen bond network extending from the chromophore phenoxy to Glu222 over which ESPT occurs.6,7 A direct consequence of this large coupling, W, is a broad plateau in the pH titration within which only intramolecular proton transfer occurs, making the fractional protonation of the chromophore solely determined by the difference in intrinsic pKa values (cf. ih:GFP S65S in Figure 2C and Figure S8 of the Supporting Information). Fortuitously, the circularly permuted intPT proteins differed in this internal PT equilibrium and allowed for the collection of NMR data in panels A and B of Figure 3 and thus the calculation of the basis spectra.
The extPT proteins, in contrast, generally had much smaller values for W, which were manifested as titrations showing shallower slopes characteristic of negative cooperativity. All of these proteins had the S65T mutation, which has been shown in structures to disrupt the hydrogen bond network linking the chromophore and Glu2227 and, according to our interpretation, should lead to a weakening of the coupling. The magnitude of the decrease in W with S65T suggests that the majority of the coupling effect is mediated by specific hydrogen bonding rather than simply the through-space electrostatic repulsion that would be approximately the same for Ser65 or Thr65. It should be noted that the model still predicts efficient intramolecular GSPT between the chromophore and Glu222 despite the breakdown of ESPT. Interestingly, the one extPT protein predicted to have a large W, s7:GFP S65T, is also the only one having appreciable fluorescence emission upon A-state excitation (data not shown). Further bolstering the case for Glu222 as the principal coupled ionizable site is the fact that upon mutation to glutamine (E222Q) the thermodynamic signature of any coupling is eliminated (see section S.9 of the Supporting Information for details).
The kinetic behavior of the intPT proteins is quite simple from the NMR perspective. As described above, the two-site model predicts that the only chemical exchange should be intramolecular proton transfer between A and B (see Figure S8 of the Supporting Information). The fact that a single population-weighted peak is observed in all intPT cases (see Figure 3A,B) implies that the internal proton shuttling between the chromophore and Glu222 is occurring rapidly. Early on, it was thought that the ground-state interconversion between the A state and B state was quite slow (hours).5 Later, the work of Kennis et al. demonstrated a nanosecond scale ground-state return of the proton following ESPT (i.e., from the so-called “I state” to the A state);17 however, this does not directly report on the A- to B-state conversion time scale. Our findings clearly indicate on the basis of fast exchange on the NMR time scale that the A- to B-state exchange rate lies in the microsecond range or faster.
A recurrent theme from the global fit parameters for the extPT proteins was the prominence of the doubly deprotonated state (B′ in Figure 6) in the slowest transition mode of the two-site exchange network. More specifically, the slowest mode of equilibrium chemical flux through the transition network was typically between B′ and a cluster comprised of B, A, and A′. This fact is manifested in the NMR spectra of most of the extPT proteins by the chemical shift invariance of the 177 ppm peak. The kinetics of chemical exchange within the cluster {B, A, A′} are more variable and lead to qualitatively different outcomes. The pH-independent intramolecular PT connecting A and B is, by and large, the most rapid projected reaction. In cases of large W, namely s7:GFP S65T and the intPT proteins, this mixed-state {A, B} is identical to the pseudothermodynamic state termed “M” by Bizzarri et al.10 In summary, the diverse NMR results can be largely understood as arising from B′ in slow exchange with the rapidly interconverting {A, B} that is, in turn, exchanging with A′ with a variable rate among protein variants. Below, we briefly consider the consequences of this interpretation on the proteins simulated in Figure 7.
For both the dimer and monomer forms of ih:GFP S65T, the interconversion between {A, B} and A′ falls within an intermediate exchange regime. This leads to the unusual situation in which the chromophore peak in the NMR spectrum seems to disappear almost entirely (see Figure 3C and Figure S4B of the Supporting Information). The simulated spectra (Figure 7C,F) suggest that the apparent loss of intensity is, in fact, due to slow exchange of the well-defined B′ peak with an extremely broad peak comprised of {A, B} in exchange with A′ near the coalescence point. As the pH is further lowered, the signal reconsolidates toward a pure A′ state.
The lack of a defined B′ peak in s7:GFP S65T (Figure 4A) is caused by a strong site coupling term (W), which causes the apparent high-pH limit to be the {A, B}, or “M”, with a negligible population of B′ (Figure 7G). Thus, the single peak with a changing chemical shift is indicative of a fast exchange process between {A, B} and A′.
The situation for s7+:GFP S65T (Figure 4B) shares certain features with the two preceding cases. Like ih:GFP S65T, it has a well-resolved B′ peak in exchange with some combination of B, A, and A′. The kinetic behavior of this cluster, however, is more similar to that of s7:GFP S65T in which the three states are in mutually fast exchange. Together, these factors lead to the two apparent populations in the NMR spectra of B′ at the deprotonated basis and {B, A, A′}, whose composition changes with a decrease in pH. The saturation transfer experiments described in the Results and detailed in section S.6 of the Supporting Information demonstrate that the two populations in the s7+:GFP S65T titration (Figure 4B) are in fact in chemical exchange on a time scale of tens of milliseconds and thus consistent with the two-site kinetic scheme.
One of the most striking features from the data is the very long lifetime of the doubly deprotonated state B′. The physical basis for the slowness of this transition out of B′ is not clear from our measurements. The prolonged time scale of the proton transfer is suggestive of an accompanying gross structural change and could be related to the s7 conformations observed in previous NMR studies.24 Krishnamoorthy and co-workers also suggested that PT is being gated by large conformational changes on the basis of a significant viscosity dependence to pH-jump fluorescence kinetics.18 Our results indicate that a second ionizable site is playing a large kinetic role and could potentially be modulating the rate of these conformational fluctuations. Both the chromophore phenoxy and Glu222 participate in a hydrogen bond network that extends to s7, and it is possible that proton transfers are actuating larger structural rearrangements.
The work presented here highlights the array of factors influencing the GFP chromophore protonation and deprotonation kinetics. Most prominent among these seems to be the influence of the secondary ionizable site, Glu222, primarily via its influence on hydrogen bond networks encompassing the chromophore. Interestingly, subtle and distal changes due to protein circular permutation can profoundly alter the proton transfer kinetics while still qualitatively fitting within the coupled two-site framework. This implies that efforts to approach this problem computationally would likely require simulation of the complete structure using quantum mechanics/molecular mechanics methods with a quantum region large enough to capture the proton transfer chemical reactions. The size of the protein (238 residues), the time scales of the proton transfers (up to tens of milliseconds), and the requirement for reactive dynamics all make this a daunting challenge. The GFP system could serve as a prototype for these types of advanced calculations whose predictions may be compared against the rich variety of specific experimental observables that can be obtained because of the spectral and chemical uniqueness of the chromophore.
Conclusion
We have introduced a site-specific 13C NMR probe to provide a nonoptical observable for proton transfer in GFP. The union of this technique with the optical methods of UV–vis absorbance and FCS allowed for a comprehensive view of the multisite nature of the system. Our data from this approach underscore the potential pitfalls of relying on single kinetic measurement techniques because of the bias introduced by their intrinsic observational time scale. The kinetics of proton transfer in Superfolder GFP are shown to correspond well to a model with two thermodynamically coupled titratable sites across a range of mutants and circular permutants. The PT rates are significantly impacted by both mutational disruptions to internal hydrogen bond networks and the presumed structural rigidity of β-strand 7 as probed by circular permutation.
Acknowledgments
We gratefully acknowledge Stephen Lynch at the Stanford NMR Facility and Corey Liu at the Stanford Magnetic Resonance Laboratory for technical assistance with the NMR experiments. We also thank Prof. W. E. Moerner for the use of the FCS instrumentation.
Glossary
Abbreviations
- GFP
green fluorescent protein
- PT
proton transfer
- GSPT
ground-state proton transfer
- ESPT
excited-state proton transfer
- NMR
nuclear magnetic resonance
- FCS
fluorescence correlation spectroscopy
- ACF
autocorrelation function
- CP
circular permutation.
Supporting Information Available
Complete sequences for all protein constructs, concentration- and light-dependent effects on PT dynamics, NMR saturation transfer for connectivity analysis, fitting and simulation methods for FCS and NMR, E222Q titrations, and local His tag effects. This material is available free of charge via the Internet at http://pubs.acs.org.
The authors declare no competing financial interest.
This work was funded in part by National Institutes of Health Grant M27738. The fluorescence correlation spectroscopy instrumentation was supported by U.S. Department of Energy Grant DE-FG02-07ER15892 to Prof. W. E. Moerner. L.M.O. acknowledges the financial support of a National Defense Science and Engineering Fellowship and a National Science Foundation Graduate Research Program Fellowship.
Funding Statement
National Institutes of Health, United States
Footnotes
In principle, the data are convolved with the T1 relaxation time; however, that time [∼5.7 s (data not shown)] was found to be several orders of magnitude longer than the chemical exchange lifetime.
It is interesting to note that CPs or insertions into this area of the protein have found many successful applications in chemical sensing with recognition domains.41
Supplementary Material
References
- Dedecker P.; De Schryver F. C.; Hofkens J. (2013) Fluorescent Proteins: Shine on, You Crazy Diamond. J. Am. Chem. Soc. 135, 2387–2402. [DOI] [PubMed] [Google Scholar]
- Dickson R. M.; Cubitt A. B.; Tsien R. Y.; Moerner W. E. (1997) On/off blinking and switching behaviour of single molecules of green fluorescent protein. Nature 388, 355–358. [DOI] [PubMed] [Google Scholar]
- Kneen M.; Farinas J.; Li Y.; Verkman A. S. (1998) Green fluorescent protein as a noninvasive intracellular pH indicator. Biophys. J. 74, 1591–1599. [DOI] [PMC free article] [PubMed] [Google Scholar]
- Lukyanov K. A.; Dmitry M. C.; Sergey L.; Vladislav V. V. (2005) Photoactivatable fluorescent proteins. Nat. Rev. Mol. Cell Biol. 6, 885–890. [DOI] [PubMed] [Google Scholar]
- Chattoraj M.; King B. A.; Bublitz G. U.; Boxer S. G. (1996) Ultra-fast excited state dynamics in green fluorescent protein: Multiple states and proton transfer. Proc. Natl. Acad. Sci. U.S.A. 93, 8362–8367. [DOI] [PMC free article] [PubMed] [Google Scholar]
- Stoner-Ma D.; Jaye A. A.; Matousek P.; Towrie M.; Meech S. R.; Tonge P. J. (2005) Observation of excited-state proton transfer in green fluorescent protein using ultrafast vibrational spectroscopy. J. Am. Chem. Soc. 127, 2864–2865. [DOI] [PubMed] [Google Scholar]
- Brejc K.; Sixma T. K.; Kitts P. A.; Kain S. R.; Tsien R. Y.; Ormo M.; Remington S. J. (1997) Structural basis for dual excitation and photoisomerization of the Aequorea victoria green fluorescent protein. Proc. Natl. Acad. Sci. U.S.A. 94, 2306–2311. [DOI] [PMC free article] [PubMed] [Google Scholar]
- Elsliger M. A.; Wachter R. M.; Hanson G. T.; Kallio K.; Remington S. J. (1999) Structural and spectral response of green fluorescent protein variants to changes in pH. Biochemistry 38, 5296–5301. [DOI] [PubMed] [Google Scholar]
- Scharnagl C.; Raupp-Kossmann R.; Fischer S. F. (1999) Molecular basis for pH sensitivity and proton transfer in green fluorescent protein: Protonation and conformational substates from electrostatic calculations. Biophys. J. 77, 1839–1857. [DOI] [PMC free article] [PubMed] [Google Scholar]
- Bizzarri R.; Nifosi R.; Abbruzzetti S.; Rocchia W.; Guidi S.; Arosio D.; Garau G.; Campanini B.; Grandi E.; Ricci F.; Viappiani C.; Beltram F. (2007) Green fluorescent protein ground states: The influence of a second protonation site near the chromophore. Biochemistry 46, 5494–5504. [DOI] [PubMed] [Google Scholar]
- Fron E.; Flors C.; Schweitzer G.; Habuchi S.; Mizuno H.; Ando R.; De Schryver F. C.; Miyawaki A.; Hofkens J. (2007) Ultrafast excited-state dynamics of the photoswitchable protein dronpa. J. Am. Chem. Soc. 129, 4870–4871. [DOI] [PubMed] [Google Scholar]
- Lukacs A.; Haigney A.; Brust R.; Addison K.; Towrie M.; Greetham G. M.; Jones G. A.; Miyawaki A.; Tonge P. J.; Meech S. R. (2013) Protein Photochromism Observed by Ultrafast Vibrational Spectroscopy. J. Phys. Chem. B 117, 11954–11959. [DOI] [PubMed] [Google Scholar]
- Haupts U.; Maiti S.; Schwille P.; Webb W. W. (1998) Dynamics of fluorescence fluctuations in green fluorescent protein observed by fluorescence correlation spectroscopy. Proc. Natl. Acad. Sci. U.S.A. 95, 13573–13578. [DOI] [PMC free article] [PubMed] [Google Scholar]
- Cotlet M.; Goodwin P. M.; Waldo G. S.; Werner J. H. (2006) A comparison of the fluorescence dynamics of single molecules of a green fluorescent protein: One- versus two-photon excitation. ChemPhysChem 7, 250–260. [DOI] [PubMed] [Google Scholar]
- Liu Y.; Kim H. R.; Heikal A. A. (2006) Structural basis of fluorescence fluctuation dynamics of green fluorescent proteins in acidic environments. J. Phys. Chem. B 110, 24138–24146. [DOI] [PMC free article] [PubMed] [Google Scholar]
- Bosisio C.; Quercioli V.; Collini M.; D’Alfonso L.; Baldini G.; Bettati S.; Campanini B.; Raboni S.; Chirico G. (2008) Protonation and conformational dynamics of GFP mutants by two-photon excitation fluorescence correlation spectroscopy. J. Phys. Chem. B 112, 8806–8814. [DOI] [PubMed] [Google Scholar]
- Kennis J. T. M.; Larsen D. S.; van Stokkum I. H. M.; Vengris M.; van Thor J. J.; van Grondelle R. (2004) Uncovering the hidden ground state of green fluorescent protein. Proc. Natl. Acad. Sci. U.S.A. 101, 17988–17993. [DOI] [PMC free article] [PubMed] [Google Scholar]
- Mallik R.; Udgaonkar J. B.; Krishnamoorthy G. (2003) Kinetics of proton transfer in a green fluorescent protein: A laser-induced pH jump study. Proc.—Indian Acad. Sci., Chem. Sci. 115, 307–317. [Google Scholar]
- Saxena A. M.; Udgaonkar J. B.; Krishnamoorthy G. (2005) Protein dynamics control proton transfer from bulk solvent to protein interior: A case study with a green fluorescent protein. Protein Sci. 14, 1787–1799. [DOI] [PMC free article] [PubMed] [Google Scholar]
- Abbruzzetti S.; Grandi E.; Viappiani C.; Bologna S.; Campanini B.; Raboni S.; Bettati S.; Mozzarelli A. (2005) Kinetics of acid-induced spectral changes in the GFPmut2 chromophore. J. Am. Chem. Soc. 127, 626–635. [DOI] [PubMed] [Google Scholar]
- McAnaney T. B.; Zeng W.; Doe C. F.; Bhanji N.; Wakelin S.; Pearson D. S.; Abbyad P.; Shi X.; Boxer S. G.; Bagshaw C. R. (2005) Protonation, photobleaching, and photoactivation of yellow fluorescent protein (YFP 10C): A unifying mechanism. Biochemistry 44, 5510–5524. [DOI] [PubMed] [Google Scholar]
- Tsien R. Y. (1998) The green fluorescent protein. Annu. Rev. Biochem. 67, 509–544. [DOI] [PubMed] [Google Scholar]
- Agmon N. (2005) Proton pathways in green fluorescence protein. Biophys. J. 88, 2452–2461. [DOI] [PMC free article] [PubMed] [Google Scholar]
- Seifert M. H. J.; Georgescu J.; Ksiazek D.; Smialowski P.; Rehm T.; Steipe B.; Holak T. A. (2003) Backbone dynamics of green fluorescent protein and the effect of histidine 148 substitution. Biochemistry 42, 2500–2512. [DOI] [PubMed] [Google Scholar]
- Baturin S. J.; Okon M.; McIntosh L. P. (2011) Structure, dynamics, and ionization equilibria of the tyrosine residues in Bacillus circulans xylanase. J. Biomol. NMR 51, 379–394. [DOI] [PubMed] [Google Scholar]
- Oktaviani N. A.; Pool T. J.; Kamikubo H.; Slager J.; Scheek R. M.; Kataoka M.; Mulder F. A. A. (2012) Comprehensive Determination of Protein Tyrosine pKa Values for Photoactive Yellow Protein Using Indirect C-13 NMR Spectroscopy. Biophys. J. 102, 579–586. [DOI] [PMC free article] [PubMed] [Google Scholar]
- Takeda M.; Miyanoiri Y.; Terauchi T.; Yang C.-J.; Kainosho M. (2014) Use of H/D isotope effects to gather information about hydrogen bonding and hydrogen exchange rates. J. Magn. Reson. 241, 148–154. [DOI] [PubMed] [Google Scholar]
- Fafarman A. T.; Sigala P. A.; Schwans J. P.; Fenn T. D.; Herschlag D.; Boxer S. G. (2012) Quantitative, directional measurement of electric field heterogeneity in the active site of ketosteroid isomerase. Proc. Natl. Acad. Sci. U.S.A. 109, E299–E308. [DOI] [PMC free article] [PubMed] [Google Scholar]
- Takeda M.; Jee J.; Ono A. M.; Terauchi T.; Kainosho M. (2009) Hydrogen Exchange Rate of Tyrosine Hydroxyl Groups in Proteins As Studied by the Deuterium Isotope Effect on Cζ Chemical Shifts. J. Am. Chem. Soc. 131, 18556–18562. [DOI] [PubMed] [Google Scholar]
- Pedelacq J. D.; Cabantous S.; Tran T.; Terwilliger T. C.; Waldo G. S. (2006) Engineering and characterization of a superfolder green fluorescent protein. Nat. Biotechnol. 24, 79–88. [DOI] [PubMed] [Google Scholar]
- Robinson G.; Kuchel P. W.; Chapman B. E.; Doddrell D. M.; Irving M. G. (1985) A Simple Procedure for Selective Inversion of NMR Resonances for Spin Transfer Enzyme Kinetic Measurements. J. Magn. Reson. 63, 314–319. [Google Scholar]
- Kapusta P. (2010) Absolute Diffusion Coefficients: Compilation of Reference Data for FCS Calibration, PicoQuant, GmbH, Berlin. [Google Scholar]
- Laurence T. A.; Fore S.; Huser T. (2006) Fast, flexible algorithm for calculating photon correlations. Opt. Lett. 31, 829–831. [DOI] [PubMed] [Google Scholar]
- Kent K. P.; Oltrogge L. M.; Boxer S. G. (2009) Synthetic control of green fluorescent protein. J. Am. Chem. Soc. 131, 15988–15989. [DOI] [PMC free article] [PubMed] [Google Scholar]
- Do K.; Boxer S. G. (2011) Thermodynamics, Kinetics, and Photochemistry of β-Strand Association and Dissociation in a Split-GFP System. J. Am. Chem. Soc. 133, 18078–18081. [DOI] [PMC free article] [PubMed] [Google Scholar]
- Xiang H.; Bell A. F.; Tonge P. J. (2002) Isotopic labeling and normal-mode analysis of a model green fluorescent protein chromophore. J. Phys. Chem. B 106, 6056–6066. [Google Scholar]
- Mizuno H.; Mal T. K.; Walchli M.; Fukano T.; Ikura M.; Miyawaki A. (2010) Molecular basis of photochromism of a fluorescent protein revealed by direct 13C detection under laser illumination. J. Biomol. NMR 48, 237–246. [DOI] [PubMed] [Google Scholar]
- Efron B.; Tibshirani R. (1986) Bootstrap Methods for Standard Errors, Confidence Intervals, and Other Measures of Statistical Accuracy. Statistical Science 54–75. [Google Scholar]
- Sigala P. A.; Fafarman A. T.; Schwans J. P.; Fried S. D.; Fenn T. D.; Caaveiro J. M. M.; Pybus B.; Ringe D.; Petsko G. A.; Boxer S. G.; Herschlag D. (2013) Quantitative dissection of hydrogen bond-mediated proton transfer in the ketosteroid isomerase active site. Proc. Natl. Acad. Sci. U.S.A. 110, E2552–E2561. [DOI] [PMC free article] [PubMed] [Google Scholar]
- Seifert M. H.; Ksiazek D.; Azim M. K.; Smialowski P.; Budisa N.; Holak T. A. (2002) Slow exchange in the chromophore of a green fluorescent protein variant. J. Am. Chem. Soc. 124, 7932–7942. [DOI] [PubMed] [Google Scholar]
- Nakai J.; Ohkura M.; Imoto K. (2001) A high signal-to-noise Ca2+ probe composed of a single green fluorescent protein. Nat. Biotechnol. 19, 137–141. [DOI] [PubMed] [Google Scholar]
Associated Data
This section collects any data citations, data availability statements, or supplementary materials included in this article.