Abstract
Nanoscale secondary ion MS (NanoSIMS) imaging makes it possible to visualize stable isotope-labeled lipids in cells and tissues at 50 nm lateral resolution. Here we report the use of NanoSIMS imaging to visualize lipids in mouse cells and tissues. After administering stable isotope-labeled fatty acids to mice by gavage, NanoSIMS imaging allowed us to visualize neutral lipids in cytosolic lipid droplets in intestinal enterocytes, chylomicrons at the basolateral surface of enterocytes, and lipid droplets in cardiomyocytes and adipocytes. After an injection of stable isotope-enriched triglyceride-rich lipoproteins (TRLs), NanoSIMS imaging documented delivery of lipids to cytosolic lipid droplets in parenchymal cells. Using a combination of backscattered electron (BSE) and NanoSIMS imaging, it was possible to correlate the chemical data provided by NanoSIMS with high-resolution BSE images of cell morphology. This combined imaging approach allowed us to visualize stable isotope-enriched TRLs along the luminal face of heart capillaries and the lipids within heart capillary endothelial cells. We also observed examples of TRLs within the subendothelial spaces of heart capillaries. NanoSIMS imaging provided evidence of defective transport of lipids from the plasma LPs to adipocytes and cardiomyocytes in mice deficient in glycosylphosphatidylinositol-anchored HDL binding protein 1.
Keywords: nanoscale secondary ion mass spectrometry imaging, backscattered electron imaging, glycosylphosphatidylinositol-anchored HDL binding protein 1, chylomicrons, triglyceride-rich lipoproteins
Lipids are crucial for the formation of membranes, as fuel for oxidative metabolism, and for the generation of signaling molecules (1). The ability to visualize lipids within cells and tissues is important, but the experimental approaches for creating high-resolution images of lipids within cells and tissues are quite limited. The most commonly used technique for lipid imaging in tissues is fluorescence microscopy after the delivery of fluorescently labeled lipids (2, 3). A drawback of that approach is that some lipids are not readily available as fluorescent compounds, and one must worry about how a fluorescent tag affects the biological properties of the lipid. To overcome these issues, label-free lipid imaging techniques have been developed, such as coherent anti-Stokes Raman scattering microscopy (4) and stimulated Raman scattering microscopy (5), but the lateral resolution and sensitivity of these approaches are limited (6).
More recently, imaging MS has been utilized to visualize lipids (7, 8). New ionization methods, primary ion beams, and newer instrument designs have made imaging MS more powerful. MALDI techniques, TOF secondary ion MS (SIMS), and magnetic sector SIMS represent complementary techniques for lipid imaging (9). In that order, these techniques have increasing spatial resolution but decreasing molecular specificity. MALDI techniques are able to identify and quantify lipids with a resolution of a few micrometers; TOF-SIMS retains the ability to identify specific lipids and can achieve 0.5–1 µm lateral resolution. By measuring the elemental composition of lipids, a nanoscale SIMS (NanoSIMS) instrument yields images of lipids with up to 50 nm lateral resolution. We describe the use of NanoSIMS imaging to create high-resolution images of lipids in cells and tissues.
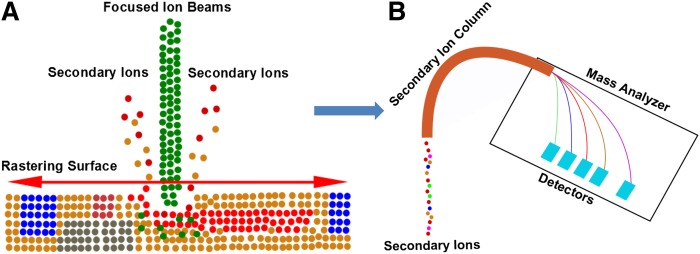
With NanoSIMS imaging, a primary ion beam (Cs+ or O−) is used to bombard a “surface of interest” (e.g., a section of mouse tissue), releasing secondary ions that can be detected by a magnetic mass analyzer (Fig. 1) (10). The NanoSIMS instrument detects up to seven distinct masses in parallel. Due to a special lens design and the characteristics of the mass analyzer, these instruments have an unusual combination of high lateral resolution, high mass resolution, and high sensitivity (11). As with other MS approaches, the NanoSIMS has the ability to detect all isotopes of each element within the sample. This characteristic makes it possible to image and quantify stable isotope-labeled lipids in tissues at high lateral resolution. An advantage of using stable isotope-labeled lipids for imaging is that the stable isotopes have little or no effect on the biochemical properties of the lipids.
Fig. 1.
Schematic of the NanoSIMS instrument, showing the focused primary ion beam and the collection and detection of secondary ion signals. A: A Cs+ or O− beam is used to bombard the surface of a sample (e.g., a tissue section), and secondary particles are released from the surface. Among these secondary particles, there are charged ions that can be detected by MS. B: The secondary ions from the surface of the sample pass through a secondary ion column and are analyzed by a Mauttach-Herzog configuration mass analyzer, which detects secondary ions with high sensitivity and high mass resolution.
Here we describe NanoSIMS imaging for visualizing stable isotope-labeled lipids in cells and tissues (Fig. 2). After feeding mice either 13C- or 2H-labeled fatty acids, we harvested tissues and imaged tissue sections with a NanoSIMS 50 instrument. We also visualized lipids in mice after an intravenous injection of triglyceride-rich LPs (TRLs) enriched in 13C or 2H lipids. In many of our studies, we performed backscattered electron (BSE) imaging and NanoSIMS imaging on the same tissue sections. BSE images provide high-resolution morphological information, making it possible to correlate the chemical information provided by NanoSIMS imaging to subcellular features of individual cells. NanoSIMS imaging was effective in documenting defective lipid transport in the setting of glycosylphosphatidylinositol-anchored HDL binding protein 1 (GPIHBP1) deficiency (where LPL does not reach the capillary lumen and the intravascular processing of TRLs is impaired).
Fig. 2.
NanoSIMS imaging of mouse tissues. Mice were given stable isotope-enriched fatty acids by gavage or were injected with stable isotope-enriched TRLs. Tissues were harvested, fixed, dehydrated, resin embedded, and sectioned. A tissue section is transferred to a NanoSIMS 50 instrument, which generates images at up to 50 nm lateral resolution. NanoSIMS imaging provides high-resolution chemical information based on the distribution of stable isotopes within the sample. Shown here are 12C14N− and 13C/12C NanoSIMS images of brown adipose tissue (BAT) from a wild-type mouse that had been fed 13C fatty acids for 4 days. In the 12C14N− image, an erythrocyte within the lumen of a capillary is white (reflecting a high 14N content), whereas the cytosolic lipid droplets of adipocytes are black (reflecting a low 14N content). In the 13C/12C ratio image, the lipid droplets are orange, reflecting enrichment with 13C. In some of our studies, we initially performed BSE imaging on tissue sections. The BSE imaging was useful for identifying regions of interest for subsequent NanoSIMS imaging. This approach allowed us to correlate high-resolution morphological information from the BSE image with the chemical information provided by the NanoSIMS image.
MATERIALS AND METHODS
Mouse models
Gpihbp1 knockout mice (Gpihbp1−/−) mice have been described previously (12). All mice were fed a chow diet and housed in a barrier facility with a 12 h light-dark cycle. On a chow diet, Gpihbp1−/− mice have plasma triglyceride levels between 2,500 and 4,000 mg/dl (12–15). All animal studies were approved by University of California, Los Angeles’s Animal Research Committee.
Studies with 13C- and 2H-labeled lipids and LPs
13C-uniformly labeled algal fatty acids (Sigma-Aldrich 487937) or 2H-uniformly labeled stearic acid (Sigma-Aldrich 448249) was dissolved in 200 μl ethanol and 1.7 ml sunflower oil. These lipids were administered to either wild-type (Gpihbp1+/+) or Gpihbp1−/− mice. We typically administered 24 mg of 13C-labeled fatty acids or 18 mg of 2H-labeled stearic acid for each gavage treatment. In other experiments, we injected mice (generally by a tail vein, rarely intracardiac) with TRLs that were enriched in 13C- or 2H-labeled lipids. To produce stable isotope-enriched TRLs, 13C algal fatty acids were given to Gpihbp1−/− mice by gavage, typically twice a day over 4 days. The mice were then exsanguinated, yielding ∼1.0 ml of whole blood, which was collected into EDTA-coated tubes. The plasma (0.5 ml) was placed under 2.5 ml of PBS in a 3 ml ultracentrifugation tube and spun at 100,000 rpm for 3 h at 10°C in a TLA 100.3 fixed angle rotor (Beckman). The TRLs were collected from the top of the tube and placed under 2.5 ml of PBS in a new ultracentrifugation tube and spun again at 100,000 rpm for 1 h. The TRLs were retrieved in a volume of 0.5 ml. Mice were injected with 50–200 μl of stable isotope-enriched TRLs containing 300–900 μg triglycerides; after 5 or 15 min, the mice were euthanized, and tissue sections were prepared for BSE and NanoSIMS imaging.
Studies with a 15N-labeled monoclonal antibody against GPIHBP1
We previously generated a rat hybridoma (11A12) that secretes a monoclonal antibody against mouse GPIHBP1 (16-19). We grew hybridoma 11A12 in arginine-, leucine-, and lysine-deficient medium (Sigma-Aldrich D9443) supplemented with 15N-labeled arginine, leucine, and lysine (Sigma-Aldrich 600113, 340960, 609021). 15N-labeled antibody 11A12 was purified on a Protein G-Agarose column (Roche). Approximately 7.5 mg of antibody was purified from a volume of 500 ml of cell culture medium. For in vivo studies, antibody 11A12 (200 ng) was injected into Gpihbp1+/+ and Gpihbp1−/− mice. After 5 or 15 min, the mice were euthanized and perfused with 10 ml of PBS followed by 10 ml of electron microscopy (EM) grade fixative at a rate of 2 ml/min. Tissue sections were prepared for NanoSIMS imaging. In some studies, antibody 11A12 was injected with TRLs.
Preparation of tissue sections
Tissues for NanoSIMS were fixed with 2.5% glutaraldehyde containing 2 mM MgCl2 in 100 mM cacodylate buffer (pH 7.4) (15, 19). The samples were then washed three times in distilled water (10 min each). Samples were then treated with 1% osmium tetroxide (OsO4) in 100 mM cacodylate buffer for 1 h, washed in distilled water four times (10 min each), and then incubated with 2% aqueous uranyl acetate overnight at 4°C in the dark. The samples were sequentially dehydrated with increasing concentrations of acetone (20, 30, 50, 70, 90, and 100%) for 30 min each, followed by three additional treatments with 100% acetone for 20 min each. Samples were then infiltrated with increasing concentrations of Spurr’s resin (25% for 1 h, 50% for 1 h, 75% for 1 h, 100% for 1 h, 100% overnight at room temperature) and then incubated overnight at 70°C in a resin mold. Sections 500 nm thick were cut with a Diatome diamond knife on an ultramicrotome. The sections were placed on a platinum-coated coverslip and left to dry. We used chemical fixation because it is simple and has been used intensively and successfully for in vivo NanoSIMS studies in mice (20, 21).
TRL-injected tissues for transmission EM (TEM) imaging were incubated in 2% glutaraldehyde and 0.5% tannic acid in 0.1 M PBS (pH 7.4) for 2 h at room temperature, then washed five times in 0.1 M PBS, and postfixed in 1% osmium tetroxide in PBS. The samples were then washed four times in sodium acetate buffer (pH 5.5) and block stained in 0.5% uranyl acetate in 0.1 M sodium acetate buffer for 12 h at 4°C. Samples were dehydrated in graded ethanol (50%, 75%, 95%, and three times at 100%) for 10 min each, passed through propylene oxide, and infiltrated in mixtures of Epon 812 and propylene oxide (1:1 and then 2:1 for 2 h each). Samples were then infiltrated in pure Epon 812 overnight, embedded in pure Epon 812, and cured for 48 h at 60°C. Sections of 60 nm were cut on an ultramicrotome (RMC MTX) with a diamond knife. The sections were deposited on single-hole grids coated with Formvar and carbon and double stained in aqueous solutions of 8% uranyl acetate for 25 min at 60°C and lead citrate for 3 min at room temperature. Sections 70 nm thick were placed on grids and imaged with a 100CX JEOL electron microscope.
BSE imaging
A scanning electron microscope produces BSEs that can be used to create high-resolution images of a tissue section. BSEs are electrons that are reflected from the surface of a specimen due to elastic interactions of primary electrons with the nuclei of atoms within the tissue section. The fraction of electrons backscattered by heavy elements (high atomic number) is higher than from light elements (low atomic number). Consequently, the BSE signal is able to reveal contrast based on the average atomic number of atoms in the specimen. OsO4 is often used to stain biological samples for EM because it stains lipids and creates contrast for TEM imaging (22). OsO4-stained regions in tissue sections generate more BSEs than nonstained regions of the tissue sections; hence, tissue sections stained with OsO4 are ideal for BSE imaging. The resolution of BSEs is limited by the size of the interaction volume, which can be modulated by the accelerating voltage of the primary electron beam (23). A low-energy primary electron beam is used to achieve high-resolution BSE imaging.
In our studies, resin-embedded, OsO4-stained tissue sections were first imaged by optical microscopy. Areas of interest were identified, and the sections were then transferred to an NVision FIB scanning electron microscope for BSE imaging. BSE images were taken with a 2 kV incident beam with a standard aperture (30 µm) and a 5 mm working distance between objective lens and the tissue specimen.
NanoSIMS imaging
SIMS imaging is based on MS of ionized secondary particles emitted from a surface of a sample of interest (e.g., a tissue section) during bombardment with primary ions. Due to collisions between the primary ion beam and the sample, a variety of particles (e.g., electrons, molecules, and atomic or cluster ions) are released from the surface of the sample. Most of these particles are neutral. In most SIMS instruments, only secondary ions can be detected unless special measures are taken to achieve postionization of neutral particles (24). Recent modifications of SIMS instruments have focused on increasing sputtering yield and ionization efficiency to achieve higher sensitivity, increasing the precision of the mass spectrometer, and improving spatial resolution (25, 26). The NanoSIMS 50 instrument (CAMECA, France) is a high-resolution SIMS instrument designed to improve spatial resolution without compromising the high sensitivity required to detect trace analytes. The NanoSIMS uses the same ion matter interaction mechanisms as other SIMS instruments, but the primary ion beam bombards the sample from a perpendicular angle.
The NanoSIMS instrument uses a coaxial design of ion optics, so that the same lens assembly focuses the primary ion beam and extracts secondary ions emitted from the sample. This design has a very short working distance, allowing a small probe size and improved secondary ion transmission. There are two types of primary ion sources for the NanoSIMS, O− and Cs+, which allow the analysis of positive and negative secondary ions, respectively. Current NanoSIMS instruments can achieve spatial resolutions of 50 nm for a 0.3 pA Cs+ primary ion beam and 200 nm pA for a 0.3 pA O− primary ion beam (27). An important design feature of the NanoSIMS is the mass analyzer in a Mauttach-Herzog configuration with a 90° spherical electrostatic section and asymmetric magnet. This mass analyzer makes it possible for the NanoSIMS instrument to achieve both high ion transmission (for sensitivity) and high mass resolution (for accurate identification of the secondary ion), combined with high lateral resolution (11). These properties make it possible to image stable isotopes in tissue sections at a resolution sufficient to identify subcellular features of cells.
In this study, a Cs+ primary beam was used to bombard the sample surface, and negative secondary ions (1H−, 2H−, 12C−, and 13C−) were collected and quantified. These secondary ion signals are affected by ionization probability, which in turn is affected by the work function of the surface. Cs+ implantation lowers the surface work function, leading to increased production of negatively charged secondary ions. Secondary ion signals can achieve a steady state after a defined dose of primary ion implantation. An optimized dose of 1 × 10¹⁷ ions/cm2 Cs+ was selected to achieve reliable quantification of 13C/12C and 2H/1H ratios for imaging of lipids in tissue sections. The natural abundance of 13C is 1.1%, whereas the natural abundance of 2H is 0.015%. When biological samples have been metabolically labeled with 13C- or 2H-labeled lipids, the NanoSIMS is capable of accurately measuring the amounts of 13C or 2H above the baseline levels (due to the natural abundance of these isotopes). Thus, when mice are fed 13C- or 2H-labeled fatty acids, it is possible to create a high-resolution image of the distribution of 13C- and 2H-labeled lipids in cells and tissues. In a typical experiment, images are generated based on the local 13C/12C ratio or the 2H/1H ratio in the specimen. The 12C14N− signal is collected to assist in defining cell morphology. In our studies, 13C/12C ratios were calculated on ∼2,000 µm2 of BAT from wild-type mice and 1,000 µm2 of BAT from Gpihbp1−/− mice; 2,500 µm2 of liver from wild-type mice and 2,000 µm2 of liver from Gpihbp1−/− mice; 4,000 µm2 of heart from wild-type mice and 3,000 µm2 of heart from Gpihbp1−/− mice. 2H/1H ratios on heart were generated from 1,200 µm2 of wild-type and Gpihbp1−/− heart.
NanoSIMS images are typically 256 × 256 pixels or 512 × 512 pixels. To obtain a high-quality NanoSIMS image, it is important to match the primary ion beam size and image pixel size. The D1 aperture was used to control the spot size of the primary ion beam. A large primary aperture (D1 = 2) was used to acquire low-resolution images of tissue sections (40 × 40 µm, 256 × 256 pixels). A smaller primary aperture (D1 = 3 or D1 = 4) was used to achieve higher spatial resolution images of capillaries. The OpenMIMS plugin in ImageJ software (MIMS, Harvard University) was used to process NanoSIMS images. The 13C/12C and 2H/1H hue saturation images were generated with a median filter with 3-pixel radius. Areas of interest can be manually defined in 12C14N− images, where lipid droplets and the capillary lumen are black (due to a low signal). 13C/12C and 2H/1H ratios in areas of interest can be measured with the OpenMIMS plugin and then processed by Prism 5.0 (GraphPad Software).
BSE and NanoSIMS imaging are complementary techniques for imaging biological samples and can be performed on the same tissue section. All of the imaging studies shown here were conducted on tissue sections 500 nm thick, which are ideal for both BSE and NanoSIMS imaging. After obtaining BSE images, the tissue sections were then coated with 5 nm platinum and transferred to the NanoSIMS instrument for analysis. The regions of interest from the BSE image can be localized with an optical microscope within the NanoSIMS instrument. Combined BSE and NanoSIMS imaging makes it possible to correlate the chemical information from the NanoSIMS analysis with the ultrastructural morphology provided by BSE imaging.
RESULTS
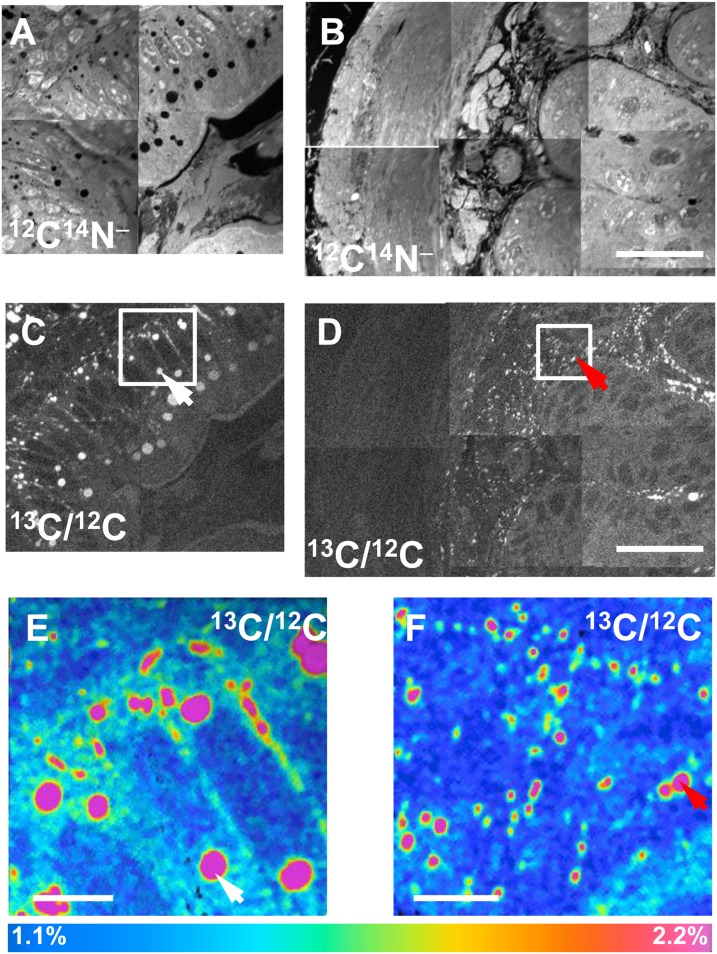
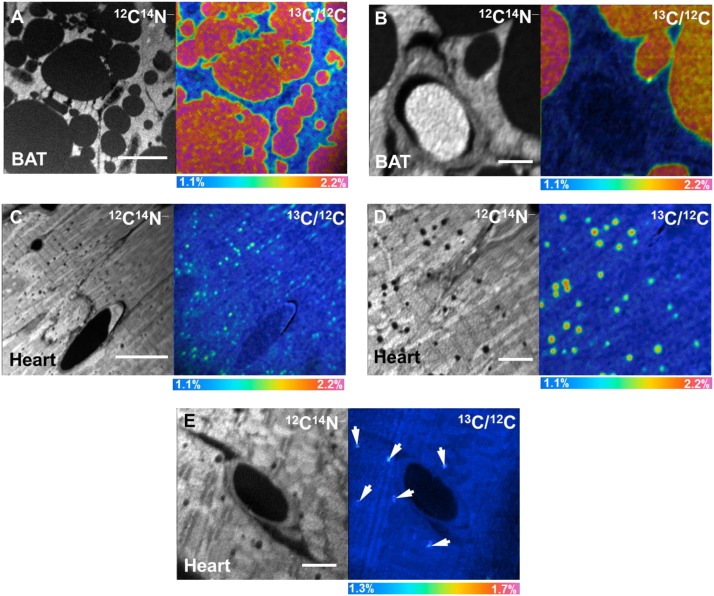
After administering 13C fatty acids to wild-type mice by gavage for 4 days, we performed NanoSIMS imaging on duodenal enterocytes. Fig. 3A, B shows mosaics of 12C14N− NanoSIMS images, while Fig. 3C, D shows mosaics of 13C/12C ratio images. The 13C/12C ratio was high in cytosolic lipid droplets (white arrows, Fig. 3C, E) in the apical portion of enterocytes and in chylomicrons that had been secreted along the basolateral surface of enterocytes (red arrows, Fig. 3D, F). In the same mice, NanoSIMS imaging demonstrated 13C enrichment in the cytosolic lipid droplets of BAT (Fig. 4A, B) and heart (Fig. 4C, D). In these studies, the 13C content of cytosolic lipid droplets in BAT was ∼2.2%, approximately twice the natural abundance of 13C. The 13C content of lipid droplets in the heart was ∼1.8%, while the 13C content in heart cytosol (apart from lipid droplets) was 1.16%. Fig. 4E shows NanoSIMS images after an intravenous injection of 13C-enriched TRLs; the 13C content of cytosolic lipid droplets of cardiomyocytes in these studies was 1.37%.
Fig. 3.
NanoSIMS imaging of 13C lipids in intestinal enterocytes. 13C fatty acids were administered to a wild-type mouse for 4 days, and the duodenum was harvested for NanoSIMS imaging. A, B: Mosaic of 12C14N− NanoSIMS images. C, D: Mosaic of 13C/12C NanoSIMS images. E, F: Higher-resolution 13C/12C NanoSIMS images of the boxed areas in C and D, respectively. The 13C/12C ratio was high in cytosolic lipid droplets (white arrows in C and E) in enterocytes and in chylomicrons that had been secreted along the basolateral surface of the enterocytes (red arrows in D and F). Scale bars: 25 µm (A–D); 4 µm (E, F). In many lipid droplets, there are lower 13C/12C ratios near the edges of the droplets. This likely can be explained by the techniques that were used. The primary ion beam size is set at ∼1.5 times the pixel size, so it is possible that pixels on the edge of lipid droplets include signals from lipid droplets and non-lipid droplet portions of the cell. Also, a median filter was used to reduce the noises in images; that might also contribute to the lower enrichment ratios at the edges of lipid droplets.
Fig. 4.
NanoSIMS imaging of 13C lipids in BAT and heart. A, B: 12C14N− and 13C/12C ratio images of BAT from a wild-type mouse that had been given 13C fatty acids by gavage twice daily for 4 days. C, D: 12C14N− and 13C/12C ratio images of the heart from the same mouse. E: 12C14N− and 13C/12C ratio images of heart from a wild-type mouse that was injected with 13C TRLs. In E, arrows indicate subtle regions of 13C enrichment corresponding to lipid droplets. Scale bars: 10 µm (A); 2 µm (B); 15 µm (C); 4 µm (D); 3 µm (E).
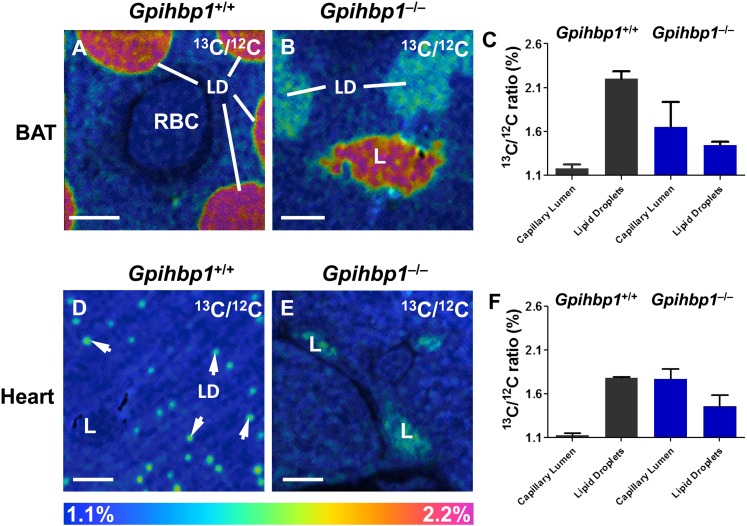
To determine whether NanoSIMS imaging can detect physiologically important perturbations in plasma triglyceride metabolism, we fed Gpihbp1+/+ and Gpihbp1−/− mice 13C fatty acids by gavage twice daily for 4 days. BAT and heart were harvested, and sections were prepared for NanoSIMS imaging. The analysis revealed more 13C enrichment in BAT lipid droplets of wild-type mice than in BAT lipid droplets from Gpihbp1−/− mice (Fig. 5A, B). The 13C/12C ratio in lipid droplets of wild-type BAT was 2.2% versus 1.45% in Gpihbp1−/− BAT (Fig. 5C). The situation was similar in heart (Fig. 5D, E). The 13C/12C ratio in cardiomyocyte lipid droplets was 1.8% in wild-type mice versus 1.46% in Gpihbp1−/− mice (Fig. 5F). The 13C/12C ratios do not fully reflect the extent of the metabolic defect in Gpihbp1−/− heart because the numbers of lipid droplets in cardiomyocytes are markedly reduced in Gpihbp1−/− mice (supplementary Fig. I). Of note, the 13C/12C ratio of the capillary lumen of Gpihbp1−/− mice was much higher than in wild-type mice, reflecting a striking accumulation of 13C TRLs in the plasma of Gpihbp1−/− mice (due to defective LPL-mediated processing of the TRLs) (Fig. 5C, F).
Fig. 5.
NanoSIMS imaging of 13C enrichment in BAT and heart of wild-type (Gpihbp1+/+) and Gpihbp1−/− mice after feeding 13C fatty acids by gavage for 4 days. A, B: 13C/12C NanoSIMS image of BAT from a Gpihbp1+/+ mouse (A) and a Gpihbp1−/− mouse (B). C: 13C/12C ratios in the lipid droplets and capillary lumens of BAT of Gpihbp1+/+ and Gpihbp1−/− mice. D, E: 13C/12C NanoSIMS images of heart from a Gpihbp1+/+ mouse (D) and a Gpihbp1−/− mouse (E). F: 13C/12C ratios in lipid droplets and capillary lumens of heart. LD, lipid droplets (white arrows); L, capillary lumen; RBC, red blood cell. Scale bars: 2 µm (A, B); 4 µm (D, E).
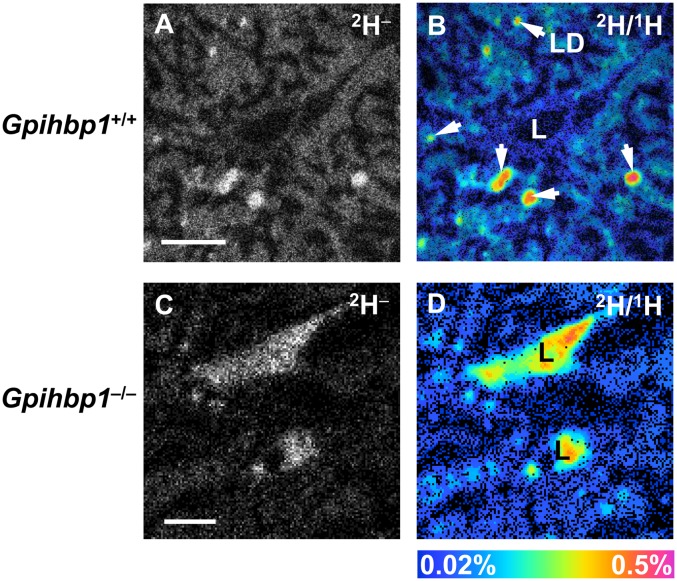
13C is abundant in nature (1.1%), resulting in a 13C− signal in tissue sections of wild-type mice that have not been given any 13C-labeled lipids (supplementary Fig. II). Deuterium has a far lower natural abundance (0.015%), resulting in a much lower background of 2H− secondary ions (supplementary Fig. III). For this reason, we fed Gpihbp1+/+ and Gpihbp1−/− mice a commercially available deuterated fatty acid ([2H]stearic acid) twice per day by gavage for 4 days and then performed NanoSIMS imaging on heart tissue. We observed a strong 2H− signal in wild-type heart (Fig. 6A); the 2H enrichment in cardiomyocyte lipid droplets (0.32%) was much higher than its natural abundance (0.015%) (Fig. 6B). The 2H− signal was weaker in cardiomyocytes from Gpihbp1−/− mice (Fig. 6C, D). As expected, we observed a high 2H/1H ratio in the heart capillary lumen of the Gpihbp1−/− mouse (Fig. 6D), reflecting defective processing of 2H TRLs.
Fig. 6.
NanoSIMS imaging of 2H lipids in hearts from wild-type (Gpihbp1+/+) and Gpihbp1−/− mice after feeding 2H-labeled stearic acid (18 mg) by gavage twice daily for 4 days. A: 2H− NanoSIMS image of a Gpihbp1+/+ heart. B: 2H/1H ratio NanoSIMS image of a Gpihbp1+/+ heart. LD, lipid droplet (arrow). C: 2H− image of a Gpihbp1−/− heart. D: 2H/1H ratio image of a Gpihbp1−/− heart. LD, lipid droplet; L, capillary lumen. Scale bars: 3 µm (A, B); 4 µm (C, D).
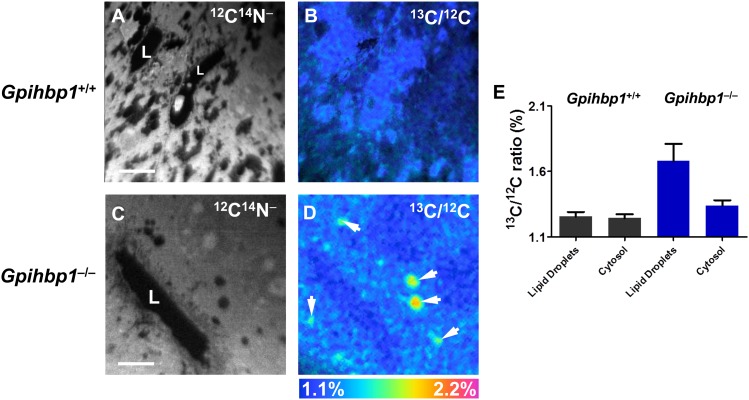
Weinstein et al. (28) proposed that reduced uptake of TRL lipids in peripheral tissues (e.g., adipose tissue and heart) of Gpihbp1−/− mice is accompanied by increased lipid uptake in the liver. To assess the validity of that concept, we examined the liver of Gpihbp1+/+ and Gpihbp1−/− mice that had been given 13C-labeled fatty acids by gavage for 4 days (Fig. 7). In Gpihbp1+/+ hepatocytes, the lipid droplets were small and 13C enrichment (1.25%) was minimal. In Gpihbp1−/− mice, lipid droplets were larger, and the 13C content of lipid droplets was much greater (1.68%). The 13C content in other regions of the cytoplasm (apart from obvious lipid droplets) was 1.34% in Gpihbp1−/− hepatocytes versus 1.24% in Gpihbp1+/+ hepatocytes.
Fig. 7.
NanoSIMS imaging of 13C lipids in the liver of wild-type (Gpihbp1+/+) and Gpihbp1−/− mice after feeding 13C fatty acids twice daily by gavage for 4 days. A, B: 12C14N− (A) and 13C/12C ratio (B) images of liver from a Gpihbp1+/+ mouse. Lipid droplets were first identified in the 12C14N− NanoSIMS images. Areas of interest were manually drawn, pixel by pixel, in the 12C14N− images for the 13C/12C ratio measurements. C, D: 12C14N− (C) and 13C/12C ratio (D) images of liver from a Gpihbp1−/− mouse. White arrows in D indicate lipid droplets. E: 13C/12C ratios in the lipid droplets and cytosol of Gpihbp1+/+ and Gpihbp1−/− liver. L, capillary lumen. Scale bars: 6 µm (A, B); 8 µm (C, D).
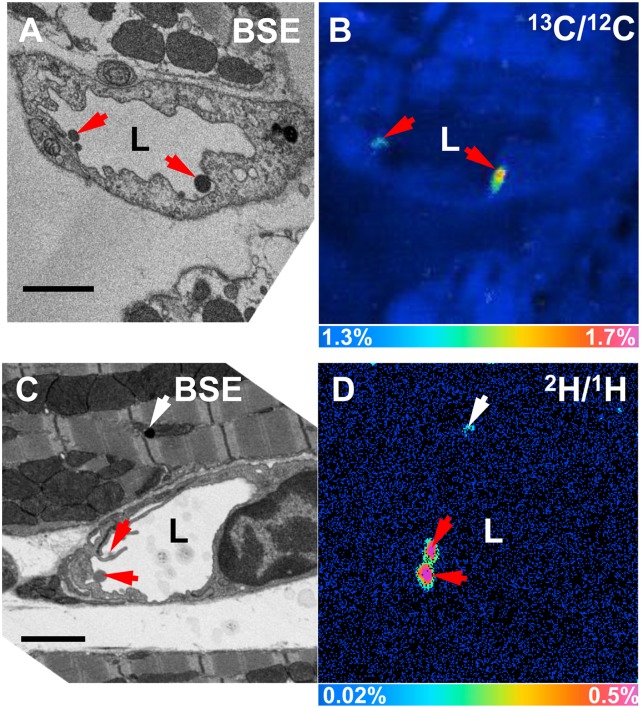
To define the localization of stable isotope-enriched lipids, we performed both NanoSIMS and BSE imaging on tissue sections from wild-type mice that had been given an intravenous injection of 13C- or 2H-enriched TRLs and then euthanized 5 or 15 min later. By BSE imaging, we observed large spherical particles on the luminal surface of capillaries (Fig. 8A, C). Subsequent NanoSIMS imaging on the same section confirmed that these particles (identified by red arrows) were TRLs enriched in 13C (Fig. 8B) or 2H (Fig. 8D). In Fig. 8D, we detected 2H enrichment in a cytosolic lipid droplet of a cardiomyocyte (white arrow), indicating that TRL lipids can move from the plasma compartment to parenchymal cells within 15 min.
Fig. 8.
Margination of 13C and 2H TRLs along heart capillaries. A: BSE image of a section of a wild-type mouse heart 5 min after an injection of 13C TRLs. B: 13C/12C NanoSIMS image of the same capillary. C: BSE image of a section of wild-type mouse heart 15 min after an intravenous injection of 2H TRLs. D: 2H/1H NanoSIMS image of the same capillary. TRLs (red arrows); lipid droplets (white arrow); L, capillary lumen. Scale bar: 2 µm (A–D).
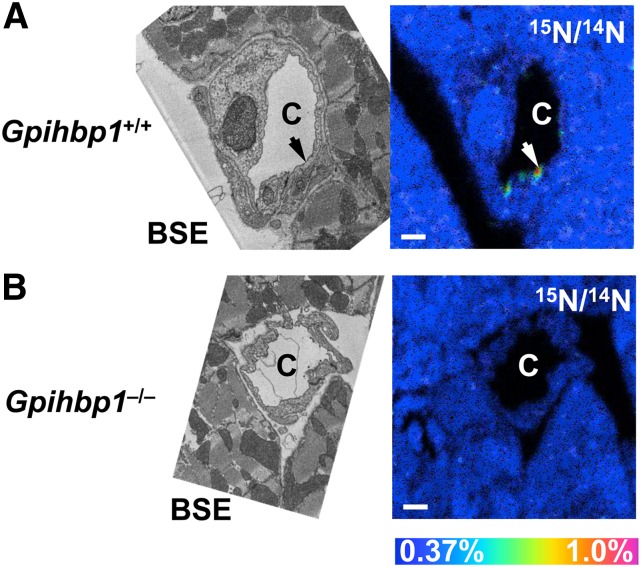
Next, we investigated whether NanoSIMS imaging was able to detect GPIHBP1 (an endothelial cell protein that binds and transports LPL) on the luminal surface of capillary endothelial cells. We injected wild-type and Gpihbp1−/− mice with a 15N-labeled rat monoclonal antibody (11A12) against GPIHBP1. After 15 min, the mice were perfused with PBS, and sections of heart were prepared for imaging. After identifying capillaries by BSE imaging, NanoSIMS analysis was performed on the same sections. We observed localized regions of 15N enrichment along the luminal face of heart capillaries in wild-type mice, reflecting binding of the 15N monoclonal antibody to GPIHBP1 (Fig. 9A). As expected, no 15N enrichment was detected in heart capillaries of Gpihbp1−/− mice (reflecting the absence of GPIHBP1 on endothelial cells and the absence of 15N-antibody binding) (Fig. 9B).
Fig. 9.
Detecting GPIHBP1 along the luminal surface of heart capillaries by NanoSIMS imaging. A 15N-labeled rat monoclonal antibody against GPIHBP1 was injected into a wild-type (Gpihbp1+/+) mouse and a Gpihbp1−/− mouse. A: Correlative BSE and 15N/14N NanoSIMS images of heart from a wild-type (Gpihbp1+/+) mouse, revealing patches (arrow) of 15N enrichment along the luminal surface of a capillary endothelial cell. We examined 15N enrichment at a range of depths by bombarding the section with the cesium beam for longer periods of time. In these “depth profile” NanoSIMS studies, we observed 15N enrichment in a patchy distribution along much of circumference of the capillary. B: Correlative BSE and 15N/14N NanoSIMS images of a heart capillary from a Gpihbp1−/− mouse. C, capillary. Scale bar: 1 µm (A, B).
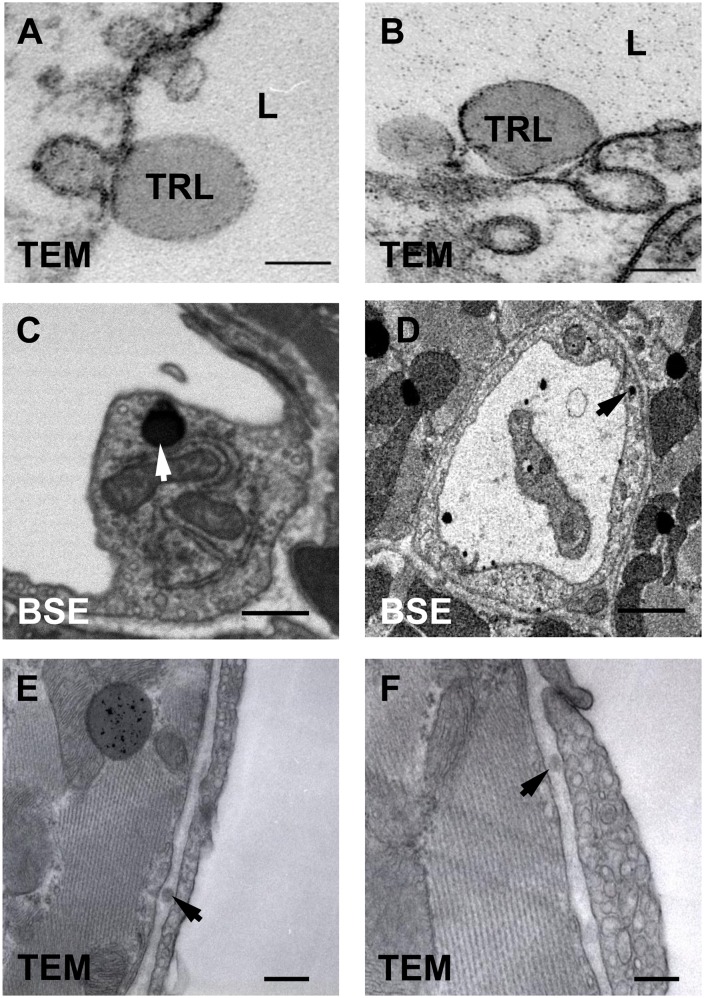
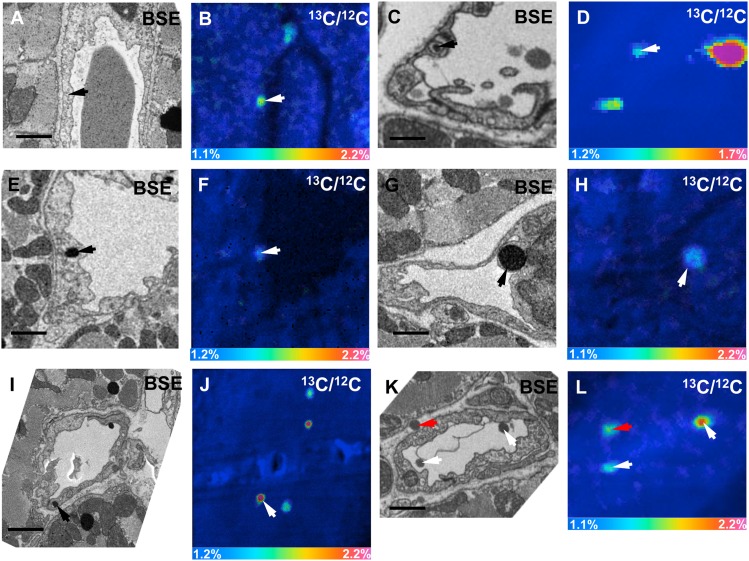
When we image heart capillaries of wild-type mice by TEM, we often observe dark-staining TRLs along the luminal face of endothelial cells (Fig. 10A, B). By BSE, we were able to obtain high-resolution images of darkly stained TRLs in capillary endothelial cells (Fig. 10C, D). By TEM, we have observed subendothelial TRLs in the capillaries of a wild-type mouse heart 15 min after injection of TRLs (Fig. 10E, F). To further explore these findings, we performed correlative BSE and NanoSIMS imaging on heart capillaries. In Fig. 11A, B, we show BSE and 13C/12C NanoSIMS images of a heart capillary from a wild-type mouse that had been given 13C fatty acids by gavage 4 h earlier. A discrete area of 13C enrichment was observed within a heart capillary endothelial cell (Fig. 11B). In Fig. 11C, D, we show BSE and 13C/12C NanoSIMS images of a capillary from a wild-type mouse 15 min after an intravenous injection of 13C-labeled TRLs. 13C enrichment was observed inside a capillary endothelial cell vesicle and in TRLs within the capillary lumen.
Fig. 10.
Imaging of lipid-staining particles in and around heart capillary endothelial cells. A, B: Transmission electron micrographs of TRLs in the capillary lumen (L) of heart capillary endothelial cells from a wild-type mouse. C, D: BSE images of darkly stained particles (arrow) within heart capillary endothelial cells. E, F: Transmission electron micrographs of TRLs in the subendothelial space (arrow) of heart capillaries of a wild-type mouse 15 min after an injection of TRLs. Scale bar: 150 nm (A, B); 500 nm (C, E, F); 1 µm (D).
Fig. 11.
Correlative BSE and NanoSIMS images of mouse heart. A, B: BSE and 13C/12C NanoSIMS images of a heart capillary from a wild-type mouse that had been given 13C fatty acids by gavage 4 h earlier. In the NanoSIMS image, a discrete area of 13C enrichment was observed inside an endothelial cell (arrow). C, D: BSE and 13C/12C NanoSIMS images of a heart capillary of a wild-type mouse 15 min after an intravenous injection of 13C TRLs. In the NanoSIMS image, a discrete area of 13C enrichment was observed inside an endothelial cell vesicle (arrow); 13C enrichment was also observed in TRLs in the capillary lumen. For the image shown in D, 256 × 256 pixel NanoSIMS images were recorded initially. A small region of interest was identified (guided by the BSE image), and that region was enlarged. E–J: BSE images and 13C/12C NanoSIMS images of heart capillaries from a Cav1-deficient mouse 15 min after an injection of 13C TRLs. 13C-enriched lipids (arrows) inside capillary endothelial cells corresponded to dark-staining material on the BSE. In J, other areas of 13C enrichment corresponded to cytosolic lipid droplets and a TRL that had marginated along the luminal surface of a capillary. K, L: BSE and 13C/12C NanoSIMS images of a heart capillary from a wild-type mouse 15 min after an intravenous injection of 13C TRLs. A 13C TRL was observed in the subendothelial space (red arrow). 13C enrichment was also detected in TRLs that had marginated along the luminal face of capillary endothelial cells (white arrows). Scale bars: 1 µm (A–H), 1.5 µm (I–L).
We took the opportunity to examine heart capillaries of Cav1-deficient mice (Fig. 11E–J). Cav1-deficient mice have reduced numbers of caveolae on capillary endothelial cells (19), but from the onset, we assumed that our chances of finding obvious differences in the handling of TRLs was low. In our earlier studies (19), we showed that Cav1 deficiency has little or no impact on GPIHBP1 trafficking across endothelial cells or on pre- or postheparin plasma LPL levels (19). In Fig. 11E–J, we show BSE images and 13C/12C NanoSIMS images of heart capillaries of Cav1-deficient mice 15 min after an intravenous injection of 13C TRLs. Once again, 13C lipids were observed inside capillary endothelial cells (corresponding to lipid-staining material in the BSE images).
In Fig. 11K, L, we show BSE and 13C/12C NanoSIMS images of a heart capillary from a wild-type mouse 15 min after an intravenous injection of 13C TRLs. In these images, we observed a 13C-labeled TRL in the subendothelial space and 13C-enriched TRLs that had marginated along the luminal face of the capillary endothelial cells.
DISCUSSION
In the current study, we describe NanoSIMS imaging of stable isotope-enriched lipids in cells and tissues. We fed mice either 13C- or 2H-labeled fatty acids or injected mice with TRLs containing 13C or 2H lipids. We were able to document the uptake and secretion of stable isotope-labeled lipids in the intestine, the movement of lipids across endothelial cells, and the uptake and the subcellular localization of lipids within adipocytes and cardiomyocytes. NanoSIMS imaging worked well with both 13C- and 2H-labeled fatty acids, but the amount of stable isotope enrichment, relative to natural abundance, was greater with 2H-labeled lipids. For that reason, studies with 2H fatty acids are probably better suited for visualizing small amounts of stable isotope enrichment in tissues (e.g., discerning low levels of stable isotope enrichment at early time points). However, there is a small drawback to 2H-lipid imaging with the NanoSIMS 50 instrument that was used in our studies, namely the inability to create the 12C14N− images that are helpful for defining tissue morphology. When the NanoSIMS 50 is tuned to collect 1H− and 2H− ions, the heaviest secondary ion that can be detected is 12C−. However, one can easily compensate for the inability to obtain 12C14N− images with BSE imaging. A newer NanoSIMS instrument (model 50L) is capable of capturing and recording 12C14N− and 1H− secondary ions in a single scan.
NanoSIMS imaging was useful for visualizing the binding of a 15N-labeled GPIHBP1-specific antibody (11A12) to the luminal face of capillaries. In earlier experiments, we showed that 124I-11A12, when injected intravenously into wild-type mice, binds to GPIHBP1 on endothelial cells and disappears from the bloodstream within 1 min (29). Similarly, a fluorescently labeled antibody 11A12, when injected intravenously, quickly binds to the luminal surface of capillaries, as judged by confocal microscopy on tissue sections 10 μm thick (19, 30). By confocal microscopy, the binding of the fluorescently labeled antibody was patchy but detectable along the entire circumference of the capillary lumen. In the NanoSIMS studies reported here, the 15N-labeled monoclonal antibody was observed in discrete patches along capillaries but was not detected along the entire circumference of the capillary. This is similar to the pattern of GPIHBP1 distribution in heart capillaries by immunogold EM (19). We suspect that finding only small patches of 15N enrichment in the NanoSIMS images is due to the fact that we collected secondary ions from an extremely thin layer of the tissue section (∼10 nm). In earlier studies, Wilson et al. (31) used NanoSIMS imaging to detect a monoclonal antibody conjugated to fluorinated gold beads; antibody binding was documented by NanoSIMS by collecting 19F− secondary ions. As far as we are aware, our experiments are the first to show that NanoSIMS imaging is sufficiently sensitive to detect the binding of a metabolically labeled monoclonal antibody in tissue sections. Our approach is simpler than making antibodies labeled with fluorinated gold beads, and one does not need to worry about an adverse effect of bead conjugation on antibody binding. We anticipate that there will be many opportunities to use NanoSIMS imaging to visualize antibody binding in vivo (32). In the realm of cancer medicine, NanoSIMS imaging could prove to be useful for examining the targeting of diagnostic or therapeutic antibodies to tumor cells.
The ability of NanoSIMS imaging to detect perturbations in lipid metabolism was clearly demonstrated by our studies in Gpihbp1+/+ and Gpihbp1−/− mice. Normally, myocytes and adipocytes secrete LPL into the interstitial spaces; this LPL is then “swept up” by GPIHBP1 on endothelial cells and shuttled to the capillary lumen (19, 30, 33). In the setting of GPIHBP1 deficiency, the LPL in adipose tissue and striated muscle is mislocalized within the interstitial spaces, preventing LPL from interacting with TRLs and leading to both hypertriglyceridemia and impaired delivery of lipid nutrients to parenchymal cells (12, 19, 28, 30, 33). Our NanoSIMS studies provide visual documentation of the perturbed triglyceride metabolism in Gpihbp1−/− mice, revealing an accumulation of stable isotope-enriched TRLs in the capillary lumen and reduced delivery of TRL lipids to parenchymal cells.
NanoSIMS imaging of the liver was intriguing, revealing a higher 13C/12C ratio in lipid droplets and cytoplasm in Gpihbp1−/− mice than in Gpihbp1+/+ mice. Normally, the adult mouse liver expresses only small amounts of LPL (12, 14, 34). However, the fact that capillaries in the liver are fenestrated means that LPL-mediated processing of TRLs does not require transport of LPL by GPIHBP1 (14). When the processing of TRLs in adipose tissue and striated muscle is defective, as in GPIHBP1 deficiency, the liver plays a proportionately greater role in TRL processing (28). In an earlier study of Gpihbp1−/− mice, Weinstein et al. (28) found reduced levels of essential fatty acids in the adipose tissue of Gpihbp1−/− mice but greater than normal levels of essential fatty acids in the liver. They proposed that the defective TRL processing in peripheral tissues of Gpihbp1−/− mice is accompanied by a reciprocal increase in TRL processing and lipid uptake in the liver (28). Our NanoSIMS images showing a greater than normal level of 13C enrichment in Gpihbp1−/− hepatocytes strongly support that view.
In our studies, we often performed BSE and NanoSIMS imaging on the same tissue section. This approach made it possible to localize regions of interest to examine by NanoSIMS imaging and made it possible to correlate the chemical information from the NanoSIMS with the high-resolution morphological information from the BSE imaging. This correlative approach was quite useful. First, we were able to show that most of the 13C or 2H lipid in parenchymal cells was concentrated in neutral lipid droplets; 13C or 2H enrichment in other areas of the cell was low. In the 13C experiments, the 13C content in the cytosol (apart from lipid droplets) was only slightly greater than the natural abundance of the isotope. Second, correlative BSE and NanoSIMS imaging studies allowed us to identify 13C- or 2H-enriched TRLs that had marginated along the luminal surface of capillary endothelial cells. Third, the correlative methodologies allowed us to definitively identify discrete areas of 13C enrichment within capillary endothelial cells. In most cases, these areas of enrichment were in “lipid particles” resembling TRLs. Finally, the correlative BSE/NanoSIMS approach made it possible to identify a stable isotope-enriched TRL within the subendothelial spaces. Subendothelial TRLs were also identified by TEM.
Our studies provide visual evidence of lipid movement from the plasma to endothelial cells and parenchymal cells. However, we are not convinced that we are “seeing” the entirety of the lipid transport process. By TEM, BSE, and NanoSIMS, we have encountered hundreds of TRLs marginated along the luminal surface of capillaries. However, in contrast to the abundance of marginated TRL in capillaries, we found discrete patches of lipids inside endothelial cells rather infrequently. In those cases, the areas of stable isotope enrichment often corresponded to darkly staining material resembling TRLs. In our NanoSIMS imaging studies, we suspect that we have visualized the uptake and transport of intact TRLs by endothelial cells. We know that TRLs bind to the GPIHBP1-LPL complex on capillary endothelial cells (often near caveolar-like invaginations) (15, 19). We also know that GPIHBP1 moves back and forth across endothelial cells (19, 29). We suspect that most examples of stable isotope enrichment inside capillary endothelial cells are due to TRLs “catching a ride” with GPIHBP1. We are not yet convinced that we are adequately visualizing the movement of the fatty acid products of TRL processing. One possibility is that fatty acids move across endothelial cells in vesicles but that the vesicular trafficking is so rapid that the vesicles are detected only rarely in tissue sections. Another possibility is that the fatty acids diffuse so quickly and so broadly that the stable isotope signal instantly disappears within an “ocean” of naturally occurring 13C and 2H atoms within cells and tissues. To address this issue, it would be desirable to perform NanoSIMS imaging in mice after injecting 14C TRLs. 14C is essentially absent in nature, meaning that the background in NanoSIMS imaging studies would be nonexistent. With 14C experiments, one should be able to visualize the transport of fatty acids across endothelial cells and into parenchymal cells, even if fatty acids diffuse broadly and quickly. More than three decades ago, Scow et al. (35) suggested that the fatty acid products of lipolysis diffuse along the plasma membrane of endothelial cells. If that is truly the case, it ought to be possible to visualize the diffusion of fatty acids along the plasma membrane by 14C NanoSIMS imaging. Unfortunately, the 14C fatty acids required for these sorts of studies would be very expensive, and even if cost were not a factor, one would still need to identify a NanoSIMS facility that permits studies with radioisotopes.
We encountered rare examples of TRLs in the subendothelial spaces of heart capillaries. We suspect that the subendothelial TRLs had “hitched a ride” across endothelial cells with GPIHBP1. In previous studies, Bartelt et al. (36) reported that triglyceride-rich liposome particles containing iron nanobeads move across capillaries in BAT.
We imagine additional opportunities for NanoSIMS imaging in lipid research. NanoSIMS imaging of cholesterol transport from native or modified forms of LDLs to cells of the arterial wall would likely be informative. Also, it would be intriguing to visualize triglyceride transport across endothelial cells in vertebrate species that lack GPIHBP1 expression, for example birds and fish (33). Finally, it would be interesting to examine fatty acid and glucose delivery to tumor cells and determine whether different cells within the tumor are metabolically homogenous.
Supplementary Material
Acknowledgments
The authors thank Dr. Yunbin Guan for assistance with NanoSIMS imaging, Ms. Jinny Wong for EM, and Dr. Mary Kraft for helpful discussions.
Footnotes
Abbreviations:
- BAT
- brown adipose tissue
- BSE
- backscattered electron
- EM
- electron microscopy
- GPIHBP1
- glycosylphosphatidylinositol-anchored HDL binding protein 1
- NanoSIMS
- nanoscale secondary ion MS
- SIMS
- secondary ion MS
- TEM
- transmission electron microscopy
- TRL
- triglyceride-rich lipoprotein
This work was supported by National Institutes of Health Grants HL094732, HL090553, and HL087228; Leducq Transatlantic Network Grant 12CVD04; and American Heart Association, Western States Affiliate Fellowships 11POST6600001 and 13POST15700001. Conflict of interest: The authors have declared that no conflict of interest exists.
The online version of this article (available at http://www.jlr.org) contains supplementary data in the form of three figures.
REFERENCES
- 1.Gunstone F. D., Harwood J. L., Dijkstra A. J. 2012. The Lipid Handbook with CD-ROM. CRC Press, Boca Raton, FL. [Google Scholar]
- 2.Schultz C., Neef A. B., Gadella T. W., Jr, Goedhart J. 2010. Imaging lipids in living cells. Cold Spring Harb. Protoc. 2010: pdb.top83. [DOI] [PubMed] [Google Scholar]
- 3.Kuerschner L., Moessinger C., Thiele C. 2008. Imaging of lipid biosynthesis: how a neutral lipid enters lipid droplets. Traffic. 9: 338–352. [DOI] [PubMed] [Google Scholar]
- 4.Evans C. L., Xie X. S. 2008. Coherent anti-Stokes Raman scattering microscopy: chemical imaging for biology and medicine. Annu. Rev. Anal. Chem. (Palo Alto Calif.). 1: 883–909. [DOI] [PubMed] [Google Scholar]
- 5.Freudiger C. W., Min W., Saar B. G., Lu S., Holtom G. R., He C., Tsai J. C., Kang J. X., Xie X. S. 2008. Label-free biomedical imaging with high sensitivity by stimulated Raman scattering microscopy. Science. 322: 1857–1861. [DOI] [PMC free article] [PubMed] [Google Scholar]
- 6.Folick A., Min W., Wang M. C. 2011. Label-free imaging of lipid dynamics using coherent anti-Stokes Raman scattering (CARS) and stimulated Raman scattering (SRS) microscopy. Curr. Opin. Genet. Dev. 21: 585–590. [DOI] [PMC free article] [PubMed] [Google Scholar]
- 7.Gode D., Volmer D. A. 2013. Lipid imaging by mass spectrometry - a review. Analyst. 138: 1289–1315. [DOI] [PubMed] [Google Scholar]
- 8.Goto-Inoue N., Hayasaka T., Zaima N., Setou M. 2011. Imaging mass spectrometry for lipidomics. Biochim. Biophys. Acta. 1811: 961–969. [DOI] [PubMed] [Google Scholar]
- 9.Kraft M. L., Klitzing H. A. 2014. Imaging lipids with secondary ion mass spectrometry. Biochim. Biophys. Acta. 1841: 1108–1119. [DOI] [PubMed] [Google Scholar]
- 10.Boxer S. G., Kraft M. L., Weber P. K. 2009. Advances in imaging secondary ion mass spectrometry for biological samples. Annu. Rev. Biophys. 38: 53–74. [DOI] [PubMed] [Google Scholar]
- 11.Van Tendeloo G., Van Dyck D., Pennycook S. J., editors. 2012. Handbook of Nanoscopy. Vol. 1. Wiley-VCH, Weinheim, Germany. [Google Scholar]
- 12.Beigneux A. P., Davies B., Gin P., Weinstein M. M., Farber E., Qiao X., Peale P., Bunting S., Walzem R. L., Wong J. S., et al. 2007. Glycosylphosphatidylinositol-anchored high density lipoprotein–binding protein 1 plays a critical role in the lipolytic processing of chylomicrons. Cell Metab. 5: 279–291. [DOI] [PMC free article] [PubMed] [Google Scholar]
- 13.Weinstein M. M., Yin L., Tu Y., Wang X., Wu X., Castellani L. W., Walzem R. L., Lusis A. J., Fong L. G., Beigneux A. P., et al. 2010. Chylomicronemia elicits atherosclerosis in mice. Arterioscler. Thromb. Vasc. Biol. 30: 20–23. [DOI] [PMC free article] [PubMed] [Google Scholar]
- 14.Weinstein M. M., Tu Y., Beigneux A. P., Davies B. S., Gin P., Voss C., Walzem R. L., Reue K., Tontonoz P., Bensadoun A., et al. 2010. Cholesterol intake modulates plasma triglyceride levels in glycosylphosphatidylinositol HDL-binding protein 1-deficient mice. Arterioscler. Thromb. Vasc. Biol. 30: 2106–2113. [DOI] [PMC free article] [PubMed] [Google Scholar]
- 15.Goulbourne C. N., Gin P., Tatar A., Nobumori C., Hoenger A., Jiang H., Grovenor C. R., Adeyo O., Esko J. D., Goldberg I. J., et al. 2014. The GPIHBP1-LPL complex is responsible for the margination of triglyceride-rich lipoproteins in capillaries. Cell Metab. 19: 849–860. [DOI] [PMC free article] [PubMed] [Google Scholar]
- 16.Voss C. V., Davies B. S., Tat S., Gin P., Fong L. G., Pelletier C., Mottler C. D., Bensadoun A., Beigneux A. P., Young S. G. 2011. Mutations in lipoprotein lipase that block binding to the endothelial cell transporter GPIHBP1. Proc. Natl. Acad. Sci. USA. 108: 7980–7984. [DOI] [PMC free article] [PubMed] [Google Scholar]
- 17.Beigneux A. P., Gin P., Davies B. S. J., Weinstein M. M., Bensadoun A., Fong L. G., Young S. G. 2009. Highly conserved cysteines within the Ly6 domain of GPIHBP1 are crucial for the binding of lipoprotein lipase. J. Biol. Chem. 284: 30240–30247. [DOI] [PMC free article] [PubMed] [Google Scholar]
- 18.Beigneux A. P., Davies B. S., Tat S., Chen J., Gin P., Voss C. V., Weinstein M. M., Bensadoun A., Pullinger C. R., Fong L. G., et al. 2011. Assessing the role of the glycosylphosphatidylinositol-anchored high density lipoprotein-binding protein 1 (GPIHBP1) three-finger domain in binding lipoprotein lipase. J. Biol. Chem. 286: 19735–19743. [DOI] [PMC free article] [PubMed] [Google Scholar]
- 19.Davies B. S., Goulbourne C. N., Barnes R. H., II, Turlo K. A., Gin P., Vaughan S., Vaux D. J., Bensadoun A., Beigneux A. P., Fong L. G., et al. 2012. Assessing mechanisms of GPIHBP1 and lipoprotein lipase movement across endothelial cells. J. Lipid Res. 53: 2690–2697. [DOI] [PMC free article] [PubMed] [Google Scholar]
- 20.Steinhauser M. L., Bailey A. P., Senyo S. E., Guillermier C., Perlstein T. S., Gould A. P., Lee R. T., Lechene C. P. 2012. Multi-isotope imaging mass spectrometry quantifies stem cell division and metabolism. Nature. 481: 516–519. [DOI] [PMC free article] [PubMed] [Google Scholar]
- 21.Zhang D. S., Piazza V., Perrin B. J., Rzadzinska A. K., Poczatek J. C., Wang M., Prosser H. M., Ervasti J. M., Corey D. P., Lechene C. P. 2012. Multi-isotope imaging mass spectrometry reveals slow protein turnover in hair-cell stereocilia. Nature. 481: 520–524. [DOI] [PMC free article] [PubMed] [Google Scholar]
- 22.Dykstra M. J., Reuss L. E. 2003. Biological Electron Microscopy: Theory, Techniques, and Troubleshooting. Springer, New York. [Google Scholar]
- 23.Winter D. A., Matthijs D. E., Schneijdenberg C. T. W. M., Lebbink M. N., Lich B., Verkleij A. J., Drury M. R., Humbel B. M. 2009. Tomography of insulating biological and geological materials using focused ion beam (FIB) sectioning and low kV BSE imaging. J. Microsc. 233: 372–383. [DOI] [PubMed] [Google Scholar]
- 24.Haase A., Arlinghaus H. F., Tentschert J., Jungnickel H., Graf P., Mantion A., Draude F., Galla S., Plendl J., Goetz M. E. 2011. Application of laser postionization secondary neutral mass spectrometry/time-of-flight secondary ion mass spectrometry in nanotoxicology: visualization of nanosilver in human macrophages and cellular responses. ACS Nano. 5: 3059–3068. [DOI] [PubMed] [Google Scholar]
- 25.Gilmore I. S. 2013. SIMS of organics—advances in 2D and 3D imaging and future outlook. J. Vac. Sci. Technol. A. 31: 050819. [Google Scholar]
- 26.Vickerman J. C., Briggs D. 2013. ToF-SIMS: Materials Analysis by Mass Spectrometry. 2nd edition. IM Publications, Chichester, UK. [Google Scholar]
- 27.Moore K. L., Schröder M., GrovenorC R. M. 2012. Imaging Secondary Ion Mass Spectroscopy. In Handbook of Nanoscopy, Volume 1amp2 G. Van Tendeloo, D. Van Dyck, and S. J. Pennycook, editors. Wiley-VCH Verlag GmbH & Co. KGaA, Weinheim, Germany. doi: 10.1002/9783527641864.ch21. [Google Scholar]
- 28.Weinstein M. M., Goulbourne C. N., Davies B. S., Tu Y., Barnes R. H., II, Watkins S. M., Davis R., Reue K., Tontonoz P., Beigneux A. P., et al. 2012. Reciprocal metabolic perturbations in the adipose tissue and liver of GPIHBP1-deficient mice. Arterioscler. Thromb. Vasc. Biol. 32: 230–235. [DOI] [PMC free article] [PubMed] [Google Scholar]
- 29.Olafsen T., Young S. G., Davies B. S., Beigneux A. P., Kenanova V. E., Voss C., Young G., Wong K. P., Barnes R. H., II, Tu Y., et al. 2010. Unexpected expression pattern for glycosylphosphatidylinositol-anchored HDL-binding protein 1 (GPIHBP1) in mouse tissues revealed by positron emission tomography scanning. J. Biol. Chem. 285: 39239–39248. [DOI] [PMC free article] [PubMed] [Google Scholar]
- 30.Davies B. S. J., Beigneux A. P., Barnes R. H., II, Tu Y., Gin P., Weinstein M. M., Nobumori C., Nyrén R., Goldberg I. J., Olivecrona G., et al. 2010. GPIHBP1 is responsible for the entry of lipoprotein lipase into capillaries. Cell Metab. 12: 42–52. [DOI] [PMC free article] [PubMed] [Google Scholar]
- 31.Wilson R. L., Frisz J. F., Hanafin W. P., Carpenter K. J., Hutcheon I. D., Weber P. K., Kraft M. L. 2012. Fluorinated colloidal gold immunolabels for imaging select proteins in parallel with lipids using high-resolution secondary ion mass spectrometry. Bioconjug. Chem. 23: 450–460. [DOI] [PMC free article] [PubMed] [Google Scholar]
- 32.Angelo M., Bendall S. C., Finck R., Hale M. B., Hitzman C., Borowsky A. D., Levenson R. M., Lowe J. B., Liu S. D., Zhao S., et al. 2014. Multiplexed ion beam imaging of human breast tumors. Nat. Med. 20: 436–442. [DOI] [PMC free article] [PubMed] [Google Scholar]
- 33.Young S. G., Davies B. S., Voss C. V., Gin P., Weinstein M. M., Tontonoz P., Reue K., Bensadoun A., Fong L. G., Beigneux A. P. 2011. GPIHBP1, an endothelial cell transporter for lipoprotein lipase. J. Lipid Res. 52: 1869–1884. [DOI] [PMC free article] [PubMed] [Google Scholar]
- 34.Zhang Y., Repa J. J., Gauthier K., Mangelsdorf D. J. 2001. Regulation of lipoprotein lipase by the oxysterol receptors, LXRalpha and LXRbeta. J. Biol. Chem. 276: 43018–43024. [DOI] [PubMed] [Google Scholar]
- 35.Scow R. O., Blanchette-Mackie E. J., Smith L. C. 1976. Role of capillary endothelium in the clearance of chylomicrons. A model for lipid transport from blood by lateral diffusion in cell membranes. Circ. Res. 39: 149–162. [DOI] [PubMed] [Google Scholar]
- 36.Bartelt A., Bruns O. T., Reimer R., Hohenberg H., Ittrich H., Peldschus K., Kaul M. G., Tromsdorf U. I., Weller H., Waurisch C., et al. 2011. Brown adipose tissue activity controls triglyceride clearance. Nat. Med. 17: 200–205. [DOI] [PubMed] [Google Scholar]
Associated Data
This section collects any data citations, data availability statements, or supplementary materials included in this article.


