

Abstract
The geometry-dependent functioning of the meniscus indicates that detailed knowledge on 3D meniscus geometry and its inter-subject variation is essential to design well functioning anatomically shaped meniscus replacements. Therefore, the aim of this study was to quantify 3D meniscus geometry and to determine whether variation in medial meniscus geometry is size- or shape-driven. Also we performed a cluster analysis to identify distinct morphological groups of medial menisci and assessed whether meniscal geometry is gender-dependent. A statistical shape model was created, containing the meniscus geometries of 35 subjects (20 females, 15 males) that were obtained from MR images. A principal component analysis was performed to determine the most important modes of geometry variation and the characteristic changes per principal component were evaluated. Each meniscus from the original dataset was then reconstructed as a linear combination of principal components. This allowed the comparison of male and female menisci, and a cluster analysis to determine distinct morphological meniscus groups. Of the variation in medial meniscus geometry, 53.8% was found to be due to primarily size-related differences and 29.6% due to shape differences. Shape changes were most prominent in the cross-sectional plane, rather than in the transverse plane. Significant differences between male and female menisci were only found for principal component 1, which predominantly reflected size differences. The cluster analysis resulted in four clusters, yet these clusters represented two statistically different meniscal shapes, as differences between cluster 1, 2 and 4 were only present for principal component 1. This study illustrates that differences in meniscal geometry cannot be explained by scaling only, but that different meniscal shapes can be distinguished. Functional analysis, e.g. through finite element modeling, is required to assess whether these distinct shapes actually influence the biomechanical performance of the meniscus.
Keywords: gender differences, meniscus geometry, meniscus replacement, meniscus size/shape, statistical shape modeling
Introduction
The knee joint menisci play a major role in directing knee biomechanics. By facilitating joint congruency between the femur and tibia and their unique material properties, the primary biomechanical function of the menisci is the redistribution of load over the tibiofemoral cartilage surfaces (Walker & Erkman, 1975; Ahmed & Burke, 1983). Also, the menisci play a role in (secondary) knee stabilization (Levy et al. 1982; Spang et al. 2010; Arno et al. 2013) and joint lubrication (Schumacher et al. 2005). Thus the menisci protect the knee articular cartilage from being mechanically overloaded, which has been linked to an increased risk of osteoarthritis development (Felson et al. 2000).
Cartilage contact mechanics has been shown to be influenced by meniscal geometry. Partial removal of the meniscus results in an increase of the contact pressures on the articular cartilage (Lee et al. 2006; Bedi et al. 2010; Seitz et al. 2012). In addition, several studies have reported that discrepancies in size between the native meniscus and a meniscal allograft increase contact pressures as well (Paletta et al. 1997; Alhalki et al. 2000). A mismatch in size of more than 10% may already cause disturbed contact mechanics or increased internal meniscus loads (Dienst et al. 2007). From a finite element analysis, Donahue et al. (2004) concluded that the articular cartilage is more sensitive to geometry changes of the medial meniscus than the lateral meniscus.
Currently, meniscal allograft transplantation is the most widely accepted treatment for patients that have been subjected to removal of the complete meniscus. Therefore, up to now, meniscal geometry has primarily been characterized as part of the optimization of meniscal replacement size-matching. These studies generally focused on the prediction of 2D meniscal size parameters from radiographs or MR images (Pollard et al. 1995; Haut et al. 2000; Shaffer et al. 2000; McDermott et al. 2004; Elsner et al. 2010; Bloecker et al. 2011), or anthropometric parameters such as body height and weight (Stone et al. 2007; Van Thiel et al. 2009). Several publications have shown that meniscal size is gender-dependent, with female menisci generally being smaller than male menisci (Stone et al. 2007; Van Thiel et al. 2009; Bloecker et al. 2011).
As an alternative to meniscal allografts, several groups are developing anatomically shaped total meniscus replacements, created with various materials (Kobayashi et al. 2005; van Tienen et al. 2006; Balint et al. 2011; Kon et al. 2012; Vrancken et al. 2012). In the pre-clinical testing phase, implant geometry is generally adopted from medical images of a single subject. However, to successfully take over the function of the native meniscus, the final geometry of such an implant should, among other factors, be derived from 3D meniscal geometry. Also, to design a well-fitting implant for the majority of the patients, one should take into account the variation in meniscus geometry observed in the target population.
Although efforts have been made to describe 3D meniscal geometry as an extensive set of 2D size parameters (Haut et al. 2000; Wirth et al. 2010), a continuous description of the 3D meniscal geometry, which would greatly facilitate the design of an artificial meniscal replacement, is not available. Moreover, it is unknown whether inter-subject variation in meniscus geometry is primarily a result of linear scaling or whether different meniscal shapes can be discerned. 3D statistical shape modeling allows the independent modes of geometry changes to be studied, and has been employed to study anatomical variation of the knee joint bones (Baldwin et al. 2010; Mahfouz et al. 2012). Therefore, the present study uses a statistical shape modeling approach to determine and characterize the most important modes of variation in 3D meniscus geometry. The shape model will be employed to investigate whether male and female subjects possess differently shaped menisci. As a gender-based subdivision does not necessarily represent all distinct morphological groups for meniscal geometry, we performed a cluster analysis to identify distinct geometry categories for the medial meniscus.
Materials and methods
Knee MR images were collected from 35 subjects (15 males and 20 females, 21 left and 14 right knees, mean age ± SD: 33 ± 12 years) who did not show medial compartment pathologies. All MRI examinations were performed with a 3 T MRI system (Magnetom Trio, Siemens Medical Solutions, Erlangen, Germany), in combination with a quadrature knee coil (USA Instruments Inc., Aurora, OH, USA). The imaging protocol consisted of a sagittal proton density-weighted, 3D turbo spin echo sequence. Sequence parameters were: repetition time 1100 ms, echo time 29 ms, flip angle 120°, bandwidth 539 Hz, matrix 320 × 320, 224 slices, slice thickness 0.5 mm, no interslice gap, voxel size 0.5 × 0.5 × 0.5 mm3, 1 scan average.
The medial menisci were manually segmented from the MR images using mimics software v14.0 (Materialise, Leuven, Belgium). Five scans were re-segmented 6 months later by the same reader and a second reader, to evaluate intra- and inter-observer reliability. 3D surface models were reconstructed from all segmentation masks. As the medial meniscus shows bilateral symmetry (Prodromos et al. 2007), the right menisci were mirrored to allow comparison of the full dataset. All meniscus models of the training set were coarsely aligned with respect to a randomly chosen reference case, using a Hausdorff distance minimization algorithm (Huttenlocher et al. 1993). Further (anatomical) alignment was based on the manual selection of three points: A, the most anterior location along the inner circumference; P, the most posterior location along the inner circumference; and C, the valley point, all of which are in contact with the tibia plateau (Fig. 1A). All menisci in the dataset were rotated and translated such that point C represented the origin, the planes APC were superimposed, and the lines AP were parallel, all with respect to the previously selected reference geometry.
Fig. 1.
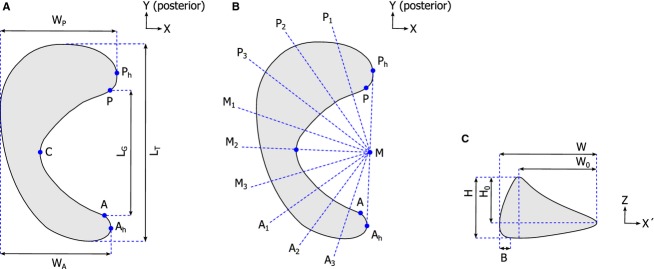
Definition of the parameters used to describe meniscal geometry: (A) Location of points A, P and C (used for anatomical alignment) and the transverse plane dimensions LT, LG, WA, and WP. (B) Overview of the locations of cross-sections P1 to A3. (C) Cross-sectional plane dimensions H, H0, W, W0 and B.
Evaluation of 3D meniscal geometry was performed using statistical shape analysis, following the steps described by Cootes et al. (1995). This technique requires all geometries in the dataset to be described by an equal number of points that are at the same relative location on each shape. This so-called point correspondence model (PCM) was created using the 3D Shape Context method written for matlab (version R2013a; Mathworks, Natick, MA, USA), that was developed by Kroon et al. (Kroon 2011, Kroon et al. 2012). An arbitrary dataset member was chosen as the reference shape. The surface points of this reference geometry were non-rigidly registered to the remaining 34 dataset members, resulting in 7814 corresponding landmark points on each meniscal surface. By omitting the scaling step as described by Cootes et al. (1995), the PCM contained information on both size and shape variations of the medial meniscus.
The re-segmented meniscus models were landmarked as well. The root mean square error (RMSE) of the difference between the landmark locations on the original and duplicate models was determined as a measure of intra- and inter-observer reliability. The RMSE was 0.29 ± 0.08 mm (mean ± SD) for the intra-observer segmentations and 0.27 ± 0.11 mm for the inter-observer segmentations. These values are less than the size of one pixel in the original MRI scans, and were therefore considered to be acceptable.
The statistical shape model was built from the PCM using principal component analysis (PCA). Briefly, the mean meniscal shape was determined, together with the differences between each dataset member and the mean shape. Singular value decomposition of the difference covariance matrix resulted in a set of eigenvectors and eigenvalues (λ). The eigenvectors each give an uncorrelated mode of variation of meniscal geometry. The eigenvalues describe the amount of variance explained by each eigenvector. These properties of PCA allow separating size variation from shape variation, since in the former situation all meniscal dimensions change in a correlated way (i.e. a certain scaling factor is applicable), while for shape changes the meniscal dimensions change independently of each other. As such, multiple modes of uncorrelated shape changes can be distinguished.
To determine which principal components (PCs) make a significant contribution to medial meniscus geometry variation, a parallel analysis was performed (Horn, 1965). This procedure aims at identifying the PCs that contain variation larger than the expected variation from noise. Pseudorandom matrices were generated with the same number of variables (landmark points) and samples (subjects) as the original dataset. Since the PCA comprised singular value decomposition of the covariance matrix, the generated datasets were additionally restricted to have variable means and SDs identical to the original data (Franklin et al. 1995). After identifying the number of significant PCs, the non-significant ones were removed from the statistical shape model.
To describe the characteristic geometry changes within each PC, the landmark positions were varied within the ± 3√λ range of the significant PCs, which corresponds to the plus or minus three SDs of the mean. The resulting geometries were further evaluated, following the set of 2D size measurements for meniscus geometry evaluation as introduced by Haut et al. (2000). First, points A, P and C, which were used earlier for the alignment of the original meniscus geometries, were identified on each reconstructed surface using the PCM. Next, each 3D meniscus geometry was projected onto its transverse plane. Two extra points were defined to represent the most lateral points on the anterior and posterior meniscal horn; Ah and Ph, respectively (Fig. 1A). Four dimensions were determined, which are further defined in Fig. 1A: total length (LT), gap length (LG), anterior width (WA) and posterior width (WP). Transverse geometry was then described by LT, WA, WP, the gap ratio (RG = LG/LT) and the length–width ratio (RLW = LT/WP). The gap ratio is a measure for the relative coverage of the tibia plateau cartilage by meniscal tissue, whereas the length–width ratio indicates whether the meniscus has a more semi-circular or semi-oval shape.
For further analysis of the variations in cross-sectional geometry of the menisci, point M, the intersection between line AhPh and its normal throughpoint C, was taken as the center of a semi-circle. The semi-circle was divided into 10 equal parts, thereby defining cross-sections A1 to A3, M1 to M3 and P1 to P3 (Fig. 1B). These cross-sections were plotted in a (x′, z)-coordinate frame, resulting in the definition of five additional dimensions: maximum height (H), maximum width (W), bulge (B), the height of the concave part of the meniscus (H0), and the width of the meniscus tissue that is in contact with the femoral cartilage (W0) (Fig. 1C). Cross-sectional geometry was then described by maximum height, maximum width, bulge, the height ratio (H/H0) and the slope (H0/W0), following the parameters introduced in Fig. 1C. For each geometry at the ± 3√λ limit of the significant PCs, all transverse and cross-sectional size parameters were determined, and the percentage change with respect to the mean geometry was reported. The dimensions for the anterior, mid and posterior regions were averaged as suggested by Haut et al. (2000).
To evaluate whether certain geometry characteristics are gender-dependent, each meniscus from the original dataset was reconstructed by a combination of the mean meniscus geometry plus a linear combination of the significant PCs (Cootes et al. 1995). The RMSE between the original and reconstructed geometries was 0.22 ± 0.03 mm (mean ± SD). The weight factors for each PC were subsequently compared for the female and male subset by an independent samples t-test. A P < 0.05 was considered significant.
Cluster analysis allows subdividing a dataset into groups with similar characteristics, e.g. geometry, such that the groups maximally differ from each other. Therefore it can be used to identify different meniscal morphologies. In our case, k-means clustering was used to categorize all menisci in the training set. The optimal number of clusters was determined through evaluation of the gap statistic for 1–10 clusters (Tibshirani et al. 2001). The differences between the mean weight factors for each PC in each cluster were compared using a one-way anova test, using the Bonferroni correction for multiple comparisons. P < 0.05 was considered significant.
Results
The eigenvalues of the dataset generated within the parallel analysis exceeded those of the meniscus training set from PC 7 onward, indicating a noise level of 16.6% in the original data set. Therefore, the first six PCs were considered to be significant and were included in the final statistical shape model. The first PC accounted for most of the variation in medial meniscus geometry (53.8%), PCs 2–6 add 9.1–4.1% to the explained variation (Fig. 2). PC 1 mainly involves changes in size (Fig. 2), as the parameters directly related to overall surface geometry (transverse plane total length, posterior width, anterior width, and cross-sectional width and height) all changed, with a ratio that was approximately similar within the ± 3√λ range (Figs 3 and 4). PC 2 is explained by changes in the anterior horn curve (Fig. 2), a change that could not be observed from the evaluation of the 2D parameters describing internal meniscus geometry. The internal parameters primarily revealed changes of the slope and some changes of the other height-related parameters (Fig. 4). PC 3 affected the length–width ratio by changes in both total length and width (Figs 2 and 3), together with height and slope related changes that were most prominent in the posterior horn (Fig. 4). PC 4 accounts for a change in length–width ratio as well; however, only through changes in width of the meniscus (Figs 2 and 3). Although overall height was not affected by PC 4, the height ratio and particularly the slope were affected to a large extent, which was most noticeable in the anterior region (Fig. 4). PCs 5 and 6 hardly explain any variation in transverse plane geometry, yet the cross-sectional plane parameters all show considerable variation (Fig. 4). Within PC 6, the remarkable change is the shift in location of the valley point C along the inner circumference (Fig. 2), changing the size of the anterior and posterior regions. Overall, the changes in the cross-sectional plane were relatively larger than those in the transverse plane.
Fig. 2.

Superior view of the effect of varying the first six modes of meniscus geometry variation individually within their ± 3√λ range. The color variations represent the change of meniscal height and the arrows illustrate the most prominent changes observed for each principal component. The percentages represent the contribution of each PC to the total amount of geometry variation described by the statistical shape model.
Fig. 3.
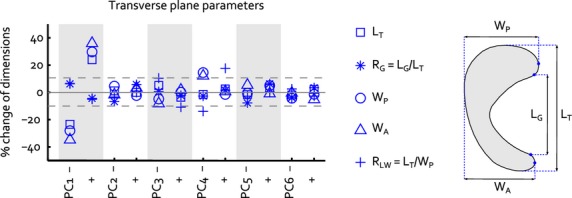
Change of the transverse plane 2D size parameters within the ± 3√λ range of each separate principal component. The dashed lines represent the ± 10% size changes that Dienst et al. (2007) identified as critical values for changes in contact mechanics. Figure 1A is repeated to illustrate the definition of each transverse plane parameter.
Fig. 4.
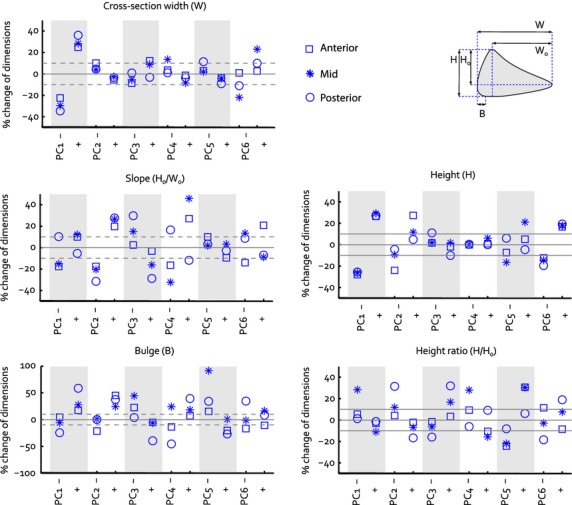
Change of the cross-sectional plane 2D size parameters within the ± 3√λ range of each separate principal component. Each plot consists information on the changes observed for one individual parameter, within the anterior, mid and posterior regions of the meniscus. The dashed lines represent the ± 10% size changes that Dienst et al. (2007) identified as critical values for changes in contact mechanics. Figure 1C is repeated to illustrate the definition of the parameters plotted in the graphs.
Male and female menisci only differed significantly regarding PC 1, which mainly reflects size (P < 0.001, Fig. 5A). The average geometries for males and females in our dataset are displayed in Fig. 6A. Following the maximum value of the gap statistic, the training set was clustered into four groups. The mean meniscus geometries of the four morphological groups resulting from the cluster analysis are shown in Fig. 6B. Cluster 1 comprised females only (n = 8), cluster 2 consisted of 10 males and only one female, cluster 3 was a mix of males (n = 4) and females (n = 3) and cluster 4 contained eight females and one male. The mean reconstruction weight factors per cluster (Fig. 5B) illustrate that clusters 1 and 2 mainly have been created based on size, whereas for clusters 3 and 4, PC 2, which involves shape changes related to height and slope, plays a more important role. Thus, cluster 3 contains relatively small male menisci and larger female menisci, which are thicker and have a steeper slope. The menisci in cluster 4 are also somewhat larger than the average female menisci, but are thinner as well. The cluster coefficients for PC 1 were all significantly different from each other (P < 0.001), whereas for PC 2, significant differences were observed between clusters 1 and 3 (P = 0.03), clusters 2 and 3 (P = 0.003) and clusters 3 and 4 (P < 0.001). For PC 3–6, no statistically significant differences were observed between the weight factors for all four clusters.
Fig. 5.
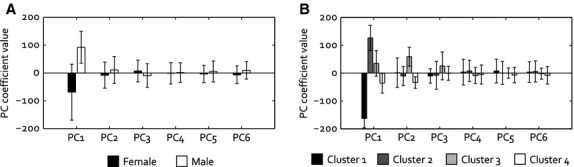
Principal component weight factors (mean ± SD) for the reconstruction of (A) the mean female and male menisci and (B) the mean meniscal geometry of clusters 1–4.
Fig. 6.
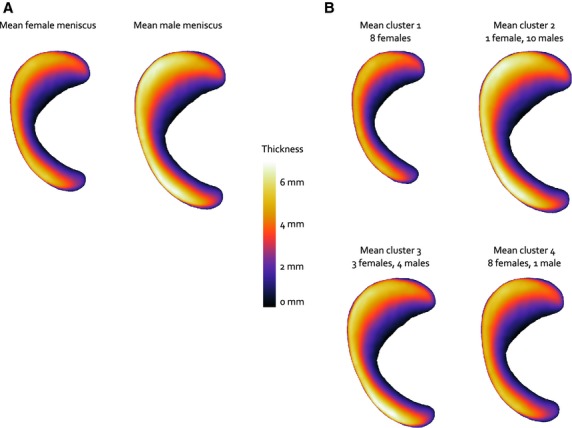
Mean geometries (A) for female and male menisci and (B) for the four clusters. The color variations represent the change of meniscal height.
Discussion
In this study, a statistical shape modeling approach was adopted to evaluate the most important modes of variation of 3D meniscus geometry. Six PCs contributed significantly to variation of medial meniscus geometry. More than half of this variation could be attributed to changes that predominantly represent size (PC 1), whereas approximately one-third involved pure shape changes (PCs 2–6). These shape changes were more prominent in the cross-sectional plane than in the transverse plane.
Gender-dependent differences were observed for PC 1 only, indicating that female menisci are smaller than male ones, but also that gender does not influence the shape of the meniscus. Gender-related shape differences were identified for the bony structures of the tibiofemoral joint, involving differences in the length–width ratio of the femur and the curvature of the femoral condyles (Mahfouz et al. 2012). An explanation for the absence of these sex-related shape differences in the meniscus may be the adaptability of this tissue. With increasing knee flexion, the medial meniscus deforms and moves posteriorly on the tibia plateau, to maintain optimal congruency between the femur and tibia (van Tienen et al. 2005). Therefore, intrinsic meniscal shape differences between the sexes are apparently not necessary to cope with the relatively subtle gender-dependent differences in bony geometry of the knee.
Our cluster analysis identified four groups, of which three (clusters 1, 2 and 4) only differed significantly in parameters that are predominantly size-related, whereas cluster 3 contains menisci that have different shape characteristics compared with the other three clusters. We can therefore conclude that this analysis revealed two different meniscal shapes. These two morphological groups mainly differ in height. From a finite element analysis, Donahue et al. concluded that cartilage contact mechanics is most sensitive to changes in medial meniscus height. In their analyses, a change in meniscus height of only 0.5-mm caused a change of more than 10% in knee cartilage contact mechanics (Donahue et al. 2004). As the height differences we observed between the mean menisci of clusters 1 and 4 on the one hand and cluster 3 on the other hand considerably exceed 0.5 mm, this subdivision may have important implications for the functional grouping of medial menisci as well.
The results of this study did not reveal pronounced differences in local geometry changes in the anterior, mid and posterior regions. However, in the human knee joint, the mid and posterior aspects of the medial meniscus are more heavily loaded than the anterior part (Lee et al. 2006; Bedi et al. 2010; Seitz et al. 2012). Similar geometry changes may therefore differently affect cartilage contact mechanics in each individual region. Hence, to use the outcomes of this study to optimally select a meniscal allograft or to design a synthetic meniscal replacement, it is necessary to additionally identify the modes of meniscus geometry variation that cause significant changes in cartilage contact mechanics. Such sensitivity analysis could be performed using a finite element model of the knee joint. Donahue et al. (2004) previously reported the results of a finite element study in which they evaluated the effects of varying meniscus dimensions on tibiofemoral contact pressures. In that study, four geometric parameters were investigated, yet these varied independently, which does not represent the geometry variation identified in this study. The statistical shape model established in this study allows creating new meniscal geometries for which the correlated parameters can be varied in a combined fashion, following the PCs.
Some limitations should be considered when interpreting the results of this study. Meniscal geometry was extracted from MR images by manual segmentation, rather than via a direct method. Bowers et al. (2007) validated that meniscal volume could accurately be determined from three Tesla MR images with 1 × 1 × 1 mm voxels, which is eight times the voxel size used in this study. A similar validation study for meniscal geometry (e.g. using 3D laser scanning techniques) is likely hampered by meniscal deformation when the tissue is removed from the knee joint, and is therefore not expected to provide more accurate data than segmentations from MR images.
Another limitation concerns the limited sample size used in this study. In order to use the 3D medial meniscus statistical shape model as presented in this study for implant design purposes, a model is needed that is based on a representative sample of the population covering both commonly observed geometries and extremes. Our population size was limited, yet meniscal length of the dataset stretched to the maximum value observed in a study including almost 500 medial menisci (Van Thiel et al. 2009). The minimal meniscal length observed in our study was considerably larger than that in the large dataset, possibly arising from the fact that around 20% of the subjects included by Van Thiel et al. was aged 18 or younger and may not have been skeletally mature (McKern & Stewart, 1957). However, we were only interested in meniscal shape variations within a full-grown population. Also, the ethnicity of the subjects in our study was not known, although it is likely to be Caucasian. As proximal tibia and distal femur morphology differs between ethnic groups (Mahfouz et al. 2012), ethnicity could affect meniscal geometry as well. These factors may limit the ability of our statistical shape model to generate meniscal geometries for a skeletally mature, Caucasian population only.
In conclusion, this is the first study to describe medial meniscus geometry from a 3D perspective. A majority of the geometry variation could be attributed to size-related changes rather than shape changes. The difference between male and female menisci is predominantly size-based. Nevertheless, when evaluating the full dataset we were able to identify two morphological groups with distinct meniscal shapes, which are mainly characterized by differences in meniscal height. Further research is needed to determine whether the meniscal shape variations identified in this study actually influence meniscal functioning.
Acknowledgments
This research forms part of the Project P2.03 TRAMMPOLIN of the research program of the BioMedical Materials Institute, co-funded by the Dutch Ministry of Economic Affairs.
Authors’ contributions
A.C.T.V., T.G.v.T., D.J., P.B., N.V.: study concepts and design. M.J.P.: acquisition and selection of MR images. A.C.T.V.: data acquisition and analysis, writing first draft of manuscript. S.P.M.C., C.O.K.: assistance with data analysis and statistical shape modeling. A.C.T.V., D.J., N.V.: data interpretation. A.C.T.V., S.P.M.C., M.J.P., C.O.K., T.G.v.T., D.J., P.B., N.V.: critical revision of the manuscript.
References
- Ahmed AM, Burke DL. In-vitro measurement of static pressure distribution in synovial joints – Part I: Tibial surface of the knee. J Biomech Eng. 1983;105:216–225. doi: 10.1115/1.3138409. [DOI] [PubMed] [Google Scholar]
- Alhalki MM, Hull ML, Howell SM. Contact mechanics of the medial tibial plateau after implantation of a medial meniscal allograft. A human cadaveric study. Am J Sports Med. 2000;28:370–376. doi: 10.1177/03635465000280031501. [DOI] [PubMed] [Google Scholar]
- Arno S, Hadley S, Campbell KA, et al. The effect of arthroscopic partial medial meniscectomy on tibiofemoral stability. Am J Sports Med. 2013;41:73–79. doi: 10.1177/0363546512464482. [DOI] [PubMed] [Google Scholar]
- Baldwin MA, Langenderfer JE, Rullkoetter PJ, et al. Development of subject-specific and statistical shape models of the knee using an efficient segmentation and mesh-morphing approach. Comput Methods Programs Biomed. 2010;97:232–240. doi: 10.1016/j.cmpb.2009.07.005. [DOI] [PubMed] [Google Scholar]
- Balint E, Gatt CJ, Jr, Dunn MG. Design and mechanical evaluation of a novel fiber-reinforced scaffold for meniscus replacement. J Biomed Mater Res A. 2011;100:195–202. doi: 10.1002/jbm.a.33260. [DOI] [PMC free article] [PubMed] [Google Scholar]
- Bedi A, Kelly NH, Baad M, et al. Dynamic contact mechanics of the medial meniscus as a function of radial tear, repair, and partial meniscectomy. J Bone Joint Surg Am. 2010;92:1398–1408. doi: 10.2106/JBJS.I.00539. [DOI] [PubMed] [Google Scholar]
- Bloecker K, Englund M, Wirth W, et al. Size and position of the healthy meniscus, and its correlation with sex, height, weight, and bone area – a cross-sectional study. BMC Musculoskelet Disord. 2011;12:248. doi: 10.1186/1471-2474-12-248. [DOI] [PMC free article] [PubMed] [Google Scholar]
- Bowers ME, Tung GA, Fleming BC, et al. Quantification of meniscal volume by segmentation of 3T magnetic resonance images. J Biomech. 2007;40:2811–2815. doi: 10.1016/j.jbiomech.2007.01.016. [DOI] [PMC free article] [PubMed] [Google Scholar]
- Cootes TF, Taylor CJ, Cooper DH, et al. Active shape models – their training and application. Comput Vis Image Underst. 1995;61:38–59. [Google Scholar]
- Dienst M, Greis PE, Ellis BJ, et al. Effect of lateral meniscal allograft sizing on contact mechanics of the lateral tibial plateau: an experimental study in human cadaveric knee joints. Am J Sports Med. 2007;35:34–42. doi: 10.1177/0363546506291404. [DOI] [PubMed] [Google Scholar]
- Donahue TLH, Hull ML, Rashid MM, et al. The sensitivity of tibiofemoral contact pressure to the size and shape of the lateral and medial menisci. J Orthop Res. 2004;22:807–814. doi: 10.1016/j.orthres.2003.12.010. [DOI] [PubMed] [Google Scholar]
- Elsner JJ, Portnoy S, Guilak F, et al. MRI-based characterization of bone anatomy in the human knee for size matching of a medial meniscal implant. J Biomech Eng. 2010;132:101008. doi: 10.1115/1.4002490. [DOI] [PubMed] [Google Scholar]
- Felson DT, Lawrence RC, Dieppe PA, et al. Osteoarthritis: new insights. Part 1: the disease and its risk factors. Ann Intern Med. 2000;133:635–646. doi: 10.7326/0003-4819-133-8-200010170-00016. [DOI] [PubMed] [Google Scholar]
- Franklin SB, Gibson DJ, Robertson PA, et al. Parallel Analysis: a method for determining significant principal components. J Veg Sci. 1995;6:99–106. [Google Scholar]
- Haut TL, Hull ML, Howell SM. Use of roentgenography and magnetic resonance imaging to predict meniscal geometry determined with a three-dimensional coordinate digitizing system. J Orthop Res. 2000;2000:228–237. doi: 10.1002/jor.1100180210. [DOI] [PubMed] [Google Scholar]
- Horn JL. A rationale and test for the number of factors in factor analysis. Psychometrika. 1965;30:179–185. doi: 10.1007/BF02289447. [DOI] [PubMed] [Google Scholar]
- Huttenlocher DP, Klanderman GA, Rucklidge WJ. Comparing images using the Hausdorff distance. IEEE Trans Pattern Anal Mach Intell. 1993;15:850–863. [Google Scholar]
- Kobayashi M, Chang YS, Oka M. A two year in vivo study of polyvinyl alcohol-hydrogel (PVA-H) artificial meniscus. Biomaterials. 2005;26:3243–3248. doi: 10.1016/j.biomaterials.2004.08.028. [DOI] [PubMed] [Google Scholar]
- Kon E, Filardo G, Tschon M, et al. Tissue engineering for total meniscal substitution: animal study in sheep model-results at 12 months. Tissue Eng Part A. 2012;18:1573–1582. doi: 10.1089/ten.TEA.2011.0572. [DOI] [PubMed] [Google Scholar]
- Kroon DJ. 2011. Shape context based corresponding point models. Matlab Central File Exchange.
- Kroon DJ, Reeuwijk E, Kowalski P, et al. MRI based knee cartilage assessment. 2012. Proceedings of SPIE - Medical Imaging 2012: Computer-Aided Diagnosis, 8315, 83151V.
- Lee SJ, Aadalen KJ, Malaviya P, et al. Tibiofemoral contact mechanics after serial medial meniscectomies in the human cadaveric knee. Am J Sports Med. 2006;34:1334–1344. doi: 10.1177/0363546506286786. [DOI] [PubMed] [Google Scholar]
- Levy IM, Torzilli PA, Warren RF. The effect of medial meniscectomy on anterior-posterior motion of the knee. J Bone Joint Surg Am. 1982;64:883–888. [PubMed] [Google Scholar]
- Mahfouz M, Abdel Fatah EE, Bowers LS, et al. Three-dimensional morphology of the knee reveals ethnic differences. Clin Orthop Relat Res. 2012;470:172–185. doi: 10.1007/s11999-011-2089-2. [DOI] [PMC free article] [PubMed] [Google Scholar]
- McDermott ID, Sharifi F, Bull AM, et al. An anatomical study of meniscal allograft sizing. Knee Surg Sports Traumatol Arthrosc. 2004;12:130–135. doi: 10.1007/s00167-003-0366-7. [DOI] [PubMed] [Google Scholar]
- McKern TW, Stewart TD. 1957. Skeletal Age Changes in Young American Males, Analysed from the Standpoint of Age Identification. Natick, MA: Headquarters Quartermaster Research and Development Command, Technical Report EP-45.
- Paletta GA, Manning T, Snell E, et al. The effect of allograft meniscal replacement on intraarticular contact area and pressures in the human knee. Am J Sports Med. 1997;25:692–698. doi: 10.1177/036354659702500519. [DOI] [PubMed] [Google Scholar]
- Pollard ME, Kang Q, Berg EE. Radiographic sizing for meniscal transplantation. Arthroscopy. 1995;11:684–687. doi: 10.1016/0749-8063(95)90110-8. [DOI] [PubMed] [Google Scholar]
- Prodromos CC, Joyce BT, Keller BL, et al. Magnetic resonance imaging measurement of the contralateral normal meniscus is a more accurate method of determining meniscal allograft size than radiographic measurement of the recipient tibial plateau. Arthroscopy. 2007;23:1174–1179.e1. doi: 10.1016/j.arthro.2007.06.018. [DOI] [PubMed] [Google Scholar]
- Schumacher BL, Schmidt TA, Voegtline MS, et al. Proteoglycan 4 (PRG4) synthesis and immunolocalization in bovine meniscus. J Orthop Res. 2005;23:562–568. doi: 10.1016/j.orthres.2004.11.011. [DOI] [PubMed] [Google Scholar]
- Seitz AM, Lubomierski A, Friemert B, et al. Effect of partial meniscectomy at the medial posterior horn on tibiofemoral contact mechanics and meniscal hoop strains in human knees. J Orthop Res. 2012;30:934–942. doi: 10.1002/jor.22010. [DOI] [PubMed] [Google Scholar]
- Shaffer B, Kennedy S, Klimkiewicz J, et al. Preoperative sizing of meniscal allografts in meniscus transplantation. Am J Sports Med. 2000;28:524–533. doi: 10.1177/03635465000280041301. [DOI] [PubMed] [Google Scholar]
- Spang JT, Dang AB, Mazzocca A, et al. The effect of medial meniscectomy and meniscal allograft transplantation on knee and anterior cruciate ligament biomechanics. Arthroscopy. 2010;26:192–201. doi: 10.1016/j.arthro.2009.11.008. [DOI] [PubMed] [Google Scholar]
- Stone KR, Freyer A, Turek T, et al. Meniscal sizing based on gender, height, and weight. Arthroscopy. 2007;23:503–508. doi: 10.1016/j.arthro.2006.12.025. [DOI] [PubMed] [Google Scholar]
- Tibshirani R, Walther G, Hastie T. Estimating the number of clusters in a data set via the gap statistic. J R Stat Soc Series B Stat Methodol. 2001;63:411–423. [Google Scholar]
- van Tienen TG, Buma P, Scholten JG, et al. Displacement of the medial meniscus within the passive motion characteristics of the human knee joint: an RSA study in human cadaver knees. Knee Surg Sports Traumatol Arthrosc. 2005;13:287–292. doi: 10.1007/s00167-004-0511-y. [DOI] [PubMed] [Google Scholar]
- van Tienen TG, Heijkants RG, de Groot JH, et al. Replacement of the knee meniscus by a porous polymer implant: a study in dogs. Am J Sports Med. 2006;34:64–71. doi: 10.1177/0363546505280905. [DOI] [PubMed] [Google Scholar]
- Van Thiel GS, Verma N, Yanke A, et al. Meniscal allograft size can be predicted by height, weight, and gender. Arthroscopy. 2009;25:722–727. doi: 10.1016/j.arthro.2009.01.004. [DOI] [PubMed] [Google Scholar]
- Vrancken AC, Buma P, van Tienen TG. Synthetic meniscus replacement: a review. Int Orthop. 2012;37:291–299. doi: 10.1007/s00264-012-1682-7. [DOI] [PMC free article] [PubMed] [Google Scholar]
- Walker PS, Erkman MJ. The role of the menisci in force transmission across the knee. Clin Orthop Relat Res. 1975;109:184–192. doi: 10.1097/00003086-197506000-00027. [DOI] [PubMed] [Google Scholar]
- Wirth W, Frobell RB, Souza RB, et al. A three-dimensional quantitative method to measure meniscus shape, position, and signal intensity using MR images: a pilot study and preliminary results in knee osteoarthritis. Magn Reson Med. 2010;63:1162–1171. doi: 10.1002/mrm.22380. [DOI] [PubMed] [Google Scholar]