

Abstract
Entry into adolescence is marked by dramatic changes resulting from a dynamic interplay among biological and psychosocial processes. Despite the complexity, development is often indexed only by age in ERP studies. To broaden this approach, we address the effects of gender and pubertal development, along with age, in adolescents using a psychophysiological probe of decision making, the P300 component. Overall, females exhibited shorter P300 latencies and smaller P300 amplitudes compared to males, suggesting more efficient information processing. In both genders, P300 latency and amplitude also diminished as age and pubertal status increased, again suggesting increasing efficiency of information processing with development. Our findings highlight the necessity of considering more than age when examining cognitive functioning in adolescents, and in particular, the necessity of considering gender whenever developmental issues are addressed.
Entry into adolescence is marked by changes in biological, cognitive, and psychosocial functioning that are sufficiently dynamic for this period to be considered a developmental “hot zone” (Dahl & Spear, 2004; Choudhury, Blakemore, & Charman, 2006; Yergulun-Todd, 2007; Steinberg, 2005). These changes vary in timing and tempo, and may show desynchronous cycles of progress and regress, both within a single individual and across individuals (see articles in Faden & Goldman, 2008; and Dorn, 2006; Giedd et al., 2006; and Hussong, 2011). Some changes may arise from accumulating experience (e.g., academic skills), other changes from general growth (e.g., height, weight), and others from processes specific to adolescence (e.g., the onset of biological puberty. At the most general level of brain development, researchers have described an inverted U-shape in grey matter due to the counter processes of growth and synaptic pruning (Huttenlocher, 1999; Whitford et al., 2007), along with a steady increase in white matter due to increasing axonal myelination (e.g., Pfefferbaum et al., 1994).
The actuation of specific developmental changes almost always results from a dynamic interplay between biological and psychosocial processes (Masten, Faden, Zucker, & Spear, 2008). Pubertal onset may further energize this interplay (Spear, 2000, 2011; Graber & Petersen, 1991). Females typically reach sexual maturity 1 to 2 years before their age-matched male counterparts (Marshall, 1986) and females' brains also reach maturity (indexed by cortical thickness) at the same accelerated timeframe (Giedd et al., 2006), irrevocably separating the developmental courses of males and females. Recent reports highlight specific functional and structural differences between male and female brains during pubertal development that underlie behavioral and cognitive differences (Lenroot & Giedd, 2010; Peper et al., 2011; Raznahan et al., 2011; Lopez-Larson et al., 2011). For example, sex differences are reported in brain structure (Blakemore, Burnett, & Dahl, 2010), including those structures associated with executive and affective processing (Bramen et al., 2011), white and gray matter distribution (De Bellis et al., 2001; Giedd et al., 1999), and brainwave components that are associated with executive functions (i.e., the Error Related Negativity (ERN); Davies, Segalowitz, & Gavin, 2004; Segalowitz, Santesso, & Jetha, 2010).
Despite the complexity of development and the multiple processes involved, development is often indexed in research only by age. In the present study, we report on a first attempt to assess the parallel influence of increasing experience (which might be revealed as age-related increments), pubertal changes common to both sexes (which might be seen in both sexes as puberty advances, regardless of the age at which it happens), and sex differences themselves (which would result in male/female differences) in connection with unfolding changes in information processing. To this end, we use a time lagged design across the early portion of the pubertal transition, along with sufficient numbers of male and female participants to statistically power differentiation by sex, if a differentiation is possible.
Neurobiological changes associated with pubertal development have been described in some detail over the last five years, but very few studies have examined the correspondence between changes in information processing and neurobiological changes. A few studies have related structural changes seen in brain imaging to specific behavioral changes. It is equally important, however, to examine the correspondence between functional changes in brain processing and information processing changes that can be measured at the behavioral level.
To this end, the assessment of Event Related Potentials (ERPs) is well suited for integrating the neurobiological and cognitive domains, as it characterizes brain activity with fine-grained temporal resolution that is tied to defined events. For our purposes, we chose the P300 component of the ERP signal, which is elicited by rare events that are less expected within a specific task context as participants are called upon to make decisions about responding to specific cues (often an “oddball” task; see below). We chose this task because it elicits reliable and robust P300 waveforms and indexes information processing broadly. In an effort to further highlight possible differences in cognitive development, the current study used linguistic visual stimuli, which are more cognitively demanding than the single letters (e.g., X's and O's) typically used.
Two aspects of this brainwave component have been used to study the development of information processing throughout the lifespan, including during this critical period of adolescence (albeit in the absence of the capacity to make the distinctions we describe above). The latency of the P300 is sensitive to the complexity of the decision task (shorter latencies reflecting more efficient or less demanding decision-making). P300 latency tends to decrease from childhood to late adolescence (Goodin et al., 1978; Courchesne, 1978; Polich, Ladish & Burns, 1990; Mullis, Holcomb, Diner, & Dykman, 1985), and continues to decrease until early adulthood before gradually increasing with continued aging (Iragui et al., 1993; Picton et al., 1984). The amplitude of the P300 is affected by level of resources allocated to the task, with smaller amplitudes reflecting either fewer resources allocated or fewer resources available to be allocated to the task. Studies using visual oddball tasks, similar to the one utilized below, typically report decreased P300 amplitude across adolescence (Mullis et al., 1985; Katsanis, Iacono, & McGue, 1996; Pfeuller et al., 2011).
The developmental changes previously reported in the P300 ERP literature have been attributed to maturation of information processing systems during childhood and adolescence, but these studies have most often used age as the only proxy for development (older is presumed to reflect more development) (e.g., Mullis et al., 1985, Katsanis et al., 1996). Gender differences were rarely examined, although in many cases, the proportion of males and females differed between reports, leading to the possibility that results were driven to some degree by the effect of gender. In other cases, gender differences were considered but studies may have been underpowered to detect significant differences. Perhaps more striking is that we could not identify any study in which pubertal status was investigated as a possible developmental influence.
The present report examines developmental changes in information processing as measured by the P300 to assess the possible differential influence of chronological age, gender, and pubertal development on a behavioral decision making task and its underlying functional biological underpinnings. We used a sufficiently a large sample of males and females to allow for separation of sex as a possible determinant of information processing development. We longitudinally assessed both sexes in the age range of 8.5 to 13.5 to ascertain developmental changes in information processing and one of its functional biological substrates. Finally, we assessed pubertal onset to attempt a separation between the effects of aging alone and those of pubertal development.
Method
Participants
One hundred and thirty-one children were recruited from a larger ongoing longitudinal study made up of same sex sibling pairs1. Data from 114 participants were included in the ERP analyses. The other participants were excluded due to: incomplete data (n=4), excessive noise in the data (n=6), or failure to follow task directions (n=7). Fifteen participants declined to give pubertal development data and were excluded from the analyses addressing pubertal development, leaving a total sample of 99 participants for these analyses (see Table 1). The sample ranged in age from 8.4-13.4 (mean age = 10.8, SD = 1.22) and was roughly equally distributed across gender (47% female). Each participant's primary language was English and each had normal or corrected to normal vision. Ninety-one percent of the sample was right handed. Data collection began after assent was obtained from the participant and the parents signed a consent form. Participants were paid for their time.
Table 1. Gender comparisons of Age and Puberty as well as Hit Rate and Reaction Time from the Oddball Task.
| Gender | Mean | SD | t | p | |
|---|---|---|---|---|---|
| Age | Female (N=54) | 10.75 | 1.15 | -.31 | .76 |
| Male (N=60) | 10.82 | 1.28 | |||
|
| |||||
| Puberty | Female (N=43) | 2.15 | .73 | 3.52 | <.001 |
| Male (N=56) | 1.71 | .51 | |||
|
| |||||
| Hits (out of 40 possible) | Female (N=51) | 37.84 | 3.6 | .56 | .58 |
| Male (N=58) | 37.48 | 3.07 | |||
|
| |||||
| RT (in ms) to rare stimuli | Female (N=51) | 798.56 | 123.32 | -3.93 | <.001 |
| Male (N=58) | 898.44 | 139.93 | |||
Data Acquisition & Signal Processing
The Electrical Geodesics Inc. (EGI; Eugene, OR) System 200 was used to acquire and analyze dense-array electroencephalogram (EEG) data. The EEG was recorded using 129-channel HydroCel Geodesic Sensor Nets from EGI. The EEG was continuously recorded at a 250Hz sampling rate with a vertex reference. The electrode impedances were kept below 50 kΩ. The continuous EEG data were filtered using an offline 40Hz low-pass filter. The filtered data were then segmented into epochs, each starting 200 ms before stimulus presentation and ending 800 ms after the stimulus. Ocular artifacts were removed offline using an algorithm developed by Gratton, Coles, and Donchin (1983). Averages of the ocular-corrected and artifact-free epochs were calculated for each stimulus type, after baseline correcting each average over the 200 ms pre-stimulus baseline. The averaged EEG epochs were re-referenced to linked mastoids.
Procedure
As mentioned above, participants were recruited from a larger longitudinal study. Participants agreed to complete two ERP data sessions 9-12 months apart. The data presented here are from the first ERP data collection session only. Participants completed the Pubertal Developmental Scale (PDS) along with other demographic measures during a separate one visit to the lab within one month on either side of the initial ERP session.
Measures
Pubertal Development Scale (PDS; Peterson et al., 1988)
Although hormonal changes could be assessed through bioassays (blood or saliva), such assays require great temporal precision (e.g., Dabbs, 1990), incur great cost, and may be less informative for pubertal staging than might be anticipated (Dorn et al., 2006). In contrast, observable “pubertal stage…[is]…a strong statistical predictor of testosterone in boys and estradiol in girls (Dorn et al., 2003, p. 322).” To assess observable physical changes associated with puberty, we used the PDS, a self-report instrument designed for adolescents to report development on five indices of pubertal growth. The PDS reliably indexes pubertal development non-invasively and inexpensively, and has been shown to index pubertal development commensurate with more involved measures (e.g., Bond et al., 2006). Participants rated their pubertal development on a 4-point scale (1 = no development, 2 = development had barely begun, 3 = development was definitely under way, 4 = development was complete) on three characteristics (growth spurt in height, body hair, skin change/pimples). Additionally, males were asked to rate their development of facial hair and voice deepening on the same scale. Females were asked to rate their breast development (on the four point scale) and to indicate whether or not they had begun to menstruate (binary rating). This measure was completed at a separate session from the ERP data collection. A total score was derived based of on the sum of the PDS items.
ERP data collection
Each participant sat in a comfortable chair about 60 cm from a computer monitor. A research assistant was present in the experimental room to confirm that the participant was compliant. The participant was presented with a visual oddball task consisting of 200 trials with word stimuli from two categories (e.g., furniture and animals). For each trial a fixation mark was presented for 1000 ms followed by a word presented for 1900 ms. Participants were instructed to respond to one category, which was presented at a probability of .2, by pressing a button on a response pad. Words from the two categories were matched for length and frequency.
Data Processing
Development
To characterize development as it related to behavioral and ERP data, we used chronological age and pubertal development scores from the PDS. Because pubertal development is, within the age range of early adolescence, to some extent confounded with gender (girls, on average, mature earlier), we took gender into account in analyses. As expected, females reported higher levels of pubertal development compared to males (Table 1), and age and pubertal development were highly correlated in this sample (r=.51; Table 3).
Table 3. Correlations among demographic variables and Oddball task measures.
| Age | Puberty | RT | P3 Latency | P3 Amplitude | |
|---|---|---|---|---|---|
| Age | -- | .51* | -.40* | -.17 | -.22* |
| Puberty | .51* | -- | -.45* | -.19 | -.37* |
| RT | -.40* | -.45* | -- | .27* | .36* |
| P3 Latency | -.17 | -.19 | .27* | -- | .22* |
| P3 Amplitude | -.22* | -.37* | .36* | .22* | -- |
p<.01
Our developmental indices (e.g., age and pubertal development) were treated as continuous variables for the main regression analyses. We also grouped these indices for use in analysis of variance (ANOVA), so as to make available statistical tests that paralleled the graphic presentations that have been traditionally so informative for ERP data. For these ANOVAs, participants were divided into age quartiles (8.4–9.8, 9.9–10.5, 10.6–11.8, and 11.9–13.5). The distribution of participants in each age group is presented in Table 2. Similarly, participants were divided into four levels of pubertal development using quartiles based on PDS total scores (lowest 25%, low-mid 25%, mid-high 25%, and highest 25%). Despite the gender differences in pubertal development, the minimum representation of any one gender in the pubertal score quartiles was 30% (the lowest pubertal development group was 30% female and the highest pubertal development group was 30% male), which provided some opportunity to separate gender from age and pubertal status in the analyses.
Table 2. P300 Latency from virtual ERPs and RT by age group and gender.
| Gender | N | Total N | P300 latency in ms (SD) | RT to rare stimuli in ms (SD) | |
|---|---|---|---|---|---|
| 8.4-9.8 | Female | 13 | 28 | 632.9 (105.8) | 869.3 (38.4) |
| Male | 15 | 681.3 (82.1) | 972.7 (32.0) | ||
|
| |||||
| 9.9-10.5 | Female | 12 | 30 | 649.0 (111.8) | 811.0 (45.2) |
| Male | 18 | 719.11 (85.9) | 966.9 (37.3) | ||
|
| |||||
| 10.6-11.8 | Female | 19 | 28 | 611.0 (95.8) | 785.2 (36.4) |
| Male | 9 | 656.9 (79.0) | 869.9 (37.5) | ||
|
| |||||
| 11.9-13.4 | Female | 10 | 28 | 603.3 (101.7) | 708.1 (59.2) |
| Male | 18 | 640.0 (72.5) | 834.2 (31.0) | ||
Reaction time
Participants were asked to respond to rare targets by pressing a button on a response box. Reaction time was recorded and compared by age, pubertal development level, and gender. It should be noted that for five of the participants no reaction time data were available due to a recording error.
ERP data
Data from the averages of each of the 129 electrodes for each stimulus type and each participant were entered into a spatial PCA, using Varimax rotation. This analysis reduces the spatial dimensionality of a large dataset and separates overlapping ERP components. Details of the PCA procedures are described by Dien and Frishkoff (2005) and Spencer et al. (2001) and were implemented using the Matlab toolbox provided by Dien (ERP PCA Toolkit, v.2.20; Dien, 2010). The analysis used the covariance between electrode sites and resulted with set of 10 spatial factors. The original data were then filtered through these spatial factors (i.e., “virtual electrodes”) and plotted across time as “virtual ERPs” (Spencer et al., 2001). Coherent spatial factors were examined for morphology and spatial distribution and task-relevant variations consistent with ERP components. We measured latency and peak amplitude for each participant from the virtual ERPs obtained from the spatial PCA. To account for the effect of individual differences in latency on amplitude measures, a within-subject latency correction procedure was conducted on the virtual ERP scores in the 400 to 800 ms window of the epoch before peak amplitude measures were extracted (Kutas, McCarthy, & Donchin, 1977; Woody, 1967).
Results
We begin the results with an analysis of the reaction time (RT) data independent of the P300 analyses. These data reflect processing speed and accuracy in overt behavior on this task as a function of age, pubertal status, and gender. We then go “upstream” of the overt behavioral output to examine ERP responses that temporally precede (and perhaps functionally signal) the overt responses. Once upstream, we first establish that the output we are detecting is in fact the P300, and then examine P300 latency and amplitude, again as function of age, pubertal status and gender.
Reaction time
RTs in milliseconds for males and females are presented in Table 1 and for gender and age groups in Table 2. Because our RT data were relatively normal (distributions are presented in Figure 1), we used central tendency measures for inferential statistics. Overall, females (M = 798.56 ms, SD = 123.32) responded more quickly to rare events than did males (M = 898.44 ms, SD = 139.93). An ANOVA with age, pubertal development, gender and all interactions (4×4×2) showed that gender significantly influenced RT [F(1, 66) = 11.70, p<.01] in addition to pubertal development [F(3, 66) = 3.44, p<.05], while age was not significant (F=2.32, ns). Post hoc comparisons indicated that the highest pubertal development group exhibited significantly faster RT than all other pubertal development groups. Although the overall effect of age was not significant, post hoc comparisons indicated that the eldest group exhibited significantly faster RT than the two youngest age groups possibly reflecting advances in pubertal development in both female and male participants as age advanced. No interactions were significant in this model. In sum, therefore, the main effect of gender accounts for the majority of the variance in overt RT, with pubertal development accounting for additional variance. Given that gender and developmental differences could be found in this downstream behavioral output, it would not be surprising to see that some of these differences could already be detected in the upstream decision processes represented in the P300 ERP component.
Figure 1.
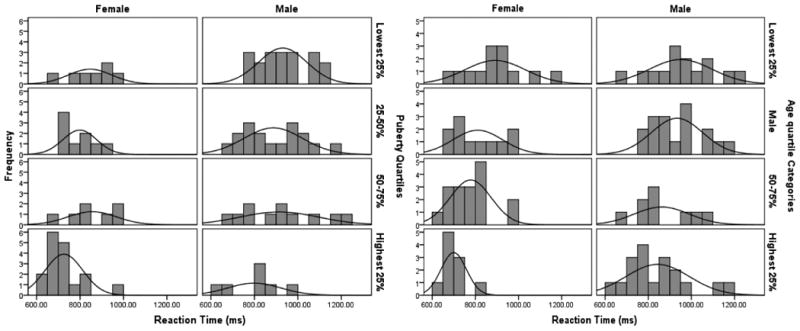
Distribution of reaction times by gender and puberty quartiles (left frame) and by gender and age quartiles (right frame).
Confirmation of P300s
As should be anticipated if the P300 was being elicited, grand average ERP waveforms showed that the component we were measuring (the P300) was detected in connection with rare events. This component was detected in both genders and in each of the examined age groups. Given that the waveform identified was, as anticipated, elicited by rare events, detailed examination of topographic patterns in the data was then possible using spatial PCA to examine whether the identified waveform also fell within the anticipated spatial boundaries. The topographic maps of spatial factors that appeared to have coherent scalp distributions are presented in Figure 2.
Figure 2.
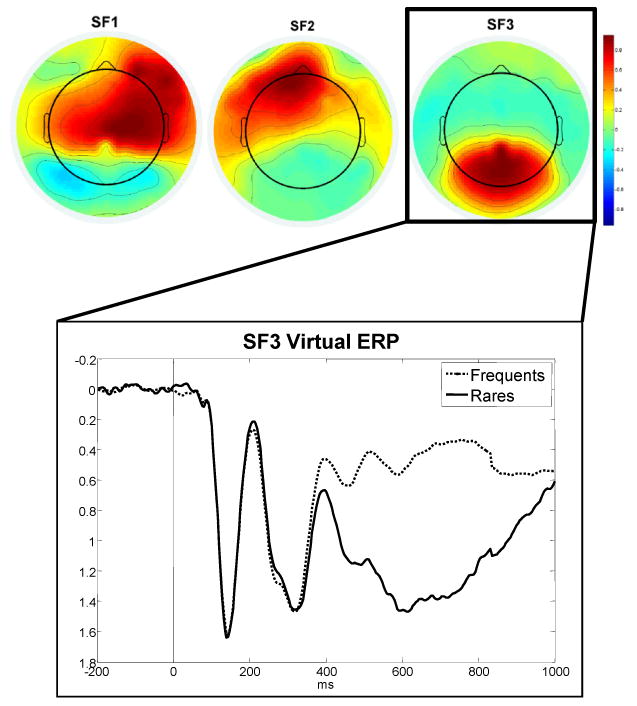
Virtual electrodes for Spatial Factors 1, 2, and 3, and virtual ERPs for Spatial Factor 3.
Because differences between rare and frequent stimuli were not associated with Spatial Factors 1 and 2, these factors were not examined further. In contrast, spatial Factor 3 (SF3) was a centro-parietal factor that did differentiate between rare and frequent stimuli. The virtual ERPs of this spatial factor can be seen in Figure 2. It is evident from examination of the virtual ERPs of this component that the rare stimuli elicited a positivity that peaked in the time window of 550-750 ms following the eliciting event, once again supporting that this output fell within the typical P300 time distribution following word stimuli. Furthermore, this SF3 activity clearly distinguished ERPs elicited by rare events from those associated with frequent events. Hence, this activity was seen in response to rare events, and had both the spatial (centro-parietal) and the temporal (∼600 ms following a word stimulus) characteristics of a P300. Finally, these virtual ERPs produced patterns that were similar to those recorded by the centro-parietal electrodes in the grand averaged data. For all these reasons, we regarded the waveforms obtained to represent the P300.
Individual differences in P300
Having established that the P300 was, in fact, elicited, we could then examine potential differences in P300 expression among our participants. To this end, Figure 3 presents the grand average virtual ERPs for participants separated by gender in each of four age groups. These data depict the waveforms obtained from SF3 after the latency correction procedure; the peak amplitude of the positivity between 400-900ms served as the amplitude measure of the P300.
Figure 3.

Latency jitter-corrected virtual ERPs by gender and age quartiles.
Visual inspection of the virtual ERPs suggested that the P300 amplitude was smaller in females when compared to males, that the amplitude of the P300 decreased with age, particularly for males, and that the waveforms (not just the P300) of young males were larger than those elicited by older males and by females (see Figure 3). The latency of the P300 was measured at the peak amplitude between 400-900ms from each participant's virtual ERPs of SF3. This approach allowed the examination of the latency of the P300 for each participant while spatially isolating the P300 from other components. Table 2 presents the latency of the P300 for each age group and gender as obtained from the virtual ERPs of SF3.
P300 latency
We first examined the effect of gender and age on P300 latency. The 2×4 ANOVA revealed a significant effect of gender [F (1, 106) = 8.01, p < .01], indicating that, on average, the P300 latency was shorter in females in comparison to males. As anticipated, this P300 latency finding was consistent with the RT data noted above. The effect of age was not significant [F (3, 106) = 2.45, p = 0.07], nor was the interaction between age and gender (F = .16, p = .92). Post-hoc paired comparisons indicated that the second age quartile (9.9-10.5 years old) exhibited the slowest latencies, which were significantly slower than those seen in the two older age groups (ps < .01). Gender, therefore, appeared to account for most of the differences in P300 latency in this sample, indicating faster and more efficient processing of word stimuli in females in this age range.
P300 amplitude
As with latency, we first examined the effects of gender and age on P300 amplitude in a 2×4 ANOVA. This analysis revealed a significant effect of gender [F (1,106) = 24.3, p < .001], but again age was not significant [F (3,106) = 2.25, p < .08]. Therefore, while age was correlated with P300 amplitude in the zero-order computations, this association was masked by the gender relationship when both were included in the analysis. Older participants also exhibited a decrease in P300 amplitude; post-hoc comparisons revealed that the two oldest age groups had significantly smaller P300 amplitudes compared to the two younger age groups (ps < .05). No significant interactions were found. Figure 4 depicts the amplitude measures by gender and age group (right frame).
Figure 4.

P300 amplitude by gender and puberty quartiles (left frame) and by gender and age quartiles (right frame).
Further attempts to disentangle Gender, Age, and Pubertal development
Because, as the developmental literature would suggest, gender, age, and pubertal development were heavily collinear in our sample (Table 3), we took additional steps to assess the possible differential effects of these developmental indices. To this end, we split the sample by gender and tested the relationships among the developmental indices and P300 amplitude. Correlations between age and pubertal development and the P300 measures after splitting the sample by gender are presented in Table 4. Not surprisingly, age and pubertal development were highly correlated in both genders, but more so in females. For males, but not females, age was significantly correlated with P300 amplitude. In contrast, pubertal development was significantly correlated with P300 amplitude for females but not males. It appears that the significant correlations between age and pubertal development (Table 4) coupled with the significant difference in pubertal level between males and females (Table 1) represented substantial overlap between the effects of the two developmental indices.
Table 4. Correlations among demographic variables and outcome variables split by gender.
| MALES | |||||
|---|---|---|---|---|---|
|
| |||||
| Age | Puberty | RT | P3 Latency | P3 Amplitude | |
| Age | -- | .45* | -.39* | -.28* | -.27* |
| Puberty | .45* | -- | -.29* | -.22 | -.18 |
| FEMALES | |||||
|
| |||||
| Age | -- | .66* | -.54* | -.10 | -.26 |
| Puberty | .66* | -- | -.49* | -.03 | -.33* |
p<.05
To permit a better test of these relationships using the full continuous variation in these indices, we then conducted simultaneous regressions with pubertal development and age entered for each gender separately. For the females, while pubertal development alone was significantly correlated with P300 amplitude, this relationship diminished to non-significant levels when age was entered as well (pubertal development: β = -.26; age: β = -.10). For males, while age alone was significantly correlated with P300 amplitude, this relationship also diminished to non-significant levels when pubertal development was entered into the regression (age: β = -.23; pubertal development: β = -.08). We then conducted the same procedures for P300 latency. For females, neither age nor pubertal development was significantly related to P300 latency in zero order correlations (Table 4) nor was either variable significant in the regression (βs = .05 & -.06, respectively). For males, age was significantly correlated with P300 latency (Table 4). When entered into a regression with pubertal development, however, neither age (β = -.23) nor pubertal development (β = -.12) significantly predicted P300 latency.
In sum (and again as developmental theory would suggest), disentangling the effects of each of these factors on P300 amplitude was not possible as the independent influence of age and pubertal development could not be detected in the presence of the other. Each of the developmental factors was associated with P300 amplitude in the present age range, with females exhibiting more puberty-related changes and males exhibiting more age-related changes.
Discussion
The current study was designed to address the metric used to index development in ERP studies, which have typically been limited to chronological age alone. To reflect a more nuanced measure of development, we assessed the relative influence of three highly-related variables (gender, age, and pubertal development) on ERP changes in early adolescence. The developmental literature describes the dynamic interplay of these variables in yielding maturational changes of brain and body (Blakemore, Burnett, & Dahl, 2010), but the literature also illustrates significant overlap (Spear, 2004). Our findings highlight the necessity of considering more than simply chronological age when examining cognitive functioning in adolescents, and in particular, the necessity of considering gender whenever developmental issues are addressed. That is, while age is highly collinear with other important developmental variables, it is not a full proxy for other variables when assessing how developmental changes come about.
In the present application, our results described a set of developmental and gender differences in the P300 ERP component elicited within a visual oddball task, which reflect maturational changes and gender differences in the efficiency of cognitive processing involved in categorization of events among adolescents. Our behavioral data indicated greater processing speed and efficiency in females, which we compared to upstream neural indices of cognitive processing. (As noted above, shorter P300 latency reflected more efficient or less demanding categorization while smaller P300 amplitude reflected either fewer resources allocated or fewer resources available to execute a task). Overall, females exhibited shorter P300 latencies and smaller P300 amplitudes compared to males. In addition, age and pubertal status appeared to be negatively related to both P300 latency and P300 amplitude to varying degrees. The relationship between the attributes of the P300 and gender during development seen in our study was in accord with previous reports regarding cognitive development in adolescence. Furthermore, these results provided a behavioral manifestation of differences among adolescents of different ages and sexual maturity previously reported in the literature (Raznahan et al., 2011; Peper et al, 2011). By collapsing across genders, previous reports have likely missed some crucial observations or may have reported age effects that were driven by the underlying gender distribution amongst their age groups. We will address below each of our findings in turn and also propose possible explanations pertaining to the underlying brain changes that would result in these cognitive and behavioral results.
Influence of Age and Pubertal Development on P300 Latency
The developmental literature describes increasing efficiency and speed of processing through adolescence (for reviews see Graber & Pedersen, 2001 and Steinberg, 2005). The speed of processing hypothesis was supported by the behavioral reaction time results in our sample, which depicted a strong negative relationship with both age and pubertal development. Our P300 latency data were roughly in line with this description in that the latency of the P300 tended to decrease with age and pubertal development (see correlations, Table 3). While the effects of the age and pubertal development on P300 latency were only trends, the limited age range of the sample likely contributed to this weak association; given previous reports, we would have expected P300 latency to continue to decrease into late adolescence and early adulthood (e.g., Katsanis et al., 1996). As adolescent brains mature they become more efficiently interconnected, in part because of increased myelination (Lopez-Larson et al., 2011; Giedd et al., 2006; Pfefferbaum et al., 1996). Thus, the increased efficiency measured via both RT and P300 latency likely reflected underlying brain changes and more efficient decision making processes (e.g., Dockstader, Gaetz, Rockel, & Mabbott, 2011).
Influence of Gender on P300 Latency
The P300 latency differences in our sample indicated that females processed the task-related information and categorized the deviant stimuli faster than did the males. Adolescent females responded more quickly and efficiently when categorizing these word stimuli, while males tended to make greater age-related gains in processing efficiency. In fact, when correlations between age and P300 latency were examined by gender, males exhibited a strong negative correlation (r = -.28, p < .05), while females exhibited a non-significant relationship (r = -.10), indicating that females' latencies were consistent across the age range while males exhibited age related decreases in latency. Because our paradigm utilized word stimuli to elicit the P300, it was possible that stronger verbal abilities in females in our sample led to faster processing of words. Females do not, however, have a general superiority in verbal abilities that would explain this more efficient processing (e.g., Hyde & Lynn, 1988; Wallentin, 2009). It is more likely, therefore, that the gender differences were a result of differences in the underlying biology resulting in greater efficiency of processing in females in our sample (e.g., Raznahan et al., 2010, 2011; Peper et al, 2011).
In summary, females were generally and consistently faster at processing deviant information in the form of word stimuli in the age range represented in our sample, but our data showed that males experienced a greater decrease in P300 latency with age. It was clear that the influence of gender on P300 latency was more substantial than either age or pubertal development; however, the gender differences we found likely reflected the indirect effect of pubertal development on information processing speed at the neural level (e.g., Bramen et al, 2011, Blackmore et al., 2010). When compared to the RT results, it appeared that pubertal development led to faster overt behavioral output while the decision process itself (indexed by P300 latency) was not necessarily facilitated. In other words, the translation of a decision to a behavioral output was faster in females and accelerated as pubertal development increased.
Influence of Age and Pubertal Development on P300 Amplitude
Consistent with several previous reports, our data indicated that the amplitude of the P300 elicited within a visual oddball task decreased with age (e.g., Katsanis et al., 1996; Pfeuller et al., 2011). In the same way, P300 amplitude decreased as pubertal development increased. Unlike P300 latency and behavioral RT measures, the efficiency reflected in P300 amplitude was not indicative of increased speed but increased processing power. It appeared that fewer resources were needed to effectively carry out the decision processing leading to accurate categorization of “oddballs”. As adolescents mature, their P300 amplitude decreases, reflecting more efficient processing. One underlying neurobiological change that likely contributes to this finding is cortical thinning. As children mature, cortices tend to thin, reflecting improved processing and executive control (Lu et al., 2007). Cortical thinning, coupled with the increasing interconnectivity among brain regions (e.g., Lopez-Larson et al., 2011) likely results in more efficient processing as children develop.
Influence of Gender on P300 Amplitude
The P300 amplitude elicited by adolescent females was smaller when compared with adolescent males. Furthermore, females exhibited greater developmentally related P300 amplitude decrease, which probably came about because females in our sample had experienced more maturation in this age range. In a typically developing sample, such as the sample of this study, reduced amplitude implies that fewer resources are called upon for the performance of a task. Furthermore, the influence of gender on P300 amplitude remained even after accounting for age and pubertal development, indicating a fundamental difference between male and female adolescents. Reports of females processing information more efficiently in adulthood are available (e.g., Christova et al, 2008), but little is known about the functional differences between male and female cognitive processing in adolescence (see Lenroot & Giedd, 2010 for a brief review). Evidence of increasingly efficient processing in females and older adolescents is available in reports regarding the developmental changes in another ERP component (i.e., the Error related negativity; ERN). The ERN has been found to reach maximum amplitude earlier for females than males during the adolescence years, indicating earlier maturation of the executive control system (Segalowitz & Davies, 2004). While the effect of gender remained after accounting for pubertal development, it was likely that female pubertal development played a critical role in the underlying brain changes yielding the increased efficiency (e.g., Bramen et al., 2011). Recall that, when split by gender (Table 4), pubertal development was significantly correlated with P300 amplitude in females, but not in males.
An alternative explanation might be that the reduction in P300 amplitude reflected less efficient processing of rare, or less expected, stimuli. Such amplitude reductions have been previously associated with various disorders or genetic risk factors (e.g., schizophrenia: Ford, 1999; alcoholism: Hesselbrock et al., 2001; children of alcoholics: Begleiter et al., 1984; Iaconono & Malone, 2011). In keeping with this explanation, the adolescent years may be considered years of impaired information processing which lead to poor decisions and risky behavior (Steinberg et al., 2007). Our correlated behavioral data did not support this interpretation, however, as RT and P300 latency were both positively associated with P300 amplitude (as adolescents responded faster, their P300 amplitudes tended to be smaller).
Another possible explanation is that during early adolescence individuals become less responsive to external information that is lower in motivational value (see Spear, 2000 for a discussion of this “reward deficiency syndrome”) resulting in increased sensation seeking in adolescence (i.e., they need stronger stimulation to elicit responses; see Windle et al., 2008). This lower sensitivity manifests itself in a reduction in the P300 amplitude, a reduction that occurs earlier for females as they enter puberty at an earlier age. The current results are not strongly consistent with such an interpretation, as decreased sensitivity (or increased sensation seeking) has been shown to be more prevalent in males (e.g., Cloninger, Sigvardsson, Bohman, 1988; Johnson et al., 1995). Therefore, while neither of these explanations can be definitively ruled out, neither of them provides an adequate model for the relationships seen in our data.
Our findings serve as an advisory to researchers to include multiple indices of development when studying developmental changes in psychophysiology. Gender differences in ERP responses are not surprising given the well characterized divergence of pubertal development between males and females, manifested in physical, biological, and neurobiological differences. In addition, while age is an easily accessible index of development, it is clear from our results that age is an imprecise index at best; other factors, such as pubertal development, can serve as an additional index with a stronger theoretical justification.
Acknowledgments
This research was supported by National Institute on Alcohol Abuse and Alcoholism Grants NOT-OD-09-056 & R01 AA016091 to Mark S. Goldman.
Footnotes
Families were recruited from a large metropolitan area and were required to have one child between 8.5 and 9.5 years old and a same sex sibling 2-3 years older. A total of 65 sibling pairs and one set of triplets were recruited (accounting for the odd number of participants). For 2 sibling pairs, only one of two siblings participated in the ERP task.
Contributor Information
Ty Brumback, Department of Psychology, University of South Florida.
Yael Arbel, Department of Communication Sciences and Disorders, University of South Florida.
Emanuel Donchin, Department of Psychology, University of South Florida.
Mark S. Goldman, Department of Psychology, University of South Florida
References
- Batty M, Taylor MJ. Visual categorization during childhood: An ERP study. Psychophysiology. 2002;39(4):482–490. doi: 10.1111/1469-8986.3940482. [DOI] [PubMed] [Google Scholar]
- Begleiter H, Porjesz B, Bihari B, Kissin B. Event-related brain potentials in boys at risk for alcoholism. Science. 1984;225(4669):1493–1496. doi: 10.1126/science.6474187. [DOI] [PubMed] [Google Scholar]
- Berman S, Friedman D, Cramer M. A developmental study of event-related potentials during explicit and implicit memory. International Journal of Psychophysiology. 1990;10(2):191–197. doi: 10.1016/0167-8760(90)90034-b. [DOI] [PubMed] [Google Scholar]
- Blakemore SJ, Burnett S, Dahl RE. The role of puberty in the developing adolescent brain. Human Brain Mapping. 2010;31(6):926–933. doi: 10.1002/hbm.21052. [DOI] [PMC free article] [PubMed] [Google Scholar]
- Bond L, Clements J, Bertalli N, Evans-Whipp T, McMorris BJ, Patton GC, Catalano RF, et al. A comparison of self-reported puberty using the Pubertal Development Scale and the Sexual Maturation Scale in a school-based epidemiologic survey. Journal of Adolescence. 2006;29(5):709–720. doi: 10.1016/j.adolescence.2005.10.001. [DOI] [PubMed] [Google Scholar]
- Bramen JE, Hranilovich JA, Dahl RE, Forbes EE, Chen J, Toga AW, Sowell ER, et al. Puberty Influences Medial Temporal Lobe and Cortical Gray Matter Maturation Differently in Boys Than Girls Matched for Sexual Maturity. Cerebral Cortex. 2011;21(3):636–646. doi: 10.1093/cercor/bhq137. [DOI] [PMC free article] [PubMed] [Google Scholar]
- Carlson SR, McLarnon ME, Iacono WG. P300 amplitude, externalizing psychopathology, and earlier- versus later-onset substance-use disorder. Journal of Abnormal Psychology. 2007;116(3):565–577. doi: 10.1037/0021-843X.116.3.565. [DOI] [PubMed] [Google Scholar]
- Choudhury S, Blakemore SJ, Charman T. Social cognitive development during adolescence. Social Cognitive and Affective Neuroscience. 2006;1(3):165–174. doi: 10.1093/scan/nsl024. [DOI] [PMC free article] [PubMed] [Google Scholar]
- Christova P, Lewis S, Tagaris G, Uğurbil K, Georgopoulos A. A voxel-by-voxel parametric fMRI study of motor mental rotation: hemispheric specialization and gender differences in neural processing efficiency. Experimental Brain Research. 2008;189(1):79–90. doi: 10.1007/s00221-008-1405-x. [DOI] [PubMed] [Google Scholar]
- Cloninger CR, Sigvardsson S, Bohman M. Childhood Personality Predicts Alcohol Abuse in Young Adults. Alcoholism: Clinical and Experimental Research. 1988;12(4):494–505. doi: 10.1111/j.1530-0277.1988.tb00232.x. [DOI] [PubMed] [Google Scholar]
- Courchesne E. Event-related brain potentials: comparison between children and adults. Science. 1977;197(4303):589–592. doi: 10.1126/science.877575. [DOI] [PubMed] [Google Scholar]
- Courchesne E. Neurophysiological correlates of cognitive development: Changes in long-latency event-related potentials from childhood to adulthood. Electroencephalography and Clinical Neurophysiology. 1978;45(4):468–482. doi: 10.1016/0013-4694(78)90291-2. [DOI] [PubMed] [Google Scholar]
- Crone EA. Executive functions in adolescence: inferences from brain and behavior. Developmental Science. 2009;12(6):825–830. doi: 10.1111/j.1467-7687.2009.00918.x. [DOI] [PubMed] [Google Scholar]
- Crone EA, Richard Ridderinkhof K. The developing brain: From theory to neuroimaging and back. Developmental Cognitive Neuroscience. 2011;1(2):101–109. doi: 10.1016/j.dcn.2010.12.001. [DOI] [PMC free article] [PubMed] [Google Scholar]
- Dahl RE. Adolescent Brain Development: A Period of Vulnerabilities and Opportunities. Annals of the New York Academy of Sciences. 2004;1021(1):1–22. doi: 10.1196/annals.1308.001. [DOI] [PubMed] [Google Scholar]
- Davies PL, Segalowitz SJ, Gavin WJ. Development of Response-Monitoring ERPs in 7- to 25-Year-Olds. Developmental Neuropsychology. 2004;25(3):355–376. doi: 10.1207/s15326942dn2503_6. [DOI] [PubMed] [Google Scholar]
- De Bellis MD, Keshavan MS, Beers SR, Hall J, Frustaci K, Masalehdan A, Boring AM, et al. Sex Differences in Brain Maturation during Childhood and Adolescence. Cerebral Cortex. 2001;11(6):552–557. doi: 10.1093/cercor/11.6.552. [DOI] [PubMed] [Google Scholar]
- Dien J. The ERP PCA Toolkit: An open source program for advanced statistical analysis of event-related potential data. Journal of Neuroscience Methods. 2010;187(1):138–145. doi: 10.1016/j.jneumeth.2009.12.009. [DOI] [PubMed] [Google Scholar]
- Dien J, Frishkoff GA. Principal components analysis of ERP data. In: Handy TC, editor. Event-related potentials: a methods handbook. Cambridge; London: Mass,; MIT press; 2005. pp. 189–207. [Google Scholar]
- Dien J, Spencer KM, Donchin E. Parsing the late positive complex: Mental chronometry and the ERP components that inhabit the neighborhood of the P300. Psychophysiology. 2004;41(5):665–678. doi: 10.1111/j.1469-8986.2004.00193.x. [DOI] [PubMed] [Google Scholar]
- Dockstader C, Gaetz W, Rockel C, Mabbott DJ. White matter maturation in visual and motor areas predicts the latency of visual activation in children. Human Brain Mapping. 2012;33(1):179–191. doi: 10.1002/hbm.21203. [DOI] [PMC free article] [PubMed] [Google Scholar]
- Donchin E. Surprise!… Surprise? Psychophysiology. 1981;18(5):493–513. doi: 10.1111/j.1469-8986.1981.tb01815.x. [DOI] [PubMed] [Google Scholar]
- Donchin E, Coles MG. Is the P300 component a manifestation of context updating? Behavioral and Brain Sciences. 1988;11(3):357–427. doi: 10.1017/s0140525x00058027. [DOI] [Google Scholar]
- Dorn LD. Measuring Puberty. Journal of Adolescent Health. 2006;39(5):625–626. doi: 10.1016/j.jadohealth.2006.05.014. [DOI] [PubMed] [Google Scholar]
- Dorn LD, Dahl RE, Woodward HR, Biro F. Defining the Boundaries of Early Adolescence: A User's Guide to Assessing Pubertal Status and Pubertal Timing in Research With Adolescents. Applied Developmental Science. 2006;10(1):30–56. doi: 10.1207/s1532480xads1001_3. [DOI] [Google Scholar]
- Flores AB, Gómez CM, Meneres S. Evaluation of spatial validity-invalidity by the P300 component in children and young adults. Brain Research Bulletin. 2010;81(6):525–533. doi: 10.1016/j.brainresbull.2010.01.005. [DOI] [PubMed] [Google Scholar]
- Forbes EE, Dahl RE. Pubertal development and behavior: Hormonal activation of social and motivational tendencies. Brain and Cognition. 2010;72(1):66–72. doi: 10.1016/j.bandc.2009.10.007. [DOI] [PMC free article] [PubMed] [Google Scholar]
- Ford JM. Schizophrenia: The broken P300 and beyond. Psychophysiology. 1999;36(06):667–682. doi: doi:null. [PubMed] [Google Scholar]
- Friedman D, Nessler D, Cycowicz Y, Horton C. Development of and change in cognitive control: A comparison of children, young adults, and older adults. Cognitive, Affective, & Behavioral Neuroscience. 2009;9(1):91–102. doi: 10.3758/cabn.9.1.91. [DOI] [PMC free article] [PubMed] [Google Scholar]
- Giedd JN, Blumenthal J, Jeffries NO, Castellanos FX, Liu H, Zijdenbos A, Rapoport JL, et al. Brain development during childhood and adolescence: a longitudinal MRI study. Nat Neurosci. 1999;2(10):861–863. doi: 10.1038/13158. [DOI] [PubMed] [Google Scholar]
- Giedd JN, Clasen LS, Lenroot R, Greenstein D, Wallace GL, Ordaz S, Chrousos GP, et al. Puberty-related influences on brain development. Molecular and Cellular Endocrinology. 2006:254–255. 154–162. doi: 10.1016/j.mce.2006.04.016. [DOI] [PubMed] [Google Scholar]
- Gong G, He Y, Evans AC, et al. Brain Connectivity: Gender Makes a Difference. The Neuroscientist. 2011 doi: 10.1177/1073858410386492. [DOI] [PubMed] [Google Scholar]
- Goodin DS, Squires KC, Henderson BH, Starr A. Age-related variations in evoked potentials to auditory stimuli in normal human subjects. Electroencephalography and Clinical Neurophysiology. 1978;44(4):447–458. doi: 10.1016/0013-4694(78)90029-9. [DOI] [PubMed] [Google Scholar]
- Graber JA, Petersen AC. Brain maturation and cognitive development: Comparative and cross-cultural perspectives. Hawthorne, NY, US: Aldine de Gruyter; 1991. Cognitive changes at adolescence: Biological perspectives; pp. 253–279. [Google Scholar]
- Gratton G, Coles MG, Donchin E. A new method for off-line removal of ocular artifact. Electroencephalography & Clinical Neurophysiology. 1983;55(4):468–484. doi: 10.1016/0013-4694(83)90135-9. [DOI] [PubMed] [Google Scholar]
- Hesselbrock V, Begleiter H, Porjesz B, O'Connor S, Bauer L. P300 event-related potential amplitude as an endophenotype of alcoholism: Evidence from the collaborative study on the genetics of alcoholism. Journal of Biomedical Science. 2001;8(1):77–82. doi: 10.1007/bf02255974. [DOI] [PubMed] [Google Scholar]
- Huttenlocher PR. Dendritic and Synaptic Development in Human Cerebral Cortex: Time Course and Critical Periods. Developmental Neuropsychology. 1999;16(3):347–349. [Google Scholar]
- Hyde JS, Linn MC. Gender differences in verbal ability: A meta-analysis. Psychological Bulletin. 1988;104(1):53–69. [Google Scholar]
- Iragui VJ, Kutas M, Mitchiner MR, Hillyard SA. Effects of aging on event-related brain potentials and reaction times in an auditory oddball task. Psychophysiology. 1993;30(1):10–22. doi: 10.1111/j.1469-8986.1993.tb03200.x. [DOI] [PubMed] [Google Scholar]
- Johnson EO, Arria AM, Borges G, Ialongo N, et al. The growth of conduct problem behaviors from middle childhood to early adolescence: Sex differences and the suspected influence of early alcohol use. Journal of Studies on Alcohol. 1995;56(6):661–671. doi: 10.15288/jsa.1995.56.661. [DOI] [PubMed] [Google Scholar]
- Johnson R. Developmental Evidence for Modality-Dependent P300 Generators: A Normative Study. Psychophysiology. 1989;26(6):651–667. doi: 10.1111/j.1469-8986.1989.tb03167.x. [DOI] [PubMed] [Google Scholar]
- Johnson R, Donchin E. On how P300 amplitude varies with the utility of the eliciting stimuli. Electroencephalography and Clinical Neurophysiology. 1978;44(4):424–437. doi: 10.1016/0013-4694(78)90027-5. [DOI] [PubMed] [Google Scholar]
- Katsanis J, Iacono WG, McGue MK. The association between P300 and age from preadolescence to early adulthood. International Journal of Psychophysiology. 1996;24(3):213–221. doi: 10.1016/s0167-8760(96)00063-3. [DOI] [PubMed] [Google Scholar]
- Kutas M, McCarthy G, Donchin E. Augmenting mental chronometry: the P300 as a measure of stimulus evaluation time. Science. 1977;197(4305):792–795. doi: 10.1126/science.887923.. [DOI] [PubMed] [Google Scholar]
- Ladish C, Polich J. P300 and probability in children. Journal of Experimental Child Psychology. 1989;48(2):212–223. doi: 10.1016/0022-0965(89)90003-9. [DOI] [PubMed] [Google Scholar]
- Lenroot RK, Giedd JN. Sex differences in the adolescent brain. Brain and Cognition. 2010;72(1):46–55. doi: 10.1016/j.bandc.2009.10.008. [DOI] [PMC free article] [PubMed] [Google Scholar]
- Lopez-Larson MP, Anderson JS, Ferguson MA, Yurgelun-Todd D. Local brain connectivity and associations with gender and age. Developmental Cognitive Neuroscience. 2011;1(2):187–197. doi: 10.1016/j.dcn.2010.10.001. [DOI] [PMC free article] [PubMed] [Google Scholar]
- Lu L, Leonard C, Thompson P, Kan E, Jolley J, Welcome S, Sowell E, et al. Normal Developmental Changes in Inferior Frontal Gray Matter Are Associated with Improvement in Phonological Processing: A Longitudinal MRI Analysis. Cerebral Cortex. 2007;17(5):1092–1099. doi: 10.1093/cercor/bhl019. [DOI] [PubMed] [Google Scholar]
- Marshall WA. Puberty. In: Tanner JM, Falkner F, editors. Human Growth: A compendium treatise. New York: Plenum Press; 1986. pp. 171–209. [Google Scholar]
- Masten AS, Faden VB, Zucker RA, Spear LP. Underage Drinking: A Developmental Framework. Pediatrics. 2008;121(Supplement 4):S235–S251. doi: 10.1542/peds.2007-2243A. [DOI] [PubMed] [Google Scholar]
- Mullis RJ, Holcomb PJ, Diner BC, Dykman RA. The effects of aging on the P3 component of the visual event-related potential. Electroencephalography and Clinical Neurophysiology/Evoked Potentials Section. 1985;62(2):141–149. doi: 10.1016/0168-5597(85)90026-7. [DOI] [PubMed] [Google Scholar]
- Peper JS, Hulshoff Pol HE, Crone EA, van Honk J. Sex steroids and brain structure in pubertal boys and girls: a mini-review of neuroimaging studies. Neuroscience. 2011;191(0):28–37. doi: 10.1016/j.neuroscience.2011.02.014. [DOI] [PubMed] [Google Scholar]
- Petersen AC, Crockett L, Richards M, Boxer A. A self-report measure of pubertal status: Reliability, validity, and initial norms. Journal of Youth and Adolescence. 1988;17(2):117–133. doi: 10.1007/bf01537962. [DOI] [PubMed] [Google Scholar]
- Pfefferbaum A, Ford JM, Roth WT, Kopell BS. Age-related changes in auditory event-related potentials. Electroencephalography and Clinical Neurophysiology. 1980;49(3-4):266–276. doi: 10.1016/0013-4694(80)90221-7. [DOI] [PubMed] [Google Scholar]
- Pfueller U, Oelkers-Ax R, Gmehlin D, Parzer P, Roesch-Ely D, Weisbrod M, Bender S. Maturation of P300 amplitude and short-term learning as reflected by P300 habituation between trial blocks in children. International Journal of Psychophysiology. 2011;79(2):184–194. doi: 10.1016/j.ijpsycho.2010.10.005. [DOI] [PubMed] [Google Scholar]
- Picton TW, Stuss DT, Champagne SC, Nelson RF. The Effects of Age on Human Event-Related Potentials. Psychophysiology. 1984;21(3):312–326. doi: 10.1111/j.1469-8986.1984.tb02941.x. [DOI] [PubMed] [Google Scholar]
- Polich J. Meta-analysis of P300 normative aging studies. Psychophysiology. 1996;33(4):334–353. doi: 10.1111/j.1469-8986.1996.tb01058.x. [DOI] [PubMed] [Google Scholar]
- Polich J, Ladish C, Burns T. Normal variation of P300 in children: Age, memory span, and head size. International Journal of Psychophysiology. 1990;9(3):237–248. doi: 10.1016/0167-8760(90)90056-j. [DOI] [PubMed] [Google Scholar]
- Raznahan A, Shaw P, Lalonde F, Stockman M, Wallace GL, Greenstein D, … Giedd JN. How Does Your Cortex Grow? The Journal of Neuroscience. 2011;31(19):7174–7177. doi: 10.1523/jneurosci.0054-11.2011. [DOI] [PMC free article] [PubMed] [Google Scholar]
- Segalowitz SJ, Davies PL. Charting the maturation of the frontal lobe: An electrophysiological strategy. Brain and Cognition. 2004;55(1):116–133. doi: 10.1016/S0278-2626(03)00283-5. [DOI] [PubMed] [Google Scholar]
- Segalowitz SJ, Santesso DL, Jetha MK. Electrophysiological changes during adolescence: A review. Brain and Cognition. 2010;72(1):86–100. doi: 10.1016/j.bandc.2009.10.003. [DOI] [PubMed] [Google Scholar]
- Spear LP. The adolescent brain and age-related behavioral manifestations. Neuroscience & Biobehavioral Reviews. 2000;24(4):417–463. doi: 10.1016/s0149-7634(00)00014-2. [DOI] [PubMed] [Google Scholar]
- Spear LP. Adolescent Brain Development and Animal Models. Annals of the New York Academy of Sciences. 2004;1021(1):23–26. doi: 10.1196/annals.1308.002. [DOI] [PubMed] [Google Scholar]
- Spear LP. Adolescent Neurobehavioral Characteristics, Alcohol Sensitivities, and Intake: Setting the Stage for Alcohol Use Disorders? Child Development Perspectives. 2011;5(4):231–238. doi: 10.1111/j.1750-8606.2011.00182.x. [DOI] [PMC free article] [PubMed] [Google Scholar]
- Spencer KD, Dien J, Donchin E. Spatiotemporal analysis of the late ERP responses to deviant stimuli. Psychophysiology. 2001;38(2):343–358. [PubMed] [Google Scholar]
- Steinberg L. Cognitive and affective development in adolescence. Trends in Cognitive Sciences. 2005;9(2):69–74. doi: 10.1016/j.tics.2004.12.005. [DOI] [PubMed] [Google Scholar]
- Steinberg L. Risk Taking in Adolescence. Current Directions in Psychological Science. 2007;16(2):55–59. doi: 10.1111/j.1467-8721.2007.00475.x. [DOI] [Google Scholar]
- Steinberg L, Albert D, Cauffman E, Banich M, Graham S, Woolard J. Age differences in sensation seeking and impulsivity as indexed by behavior and self-report: Evidence for a dual systems model. Developmental Psychology. 2008;44(6):1764–1778. doi: 10.1037/a0012955. [DOI] [PubMed] [Google Scholar]
- Stige S, Fjell AM, Smith L, Lindgren M, Walhovd KB. The Development of Visual P3a and P3b. Developmental Neuropsychology. 2007;32(1):563–584. doi: 10.1080/87565640701361096. [DOI] [PubMed] [Google Scholar]
- Thomas KM, Nelson CA. Age-related changes in the electrophysiological response to visual stimulus novelty: A topographical approach. Electroencephalography and Clinical Neurophysiology. 1996;98(4):294–308. doi: 10.1016/0013-4694(95)00280-4. [DOI] [PubMed] [Google Scholar]
- Wallentin M. Putative sex differences in verbal abilities and language cortex: A critical review. Brain and Language. 2009;108(3):175–183. doi: 10.1016/j.bandl.2008.07.001. [DOI] [PubMed] [Google Scholar]
- Whitford TJ, Rennie CJ, Grieve SM, Clark CR, Gordon E, Williams LM. Brain maturation in adolescence: Concurrent changes in neuroanatomy and neurophysiology. Human Brain Mapping. 2007;28(3):228–237. doi: 10.1002/hbm.20273. [DOI] [PMC free article] [PubMed] [Google Scholar]
- Windle M, Spear LP, Fuligni AJ, Angold A, Brown JD, Pine D, Dahl RE, et al. Transitions Into Underage and Problem Drinking: Developmental Processes and Mechanisms Between 10 and 15 Years of Age. Pediatrics. 2008;121(Supplement 4):S273–S289. doi: 10.1542/peds.2007-2243C. [DOI] [PMC free article] [PubMed] [Google Scholar]
- Woody C. Characterization of an adaptive filter for the analysis of variable latency neuroelectric signals. Medical and Biological Engineering and Computing. 1967;5(6):539–554. doi: 10.1007/bf02474247. [DOI] [Google Scholar]