Abstract
Background
‘Early discharge hospital at home’ is a service that provides active treatment by health care professionals in the patient’s home for a condition that otherwise would require acute hospital in-patient care. If hospital at home were not available then the patient would remain in an acute hospital ward.
Objectives
To determine, in the context of a systematic review and meta-analysis, the effectiveness and cost of managing patients with early discharge hospital at home compared with in-patient hospital care.
Search methods
We searched the Cochrane Effective Practice and Organisation of Care (EPOC) Group Register , MEDLINE (1950 to 2008), EMBASE (1980 to 2008), CINAHL (1982 to 2008) and EconLit through to January 2008. We checked the reference lists of articles identified for potentially relevant articles.
Selection criteria
Randomised controlled trials recruiting patients aged 18 years and over. Studies comparing early discharge hospital at home with acute hospital in-patient care. Evaluations of obstetric, paediatric and mental health hospital at home schemes are excluded from this review.
Data collection and analysis
Two authors independently extracted data and assessed study quality. Our statistical analyses were done on an intention-to-treat basis. We requested individual patient data (IPD) from trialists, and relied on published data when we did not receive trial data sets or the IPD did not include the relevant outcomes. For the IPD meta-analysis, where at least one event was reported in both study groups in a trial, Cox regression models were used to calculate the log hazard ratio and its standard error for mortality and readmission separately for each data set. The calculated log hazard ratios were combined using fixed-effect inverse variance meta-analysis.
Main results
Twenty-six trials were included in this review [n = 3967]; 21 were eligible for the IPD meta-analysis and 13 of the 21 trials contributed data [1899/2872; 66%]. For patients recovering from a stroke and elderly patients with a mix of conditions there was insufficient evidence of a difference in mortality between groups (adjusted HR 0.79, 95% CI 0.32 to 1.91; N = 494; and adjusted HR 1.06, 95% CI 0.69 to 1.61; N = 978). Readmission rates were significantly increased for elderly patients with a mix of conditions allocated to hospital at home (adjusted HR 1.57; 95% CI 1.10 to 2.24; N = 705). For patients recovering from a stroke and elderly patients with a mix of conditions respectively, significantly fewer people allocated to hospital at home were in residential care at follow-up (RR 0.63; 95% CI 0.40 to 0.98; N = 4 trials; RR 0.69, 95% CI 0.48 to 0.99; N =3 trials). Patients reported increased satisfaction with early discharge hospital at home. There was insufficient evidence of a difference for readmission between groups in trials recruiting patients recovering from surgery. Evidence on cost savings was mixed.
Authors’ conclusions
Despite increasing interest in the potential of early discharge hospital at home services as a cheaper alternative to in-patient care, this review provides insufficient objective evidence of economic benefit or improved health outcomes.
Medical Subject Headings (MeSH): *Hospitalization [economics], Home Care Services, Hospital-Based [economics; *standards], Patient Care [economics; standards], Patient Discharge, Randomized Controlled Trials as Topic
MeSH check words: Adult, Humans
BACKGROUND
The concept of hospital at home originated with Hospitalisation à Domicile in France in 1961 and has been implemented in a number of other countries, including the United States, the Netherlands and Australia (Bosna 1993; Leff 2005; Montalto 1998). In its original form, Hospitalisation á Domicile was intended to provide care, including specialist care, at home for certain groups of patients who traditionally received care and treatment in hospital but who opted, with the support of their families, to be cared for in their home (Clarke 1984; Morris 1983).
Today, hospital at home schemes vary in their philosophy and focus of care, and may be community based or hospital resourced. The community based schemes build on existing community resources, which may include home health agencies; the hospital resourced schemes provide an outreach service with hospital staff making domiciliary visits. In the UK, hospital at home usually concentrates on providing personal, nurse-led care rather than technical services, building on the existing structure of primary care. The exception is home intravenous services (Matthews 2007). In other countries, such as the United States and Australia, hospital based outreach services tend to dominate (Leff 2005) and in a few, integration of specialist hospital services and primary care is more common.
Patients treated by hospital at home may avoid admission to an acute hospital ward after assessment in the community by their primary care physician or in the emergency department. Alternatively patients may be discharged early from hospital to receive hospital at home care. This review is part of the update of the hospital at home review published in 2005 (Shepperd 2005). The original review is now split into three reviews with this one focusing on early discharge hospital at home. In a parallel review we report the results of an individual patient data meta-analysis of admission avoidance trials (Shepperd 2008); a protocol is currently being developed for a systematic review of terminal care hospital at home. The types of services provided by early discharge hospital at home are designed to care for patients discharged early from hospital and provide coordinated rehabilitation with specialist care (Hollingworth 1993; O’Cathain 1994; Pryor 1989); the aim is to provide a service that relieves the pressure on acute hospital beds.
It is not known if patients admitted to early discharge hospital at home have better, equivalent or worse health outcomes compared with patients receiving in-patient hospital care, nor if the provision of early discharge hospital at home results in a reduction or increase in costs to the health service.
OBJECTIVES
To determine, in the context of a systematic review and meta-analysis, the effectiveness and cost of managing patients with early discharge hospital at home compared with in-patient hospital care.
We address the following questions:
Do patients treated by early discharge hospital at home services have different health outcomes, in terms of mortality, functional status and quality of life, than patients who remain in hospital for their episode of care?
Do readmission rates, or transfers to hospital, differ for patients treated in early discharge hospital at home compared with patients who remain in hospital for their episode of care?
Does patient satisfaction or carer satisfaction differ between early discharge hospital at home care and in-patient care?
Do the costs to the health service alter as a result of setting up and providing early discharge hospital at home care?
Does the workload of doctors working in primary care change as a result of setting up and delivering care to patients admitted to early discharge hospital at home?
METHODS
Criteria for considering studies for this review
Types of studies
Randomised controlled trials.
Types of participants
The review includes evaluations of early discharge hospital at home schemes that include patients aged 18 years and over. Patients with long-term care needs are not included unless they required admission to hospital for an acute episode of care. We defined older patients as those older than 65. We excluded evaluations of obstetric, paediatric and mental health hospital at home schemes from the review since our preliminary literature searches suggested that separate reviews would be justified for each of these groups due to the different types of patient group and volume of literature (Parker 2002; Shepperd 2007).
Types of interventions
Studies comparing early discharge hospital at home with acute hospital in-patient care. We used the following definition to determine if studies should be included in the review: hospital at home is a service that provides active treatment by health care professionals in the patient’s home for a condition that otherwise would require acute hospital in-patient care, and always for a limited time period. In particular, hospital at home has to offer a specific service to patients in their home requiring health care professionals to take an active part in the patients’ care. If hospital at home were not available then the patient would not be discharged early from hospital and would remain on an acute hospital ward. Therefore, the following services are excluded from this review: services providing long term care, services provided in out-patient settings or post discharge from hospital, and self-care by the patient in their home such as self-administration of an intravenous infusion.
Types of outcome measures
Mortality
Readmissions
General and disease-specific health status
Functional status
Psychological well-being
Clinical complications
Patient satisfaction
Carer satisfaction
Carer burden
Staff views (including general practitioners’ satisfaction)
Discharge destination from hospital at home
Length of stay in hospital and hospital at home
Cost (this includes the costs to the patient and their family, to general practice, to the hospital and social or voluntary service costs)
Search methods for identification of studies
See EPOC 2008 for addtional details about search methods.
We searched the following databases: the Cochrane Effective Practice and Organisation of Care (EPOC) Group Register, Ovid MEDLINE(R) 1950 to January Week 3 2008, EMBASE 1980 to 2008 Week 11, CINAHL1982 to February Week 5 2008 and EconLit through to January 2008. Full details of the search terms used are in Appendix 1 at the end of this document. The EPOC register is compiled with searches of the following databases: MEDLINE (from 1966), HealthSTAR (from 1975), EMBASE (from 1980) and CINAHL (from 1982). New records in MEDLINE, HealthSTAR, EMBASE and CINAHL are searched on a regular basis for additional studies. The Cochrane Central Register of Controlled Trials (CENTRAL) database in The Cochrane Library is searched every three months (each issue) for studies relevant to EPOC.
We checked the reference lists of articles identified electronically for evaluations of hospital at home and obtained potentially relevant articles. We sought unpublished studies by contacting providers and researchers who were known to be involved in this field. A list of contacts was developed using the existing literature and following discussion with researchers in the area.
Data collection and analysis
One author (SS) read all the abstracts in the records retrieved by the electronic searches to identify publications that appeared to be eligible for this review. Two authors (SS and SI) independently read these publications and selected studies for the review according to the pre-specified inclusion criteria. We resolved disagreements by discussion. We assessed the quality of eligible trials using the criteria described by the EPOC Group (see ‘METHODS USED IN REVIEWS’, ‘ASSESSMENT OF METHODOLOGICAL QUALITY’ under ‘GROUP DETAILS’ in The Cochrane Library). Two authors (SS and SI) completed data extraction independently using a checklist developed by EPOC, modified and amended for the purposes of this review (see ‘METHODS USED IN REVIEWS’ under ‘GROUP DETAILS’). We conducted an IPD meta-analysis in a subgroup of trials evaluating specific outcomes in the more homogeneous populations described below.
Individual patient data (IPD)
We contacted the investigators of 21 of the included trials (total number of participants = 2872) by email or telephone, inviting them to contribute data to the hospital at home early discharge collaborative review. We had to send up to four reminders; it took up to 22 months to receive the data. Data from one of these trials contributed to the analysis of those with chronic obstructive pulmonary disease, older people with an acute medical condition, and those recovering from a stroke. To avoid triple counting this trial it is only counted once under ‘older patients with a medical condition’ (Shepperd 1998). As a minimum we requested trialists to send us an identifier for each recruited patient, demographic data, date of recruitment, allocation group, follow-up times, details of the intervention and data (including dates) on mortality and hospital readmission. We also requested additional outcome data on functional ability, quality of life, satisfaction, carer burden, resources used and cost. We did not attempt to obtain IPD for five trials included in this review, though we did include these trials in the review, as they were considered to have recruited participants who differed substantially from the populations in the other trials. Two of these five trials were conducted in 1978 and recruited patients having surgery for conditions no longer requiring a hospital admission (hernia or varicose veins) (Adler 1978; Ruckley 1978); and three of the five trials recruited patients with a condition unique to that trial which prevented the data being pooled (patients recovering from coronary artery bypass grafting, hip fracture or total knee replacement) (Booth 2004; Crotty 2002; Palmer Hill 2000).
Statistical analysis
Our statistical analyses sought to include all randomised patients and were done on an intention to treat basis. We relied on published data when the IPD did not include the relevant outcomes. When combining outcome data was not possible because of differences in the reporting of outcomes, we presented the data in narrative summary tables. Where possible we grouped the trials by the patients’ condition: patients recovering from a stroke, older patients with a mix of conditions (including chronic obstructive pulmonary disease and those recovering from orthopaedic surgery), and trials recruiting patients recovering from surgery.
Using the IPD we calculated hazard ratios for the dichotomous outcomes mortality and readmission, with 95% confidence intervals for all point estimates, using a fixed effect model. Where at least one event was reported in both study groups in a trial, we used Cox regression models to calculate the log hazard ratio and its standard error for mortality and readmission separately for each data set (where both outcomes were available). We included randomisation group (early discharge hospital at home versus control), age (above or below the median for each trial) and gender in the models. We combined the calculated log hazard ratios using fixed effect inverse variance meta-analysis (Deeks 1998). The pooled effect is expressed as the hazard ratio for hospital at home compared with usual hospital care where values < 1 indicate outcomes favouring hospital at home. Heterogeneity was quantified by Cochran’s Q (Cochran 1954) and the I2 statistic, the latter quantifying the percentage of the total variation across studies that is due to heterogeneity rather than chance (Higgins 2003); smaller percentages suggest less observed heterogeneity. If there were no events in one group we used the Peto odds ratio method to calculate a log odds ratio from the sum of the log-rank test ‘O-E’ statistics from a Kaplan Meier survival analysis. This method does not require corrections for zero cell counts and thus it performs well when events are rare (Deeks 1998). Statistical significance throughout was taken at the two-sided 5% level (P < 0.05) and data are presented as the estimated effect with 95% confidence intervals. All analyses were undertaken in SPSS version 14.0 (SPSS 2006) and STATA (STATA 2004), with the meta-analysis being undertaken in Review Manager 4.2 and Review Manager 5. Comparison between health outcomes was restricted by the different measurement tools used and method of reporting in the included trials. A direct comparison of costs, although planned, was not attempted because the trials used different methods to calculate costs.
Dealing with missing data
Two of the trial data sets provided event data with the time interval in which the event occurred, but no dates. For one of these data sets (Richards 1998) follow-up was at one and three months, and we only knew if an event had occurred during each time period (i.e.up to one month and from one to three months). For such events we imputed the event date as the midpoint day. Thus, if we knew that death occurred within one month of randomisation we gave the date of death as 15 days from randomisation. If the event occurred between one and three months then we gave the date of death as 61 days from randomisation (midway between one month and three months). For the second trial (Rodgers 1997) the data on death and readmission simply indicated that the event had taken place within six months of randomisation; for these events we imputed an event date as 91 days, the midpoint between randomisation and six months.
Similarly, in another data set where some dates were missing for known events, we gave the missing event a date of 91 days, the midpoint between randomisation and end of follow-up (Anderson 2000; Donnelly 2004).
For one trial 17 cases were withdrawn at three months; we gave a mid point follow-up time of 61 days for three of these cases for whom a date for withdrawal was not available but who did have one month follow-up data (Richards 1998). The other 14 cases had been withdrawn before one month follow-up, and we gave these a mid-point 15 day withdrawal date.
Sensitivity analysis
We used sensitivity analyses to assess the impact of the increased ‘exposure’ time to readmission for the hospital at home group compared with the hospital group. We calculated a pooled estimate both including and excluding transfers or readmissions to hospital occurring within the first 14 days, as this was the average duration that hospital patients spent in hospital. For the two studies (Donnelly 2004; Richards 1998) in which missing data were imputed, we undertook sensitivity analyses (assigning best and worse case scenarios to the intervention and comparison group) to assess the likely effect of such imputation.
RESULTS
Description of studies
See: Characteristics of included studies; Characteristics of excluded studies.
We identified 25 published trials, and one unpublished trial, for inclusion in the current update of this review of early discharge hospital at home. Five of these trials were not eligible for the IPD meta-analysis as two trials recruited patients following surgery for hernia or varicose veins (Adler 1978; Ruckley 1978), one trial recruited patients recovering from coronary artery bypass grafting (Booth 2004), one trial patients recovering from a hip fracture (Crotty 2000), and another patients following a total knee replacement (Palmer Hill 2000). Out of the 21 trials eligible for the IPD, 11 recruited patients recovering from a stroke (Anderson 2000; Askim 2004; Bautz-Holter 2002; Donnelly 2004; Indredavik 2000; Manchester FASTER; Mayo 2000; Rodgers 1997; Rudd 1997; Suwenwela 2001; Widen-Holmqvist 1998), seven recruited older patients with a mix of conditions (Caplan 2006; Cunliffe 2004; Donald 1995; Harris 2005; Martin 1994; Richards 1998; Shepperd 1998) and three recruited patients with chronic obstructive pulmonary disease (COPD) (Cotton 2002; Ojoo 2002; Skwarska 2000). Four trials were excluded: two following discussion with the investigators (Melin 1993; Wade 1985) and two after extracting data (Hernandez 2003; Ronning 1998). The reasons for exclusion are listed in the ‘Characteristics of excluded studies’ table.
Interventions
In 13 trials care was provided in the patients’ homes by a hospital outreach service (Anderson 2000; Askim 2004; Bautz-Holter 2002; Booth 2004; Caplan 2006; Cotton 2002; Crotty 2002; Donnelly 2004; Harris 2005; Mayo 2000; Ojoo 2002; Palmer Hill 2000; Skwarska 2000), in nine trials by community services (Adler 1978; Cunliffe 2004; Donald 1995; Martin 1994; Richards 1998; Rodgers 1997; Ruckley 1978; Shepperd 1998; Widen-Holmqvist 1998) and in four trials care was coordinated by a hospital based stroke team or physician in conjunction with community based services (Donnelly 2004; Indredavik 2000; Mayo 2000; Rudd 1997). In each trial the care provided by the intervention was primarily nursing, but with additional care sometimes being provided by care assistants or home helps. Hospital at home interventions in 14 trials described employing specialist and dedicated nurses (Anderson 2000; Askim 2004; Bautz-Holter 2002; Booth 2004; Caplan 2006; Cotton 2002; Crotty 2002; Cunliffe 2004; Donnelly 2004; Harris 2005; Mayo 2000; Ojoo 2002; Palmer Hill 2000; Skwarska 2000). Physiotherapy care was provided by 15 of the interventions (Anderson 2000; Askim 2004; Bautz-Holter 2002; Crotty 2000; Cunliffe 2004; Donald 1995; Harris 2005; Indredavik 2000; Mayo 2000; Palmer Hill 2000; Richards 1998; Rodgers 1997; Rudd 1997; Shepperd 1998; Widen-Holmqvist 1998) and occupational therapist care by 15 (Anderson 2000; Askim 2004; Bautz-Holter 2002; Crotty 2000; Cunliffe 2004; Donald 1995; Donnelly 2004; Harris 2005; Indredavik 2000; Mayo 2000; Richards 1998; Rodgers 1997; Rudd 1997; Shepperd 1998; Widen-Holmqvist 1998). A social worker was part of the hospital at home team in five of the interventions (Anderson 2000; Crotty 2002; Cunliffe 2004; Harris 2005; Rodgers 1997) and two interventions included a dietitian (Mayo 2000; Rodgers 1997). Access to a speech therapist was described in four of the interventions (Anderson 2000; Crotty 2002; Harris 2005; Rodgers 1997). In one trial rehabilitation was provided by trained Red Cross volunteers (Suwenwela 2001).
Risk of bias in included studies
Seven criteria are recommended by the Cochrane Effective Practice and Organisation of Care (EPOC) Group to judge the quality of randomised studies; these are described elsewhere (see ‘METHODS USED IN REVIEWS’, ‘ASSESSMENT OF METHODOLOGICAL QUALITY’ under ‘GROUP DETAILS’ in The Cochrane Library). One of the criteria, follow-up of professionals, was not relevant to the trials included in this review. The remaining six criteria were used. In 18 trials the method of randomisation and concealment of allocation was clearly described (see the ‘Characteristics of included studies’ table) (Anderson 2000; Askim 2004; Bautz-Holter 2002; Caplan 2006; Cotton 2002; Crotty 2000; Cunliffe 2004; Donald 1995; Donnelly 2004; Harris 2005; Martin 1994; Mayo 2000; Ojoo 2002; Richards 1998; Rodgers 1997; Rudd 1997; Shepperd 1998; Widen-Holmqvist 1998). For the remaining trials it was unclear. None of the included trials based their sample size on a difference in mortality. Multiple outcomes were measured in all of the trials. The type of care the control group received was not clearly described for the majority of the trials.
Effects of interventions
Twenty six trials were included in this review (n = 3967), and 21 of these were eligible for the IPD meta-analysis. Thirteen of these 21 trials contributed data to the IPD meta-analysis (1899/2872; 66%). Of the eight trialists who were invited to contribute data but did not, two were unable to send their data (Cotton 2002; Skwarska 2000), three declined to participate (Caplan 2006; Donald 1995; Ojoo 2002) and three did not reply to requests to contribute data (Askim 2004; Indredavik 2000; Suwenwela 2001). Trials were conducted in the UK (Adler 1978; Booth 2004; Cotton 2002; Cunliffe 2004; Donald 1995; Donnelly 2004; Manchester FASTER; Martin 1994; Ojoo 2002; Palmer Hill 2000; Richards 1998; Rodgers 1997; Ruckley 1978; Rudd 1997; Shepperd 1998; Skwarska 2000), Australia (Anderson 2000; Caplan 2006; Crotty 2002) Canada (Mayo 2000), New Zealand (Harris 2005), Norway (Askim 2004; Bautz-Holter 2002; Indredavik 2000), Sweden (Widen-Holmqvist 1998) and Thailand (Suwenwela 2001).
The main analysis is based on individual patient data; we used published data when we did not have access to IPD. We have also included tables using published data for comparison with the results of the IPD meta-analysis. We report the analyses by the patients’ condition at recruitment: patients recovering from a stroke, older people with a mix of conditions, and those recovering from surgery.
1. Patient outcomes for those recovering from a stroke
Eleven trials recruited patients recovering from a stroke Anderson 2000; Askim 2004; Bautz-Holter 2002; Donnelly 2004; Indredavik 2000; Manchester FASTER; Mayo 2000; Rodgers 1997; Rudd 1997; Suwenwela 2001; Widen-Holmqvist 1998), of which nine contributed IPD.
Mortality
We combined IPD from seven trials recording the time to death at three to six months (n = 407) (Anderson 2000; Bautz-Holter 2002; Cunliffe 2004; Donnelly 2004; Manchester FASTER; Shepperd 1998; Widen-Holmqvist 1998) Analysis 4.2. There was a non-significant reduction in mortality, adjusted for age and sex (HR 0.79, 95% CI 0.32 to 1.91) (data from Anderson 2000 and Shepperd 1998 could not be adjusted as there were no events in the controls arms at follow-up). A sensitivity analysis of the effect of imputing missing dates, where we assigned the best and worse case scenarios to the intervention and comparison group, made little difference to the overall effect (Analysis 4.8; Analysis 4.9). We observed no significant heterogeneity.
Readmission
We relied on published data from three trials (n = 179) for this analysis as the date of readmission was missing from all except one trial providing IPD. We found no significant difference in readmission rates between those allocated to hospital at home rather than to in-patient care (RR 1.06, 95% CI 0.47 to 2.38) at three months follow-up (Analysis 1.9) (Bautz-Holter 2002; Rodgers 1997; Shepperd 1998) and at six months (RR 1.00, 95% CI 0.63 to 1.60) (Analysis 1.10) (Anderson 2000; Bautz-Holter 2002; Widen-Holmqvist 1998). We observed no significant heterogeneity.
Functional status
We relied on published data from nine trials assessing functional status with a range of different measures: each trial reported no significant differences between groups (Anderson 2000; Askim 2004; Bautz-Holter 2002; Donnelly 2004; Mayo 2000; Rodgers 1997; Rudd 1997; Shepperd 1998; Suwenwela 2001). The individual trials may have been underpowered to detect a difference in each direction. One trial (Widen-Holmqvist 1998) reported that those allocated to hospital at home perceived significantly more dysfunction at three months follow-up on the psychosocial dimension of the Sickness Impact Profile (SIP) (home rehabilitation median 16.6, IQR 8.7 to 29.1; routine rehabilitation median 10.0, IQR 6.1 to 15.6, P < 0.02) compared with in-patient hospital care. These differences disappeared at six months follow-up. A second trial (Indredavik 2000) recruiting patients recovering from a stroke reported that significantly more patients allocated to hospital at home were independent for activities of daily living, measured by a score of > 2 on the Rankin Scale at 26 weeks follow-up (OR 1.72, 95% CI 1.10 to 2.7). A subgroup analysis excluding patients with a mild stroke detected a significant improvement in global independence measured by the Rankin Scale at 26 weeks follow-up (difference 17.7%, 95% CI 5.3% to 30.1%, P = 0.006) and activities of daily living measured by the Barthel Index (difference 13.6%, 95% CI 1.1% to 25.9%; P = 0.03) (Analysis 1.1).
We combined IPD from two trials (Anderson 2000; Mayo 2000) measuring functional status with the Barthel Index using the standardised mean difference as each trial used a different scale. We found no overall difference between groups at three months (N = 174, standardised mean difference (SMD) 0.14 95% CI −0.16 to 0.43), or six months (N = 185, SMD 0.02, 95% CI −0.27 to 0.30) (Analysis 4.4; Analysis 4.5).
Quality of life and patient assessed health status
Each of the four trials measuring quality of life reported no significant differences, which may reflect that they were underpowered to detect a difference in either direction between groups (Anderson 2000; Askim 2004; Donnelly 2004; Rodgers 1997). One trial reported a significantly higher score at one month on the role physical subscale of the SF-36 for those allocated to early discharge hospital at home (mean difference 13.1; P < 0.02) and on the physical component summary of the SF36 at three months (mean difference 5.0; P < 0.05) (Mayo 2000) (Analysis 1.1).
Psychological well being
Two trials reported data on psychological well being; one reported a significantly lower score at three months (indicating better psychological well-being) for those allocated to early discharge hospital at home than to in-patient care on the General Health Questionnaire (median (IQR) treatment = 19.5 (14 to 26); control = 26 (19 to 31); 95% CI of the difference −9 to −1, P = 0.02). This difference disappeared at six months follow-up (Donnelly 2004). Rudd reported that 12% fewer people allocated to early discharge hospital at home reported anxiety on the Hospital Anxiety Depression scale (95% CI −22% to −0.81%) (Rudd 1997) (Analysis 1.1).
Patient satisfaction
Two trials reported significantly higher levels of patient satisfaction for those allocated to hospital at home rather than to in-patient care (Donnelly 2004; Widen-Holmqvist 1998) and one trial no significant differences between groups (Anderson 2000) (Analysis 1.1).
Place of residence at follow-up
We combined published data on place of residence from four trials (Anderson 2000; Bautz-Holter 2002; Indredavik 2000; Rodgers 1997) finding that significantly fewer patients allocated to early discharge hospital at home were living in residential accommodation at six months follow-up (RR 0.63, 95% CI 0.40 to 0.98) (Analysis 1.15).
Carer outcomes
Four trials measuring carer burden reported no significant differences between groups with the Carer Strain Index (Askim 2004; Donnelly 2004; Rudd 1997) or the GHQ 30 (Rodgers 1997) (Analysis 1.1).
Length of stay
We pooled published data from four trials and found a significant reduction in hospital length of stay (mean difference in days −6.68, 95% CI −10.19 to −3.17) (Askim 2004; Mayo 2000; Rudd 1997; Shepperd 1998) (Analysis 1.17). Hospital length of stay was reduced in the remaining trials recruiting patients recovering from a stroke (Anderson 2000; Bautz-Holter 2002; Donnelly 2004; Indredavik 2000; Rodgers 1997) with a median reduction ranging from −8 days (Donnelly 2004) to −15 days (Anderson 2000). Two trials reported median length of stay in hospital at home; this ranged from five (range 1 to 19) (Anderson 2000) to nine weeks (range 1 to 44 weeks) (Rodgers 1997) (Analysis 1.1).
Use of health service resources and cost
Two trials reported no significant difference in cost to the health service between early discharge hospital at home and in-patient care (Donnelly 2004; Rudd 1997). In both trials costs for each patient were based on their use of health services. One trial reported a significant reduction in hospital costs per patient (Aus$4678; 95% CI $-6680 to $-2676), although this became non-significant when community costs were taken into account (difference $-2013; 95% CI $-4696 to $669) (Anderson 2000). A second trial Mayo 2000 reported a significant reduction in health service costs at three months for those allocated to hospital at home (mean difference Canadian $-3280.95, P < 0.0001). In all four trials costs for each patient were based on their use of health services (see Analysis 1.1 for further details).
2. Older people with a mix of conditions
Seven trials recruited patients with a medical condition (Caplan 2006; Cunliffe 2004; Donald 1995; Harris 2005; Martin 1994; Richards 1998; Shepperd 1998) and three recruited patients with chronic obstructive pulmonary disease (COPD) (Cotton 2002; Ojoo 2002; Skwarska 2000). In one of these trials (Cunliffe 2004) 28% of the study population were recovering from a fracture, and in another 72% were recovering from surgery (Richards 1998). Five of these seven trials recruiting older patients with a medical condition contributed IPD, and one of these five trials recruited patients with COPD (Shepperd 1998). We combined the data from these trials.
Mortality
We combined IPD from four trials recording the time to death at three months (Cunliffe 2004; Harris 2005; Richards 1998; Shepperd 1998) and one trial (n = 54) with six months follow-up (Martin 1994) adjusted for age and sex (n = 980). There was no significant difference between groups (HR 1.06, 95% CI 0.69 to 1.61) (Analysis 4.1). A sensitivity analysis of the effect of imputing missing dates, where we assigned the best and worse case scenarios to the intervention and comparison group, made little difference to the overall effect (Analysis 4.6 and Analysis 4.7). In addition we pooled the published data from six trials (n = 1084); again there was no significant difference between groups (RR 1.12, 95% CI 0.77 to 1.63) (Analysis 1.2).
We pooled published data from the trials recruiting patients with chronic obstructive pulmonary disease, which resulted in a nonsignificant reduction in mortality favouring hospital at home (RR 0.50, 95% CI 0.23 to 1.09) (Analysis 1.7).
Readmissions
We combined IPD from three trials recording the time to readmission at three months (N = 705) (Cunliffe 2004; Harris 2005; Shepperd 1998). There was a significant increase in readmissions for those allocated to hospital at home rather than in-patient care (adjusted for age and sex, HR 1.57; 95% CI 1.10 to 2.24) (Analysis 4.3). The direction of effect remained the same in a pooled analysis of published data from five trials (N = 969, RR 1.35, 95% CI 1.03 to 1.76) (Analysis 1.8).
Functional status and quality of life
Five trials recruiting older patients with a medical condition (Caplan 2006; Donald 1995; Harris 2005; Martin 1994; Shepperd 1998), two trials recruiting patients with chronic obstructive airways disease (Ojoo 2002; Shepperd 1998) and one patients with a mix of conditions (primarily surgical) (Richards 1998) measured functional ability and/or quality life, and each trial reported no significant differences between those allocated to hospital at home and in-patient hospital care. We combined the published data from four of these trials measuring the Barthel Index and found no significant difference between groups (weighted mean difference 0.14; 95% CI −0.02 to 0.30) (Analysis 1.13). One trial recruiting older patients with a mix of medical and surgical conditions reported significantly improved scores for those allocated to early discharge hospital at home on two domains of the Nottingham Extended Activities of Daily Living Scale: kitchen (mean difference 1.1, 95% CI 0.2 to 2.3), and domestic (mean difference 1.1, 95% CI 0.2 to 2.0) at three months follow-up. This trial also reported a significant difference for the Barthel Index favouring the early discharge group. At 12 months this improvement was sustained for the Nottingham Extended Activities of Daily Living domestic scale (mean difference 1.4, 95% CI 0.4 to 2.4) (Cunliffe 2004).
Psychological well being
Five trials measuring psychological well being reported no significant differences between groups at follow-up (Caplan 2006; Donald 1995; Harris 2005; Martin 1994; Shepperd 1998). One trial reported significantly improved scores on the General Health Questionnaire for patients allocated to early discharge hospital at home (mean difference −2.4, 95% CI −4.1 to −0.7) at three months follow-up, and at 12 months follow-up (mean difference −1.9, 95% CI −3.5 to −0.4) (Cunliffe 2004) (Analysis 1.1).
Patient satisfaction
Three trials recruiting older patients reported significantly increased levels of satisfaction for those allocated to early discharge hospital at home (Caplan 2006; Ojoo 2002; Shepperd 1998). One trial reported no significant differences between groups (Harris 2005). Some of the results were ambivalent, with patients reporting improved satisfaction on some domains and not others (Richards 1998; Shepperd 1998). One trial interviewed patients to find out how they viewed early discharge hospital at home care. The majority of patients were very positive about their experience, citing good communication, frequent and timely visits, and close attention to detail as positive aspects of the service (Cunliffe 2004) (Analysis 1.1).
Place of residence
We combined published data from three trials; significantly fewer people allocated to hospital at home were in residential care at one year follow-up (RR 0.69, 95% CI 0.48 to 0.99) (Cunliffe 2004; Donald 1995; Martin 1994) (Analysis 1.14).
Carer outcomes
Three trials measuring self-reported carer satisfaction or burden (Gunnell 2000; Ojoo 2002; Shepperd 1998) reported no significant differences between the groups of carers. One trial reported that a greater number of carers in the hospital at home group compared with the in-patient group were happy with their allocated type of care (difference 42%; 95% CI 12% to 72%) (Ojoo 2002) (Analysis 1.1).
Length of hospital stay
We did not pool data for this outcome due to significant heterogeneity. There were non-significant reductions in hospital length of stay in three trials by five days (mean difference −5.12, 95% CI −12.90 to 2.66) (Cunliffe 2004), 11 days (95% CI −22.17 to 0.17) (Richards 1998) and less than one day (mean difference −0.36, 95% CI −6.20 to 5.48) (Shepperd 1998). One trial reported a significant reduction of nearly 20 days (mean difference −19.78, 95% CI −28.27 to −11.29) (Caplan 2006). The trial by Donald et al reported a reduced length of stay for those receiving hospital at home, with a median reduction of six days (P = 0.002) (Donald 1995); another trial reported a mean reduction of −22.4 days (Martin 1994). Two trials recruiting patients with COPD reported a non-significant reduction in hospital stay for those allocated to hospital at home of 1.5 days (Ojoo 2002) and just over three days (Cotton 2002). One trial reported a significant median reduction of two days (Skwarska 2000) (Analysis 1.1).
Total days of care (hospital plus hospital at home)
Data from three trials combining hospital length of stay with hospital at home days of care were pooled. Those allocated to hospital at home had significantly more days of care (mean difference 6.43, 95% CI 2.84 to 10.03) (Harris 2005; Richards 1998 Shepperd 1998) (Analysis 1.19). Two other trials reported a significant increase in the total days of care received for those allocated to hospital at home (Cotton 2002; Ojoo 2002) (Analysis 1.1).
Cost
No significant difference between groups in health service costs for older medical patients was reported for one trial. This trial conducted a cost minimisation analysis from the perspective of the health service, taking into account the different resources used during a patient’s hospital admission. However, a significant increase in cost for GP home and surgery visits was detected for those allocated to hospital at home (median difference £22.65, P < 0.01) (Shepperd 1998). Two trials recruiting patients with COPD reported a lower mean health service cost based on an average cost per bed day for patients allocated to early discharge hospital at home (Cotton 2002; Skwarska 2000), whereas another trial reported a significant increase in costs (median difference £1132.00, P < 0.01) when taking into account the different resources used during a patient’s in-patient admission (Shepperd 1998). A fourth trial, recruiting older people with a mix of conditions, conducted a cost-effectiveness analysis and reported that early discharge hospital at home was less expensive than in-patient hospital care at 12 months follow-up (mean reduction per case £1727, P = 0.05). Costs of in-patient hospital care were based on length of stay and cost per bed day by clinical specialty using local NHS reference cost schedules for 2000 (Miller 2005). A sensitivity analysis halved the cost of the bed days to test the assumption that costs at the end of an episode of in-patient care may be lower than the initial days. This reduced the cost difference with data points on a cost-effectiveness plane distributing more closely around the origin, meaning that hospital at home is not cost-effective if the reduction in resources used towards the end of in-patient admission is taken into account. However, the varying use of resources will depend on a patient’s condition and a 50% reduction in cost may not accurately reflect the marginal savings of early discharge. See Analysis 1.1 for further details of these results.
Staff views
One trial interviewed staff providing the early discharge hospital at home scheme to elicit their views on the way care was provided (Cunliffe 2004). There was a perception that providing care in the patients’ homes facilitated patients’ participation with their rehabilitation. Staff also reported that the service was better staffed than the usual after care services provided, and that rehabilitation services were coordinated with social care.
3. Early discharge of patients following elective surgery
The published results of six trials evaluating the effectiveness of hospital at home for patients discharged early from hospital following elective surgery are reported (Adler 1978; Booth 2004; Crotty 2000; Palmer Hill 2000; Ruckley 1978; Shepperd 1998).
Patient outcomes
Mortality
One trial reported data on mortality, with one patient recovering from a hip replacement and allocated to in-patient care dying during the three month follow-up (Shepperd 1998).
Re-admission to hospital
Differences in study populations prevented data being combined and data are presented for individual trials in a forest plot (Analysis 1.23). One trial recruiting patients following surgery for hernia or varicose veins reported 0/117 allocated to early discharge hospital at home versus 2/121 patients allocated to in-patient care were re-admitted (Ruckley 1978), another that 2/37 (5%) versus 1/49 (2%) (RR 2.65, 95% CI 0.25 to 28.11) of patients recovering from a hip replacement, 4/47 (9%) versus 1/39 (3%) (RR 3.32, 95% CI 0.39 to 28.49) of patients recovering from a knee replacement and 7/114 (6%) versus 13/124 (10%) (RR 0.59 95% CI 0.24 to 1.42) of patients recovering from a hysterectomy were re-admitted (Shepperd 1998).
Patient assessed outcomes
There was insufficient evidence of a difference in clinical complications, functional status, quality of life or psychological well-being between groups in two trials recruiting patients recovering from hernia repair or varicose vein surgery (Adler 1978; Ruckley 1978). Another trial (Shepperd 1998) reported improved quality of life on the Dartmouth COOP chart for patients allocated to hospital at home and recovering from a hip replacement (mean difference 0.5; 95% CI 0.13 to 0.88). A significant improvement was detected for patients recovering from a fractured neck of femur and allocated to hospital at home at four months follow-up on the Modified Barthel Index (median difference in change from baseline to follow-up of three points) and the Falls Efficacy Scale (median difference from baseline to follow-up of 11 points) (Crotty 2000). There was insufficient evidence of differences between groups for other measures of patient assessed outcome. One trial reported that 14/46 (30%) of patients recovering from a knee replacement and allocated to hospital at home remained in hospital (Shepperd 1998); Palmer-Hill and colleagues report that 6% of patients recovering from a knee replacement and allocated to hospital at home remained in hospital (Palmer Hill 2000) (Analysis 1.20).
Patient satisfaction
In one trial (Ruckley 1978) patients were asked their views about their care in terms of advantages and disadvantages. Patients in the early discharge group reported an increased advantage for themselves compared to those staying in hospital (difference 13.8%; 95% CI 5% to 23%, P < 0.01). However, these patients perceived their carers to be at a disadvantage (difference 21.8%, 95% CI 11% to 32%, P < 0.001). No significant differences were reported for satisfaction with services for patients recovering from a hip or knee replacement, hysterectomy (Shepperd 1998), hernia or varicose vein repair (Adler 1978) or a fracture neck of femur (Crotty 2000). Significantly more women recovering from a hysterectomy and allocated to hospital at home reported that they resumed parental responsibilities before being well enough (mean difference -0.24 on a scale of 0 to 3, 95% CI −0.46 to −0.02) (Shepperd 1998). Differences were reported for patients’ preferred place of care, with each group of patients preferring care at home (difference for patients recovering from a hip replacement 35.7%, 95% CI 16.7% to 54.8%; difference for patients recovering from a knee replacement 34%, 95% CI 14% to 54%; difference for women recovering from a hysterectomy 19%, 95% CI 8% to 30%) (Shepperd 1998) (Analysis 1.20).
Carer outcomes
In one trial (Adler 1978) evaluating the early discharge of patients following elective surgery, carers in the early discharge group were less satisfied than those in the control group. In another trial (Ruckley 1978) carers were asked their views about the care the patients they were looking after received in terms of advantages and disadvantages. Carers looking after patients in the early discharge group reported an increased advantage for others involved in the patients’ care (difference 16.6%, 95% CI 6.9% to 26%) compared to patients who stayed in hospital for the usual length of stay. However, the carers perceived an added disadvantage for themselves (difference 22.6%, 95% CI 12% to 33%) and for the patients they were caring for (difference 10.6%, 95% CI 1.2% to 20%) compared to the carers looking after patients who stayed in hospital for the usual length of stay. Two other trials measuring carer satisfaction reported no significant differences for carers of patients recovering from a hip or knee replacement, hysterectomy (Shepperd 1998) or fractured neck of femur (Crotty 2000). However, a lower proportion of carers of women recovering from a hysterectomy reported hospital at home as their preferred place of care (difference −27%, 95% CI −40% to −14%) (Shepperd 1998) (Analysis 1.20).
Hospital length of stay
We combined data from four trials for patients recovering from orthopaedic surgery (Crotty 2000; Cunliffe 2004; Richards 1998; Shepperd 1998) with a mean reduction in hospital length of stay −4.44 days (95% CI −6.37 to −2.51) (Analysis 1.21). One trial recruiting women recovering from a hysterectomy reported a significant reduction of −1.44 days (−2.09 to −0.79), and another recruiting patients recovering from bypass surgery a significant reduction of −2.7 days; P < 0.001 (Booth 2004).
Total length of stay (hospital plus hospital at home)
We combined data on patients recovering from orthopaedic surgery from two trials (Shepperd 1998; Richards 1998) for total days of care. There was a significant increase in total days of care for patients allocated to hospital at home compared with hospital care (mean difference 2.79; 95% CI 0.77 to 4.81) (Analysis 1.22). No significant difference was observed for women recovering from a hysterectomy (mean difference 1.66; 95% CI 0.94 to 2.39) (Shepperd 1998). A significant increase of 14 days of care was reported for those recovering from a hip fracture (95% CI 7.58 to 20.42, P < 0.001) (Crotty 2000).
Cost
Three trials reported cost data (Adler 1978; Ruckley 1978; Shepperd 1998) and two provided estimates of cost that were not based on collection of resource data at the patient level for both arms of the trial (Adler 1978; Ruckley 1978), therefore it was not possible to calculate estimates of variance or conduct statistical analysis. One trial recruited patients with a mix of medical and surgical patients (Richards 1998) and reported that hospital at home was less costly than hospital care (measuring costs at the point of randomisation) (mean cost per patient over three months £2516 versus £3292). Although the hospital at home service was costed for each patient’s use of resources, hospital services were not. In addition, the method used to collect the data did not allow statistical analyses to be conducted. It was, therefore, not possible to get an idea of the uncertainty associated with the estimates. The authors conducted a sensitivity analysis of hospital costs to assess the impact of using average costs. When hospital costs were taken as 50% of the original costs there was no significant difference in cost. However, it has been argued that 50% continues to overestimate the costs because of the non-linear relationship between cost of care and its intensity (Lilford 1998). Another trial conducting a cost minimisation analysis used patient dependency scores developed by hospital nursing and medical staff to reflect the marginal costs incurred during a patient’s episode of hospital care (and hence the marginal savings of early discharge). These scores were used to estimate the costs of each day a patient was in hospital to reflect the differential use of resources during a patient’s in-patient stay (Shepperd 1998). No significant difference in total health care costs between groups was detected for patients recovering from a hip or knee replacement and health care costs were significantly increased for women discharged early following a hysterectomy (difference £92.39, ratio of geometric mean 1.15, 95% CI 1.04 to 1.29). A sensitivity analysis reducing the number of hospital at home days altered the results for patients recovering from a hysterectomy. A reduction of one day eliminated the cost difference for women recovering from a hysterectomy, while a reduction of two days altered the costs making hospital at home the less expensive option for this patient group. This trial also reported no significant difference in costs to general practice for GP home or surgery visits. A trial recruiting patients recovering from bypass surgery reported a non-significant difference in health care costs at twelve weeks (Booth 2004) (Analysis 1.20).
DISCUSSION
We included 26 trials in this systematic review of early discharge hospital at home, of which 13 out of a possible 21 (66% of the available patient data) contributed data to the IPD meta-analysis. We performed meta-analyses where there was sufficient similarity among the trials in terms of recruited participants and where common outcomes had been measured. Although there was insufficient evidence of differences between groups for mortality and readmission, and most measures of functional ability or quality of life, patients allocated to hospital at home had a significantly reduced risk of being in residential care at follow-up. This was true for patients recovering from a stroke and older patients with a mix of medical diagnoses. Overall hospital at home appears to result in an increase in patient satisfaction, and the little data available on carer burden indicate no self reported increase in burden.
It would be naïve to expect a complex intervention such as hospital at home to be equally effective for all those requiring medical care. Although any differences may reflect the way individual interventions are delivered, the effect appears to be consistent within the different patient groups, suggesting that the type of patient groups selected and the degree to which they rely on ‘in-patient acute care’ and rehabilitation is important. One trial, in a sensitivity analysis, found that the severity of the patient’s condition determined the cost difference between early discharge hospital at home and in-patient care, with home based care being more cost-effective than hospital care if limited to patients with mild disability (Anderson 2000).
Early discharge hospital at home can be seen as a substitute for hospital care and as a means to control spending on acute hospital beds, although the provision of early discharge hospital at home can offset any reduction in hospital length of stay by increasing total length of care. However, even if hospital at home were to compare favourably with the cost of hospital care other factors may restrict the degree to which substitution could occur, including the carers’ willingness to take on the responsibilities associated with hospital at home. This could reduce the already low volume of patients admitted to hospital at home, thus making the closure of a ward or hospital in favour of hospital at home an unrealistic option in some countries. Alternatively, hospital at home may be provided to supplement existing services, which could be an acceptable policy option for some groups of patients. However, the studies included in this review do not provide compelling evidence that hospital at home produces cost savings, nor that costs are shifted from secondary to primary care.
It is important to take into account the transitional nature of hospital at home when determining effectiveness, particularly with early discharge hospital at home schemes. Ways of delivering health care services alter as the organisational boundaries of health care change. For example, two of the trials included in this review were conducted nearly 30 years ago. Both trials evaluated the early discharge of patients following elective surgery (Adler 1978; Ruckley 1978). However, given the overall reduction in hospital length of stay, the use of day case surgery and the introduction of minimally invasive surgery these trials have limited relevance today and data were not sought for the IPD meta-analysis. Conversely, there are some conditions, such as myocardial infarction, where it has been reported that admission to hospital has been avoided by the use of hospital at home (Mather 1976; Hill 1978). However, with the advent of thrombolytic therapy it may no longer be appropriate for these patients to receive all their care outside a secondary care setting. Problems can also arise when comparisons are made between countries. Interpreting the function of services in different health care systems is not always straightforward. For example, the expansion of home care services in some countries, such as the United States, may resemble primary care services already established in another country, not hospital at home care (Hughes 2000).
AUTHORS’ CONCLUSIONS
Implications for practice
This review does not support the widespread development of early discharge hospital at home services as a cheaper substitute for in-patient care within health care systems that have well developed primary care services; nor has it demonstrated that hospital at home is so hazardous or expensive that existing schemes for patients recovering from a stroke, and older patients recovering from a mix of conditions, including orthopaedic surgery and COPD, or patients who have had elective surgery, should be discontinued.
The environment in which these services are being delivered may influence outcome. It may be that schemes such as hospital at home provide a cost effective alternative to acute care if the running costs of the local hospital are relatively high. For example, the costs of a city teaching hospital are likely to exceed those of a district general hospital, making it more likely that an alternative service with few fixed costs, such as hospital at home, would compare favourably in terms of cost. Differences in the way the service is delivered may also account for differences in cost. Some of the trials included in the review evaluated hospital at home schemes that did not provide 24 hour care.
The low volume of patients admitted to hospital at home limits the degree to which these types of service reduce reliance on secondary care. Crotty and colleagues compared those eligible for their trial with those who were not, and found that while staff estimated that 36% of patients recovering from a fractured hip were eligible for their trial, only 20% were both eligible and consented to take part in the trial (Crotty 2000). Cunliffe and colleagues (Cunliffe 2004) report that just 2% of all medical admissions of older people to hospital were referred to an early discharge hospital at home scheme, and another trial that about 1% were (Shepperd 1998). Crotty et al concluded that their hospital at home service was suitable for the least disabled group of patients and remains an unacceptable option for some patients and their families. The closure of a ward in favour of hospital at home becomes even less realistic if, as is often the case, patients are admitted to hospital at home from a variety of different wards and across a number of clinical areas. Although this has the advantage of increasing the number of patients admitted to hospital at home it makes it difficult to release resources from secondary care.
Implications for research
Future primary research should focus on rigorous evaluations of early discharge hospital at home schemes for the following patient groups: those recovering from a stroke, those with chronic obstructive pulmonary disease and older patients with a mix of medical conditions requiring an acute hospital in-patient stay. Trials should be large enough to rule out important differences in mortality and readmission. Patient health outcomes, patient and carer satisfaction, resource utilisation and costs should be measured using standardised methods and studies should include a formal, planned economic analysis using costs that are sensitive to the different resources used during an episode of care. To varying degrees researchers evaluating interventions with multiple components face difficulties in defining and interpreting the way an intervention, and its comparator, was delivered. The type of service being provided should be clearly defined, both at home and in hospital, and the patient groups described. Context may also have a role to play and should be accounted for with interventions such as hospital at home. For example, the development of other services at the primary-secondary care interface, such as community hospitals or rapid response health and social care teams, may affect the use of hospital beds and the type of services being offered as an alternative.
Such an ideal study may be difficult to mount, since the investment needed to create a service with sufficient patient numbers may be prohibitive, even if patients and carers could be recruited to it in the appropriate numbers. Individual patient data meta-analysis may continue to be the way forward. However, this requires agreement about the way data are measured and reported, and the recording of when key events such as death and readmission occurred.
Research data on how these types of schemes are implemented once the restrictions of a research design have been removed are lacking. Implementation research could shed light on the way these services function at the interface of primary and secondary care, how they may evolve outside a research setting, and why some of these services alter in terms of the types of patients they admit and the goals of the service. Related to this and to the expansion of this type of service are carer’s views and the burden they may experience by participating in hospital at home care. While there are a small amount of data on those participating in trials little is known about how carer’s view these types of service outside a research setting, i.e. those eligible but not consenting to take part in a trial and those outside a research setting who have the option of using hospital at home.
PLAIN LANGUAGE SUMMARY.
Services for patients discharged home early
There continues to be, in some countries, more demand for acute care hospital beds than there are beds. One way to free up beds to make room for other people being admitted is to discharge patients home early. But the patients who are discharged still need acute care. Therefore, special home services have been developed. These services are usually provided by a team of health care professionals, such as doctors, nurses and physiotherapists. The team visits the home of people who have been discharged early to provide them with acute hospital care in their homes.
A review of the effect of services for patients discharged home early was conducted. After searching for all relevant studies, 26 studies were identified. The studies looked at the effect of these services in patients with different types of conditions: patients who had a stroke, patients who had surgery, and elderly patients who had different types of conditions.
There was insufficient evidence that providing services to people at home after being discharged home early may increase the risk of death or readmission; or adversely effect quality of life or the completion of daily activities (such as dressing or daily chores). Patients who had a stroke or elderly patients may have less risk of being admitted to residential care if they are discharged home early with hospital at home services.
Patients may also be more satisfied with their care at home, and at the same time their carers, in most cases, did not report additional burden. However, there is little evidence of cost savings to the health care system of discharging patients home early to hospital at home care.
ACKNOWLEDGEMENTS
The authors would like to acknowledge the valuable advice from Mike Clarke and comments on earlier versions of this review from Jeremy Grimshaw and Andy Oxman.
SOURCES OF SUPPORT
Internal sources
Anglia and Oxford NHS Research and Development Programme, UK.
External sources
NIHR Research Scientist in Evidence Synthesis Award, UK.
CHARACTERISTICS OF STUDIES
Characteristics of included studies [ordered by study ID]
| Methods | RCT Concealment of allocation: NOT CLEAR Blinded assessment of outcomes: NOT CLEAR Follow-up of patients: DONE Baseline measurement: NOT DONE Reliable primary outcome measures: DONE Protection against contamination: NOT CLEAR |
|
| Participants | Location: UK Patients following elective surgery (hernia and varicose veins) Age: 18 to 64 years Treatment = 117 Control = 107 (in 27 months) |
|
| Interventions | Hospital at home (early discharge) Type of service: early discharge from hospital; no night care; organised by hospital surgeons, provided by community; clinical responsibility held by GP Skill mix and size of HAH teams: 21 home helps 52 district nurses No dedicated staff Control group: in-patient hospital care |
|
| Outcomes | Clinical complications Patient satisfaction Carer satisfaction |
|
| Notes | Outcomes measured at: 7 days 6 weeks 2 to 3 years for recurrence |
|
| Risk of bias | ||
| Bias | Authors’ judgement | Support for judgement |
| Allocation concealment (selection bias) | High risk | C - Inadequate |
| Methods | RCT Concealment of allocation: DONE Blinded assessment of outcomes: NOT CLEAR Follow up of patients: 1, 3, 6, 12 months Baseline measurement: DONE Reliable primary outcome measure: DONE Protection against contamination: DONE |
|
| Participants | Location: Australia Patients recovering from a stroke Mean age: 72 years Treatment = 42 Control = 44 |
|
| Interventions | Hospital at home early discharge Type of service: specialist rehabilitation nurses; therapy sessions in patient’s home and individually tailored to achieve mutually agreed goals over several weeks. Emphasis on self-learning, adjustment to disability and structured practice sessions were encouraged between sessions Occupational therapy, physiotherapy, speech therapist Control group: in-patient hospital care |
|
| Outcomes | Mortality Health status Functional status Quality of life Satisfaction Readmissions Length of stay |
|
| Notes | ||
| Risk of bias | ||
| Bias | Authors’ judgement | Support for judgement |
| Allocation concealment (selection bias) | Low risk | A - Adequate |
| Methods | RCT Concealment of allocation: DONE Blinded assessment of outcomes: DONE Follow-up of patients: 6, 26, 52 weeks Baseline measurement: DONE Reliable primary outcome measure: DONE Protection against contamination: DONE |
|
| Participants | Location: Norway Patients recovering from a stroke Mean age: treatment = 76.9 control = 76.3 Treatment = 31 Control = 31 |
|
| Interventions | Early discharge outreach Type of service: physiotherapy, occupational therapy and dedicated nursing; stroke unit + home based programme of follow up care + primary health care. Home visit if patient lives within 30 to 45 minute radius of hospital, if greater than this the primary health team visited the home. Follow up plan made with family and primary health care providers. Mobile team established a service and support system. Meeting with physician and stroke team + patient and family on the day of discharge to define follow-up care plans. For patients with extensive deficits plans for further rehabilitation were made. Once home contact was maintained by phone + at least one other home visit. Follow up by mobile team terminated with an out-patient consultation (for those living within 30 to 40 minutes away from the hospital) or home visit (if more than 35 to 40 minutes). Local information meeting if a group of recruited patients lived in the same area Control group: in-patient hospital care |
|
| Outcomes | Mortality Readmission Functional status Health status Carer views Length of stay |
|
| Notes | ||
| Risk of bias | ||
| Bias | Authors’ judgement | Support for judgement |
| Allocation concealment (selection bias) | Low risk | A - Adequate |
| Methods | RCT Concealment of allocation: DONE Blinded assessment of outcomes: DONE Follow-up of patients: 1 week, 3, 6 months Baseline measurement: DONE Reliable primary outcome measure: DONE Protection against contamination: NOT CLEAR |
|
| Participants | Location: Norway Recovering from a stroke Median age (IQR): treatment = 79.5 (69 to 84); control = 78 (74 to 82) Treatment = 42 Control = 40 |
|
| Interventions | Early discharge, hospital outreach community based rehabilitation Type of service: multidisciplinary hospital based team (1 nurse, 1 occupational therapist, 1 physiotherapist) plus community nurses Control group: in-patient hospital care |
|
| Outcomes | Mortality Functional ability Psychological well being Place of residence Readmissions Length of stay |
|
| Notes | ||
| Risk of bias | ||
| Bias | Authors’ judgement | Support for judgement |
| Allocation concealment (selection bias) | Low risk | A - Adequate |
| Methods | RCT Concealment of allocation: NOT CLEAR Blinded assessment of outcomes: NOT CLEAR Follow-up of patients: 3 months Baseline measurement: DONE Reliable primary outcome measure: DONE Protection against contamination: DONE |
|
| Participants | Location: UK Patients with ischaemic heart disease, first time isolated bypass surgery Age: no data Treatment = 65 Control = 32 |
|
| Interventions | Early discharge outreach Type of service: specialist hospital based nurses with enhanced preoperative preparation and planned early discharge with specialist home care at 4 (+/−1) days after surgery. Admission to hospital on the day of surgery Control group: in-patient hospital care |
|
| Outcomes | Health status Quality of life Length of stay Cost |
|
| Notes | Had to have a carer available | |
| Risk of bias | ||
| Bias | Authors’ judgement | Support for judgement |
| Allocation concealment (selection bias) | Unclear risk | B - Unclear |
| Methods | RCT Concealment of allocation: DONE Blinded assessment of outcomes: NOT DONE Follow-up of patients: 1 and 6 months Baseline measurement: DONE Reliable primary outcome measure: DONE Protection against contamination: DONE |
|
| Participants | Location: Australia Elderly patients whose length of hospital stay exceeded 6 days, who were referred for geriatric rehabilitation and expected to return home and live reasonably independently Mean age: treatment = 83.86 (7.8); control = 84.0 (7.02) Treatment = 70 Control = 34 |
|
| Interventions | Early discharge hospital based outreach Type of service: nurses, physiotherapy, occupational therapy, physician Control group: in-patient hospital care |
|
| Outcomes | Mortality Functional and cognitive status Psychological well being Satisfaction Readmission Length of stay Cost |
|
| Notes | ||
| Risk of bias | ||
| Bias | Authors’ judgement | Support for judgement |
| Allocation concealment (selection bias) | Low risk | A - Adequate |
| Methods | RCT Concealment of allocation: DONE Blinded assessment of outcomes: NO Follow-up of patients: 2months Baseline measurement: DONE Reliable primary outcome measure: DONE Protection against contamination: DONE |
|
| Participants | Location: UK Patients with chronic obstructive pulmonary disease, recruited from medical wards Mean age: treatment = 65.7 (SD 1.6); control = 68 (SD 1.2) Treatment= 41 Control = 40 |
|
| Interventions | Hospital at home (early discharge) Type of service: emergency admissions recruited from the ward (early discharge within 3 days of readmission) respiratory nurse (did not prescribe), GP provided out of hours medical care Control group: in-patient hospital care |
|
| Outcomes | Outcomes Readmission Hospital length of stay Mortality |
|
| Notes | ||
| Risk of bias | ||
| Bias | Authors’ judgement | Support for judgement |
| Allocation concealment (selection bias) | Low risk | A - Adequate |
| Methods | RCT Concealment of allocation: DONE Follow up of patients: 4 months Blinded assessment of outcomes: YES (ASSESSOR, NOT PATIENT) Baseline measurement: DONE Reliable primary outcome measure: DONE Protection against contamination: DONE |
|
| Participants | Location: Australia (3 metropolitan hospitals, Adelaide) Patients with a hip fracture, excluded from participating if they did not have a telephone at home or inadequate social support Median age: treatment = 81.6; control = 83.5 Treatment = 34 Control = 32 |
|
| Interventions | Hospital at home (early discharge) Type of service: rehabilitation: physiotherapy, occupational therapy, speech therapist, social worker, therapy aid, nursing care, and assistance with shopping and cleaning; based on short term treatment goals negotiated with patient and carer. Therapy adapted to rate of patient’s progress Control group: in-patient hospital care |
|
| Outcomes | Mobility (Timed Up & Go) Physical function: activities - specific Balance Confidence Scale, Falls Efficacy Scale, Berg Balance Scale, London Handicap Scale Health related quality of life (SF 36) Adverse events Patient & carer satisfaction Carer strain (Caregiver Strain Index) |
|
| Notes | ||
| Risk of bias | ||
| Bias | Authors’ judgement | Support for judgement |
| Allocation concealment (selection bias) | Low risk | A - Adequate |
| Methods | RCT Concealment of allocation: DONE Follow up: 1, 3 and 12 months Blinded assessment of outcomes: NO Baseline measurement: DONE Reliable primary outcome measure: DONE Protection against contamination: DONE |
|
| Participants | Location: UK (Nottingham) 3 most common conditions were fractures (105/370, 28%), neurological conditions, mainly stroke (97/370, 26%), cardio-respiratory illnesses (50/370,14%). 247/370 (66%) lived alone Median age: 80 years Treatment = 185 Control = 185 |
|
| Interventions | Hospital at home (early discharge) Type of service: provided by community services, GP had clinical responsibility, physiotherapy, occupational therapy, 3 dedicated nurses plus 7 rehabilitation assistants, provided care up to 4 weeks. Community care officer liaised with social services Control group: in-patient hospital care |
|
| Outcomes | Mortality Readmission Functional ability Quality of life Psychological well-being (patient and carer) Cost |
|
| Notes | ||
| Risk of bias | ||
| Bias | Authors’ judgement | Support for judgement |
| Allocation concealment (selection bias) | Low risk | A - Adequate |
| Methods | RCT Concealment of allocation: DONE Blinded assessment of primary outcomes: NOT DONE Follow up of patients: DONE (6 weeks, 12 weeks, 6 months) Baseline measurement: DONE Reliable primary outcome measures: DONE Protection against contamination: NOT CLEAR |
|
| Participants | Location: UK Elderly medical patients Age: 76 to 90 years Number of patients in 5 months: treatment = 30; control = 30 |
|
| Interventions | Hospital at home (early discharge) Type of service: organised by hospital, provided by community; GP provided routine and emergency care Type of scheme: early discharge; not clear if 24-hour care provided; time limit of 6 weeks Skill mix: 1 nurse manager, 1 physiotherapist, 1 occupational therapist, 3 assistants (part time) Control group: in-patient hospital care |
|
| Outcomes | Mortality Functional status Psychological well-being In-patient hospital days Use of other health services |
|
| Notes | ||
| Risk of bias | ||
| Bias | Authors’ judgement | Support for judgement |
| Allocation concealment (selection bias) | Low risk | A - Adequate |
| Methods | RCT Concealment of allocation: DONE Blinded assessment of outcomes: NOT DONE (just at baseline) Follow-up of patients: 12 months Baseline measurement: DONE Reliable primary outcome measure: DONE Protection against contamination: DONE |
|
| Participants | Location: UK (Belfast) Recovering from a stroke Median age: treatment = 68; control = 71 Treatment = 54 Control = 59 |
|
| Interventions | Early discharge community based Type of service: average of 2.5 home visits a week for 3 months, each visit lasting 45 minutes. Multidisciplinary meetings held to discuss the assessment of patients and progress towards rehabilitation goals, which were set by relatives, patient and therapist. Patients discharged to home following home assessment and placement of aids and equipment. Physiotherapist, occupational therapist, nurses, speech therapist Control group: in-patient hospital care |
|
| Outcomes | Mortality Readmission Functional status Quality of life Satisfaction Carer burden Length of stay Cost |
|
| Notes | ||
| Risk of bias | ||
| Bias | Authors’ judgement | Support for judgement |
| Allocation concealment (selection bias) | Low risk | A - Adequate |
| Methods | RCT Concealment of allocation: DONE Blinded assessment of outcomes: NOT DONE Follow-up of patients: 10, 30, 90 days Baseline measurement: DONE Reliable primary outcome measure: DONE Protection against contamination: DONE |
|
| Participants | Location: New Zealand In hospital for less than 36 hours in the emergency department of acute assessment ward (admission avoidance), or admitted and with help of hospital at home services could be discharged home earlier than would otherwise have been the case (early discharge). Patients had a broad range of diagnoses: fractures (28%); miscellaneous medical problems (18%); respiratory problems (16%); stroke and neurological diagnoses (14%); falls and injuries (11%); cardiac diagnoses (8%); and rehabilitation and other problems (5%) Mean age: 80 years (80.7% aged < 75 years) Treatment = 143 Control = 142 |
|
| Interventions | Early discharge hospital based outreach Type of service: coordinated rehabilitation multidisciplinary team - physiotherapy, occupational therapy, social care, nursing Control group: in-patient hospital care |
|
| Outcomes | Mortality Readmission Functional status Cognitive status Quality of life Satisfaction Carer burden Length of stay Cost |
|
| Notes | ||
| Risk of bias | ||
| Bias | Authors’ judgement | Support for judgement |
| Allocation concealment (selection bias) | Low risk | A - Adequate |
| Methods | RCT Concealment of allocation: NOT CLEAR Follow up of patients: 6 weeks, 26 weeks Blinded assessment of outcomes: YES Baseline measurement: DONE Reliable primary outcome measure: DONE Protection against contamination: DONE |
|
| Participants | Location: Norway Patients recovering from a stroke Mean age: treatment = 74; control = 73.8 Treatment = 160 Control = 160 |
|
| Interventions | Hospital at home (early discharge) Type of service: mobile team based in a stroke unit and worked with primary care team Skill mix: nurse, physiotherapist, occupational therapist, stroke physician Control group: combined active and rehabilitation stroke unit and further follow-up organised by rehabilitation clinic and/or primary health care system |
|
| Outcomes | Mortality Functional status Place of residence Hospital length of stay |
|
| Notes | ||
| Risk of bias | ||
| Bias | Authors’ judgement | Support for judgement |
| Allocation concealment (selection bias) | Unclear risk | B - Unclear |
| Methods | RCT No details on methods |
|
| Participants | Location: UK Patients recovering from a stroke |
|
| Interventions | Hospital at home (early discharge) | |
| Outcomes | Mortality | |
| Notes | ||
| Risk of bias | ||
| Bias | Authors’ judgement | Support for judgement |
| Allocation concealment (selection bias) | Unclear risk | B - Unclear |
| Methods | RCT Concealment of allocation: DONE Blinded assessment of primary outcomes: NOT CLEAR Follow up of patients: DONE (6 weeks, 12 weeks, 1 year) Baseline measurement: DONE Reliable primary outcome measures: DONE Protection against contamination: NOT CLEAR |
|
| Participants | Location: UK Elderly medical patients Average age: 81.5 years Number of patients in 9 months: Treatment = 29 Control = 25 |
|
| Interventions | Hospital at home (early discharge) Type of service: hospital based; GP has clinical responsibility; no night care Skill mix of HAH team: 1 nurse manager; 10 unqualified staff Control group: in-patient hospital care |
|
| Outcomes | Mortality Functional status Psychological well-being Cognitive status Readmission Use of other health services Patients’ place of residence at follow-up |
|
| Notes | ||
| Risk of bias | ||
| Bias | Authors’ judgement | Support for judgement |
| Allocation concealment (selection bias) | Low risk | A - Adequate |
| Methods | RCT Concealment of allocation: DONE Blinded assessment of outcomes: NOT DONE Follow-up of patients: 1, 3 months Baseline measurement: DONE Reliable primary outcome measure: DONE Protection against contamination: DONE |
|
| Participants | Location: Canada Patients recovering from a stroke Mean age: treatment = 70.3 (12.7); control = 69.6 (12.7) Treatment = 58 Control = 56 |
|
| Interventions | Early discharge hospital outreach Type of service: multi-disciplinary team: physiotherapist, occupational therapist, dedicated nurses, speech therapist Control group: in-patient hospital care |
|
| Outcomes | Mortality Functional status Quality of life Length of stay |
|
| Notes | ||
| Risk of bias | ||
| Bias | Authors’ judgement | Support for judgement |
| Allocation concealment (selection bias) | Low risk | A - Adequate |
| Methods | RCT Concealment of allocation: DONE Blinded assessment of outcomes: NOT DONE Follow- up of patients: 3 months Baseline measurement: DONE Reliable primary outcome measure: DONE Protection against contamination: DONE |
|
| Participants | Location: UK Patients with chronic obstructive airways disease Mean age: treatment = 69.7; control = 70.1 Treatment = 30 Control = 30 |
|
| Interventions | Hospital at home (early discharge within 48 hours of admission) Type of service: daily monitoring by 2 respiratory outreach nurses who were accessible by phone daily from 9:00 to 17:00, out of hours advice from Medical Chest Unit: GPs aware but not involved in care Those living alone with no phone were excluded from the trial Control group: in-patient hospital care |
|
| Outcomes | Length of stay Days of care Symptom score Respiratory function Patient and carer satisfaction |
|
| Notes | Follow-up: 2 weeks for satisfaction, 3 months for readmission | |
| Risk of bias | ||
| Bias | Authors’ judgement | Support for judgement |
| Allocation concealment (selection bias) | Low risk | A - Adequate |
| Methods | RCT Concealment of allocation: NOTCLEAR (10/70, 14%, withdrew after randomisation and excluded from analysis) Follow up of patients: 5 days, 6 weeks, 12 weeks, 1 year Blinded assessment of outcomes: NOT CLEAR Baseline measurement: DONE Reliable primary outcome measure: DONE Protection against contamination: DONE |
|
| Participants | Location: UK Patients recovering from a knee replacement Age - no data Treatment = 32 Control = 28 |
|
| Interventions | Hospital at home (early discharge) Type of service: orthopaedic outreach team (2 orthopaedic nurses, a health care assistant, a physiotherapist) provide domiciliary care and a 24 hour on call service Control group: in-patient hospital care |
|
| Outcomes | Clinical condition of the knee joint Complications Readmission Patient satisfaction |
|
| Notes | ||
| Risk of bias | ||
| Bias | Authors’ judgement | Support for judgement |
| Allocation concealment (selection bias) | Unclear risk | B - Unclear |
| Methods | RCT Concealment of allocation: DONE Follow up of patients: 3 months Blinded assessment of outcomes: NO Follow- up of patients: 1 AND 3 months Baseline measurement: DONE Reliable primary outcome measure: DONE Protection against contamination: NOT CLEAR |
|
| Participants | Location: UK Elderly patients recovering from elective surgery or emergency medical admissions (31% fracture neck of femur, 21% other fractures, 11% hip replacement, 10% cerebrovascular accidents, 10% knee replacements, 22% miscellaneous reasons for admission) Mean age: 78.3 (SD 6.9) - from IPD dataset Treatment = 160 (of which 50/160 had a medical diagnosis) Control = 81 (of which 25/81 had a medical diagnosis) |
|
| Interventions | Hospital at home (early discharge) Type of service: early discharge from hospital; no night care Control group: hospital care which included development of care pathways and discharge planning Control group: in-patient hospital care |
|
| Outcomes | Resource and cost | |
| Notes | ||
| Risk of bias | ||
| Bias | Authors’ judgement | Support for judgement |
| Allocation concealment (selection bias) | Low risk | A - Adequate |
| Methods | RCT Concealment of allocation: DONE Follow-up of patients: 7 to 10 days and 3 months Blinded assessment of outcomes: NOT DONE Baseline measurement: DONE Reliable primary outcome measure: DONE Protection against contamination: DONE |
|
| Participants | Location: UK Patients recovering from a stroke Median age: 73 Treatment = 46 Control = 46 |
|
| Interventions | Hospital at home (early discharge) Type of service: community based stroke team that provided an inreach service to 3 local acute hospitals, visiting patients prior to discharge. Multi-disciplinary team of occupational therapist, physiotherpist, speech and language therapist, social worker. Nursing provided by the primary care team. GP had clinical responsibility, with support from a consultant working in stroke medicine. The stroke team used a key worker approach and patients held a copy of their record which they or their carer could add to. Review meetings involved patients and carers in their homes. Care available 24 hours a day if required Control group: in-patient hospital care |
|
| Outcomes | Quality of life Functional status Psychological well being Carer well-being Re-admission rate Place of discharge |
|
| Notes | ||
| Risk of bias | ||
| Bias | Authors’ judgement | Support for judgement |
| Allocation concealment (selection bias) | Low risk | A - Adequate |
| Methods | RCT Concealment of allocation: DONE (sealed envelopes) Blinded assessment of primary outcomes: NOT DONE Follow-up of patients: DONE (24 hours, 1 week, 2 to 3 weeks) Baseline measurement: DONE Reliable primary outcome measures: DONE Protection against contamination: NOT DONE |
|
| Participants | Location: UK Patients following elective surgery (hernia and varicose veins) Average age: 43 years Number of patients in 33 months: treatment = 117; control = 121; convalescent = 122 |
|
| Interventions | Hospital at home Type of service: organised by the hospital, provided by the community; clinical responsibility held by the GP Skill mix of HAH team: 15 GPs; district nurses Control group: in-patient hospital care |
|
| Outcomes | Clinical complications Patient satisfaction Re-admission to hospital Carer satisfaction |
|
| Notes | ||
| Risk of bias | ||
| Bias | Authors’ judgement | Support for judgement |
| Allocation concealment (selection bias) | Unclear risk | B - Unclear |
| Methods | RCT Concealment of allocation: DONE Follow up of patients: 1 year Blinded assessment of outcomes: NOT DONE Follow- up of patients: 2, 4 and 6 months and 1 year Baseline measurement: DONE Reliable primary outcome measure: DONE Protection against contamination: DONE |
|
| Participants | Location: London, UK Patients recovering from a stroke Mean age: treatment = 70 (SD 11); control = 72 (SD 12) Treatment = 167 Control = 164 |
|
| Interventions | Hospital at home (early discharge) Type of service: co-ordinated by hospital based consultant, community based nursing and therapy; 24 hour care not available Control group: hospital care and hospital organised rehabilitation |
|
| Outcomes | Mortality Re-admission Functional status Psychological well-being Patient satisfaction Carer satisfaction Carer burden |
|
| Notes | ||
| Risk of bias | ||
| Bias | Authors’ judgement | Support for judgement |
| Allocation concealment (selection bias) | Low risk | A - Adequate |
| Methods | RCT Concealment of allocation: DONE Follow up of patients: 3 months Blinded assessment of outcomes: NO Baseline measurement: DONE Reliable primary outcome measure: DONE Protection against contamination: DONE |
|
| Participants | Location: Northamptonshire, UK Patients recovering from a hip replacement Mean age: treatment = 71; control = 70 (knee replacement, mean age treatment = 68, control = 72; hip replacement mean age treatment =71, control=70; hysterectomy, mean age treatment = 45, control= 44; older patients with a medical condition, mean age treatment = 77, control = 76; patients with chronic obstructive airways disease, mean age treatment = 71, control = 73) Treatment = 263 Control = 275 |
|
| Interventions | Hospital at home (early discharge and admission avoidance) Type of service: community based nursing and therapy, nursing aids, GP had clinical responsibility Control group: in-patient hospital care |
|
| Outcomes | Mortality Re-admission Functional status Psychological well-being Quality of life Patient satisfaction Carer satisfaction Carer burden Resource use and cost |
|
| Notes | ||
| Risk of bias | ||
| Bias | Authors’ judgement | Support for judgement |
| Allocation concealment (selection bias) | Low risk | A - Adequate |
| Methods | RCT Concealment of allocation: NOT CLEAR Follow up of patients: 2 months Blinded assessment of outcomes: NOT DONE Baseline measurement: DONE Reliable primary outcome measure: DONE Protection against contamination: DONE |
|
| Participants | Location: Edinburgh, Scotland Patients with chronic obstructive pulmonary disease Mean age: treatment = 68.5; control = 69.9 Treatment = 122 Control = 62 |
|
| Interventions | Hospital at home (early discharge from admissions unit) Type of service: acute respiratory assessment service nurse, medical advice from on call respiratory team and GP; out of hours care provided by GP Control group: in-patient hospital care |
|
| Outcomes | Respiratory function Quality of life Additional car GP satisfaction Costs |
|
| Notes | ||
| Risk of bias | ||
| Bias | Authors’ judgement | Support for judgement |
| Allocation concealment (selection bias) | Unclear risk | B - Unclear |
| Methods | RCT Concealment of allocation: NOT CLEAR Blinded assessment of outcomes: NOT DONE Follow-up of patients: 6 months Baseline measurement: DONE Reliable primary outcome measure: DONE Protection against contamination: DONE |
|
| Participants | Location: Thailand Recovering from a stroke Mean age: 59 years Treatment = 52 Control = 50 |
|
| Interventions | Type of service: community based early discharge service, run by Red Cross volunteers; family members were trained to give injections under nurse guidance while the patient was in hospital, and encouraged to participate in physical and occupational therapy so they could help with home rehabilitation Control group: in-patient hospital care |
|
| Outcomes | Mortality Functional status Satisfaction |
|
| Notes | ||
| Risk of bias | ||
| Bias | Authors’ judgement | Support for judgement |
| Allocation concealment (selection bias) | Unclear risk | B - Unclear |
| Methods | RCT Concealment of allocation: DONE Follow up of patients: 3 and 6 months Blinded assessment of outcomes: NOT CLEAR Baseline measurement: DONE Reliable primary outcome measure: DONE Protection against contamination: DONE |
|
| Participants | Location: Stockholm, Sweden Patients recovering from a stroke Mean age: 72 years Treatment = 41 Control = 40 |
|
| Interventions | Hospital at home Type of service: community based nursing and therapy Control group: in-patient hospital care |
|
| Outcomes | Functional status Psychological well-being Patient satisfaction Use of hospital and home rehabilitation service |
|
| Notes | ||
| Risk of bias | ||
| Bias | Authors’ judgement | Support for judgement |
| Allocation concealment (selection bias) | Low risk | A - Adequate |
GP = general practitioner
HAH = hospital at home
RCT = randomised controlled trial
Characteristics of excluded studies [ordered by study ID]
| Study | Reason for exclusion |
| Bonnema 1998 | RCT This study evaluated early discharge from hospital of women following surgery for breast cancer; no hospital at home was provided |
| Brooten 1994 | RCT Obstetrics (this group of patients was not included in the review) |
| Bundred 1998 | RCT This study evaluated early discharge from hospital of women following surgery for breast cancer; no hospital at home was provided |
| Cummings 1991 | Review Review of home care as a substitute for nursing home care |
| Farnworth 1994 | Non randomised study design |
| Gerson 1976 | RCT No standard measures of outcome used. A physician, not blind to the patients’ group assignment, assessed clinical function. No criteria were used to define an untoward event. No intention to treat analysis, data were analysed by the care the patient received |
| Hansen 1992 | RCT This study did not evaluate hospital at home, but a model for follow-up visits at home after discharge from hospital |
| Hedrick 1986 | Review This review examined the different types of home care that are provided |
| Hernandez 2003 | RCT 39% of those allocated to hospital care were not admitted to hospital, therefore the degree to which the intervention substituted for hospital care is not clear |
| Hill 1978 | RCT This study evaluated hospital at home care for patients with a myocardial infarction. Managing this group of patients totally at home is now obsolete as thrombolytic therapy has made admission to hospital necessary |
| Klettke 1999 | Cross over design |
| Koopman 1996 | RCT This study compared patients treated with intravenous standard heparin administered in hospital with fixed dose subcutaneous low-molecular weight heparin administered at home, when feasible. Patients were taught to self-administer the low molecular weight heparin. Care was not provided in the patients’ homes by a team of health care professionals; the intervention was not therefore considered hospital at home |
| Levine 1996 | RCT This study compared the use of intravenous standard heparin administered in the hospital with the administration of subcutaneous low molecular weight heparin primarily at home. The study nurse taught the patient to administer the medication. Care was not provided in the patients’ homes by a team of health care professionals; the intervention was not therefore considered hospital at home |
| Magid 1989 | RCT This trial recruited 22 patients to compare the acceptance of in-patient with home continuous intravenous infusion of chemotherapy. While in hospital patients were instructed on the use of the infusors before discharge. The infusion was delivered in a continuous flow over 24 hours and new defusers were attached by the patient. Care was not provided in the patients’ homes by a team of health care professionals. The intervention was not therefore considered hospital at home as no additional services were provided |
| Mather 1976 | RCT This study evaluated hospital at home care for patients with a myocardial infarction. Managing this group of patients totally at home is now obsolete as thrombolytic therapy has made admission to hospital necessary |
| Melin 1992 | RCT Recruited patients with long term care needs. Hospital at home was a substitute for long term care |
| Melin 1993 | RCT Recruited patients with long term care needs. Hospital at home was a substitute for long term care |
| Romano 1991 | RCT Compares therapies at home, no comparison with hospital care |
| Ronning 1998 | RCT In-patient hospital rehabilitation compared with rehabilitation provided by the municipalities in a variety of settings which included nursing home rehabilitation on an in patient or out-patient basis, and further ambulatory rehabilitation by a visiting physical therapist, speech therapist and/or nurse. Primary care also provided |
| Stone 1968 | CCT A controlled trial -control patients were selected to match the home care patients |
| Wade 1985 | CCT Compared two districts - one with a domiciliary stroke service and one without |
| Williams 1981 | RCT Patients were randomly allocated to 24 hour bed rest in hospital or mobilisation at home following intra-articular irradiation of the knee with yttrium-90. No additional services were provided at home |
| Wolter 2004 | RCT Intravenous therapy, analysis based on number of readmissions, data not provided on number of people readmitted. Authors contacted, no reply |
| Zimmer 1984 | RCT Evaluated the effectiveness of a home care programme for home bound chronically ill patients. The home care programme was not a substitute for in-patient hospital care, but an addition to existing community services |
| Zimmer 1985 | RCT Evaluated the effectiveness of a home care programme for home bound chronically ill patients. The home care programme was not a substitute for in-patient hospital care, but an addition to existing community services |
CCT = controlled clinical trial
RCT = randomised controlled trial
DATA AND ANALYSES
Comparison 1.
Hospital at home versus in-patient care
Comparison 2.
IPD data analysis
| Outcome or subgroup title | No. of studies | No. of participants | Statistical method | Effect size |
|---|---|---|---|---|
| 1 IPD generic inverse variance early discharge elderly medical mortality at 3 months | 5 | 978 | Mortality (Fixed, 95% CI) | 1.04 [0.68, 1.58] |
| 1.1 Mortality at 3 months in older patients with a mix of conditions (Martin at 6 months) | 5 | 978 | Mortality (Fixed, 95% CI) | 1.04 [0.68, 1.58] |
| 2 IPD generic inverse variance early discharge readmission at 3 months | 3 | 705 | Readmission (Fixed, 95% CI) | 1.52 [1.07, 2.16] |
| 3 IPD stroke mortality at 3 to 6 months - Manchester, Anderson, Cunliffe, Shepperd 3 months | 7 | 494 | Mortality (Fixed, 95% CI) | 0.86 [0.35, 2.07] |
| 4 Stroke Barthel at 3 months | 2 | 174 | Std. Mean Difference (IV, Fixed, 95% CI) | 0.11 [−0.19, 0.40] |
| 5 Stroke Barthel at 6 months | 2 | 185 | Std. Mean Difference (IV, Fixed, 95% CI) | 0.01 [−0.28, 0.30] |
| 6 Sensitivity analysis in favour of HAH | 5 | 978 | Mortality (Fixed, 95% CI) | 1.03 [0.67, 1.56] |
| 6.1 Sensitivity analysis changing follow-up time of Richards trial in favour of HAH | 5 | 978 | Mortality (Fixed, 95% CI) | 1.03 [0.67, 1.56] |
| 7 Sensitivity analysis in favour of hospital | 5 | 978 | Mortality (Fixed, 95% CI) | 1.04 [0.69, 1.59] |
| 7.1 Sensitivity analysis changing follow-up time of Richards trial in favour of hospital | 5 | 978 | Mortality (Fixed, 95% CI) | 1.04 [0.69, 1.59] |
| 8 Sensitivity analysis removing readmissions in the first 14 days | 3 | 705 | Readmission (Fixed, 95% CI) | 1.34 [0.91, 1.98] |
| 9 Readmission stroke | 1 | Readmission (Fixed, 95% CI) | 1.62 [0.58, 4.55] |
Comparison 3.
IPD adjusted for age only
| Outcome or subgroup title | No. of studies | No. of participants | Statistical method | Effect size |
|---|---|---|---|---|
| 1 IPD generic inverse variance early discharge elderly medical mortality at 3 months | 4 | 608 | Mortality (Fixed, 95% CI) | 1.13 [0.66, 1.94] |
| 1.1 Mortality in elderly medical patients at 3 months | 4 | 608 | Mortality (Fixed, 95% CI) | 1.13 [0.66, 1.94] |
| 2 IPD mortality at 3 to 6 months (Manchester, Anderson & Shepperd at 3 months) | 6 | 407 | Mortality (Fixed, 95% CI) | 0.69 [0.26, 1.81] |
| 3 IPD generic inverse variance early discharge readmission at 3 months | 2 | 335 | Readmission (Fixed, 95% CI) | 2.47 [1.27, 4.78] |
| 4 Stroke Barthel at 3 months | 2 | 174 | Std. Mean Difference (IV, Fixed, 95% CI) | 0.12 [−0.18, 0.42] |
| 5 Stroke Barthel at 6 monhts | 2 | 185 | Std. Mean Difference (IV, Fixed, 95% CI) | 0.00 [−0.29, 0.29] |
| 6 Sensitivity analysis mortality in favour of HAH | 3 | 554 | Mortality (Fixed, 95% CI) | 1.14 [0.64, 2.02] |
| 6.1 Sensitivity analysis changing follow-up time of Richards trial in favour of HAH | 3 | 554 | Mortality (Fixed, 95% CI) | 1.14 [0.64, 2.02] |
| 7 Sensitivity analysis mortality in favour of hospital | 3 | 554 | Mortality (Fixed, 95% CI) | 1.18 [0.66, 2.09] |
| 7.1 Sensitivity analysis changing follow-up time of Richards trial in favour of hospital | 3 | 554 | Mortality (Fixed, 95% CI) | 1.18 [0.66, 2.09] |
Comparison 4.
IPD adjusted for age and sex
Analysis 1.1. Comparison 1 Hospital at home versus in-patient care, Outcome 1 Published data for older patients with a mix of conditions and those recovering from a stroke
Published data for older patients with a mix of conditions and those recovering from a stroke
| Study | Results | Notes |
| Patient outcomes: mortality at 6 weeks, not included in meta-analysis | ||
| Indredavik 2000 | Mortality at 6 weeks: Treatment 4/160 Control 7/160 |
|
| Martin 1994 | Mortality: At 6 weeks: treatment: 2/29 (6.9%) control: 0/25 (0%) observed difference: 6.9% 95% CI −0.2% to 16% At 12 weeks: treatment: 3/29 (10.3%) control: 3/25 (12%) observed difference: 1.7% 95% CI −18.5% to 15.2% At 1 year: treatment: 7/29 (24.1%) control: 5/25 (20%) observed difference: 4.1% 95% CI −18% to 26.2% |
|
| Patient outcomes: functional status - elderly with a medical condition, including COPD | ||
| Caplan 2006 | Functional independence measure (FIM) at enrolment T=75.46 (22.1) C=78.47 (19.13) P=0.50 Baseline - start of rehabilitation phase post randomisation T=100.31 (16.94) C=78.94 (16.01) P<0.0001 (authors interpret as indication that intervention group required additional days in the acute ward in order to be more independent before going home) At 1 month, mean (sd) T=100.93 (22.68) C=105.47 (17.06) P=0.36 At 6 months, mean (sd) T=102.96 (23.8) C=106.35 (14.43) P0.53 |
|
| Cunliffe 2004 | Barthel (0 to 20) 0=worse score At 3 months Mean difference 1.2 (95% CI 0.4 to 1.9) At 12 months Mean difference 0.2 (95% CI −0.7 to 1.1) Extended ADL total (0 to 66) 0=worse score At 3 months Mean difference 3.1 (95% CI −0.1 to 6.3) At 12 months Mean difference 3.0 (95% CI −0.4 to 6.5) Mobility (0 to 18) At 3 months Mean difference 0.3 (95% CI −0.8 to 1.4) At 12 months Mean difference 0.3 (95% CI −0.9 to 1.4) Kitchen (0 to 15) At 3 months Mean difference 1.2 (95% CI 0.2 to 2.3) At 12 months Mean difference 0.7 (95% CI −0.4 to 1.8) Domestic (0 to 15) At 3 months Mean difference 1.1 (95% CI 0.2 to 2.0) At 12 months Mean difference 1.4 (95% CI 0.4 to 2.4) Leisure (0 to 18) At 3 months Mean difference 0.5 (95% CI −0.3 to 1.3) At 12 months Mean difference 0.6 (95% CI −0.3 to 1.5 |
|
| Donald 1995 | Functional status: At 6 months: treatment mean: 16.4 (n=21) control mean: 15.0 (n=26) |
Used the Barthel Score (a high score indicates independence). No p value given, insufficient data to calculate CI |
| Harris 2005 | Functional independence measure10 day mean change from baseline (sd) T=6.36 (13.68) [n=134] C=8.73 (14.79) [n=134] Difference −2.37 95% CI −5.78, 1.04 30 days mean change from baseline (sd) T=11.29 (13.16) [n=126] C=11.94 (13.34) [n=125] Difference −0.65 95% CI −3.93, 2.63 90 day mean change from baseline (sd) T=13.09 (16.75) [n=124] C=14.25 (14.28) [n=122] Difference −1.17 95% CI-5.06, 2.73 Functional independence measure - physical 10 day mean change from baseline (sd) T=5.69 (13.12) [n=134] C=7.58 (14.4) [n=134] Difference −1.89 95% CI −5.19, 1.41 30 days mean change from baseline (sd) T=10.75 (12.56) [n=126] C=11.19 (12.73) [n=125] Difference −0.44 95% CI −3.57, 2.69 90 day mean change from baseline (sd) T=12.6 (14.98) [n=124] C=13.35 (13.32) [n=122] Difference −0.76 95% CI-4.30, 2.79 Instrumental activities of daily living10 day mean change from baseline (sd) T=0.62 (2.83) [n=134] C=0.96 (2.97) [n=134] Difference −0.34 95% CI −1.04, 0.35 30 days mean change from baseline (sd) T=2.01 (2.95) [n=126] C=1.50 (2.95) [n=125] Difference 0.51 95% CI −0.22, 1.24 90 day mean change from baseline (sd) T=2.69 (3.31) [n=214] C=2.5 (3.47) [n=123] Difference 0.20 95% CI-0.65, 1.04 |
|
| Martin 1994 | Functional status: At 6 weeks: treatment median: 16 control median: 15 At 12 weeks: treatment median: 15 control median: 15 At 6 weeks: treatment median: 13 control median: 9 At 12 weeks: treatment median: 13 control median: 9 |
The Barthel Index (0 - 20) No p values given, insufficient data to calculate CI The Rivermead Score (9 - 27) (a high score indicating a good outcome), a measure of domestic abilities. No p values given, insufficient data to calculate CI |
| Ojoo 2002 | Respiratory symptom score mean improvement: treatment (n=30): 12.1 (17.3) control (n=30): 11.6 (12.8) |
St George’s respiratory questionnaire |
| Richards 1998 | Barthel, change from baseline to 4 weeks: T=1.5 (2.93) n=152 C=1.0 (2.82) n=69 Baseline to 3 months T=1.9 (3.22) n=141 C=1.7 (2.68) n=60 |
Barthel Index |
| Shepperd 1998 | Elderly medical patients: Mean value (SD) at baseline T=14.74 (4.82) n=47 Mean change from baseline to 3 months follow-up T=−1.71 n=38 C=1.27 n=37 difference 0.44 95% CI −2.09 to 1.21 C=15.69 (2.58) n=42 |
Barthel Index, scale 0 to 20 (low score=high dependence) |
| Skwarska 2000 | No data reported | Chronic Respiratory Questionnaire |
| Patient outcomes: functional status/general health - recovering from a stroke | ||
| Anderson 2000 | Modified Barthel Index at 6 months follow-up Median (IQR) T=96.0 (88.3 to 100) C=98.0 (85.5 to 100) P=0.99 Median difference −2.0, 95% CI −2.0 to 2.0 |
|
| Askim 2004 | Modified Rankin Scale (score of < 2 classified as independent At 6 weeks T=16/31 (52%) C=16/31 (52%) P=1.0 95% CI −0.26 to 0.26 At 26 weeks post stroke T=13/31 (42%) C=16/31 (52%) P=0.62 95% CI −0.35 to 0.16 At 52 weeks post stroke T=12/31 (39%) C=16/31 (52%) P=0.44 95% CI −0.37 to 0.13 Barthel Index (Max score 100) Independent > 95 At 6 weeks T=13/31 (42%) C=14/31 (45.2%) P=1.0 95% CI −0.28 to 0.22 Mean (sd) T=75 (30.6) [n=29] C=74 (31.2) [n=29] P=0.77 95% CI −15.1 to 17.5 At 26 weeks T=11/31 (35.5%) C=14/31 (45.2%) P=0.6 95% CI −0.34 to 0.15 Mean (sd) T=75 (33) [n=23] C=77 (27.6) [n=28] P=0.9 95% CI −20 to 14.7 At 52 weeks T=11/31 (35.5%) C=15/31 (48%) P=0.44 95% CI −0.37 to 0.12 Mean (sd) T=71.7 (34.7) [n=23] C=79 (28.7) [n=25] P=0.45 95% CI −25.9 to 11.4 Nottingham Health Profile for subjective health status (energy, pain, emotion, sleep, social isolation, and physical mobility) Maximum score =100 within each domain. High score =poor health status Median (IQR) at 6 weeks follow-up Energy T=24 (0.0 −60.8) C=24 (0.0-63.2) P=0.64 Pain T=0.0 (0.0-9.0) C=0.0 (0.0-12.9) P=0.44 Emotion T=7.0 (0.0-17.6) C=7.1 (0.0-19.3) P=0.58 Sleep T=0.0 (0.0-35.9) C=12.6 (0.0-35.9) P=0.69 Social T=0.0 (0.0-22.0) C=0.0 (0.0-22.5) P=0.14 Physical T=34.7 (10.6-57.8) C=47.1 (0.0 −78.7) P=0.67 Median (IQR) at 26 weeks follow-up Treatment n=22; Control n=28 Energy T=24 (0.0 −24) C=24 (0.0-63.2) P=0.40 Pain T=0.0 (0.0-6.6) C=0.0 (0.0-9.73) P=0.49 Emotion T=0.0 (0.0-9.3) C=7.2 (0.0-22.7) P=0.13 Sleep T=0.0 (0.0-23.4) C=4.3 (0.0-23.4) P=0.64 Social T=0.0 (0.0-19.4) C=11.0 (0.0-41.4) P=0.05 Physical T=39.2 (0.0-70.8) C=26.5 (0.0 −76.0) P=0.78 Median (IQR) at 52 weeks follow-up Treatment n=23; Control n=25 Energy T=24 (0.0 −60.8) C=24 (12.0-62.0) P=0.23 Pain T=0.0 (0.0-10.0) C=0.0 (0.0-2.9) P=0.70 Emotion T=0.0 (0.0-10.5) C=0.0 (0.0-15.3) P=0.90 Sleep T=0.0 (0.0-16.1) C=0.0 (0.0-23.4) P=0.95 Social T=0.0 (0.0-20.1) C=11.0 (0.0-22.0) P=0.97 Physical T=43.4 (0.0-100.0) C=54.6 (0.0 −83.0) P=0.42 Global score At 6 weeks follow up Global score median IQR T=81.6 (71.1-92.1) C=76.3 (59.2-92.1) P=0.44 Global score mean (sd) T=80 (15.3) C= 75.9 (18.3) At 26 weeks follow-up Global score median IQR T=81.6 (67.8-95.4) C=76.3 (55.9-96.7) P=0.21 Global score mean (sd) T=82.5 (13.7) C= 75.8 (19.5) At 52 weeks follow-up Global score median IQR T=79 (68.4-97.4) C=81.6 (68.4-96.1) P=0.92 Global score mean (sd) T=79.8 (16.8) C= 79.8 (17.7) |
|
| Bautz-Holter 2002 | Nottingham extended ADL Median (IQR)Mobility At 3 months T=10.5 (4 to14) C=8 (3 to 15) 95% CI of the difference −2 to 4 p=0.41 At 6 months T=11 (6 to14) C=10 (4 to 15) 95% CI of the difference −2 to 4 p=0.55 Kitchen At 3 months T=12 (8 to14) C=12 (6 to 15) 95% CI of the difference −2 to 1 p=0.87 Kitchen At 6 months T=12 (8 to15) C=13 (10 to 15) 95% CI of the difference −2 to 1 p=0.52 Domestic At 3 months T=6 (3 to 8) C=5 (3 to 10) 95% CI of the difference −3 to 1 p=0.58 Domestic At 6 months T=5.5 (4 to 8) C=6 (3 to 11) 95% CI of the difference −3 to 1 p=0.47 Leisure At 3 months T=8 (6 to9) C=6 (5 to 9) 95% CI of the difference −1 to 2 p=0.38 Leisure At 6 months T=7.5 (6 to 10) C=7 (6 to 9) 95% CI of the difference −1 to 2 p=0.55 Total At 3 months T=34.5 (28 to 44) C=30 (14 to 46) 95% CI of the difference −8 to 7 p=0.78 Total At 6 months T=40 (29 to 45) C=37 (20 to 46) 95% CI of the difference −8 to 7 p=0.93 At 6 months T=24 (16 to27) C=22 (17 to 26) 95% CI of the difference −4 to 4 p=0.74 |
|
| Donnelly 2004 | Barthel ADL At 12 months Mean (sd) T=17.98 (3.1) C=17.15 (3.8) 95% CI −2.24 to 0.58 P=0.18 Nottingham ADL At 12 months Mean (sd) T=12 (6.34) C=10.43 (5.9) 95% CI −4.04 to 0.91 P=0.24 10 m timed walk At 12 months Mean (sd) T=28.13 (21.5) C=28.9 (28.8) 95% CI −16.5 to 18.14 P=0.34 |
|
| Indredavik 2000 | Barthel Index, Independent in activities of daily living: At 26 weeks: Treatment: 96/100 (60%) Control: 79/160 (49.4%) Difference 11.6% p<0.06 Barthel Index, odds ratio for independence: At 26 weeks: 1.54 (95% CI 0.99 to 2.39) Rankin Scale Independent (RS < 2): At 26 weeks: Treatment: 104/160 (65%) Control: 83/160 (51.9%) Difference 13.1%, 95% CI 2.4% to 23.8% p=0.02 Rankin Scale, odds ratio for independence: At 26 weeks: 1.72 (95% CI 1.10 to 2.7) Excluding those with a very mild stroke Barthel Index >95 Barthel Index >95: At 6 weeks: Treatment: 56/121 (46.3%) Control: 42/122 (34.4%) Difference 11.9% 95% CI −0.4% to 24.1% P<0.06 At 26 weeks: Treatment: 63/121 (52.1%)0 Control: 47/122 (38.5%) Difference 13.6% 95% CI −1.1% to 25.9% p<0.03 Excluding those with a mild stroke Rankin Score <2 At 6 weeks: Treatment: 52/121 (43%) Control: 38/122 (31.2%) Difference 11.8% 95% CI −0.23% to 23.9% p<0. 056 At 26 weeks: Treatment: 70/121 (58%) Control: 49/122 (40.2%) Difference 17.8% 95% CI 5.3% to 30.1% p<0.01 |
Barthel Index Independent in activities of daily living - authors reported %, numbers derived from percentages Barthel Index, odds ratio for independence - Barthel Index > 95 vs. death or Barthel <95 Rankin Scale, odds ratio for independence - Rankin scale < 2 vs. Rankin scale 3 to 6 |
| Mayo 2000 | See SF-36 scores in 01.01.06 | |
| Rodgers 1997 | Functional status: At 3 months: Oxford Handicap Scale: 0-2: T 28/45 (62%) C 22/42 (52%) difference 9. 8%, 95% CI −10.9% to 30.5% 3: T 8/45 (18%) C 10/42 (24%) difference 6%, 95% CI −23% to 11% 4-5: T 9/45 (20%) C 10 /42 (24%) difference 4%, 95% CI −21% to 14% Nottingham Extended ADL: median [range] Mobility: T=3 [0-6]; C=1 [0-6] Kitchen: T=4 [0-5]; C=3 [0-5] Domestic: T=1 [0-4]; C=0 [0-5] Leisure: T=2 [0-4]; C=2 [0-6] Total: T=10 [0-18]; C=7 {0-21] |
Oxford Handicap Scale Nottingham Extended ADL |
| Rudd 1997 | Functional status: 1. At discharge from hospital: Treatment mean: 15 (4) Control mean: 15 (4) At one year: Treatment mean: 16 (4) Control mean: 16 (4) 2. At discharge from hospital: Treatment mean: 18 (8.4) Control mean: 19 (8.3) At one year: Treatment mean: 22 (8) Control mean: 23 (7) 3. At discharge from hospital: Treatment mean: 18 (8.4) Control mean: 19 (8.3) At one year: Treatment mean: 22 (8) Control mean: 23 (7) 4. At discharge from hospital Treatment mean (secs): 15 (23) Control mean (secs): 17 (35) At one year: Treatment mean (secs): 12 (6) Control mean (secs): 12 (8) |
1. At discharge from hospital - Barthel Index (0 - 20) Treatment group discharged on average 12 days post randomisation and control group at 18 days. At one year - Frenchay Aphasia Screening Test 3. At discharge from hospital - Rivermead activities of daily living scale At one year - 5 metre timed walk |
| Suwenwela 2001 | NIH stroke scale 0-2 At 6 months T=40/52 (77%) C=36/50 (73%) RR 0.89 95% CI 0.44 to 1.75 P=0.73 Barthel Index At 6 months number with a good outcome: 75-100 T=47/52 (77%) C=43/50 (88%) RR 0.69 95% CI 0.23 to 2.02 p=0.49 |
|
| Widen-Holmqvist 1998 | Functional status 1: At 3 months: Treatment: 36/41 Control: 32/40 P<0.51 Functional status 2: At 3 months: Treatment: 16/41(39%) Control: 12/40 (30%) difference 9% 95% CI −11. 6% to 29.6% P<0.53 Functional status 3: At 3 months: Treatment 28/41 (68.3%) Control 25/40 (62.5%) difference 5.8% 95% CI − 15% to 26% P<0.75 Functional status 4: At 3 months: Treatment: 12 (8-15) Control: 12 (10-16) P<0.43 Motor capacity: At 3 months Treatment: 146 (141-150) Control: 145 (134-148) P<0.18 Overall SIP: At 3 months follow-up: Treatment median: 16.6 [IQR 11.1-25.3] Control median: 14.6 [IQR 19.3 to 19.6] p<0.3 Physical dimension: At 3 months follow-up: Treatment median: 14.9 [IQR 5.5 to 25.1] Control median: 15.6 [IQR 9.5 to 21.4] p<0.6 Ambulation: At 3 months follow-up: Treatment median: 25.1 [IQR 10.6 to 37.4] Control median: 24.2 [IQR 12.3 to 34.2] p<0.8 Mobility: At 3 months follow-up: Treatment median: 22.4 [IQR 0.0-39.1] Control median: 16.3 [IQR 3.8-33.1] p<0.84 Body care and movement: At 3 months follow-up: Treatment median: 9.6 [IQR 2.1-16.9] Control median: 10.3 [IQR 4.9-21.6] p<0.52 Psychosocial dimension: At 3 months follow-up: Treatment median: 16.6 [IQR 8.7-29.1] Control median: 10.0 [IQR 6.1-15.6] p<0.02 Social interaction: At 3 months follow-up: Treatment median: 15 [IQR 8.4-26.1] Control median: 10.7 [IQR 3.6-18.8] p<0.06 Alertness behaviour: At 3 months follow-up: Treatment median: 9.7 [IQR 0.0-35.5] Control median: 8.8 [IQR 0.0-19.8] p<0.4 Emotional behaviour: At 3 months follow-up: Treatment median: 17.6 [IQR 0.0-31.3] Control median:0.0 [IQR 0.0-19.7] p<0.02 Communication: At 3 months follow-up: Treatment median: 18 [IQR 9.2-30.3] Control median: 9.7 [IQR 0.0-21.5] p<0.01 Sleep and rest: At 3 months follow-up: Treatment median: 22 [IQR 11.6-33.7] Control median: 11.7 [IQR 0.0-26.1] p<0.12 Eating: At 3 months follow-up: Treatment median: 5.2 [IQR 0.0-11.3] Control median: 5.2 [IQR 0.0-11.3] p<0.52 Work: At 3 months follow-up: Treatment median: 0.0 [IQR 0.0-0.0] Control median: 0.0 [IQR 0.0-0.0] p<1.0 Home management: At 3 months follow-up: Treatment median: 28.4 [IQR 9.3-53.7] Control median: 32.8 [IQR 14.7-46.6] p<0.68 Recreation and pastime: At 3 months follow-up: Treatment median: 28.4 [IQR 10.2 to 40.0] Control median: 30.0 [IQR 10.2 to 43.7] p<0.47 |
Functional status 1 - independent in personal ADL At baseline the treatment group had a 10% lower coping capacity, and increased frequency of disease (TIA and diabetes), increased frequency of abnormal CT scans on admission and left hemisphere lesions. Functional status 2 - independent in instrumental ADL Functional status 3 - independent in Barthel Functional status 4 - Median time and IQR (sec) taken to walk 10m Motor capacity - Lindmark Motor Capacity Scale, scale 0-153. Median score and (IQR) Overall SIP - Sickness Impact Profile Scale 0 to 100 Median and (IQR) Hi score indicates increased dysfunction. |
| Patient outcomes: quality of life - older people with a mix of conditions | ||
| Cunliffe 2004 | Euroqol (−0.59 to 1) At 3 months Mean difference 0.07 (95% CI −0.01 to 0.14) At 12 months Mean difference 0.02 (95% CI −0.06 to 0.09) |
|
| Harris 2005 | Self reported recovery At 10 days T=25/128 (19.5%) C=27/129 (20.9%) At 30 days T=39/121 (32.2%) C=30/124 (24.2%) At 90 days T=63/112 (56.3%) C=53/116 (45.7%) SF 36 Physical component scale mean (sd) T=34.8 (10.7) [n=121] C=34.4 (9.9) [n=120] Mental component scale mean (sd) T=53.4 (10.5) [n=121] C=52.1 (12.0) [n=120] |
|
| Richards 1998 | Mean differences EQ-5D after adjustment for baseline differences At 4 weeks Mean difference: 0.00 95% CI −0.09 to 0.10 At 3 months: Mean difference −0.04 95% CI −0.13 to 0.06 |
EQ-5D - possible range 5 to 15 |
| Shepperd 1998 | Elderly medical Physical fitness: Mean difference at 3 months Treatment: 0.06 Control: 0.00 [ 0.06, 95% CI −0.32 to 0.43] Feelings: Mean difference at 3 months Treatment: 0.26 Control: 0.00 [ 0.26, 95% CI −0.43 to 0.95] Daily activities: Mean difference at 3 months Treatment: 0.39 Control: 0.38 [ 0.01, 95% CI −0.64 to 0.67] Social activities: Mean difference at 3 months Treatment: −0.10 Control: 0.32 [ −0.42 95% CI −1.15 to 0.29] Pain: Mean difference at 3 months Treatment: 0.39 Control: 0.35 [ 0.04, 95% CI −0.78 to 0.86] Change in health: Mean difference at 3 months Treatment: 0.92 Control: 0.19 [−0.27, 95% CI −1.06 to 0.53] Overall health: Mean difference at 3 months Treatment: −0.03 Control: 0.16 [−0.19, 95% CI −0.63 to 0.26] Social support: Mean difference at 3 months Treatment: 0.13 Control: −0.05 [0.18, 95% CI −0.30 to 0.67] Quality of life: Mean difference at 3 months Treatment: 0.16 Control: 0.35 [−0.19, 95% CI-0.70 to 0.32] Functional status: Mean change from baseline at 3 months: Treatment mean (n=38): −1.71 Control mean (n=37): 1.27 [0.44, −2.09 to 1.21] |
Mean change at 3 months (sd) [mean difference, 95% CI] Physical fitness - Dartmouth COOP charts: Scale 1-5 (low score = good quality of life) |
| Patient outcomes: quality of life COPD | ||
| Shepperd 1998 | CHRONIC OBSTRUCTIVE AIRWAYS DISEASE: physical fitness: Treatment: 0.40 Control: −0.45 [0.22, −0.81 to 1.25] Feelings: Treatment: −0.45 Control: 0.18 [−0.63, −2.13 to 0.86] Daily activities: Treatment: 0.00 Control: 1.09 [−1.09, −2.27 to 0.08] Social activities: Treatment: −0.82 Control: 0.18 [−1.00, −2.48 to 0.48] Pain: Treatment: 0.73 Control: 0.67 [0.06, −1.24 to 1.36] Change in health: Treatment: 0.36 Control: 0.73 [−0.37, −2.02 to 1.29] Overall health: Treatment: −0.18 Control: 0.09 [−0.27, −1.03 to 0.48] Social support: Treatment: 0.00 Control: 0.18 [−0.18, −1.33 to 0.97] Quality of life: Treatment: 0.18 Control: 0.54 [−0.36, −1.22 to 0.49] Dyspnea, scale 5-35: Treatment 0.94 Control −3.85 [4.79, −2.07 to 11.65] Fatigue, scale 4-28: Treatment −0.40 Control-4.78 [4.38, −0.31 to 9.07] Emotion, scale 7 - 49: Treatment −0.80 Control −8.66 [7.86, −2.16 to 17.89] Mastery, scale 4 - 28: Treatment 0.00 Control −1.44 [1.44, −5.93 to 8.82] |
Results Mean change at 3 months (sd) [mean difference, 95% CI] Physical fitness - Dartmouth COOP charts: Scale 1-5 (low score = good quality of life) Feelings - follow- up data for: treatment n=10 control n=11 Dyspnea - CRD questionnaire: (low score = low level of functioning) Treatment n=10 Control n=9 |
| Patient outcomes: quality of life/health status - those recovering from a stroke | ||
| Anderson 2000 | SF-36 at 6 months follow-up Physical functioning Mean (sd) T=41.3 (29.1) C=42.5 (28.1) P=0.86 Mean difference −1.2, 95% CI −13.8, 11.5 Physical role limitation Mean (sd) T=70.7 (38.7) C=76.9 (31.2) P=0.43 Mean difference −6.1, 95% CI −21.7, 9.4 Bodily pain Mean (sd) T=61.2 (33.1) C=70.1 (34) P=0.24 Mean difference −8.8, 95% CI −23.7, 6.0 General health perceptions Mean (sd) T=61.8 (26.5) C=67.3 (21.9) P=0.31 Mean difference −5.5, 95% CI −16.3, 5.2 Vitality Mean (sd) T=53.8 (26.2) C=55.5 (22.2) P=0.75 Mean difference −1.7, 95% CI −12.5, 9.0 Social functioning Mean (sd) T=74.7 (31.3) C=82.8 (23.8) P=0.19 Mean difference −8.1, 95% CI −20.4, 4.2 Emotional role limitation Mean (sd) T=92.7 (21.7) C=93.3 (24.1) P=0.90 Mean difference −0.7, 95% CI −10.8, 9.5 Mental health Mean (sd) T=80.5 (17.3) C=82.6 (13.6) P=0.54 Mean difference −2.1, 95% CI −9.0, 4.8 Physical component score Mean (sd) T=37.4 (10.3) C=39.6 (9.0) P=0.47 Mean difference −2.2, 95% CI −6.5, 2.1 Mental component score Mean (sd) T=54.4 (9.2) C=55.7 (8.4) P=0.58 Mean difference −1.3, 95% CI −5.2, 2.6 Nottingham health profile at 6 months follow-up-Energy Median (IQR) T=24.0 (0 to 62.6) C=24.0 (0-50.0) P=0.6 Difference 0, 95% CI 0, 21.6 Pain Median (IQR) T=0 (0 to 12.9) C=0 (0-17.1) P=0.87 Difference 0, 95% CI 0, 0 Emotion Median (IQR) T=3.5 (0 to 10.5) C=0 (0-11.2) P=0.77 Difference 0, 95% CI 0, 0 Sleep Median (IQR) T=12.6 (0 to 33.4) C=0 (0-22.4) P=0.18 Difference 0, 95% CI 0, 12.6 Social Median (IQR) T=0 (0 to 22.4) C=0 (0-22) P=0.41 Difference 0, 95% CI 0, 0 Physical Median (IQR) T=23.9 (10.9 to 46.1) C=21.1.0 (2.6-44.9) P=0.52 Difference 0.5, 95% CI −9.3, 11.8 |
SF-36 |
| Askim 2004 | Nottingham Health Profile for subjective health status (energy, pain, emotion, sleep, social isolation, and physical mobility) Maximum score =100 within each domain. High score =poor health status Median (IQR) at 6 weeks follow-up Energy T=24 (0.0 −60.8) C=24 (0.0-63.2) P=0.64 Pain T=0.0 (0.0-9.0) C=0.0 (0.0-12.9) P=0.44 Emotion T=7.0 (0.0-17.6) C=7.1 (0.0-19.3) P=0.58 Sleep T=0.0 (0.0-35.9) C=12.6 (0.0-35.9) P=0.69 Social T=0.0 (0.0-22.0) C=0.0 (0.0-22.5) P=0.14 Physical T=34.7 (10.6-57.8) C=47.1 (0.0 −78.7) P=0.67 Median (IQR) at 26 weeks follow-up Treatment n=22; Control n=28 Energy T=24 (0.0 −24) C=24 (0.0-63.2) P=0.40 Pain T=0.0 (0.0-6.6) C=0.0 (0.0-9.73) P=0.49 Emotion T=0.0 (0.0-9.3) C=7.2 (0.0-22.7) P=0.13 Sleep T=0.0 (0.0-23.4) C=4.3 (0.0-23.4) P=0.64 Social T=0.0 (0.0-19.4) C=11.0 (0.0-41.4) P=0.05 Physical T=39.2 (0.0-70.8) C=26.5 (0.0 -76.0) P=0.78 Median (IQR) at 52 weeks follow-up Treatment n=23; Control n=25 Energy T=24 (0.0 −60.8) C=24 (12.0-62.0) P=0.23 Pain T=0.0 (0.0-10.0) C=0.0 (0.0-2.9) P=0.70 Emotion T=0.0 (0.0-10.5) C=0.0 (0.0-15.3) P=0.90 Sleep T=0.0 (0.0-16.1) C=0.0 (0.0-23.4) P=0.95 Social T=0.0 (0.0-20.1) C=11.0 (0.0-22.0) P=0.97 Physical T=43.4 (0.0-100.0) C=54.6 (0.0 −83.0) P=0.42 Global score At 6 weeks follow up Global score median IQR T=81.6 (71.1-92.1) C=76.3 (59.2-92.1) P=0.44 Global score mean (sd) T=80 (15.3) C= 75.9 (18.3) At 26 weeks follow-up Global score median IQR T=81.6 (67.8-95.4) C=76.3 (55.9-96.7) P=0.21 Global score mean (sd) T=82.5 (13.7) C= 75.8 (19.5) At 52 weeks follow-up Global score median IQR T=79 (68.4-97.4) C=81.6 (68.4-96.1) P=0.92 Global score mean (sd) T=79.8 (16.8) C= 79.8 (17.7) |
|
| Donnelly 2004 | EuroQol At 12 months Mean (sd) T=66.36 (18.45) C=68.21 (20.31) 95% CI −6.2 to 9.9 P=0.6 SF 36Physical functioning At 12 months Mean (sd) T=35.6 (31.32) C=34.7 (32.01) 95% CI −13.7 to 11.88 P=0.8 Mental health At 12 months Mean (sd) T=69.49 (18.3) C=67.3 (20.07) 95% CI −9.95 to 5.58 P=0.68 Quality of life Mental health At 12 months Mean (sd) T=18.57 (4.3) C=18.92 (4.74) 95% CI −1.5 to 2.2 P=0.58 |
|
| Mayo 2000 | SF36 subscale: physical function (scored out of 100) At 1 month, mean (sd) T=54.3 (26.7) [n=56] C=53.4 (26.8) [n=47] At 3 months, mean (sd) T=60.5 (29.5) [n=47] C=49.2 (31.5) [n=44] SF36 subscale: role physical function (scored out of 100) At 1 month, mean (sd) T=23.7 (35.1) [n=56] C=10.6 (21.3) [n=47] P<0.02 Physical function (physical component summary of the SF36) At 3 months, mean (sd) T=42.9 (10.1) [n=51] C=37.9 (10.6) [n=44] P=0.05 SF36 subscale: emotional (scored out of 100) At 1 month, mean (sd) T=53.6 (45.7) [n=56] C=53.2 (46.4) [n=47] At 3 months, mean (sd) T=66 (41.9) [n=47] C=61.4 (40.6) [n=44] Mental health (mental component summary of SF36) At 3 months, mean (sd) T=46.5 (11.7) [n=51] C=46.7 (10.8) [n=44] NS SF36 subscale: pain index (scored out of 100) At 1 month, mean (sd) T=73.5 (30.7) [n=56] C=75.1 (26.2)[n=47] At 3 months, mean (sd) T=75.5 (26.7) [n=47] C=72.1 (27.4) [n=44] SF36 subscale: general health perceptions (scored out of 100) At 1 month, mean (sd) T=62.6 (22.9) [n=56] C=55.1(24.2) [n=47] At 3 months, mean (sd) T=63.5 (20.8) [n=47] C=56.7 (25.0) [n=44] SF36 subscale: vitality (scored out of 100) At 1 month, mean (sd) T=53.1 (20.8) [n=56] C=48.7 (25.0) [n=47] At 3 months, mean (sd) T=50.7 (23.9) [n=47] C=46.4 (22.9) [n=44] SF36 subscale: social function (scored out of 100) At 1 month, mean (sd) T=59.6 (33.2) [n=56] C=57.2 (35.0) [n=47] At 3 months, mean (sd) T=71.3 (28.5) [n=47] C=64.2 (28.7) [n=44] SF36 subscale: mental health index (scored out of 100) At 1 month, mean (sd) T=67.1 (21.9) [n=56] C=67.7 (22.3) [n=47] At 3 months, mean (sd) T=65.2 (20.8) [n=47] C=66.4 (19.2) [n=44] |
|
| Rodgers 1997 | Physical fitness: Median [range] Treatment: 5 [1-5] Control: 5 [3-5] Feelings: Treatment: 2 [1-5] Control: 2 [1-5] Daily activities: Treatment: 3 [1-5] Control: 3 [1-5] Social activities: Treatment: 3 [1-5] Control: 4 [1-5] Pain: Treatment: 3 [1-5] Control: 3 [1-5] Change in health: Treatment: 2 [1-5] Control: 2 [1-5] Overall health: Treatment: 3 [1-5] Control: 3 [2-5] Social support: Treatment: 1 [1-4] Control: 1 [1-5] Quality of life: Treatment: 2 [1-5] Control: 3 [1-5] |
Mean change at 3 months (sd) [mean difference, 95% CI] |
| Cognitive ability | ||
| Caplan 2006 | Mini mental state exam (cognitive function) At 1 month, mean (sd) T=23.89 (6.42) C=24.52 (5.97) P=0.66 At 6 months T=23.22 (6.9) C=25.18 (5.01) P=0.24 Confusion assessment method (CAM) Assessed every 2nd day Baseline dementia T=19/70 (27%) C=7/34 (21%) P=0.63 OR for delirium for deliriumin home rehabilitation group during rehabilitation phase 0.17 95% CI 0. 03 to 0.65) Days of delirium during acute phase mean (sd) T=3 (1.4) c=2 (2.5) p=0.62 Days of delirium during rehabilitation T=3 (0.6) C=12 (3.2) P=0.003 |
|
| Harris 2005 | Mini mental state exam (cognitive function) 10 day mean change from baseline (sd) T=0.04 (3.01) [n=125] C=−0.01 (2.87) [n=129] Difference −0.05 95% CI −0.67, 0.77 30 days mean change from baseline (sd) T=0.36 (2.89) [n=117] C=0.34 (2.77) [n=121] Difference −0.02 95% CI −0.70, 0.74 90 day mean change from baseline (sd) T=0.20 (3.55) [n=117] C=0.72 (3.03) [n=109] Difference −0.44 95% CI-1.38, 0.35 |
|
| Patient outcomes: psychological well-being - older people with a mix of conditions | ||
| Caplan 2006 | Geriatric depression scale At 1 month T=8.84 (6.07) C=8.17 (5.73) P=0.63 At 6 months T=7.8 (5.6) C=7.14 (3.96) P=0.62 |
|
| Cunliffe 2004 | GHQ - patient (36 to 0)At 3 months Mean difference −2.4 (95% CI −4.1 to −0.7) At 12 months Mean difference −1.9 (95% CI −3.5 to −0.4) |
|
| Donald 1995 | Psychological well-being: At 6 months: treatment mean: 12.4 (n=21) control mean: 12.1 (n=25) |
Used the Philadelphia Geriatric Centre Morale Score (a high score indicating a good outcome). No p value given, insufficient data to calculate CI |
| Harris 2005 | Functional independence measure - mental10 day mean change from baseline (sd) T=0.67 (2.47) [n=134] C=1.16 (3.34) [n=134] Difference −0.49 95% CI −1.19, 0.22 30 days mean change from baseline (sd) T=0.53 (2.20) [n=126] C=0.74 (2.44) [n=125 Difference −0.21 95% CI −0.79, 0.36 90 day mean change from baseline (sd) T=0.46 (3.19) [n=124] C=0.90 (4.19) [n=123] Difference −0.41 95% CI-1.34, 0.52 |
|
| Martin 1994 | Psychological well-being: At 6 weeks: treatment median: 10 control median: 12 At 12 weeks: treatment median: 13 control median: 9.5 Cognitive status: At 6 weeks: treatment median: 8 control median: 8 At 12 weeks: treatment median: 9 control median: 8 Minimental state examination: At discharge from hospital: Treatment mean: 21.7 (7.1) Control mean: 21 (7.3) [0, −1.2 to 2.1] |
Psychological well-being - used the Philadelphia Geriatric Centre Morale Score (scale of 0 - 21). No p value given, insufficient data to calculate CI Cognitive status - abbreviated Mental Test score (0 - 10) (a high score indicating a good outcome). No p value given, insufficient data to calculate CI |
| Shepperd 1998 | ELDERLY MEDICAL PATIENTS: Psychological well-being: Baseline: treatment mean: 6.54 (2.28) control mean: 7.93 (2.67) Difference at 3 months: T: 0.16 (2.66) C: 0.73 (2.24) Difference −0.88 95% CI −2.1 to 0.33 CHRONIC OBSTRUCTIVE AIRWAYS DISEASE: Psychological well-being: Baseline: treatment mean: 7.61 (2.4) control mean: 7.7 (2.68) Difference at 3 months: T: 0.4 (2.32) C: 1.00 (2.93) difference −0.6, 95% CI −3.03 to 1.83 |
Used the Philadelphia Geriatric Centre Morale Score (a high score indicating a good outcome) |
| Patient outcomes: psychological well-being - those recovering from a stroke | ||
| Bautz-Holter 2002 | Montgomery Asberg Depression rating scale Median (IQR) At 3 months T=1.5 (0 to 4) C=2.5 (0 to 6) 95% CI of the difference −2 to 0 p=0.10 Median (IQR) At 6 months T=2 (0 to 6) C=2 (1 to 5) 95% CI of the difference −2 to 1 p=0.30 General health questionnaire Median (IQR) At 3 months T=19.5 (14 to 26) C=26 (19 to 31) 95% CI of the difference −9 to −1 p=0.02 |
|
| Rudd 1997 | Hospital anxiety depression scale: At discharge from hospital: No (%) with anxiety: Normal Treatment: 89/167 (70%) Control: 106/164 (82%) P<0.02 X2 test for trend 95% CI −22% to −0.81% Borderline Treatment: 18/167 (14) Control: 14/164 (11) Abnormal: Treatment: 20/167 (16) Control: 10/164 (8) Aggregate data for borderline and abnormal groups (assessed only): Treatment: 38/126 (30.2%) Control: 24/130 (18.5%) Difference 11.7%, 95% CI 1.3% to 22% Aggregated data for borderline and abnormal (assessed and not assessed): Treatment: 38/167 (23%) Control: 24/164 (14.6%) Difference 8%, 95% CI −0.23% to 16.5% |
|
| Patient satisfaction and preference for place of care - elderly with a medical condition including COPD | ||
| Caplan 2006 | Patient satisfaction 5 point scale (1=low, 5=high) Mean (sd) T=4.66 (0.64) C=4.06 (0.94) P=0.006 |
|
| Harris 2005 | Patient satisfactionGood/excellent rating of the service T=93/112 (83%) C=87/120 (72.5%) P<0.05 Did not feel under pressure T=111/116 (95.7%) C=105/115 (91.3%) NS Yes, would recommend to others T=110/116 (94.8%) C=111/115 (96.5%) NS |
|
| Ojoo 2002 | Preferred hospital at home: 26/30 (87%) Control: 16/30 (53%) Difference: 33%, 95% CI 18% to 55% |
|
| Shepperd 1998 | ELDERLY MEDICAL PATIENTS: Patient preference: At discharge: Treatment: 81% Control: 40% [ 41%, 20% to 62%] Patient satisfaction: At discharge from hospital at home, or hospital: Treatment=22.54 (4.74) Control=22.10 (4.68) [0.44, −3.86 to 4.75] CHRONIC PULMONARY DISEASE: Patient preference: At discharge: Treatment: 73% Control: 54.5% [18.5%, −21.3% to 57.7%] At discharge from hospital at home, or hospital: Treatment=25.0 (3.11) Control=24.66 (3.05) [0.83, −5.23 to 6.89] |
[difference, 95% CI] Patient preference - patients reporting they had received their preferred place of care Patient satisfaction - using modified version of satisfaction scale developed by Pound, maximum score of 33, indication high level of satisfaction |
| Skwarska 2000 | Treatment group only: 95%of 65% (79/122) of the patients reported being ‘completely satisfied’ | |
| Patient satisfaction and preference for place of care - recovering from a stroke | ||
| Anderson 2000 | Patient satisfaction at 6 months follow-upSatisfied with recovery T=33/42 (81%) C=29/44 (73%) P=0.56 95% CI −10.4, 26.4 Satisfied with rehabilitation programme T=37/42 (90%) C=32/44 (80%) P=0.33 95% CI −5.1, 25.6 Satisfied with return home T=36/42 (95%) C=36/44 (90%) P=0.68 95% CI −7.0, 16.4) Satisfied with information at time of illness T=26/42 (63%) C=21/44 (53%) P=0.44 95% CI −10.5, 32.3 Satisfied with communication with team T=33/42 (81%) C=27/44 (68%) P=0.28 95% CI −5.9, 31.9 Satisfied with understanding of why stroke occurred T=16/42 (39%) C=22/44 (55%) P=0.22 95% CI −37.4, 5.5 Satisfied with current support T=39/42 (95%) C=36/44 (90%) P=0.43 95% CI −6.3, 16.5 |
|
| Donnelly 2004 | Patient satisfaction At 12 months Mean (sd) T=10.72 (1.44) C=9.7 (2.1) 95% CI −1.7 to −0.24 P=0.02 Overall satisfactionAt 12 months Mean (sd) T=50 (9.7) C=42.6 (11.2) 95% CI −11.7 to −3.1 P=0.001 |
|
| Rudd 1997 | Patient satisfaction with hospital care: Treatment: 78/136 (79%) Control: 59/126 (65%) [14%, 1% to 27%] Patient satisfaction with therapy: Treatment: 56/136 (58%) Control: 46/126 (51%) [7%, −6% to 22%] Patient satisfaction with community care: Treatment: 28/136 (42%) Control: 29/126 (51%) [11%, −26% to 9%] |
[difference, 95% CI] |
| Suwenwela 2001 | Satisfaction with treatment At day 10 the number wanting to be treated at home T=41/52 (79%) C=15/50 (30%) |
|
| Widen-Holmqvist 1998 | Patient satisfaction with active participation in treatment: In favour of treatment group P<0.02 Patient satisfaction in general: Treatment: 68/136 (83%) Control: 52/126 (83%) [−12% to 13%] |
[difference, 95% CI] Patient satisfaction with active participation in treatment - no data reported. Results on other dimensions of patient satisfaction not reported |
| Carer outcomes | ||
| Askim 2004 | Carer strain index At 6 weeks follow-up Mean T=24.5 (2.3) (n=29) C=23.5 (2.4) (n=29) At 26 weeks follow up Mean T=24.2 (2.5) (n=22) C=25.0 (1.6) (n=23) At 52 weeks follow up Mean T=24.3 (2.7) (n=23) C=24.8 (1.9) (n=22) |
|
| Caplan 2006 | Carer satisfaction 5 point scale (1=low, 5=high) Mean (sd) T=4.47 (0.86) C=4.08 (1.04) P=0.19 |
|
| Cunliffe 2004 | GHQ - carer (36 to 0) At 3 months Mean difference −2.0 (95% CI −3.8 to −0.1) At 12 months Mean difference −1.1 (95% CI −3.7 to 1.5) |
|
| Donnelly 2004 | Carer strain At 12 months Mean (sd) T=5.9 (2.9) [n=27] C=6.0 (4.2) [n=25] 95% CI −2.14 to 2.3 P=0.93 |
|
| Harris 2005 | Relative satisfaction Good/excellent rating of service T=46/69 (67%) C=24/58 (41.4%) P<0.004 Did not feel under pressure T=57/69 (82.6%) C=34/55 (61.8%) P<0.009 Yes, would recommend to others T=62/63 (98.4%) C=51/57 (89.5%) P=0.03 Carer strain (0=low, 13=high) Mean T=4.6 (3.6) C=6.2 (3.7) P<0.02 |
|
| Ojoo 2002 | Carer preferred hospital at home: treatment: 17/20 (85%) control: 6/14 (43%) difference 42% 95% CI 12% to 72% |
|
| Rodgers 1997 | General health questionnaire (30): Median [range] Treatment: 5 [0-21] (n=22) Control: 5 [1-27] (n=19) |
|
| Rudd 1997 | Care Giver Strain: Treatment: 5 (4) Control: 4 (3) Treatment median 5 (range 0-12) Control median 3 (range 0-12) Carer satisfaction with hospital care: Treatment: 60 (74%) Control: 41 (67%) [7%, −8% to 22%] Carer satisfaction with therapy: Treatment: 40 (53%) Control: 28 (46%) [7%, −9% to 24%] Carer satisfaction with community support: Treatment: 28 (42%) Control: 29 (51%) [9%, −26% to 9%] Carer satisfaction in general: Treatment: 68 (83%) Control:52 (83%) [difference 0%, −12% to 13%] |
Care Giver Strain - mean (sd) Scale 0 to 13 Carer satisfaction with hospital care - denominator is not clear |
| Shepperd 1998 | ELDERLY MEDICAL PATIENTS: Carer Strain Index: Treatment=0.96 Control=−0.22 [1.17, 95% CI −0.47 to 2.82] Carers reporting they had received their preferred place of care: At 3 months: Treatment: 78% control: 70% Difference: 8%, (−16.6% to 33.8%) CHRONIC OBSTRUCTIVE AIRWAYS DISEASE: Carer Strain Index: Treatment=−0.33 Control=2.75 [−3.08, 95% CI −8.19 to 2.02] Carers reporting they had received their preferred place of care At 3 months: Treatment: 87.5% Control: 71.4% Difference: 16.1% (−24.5% to 56.6%) |
Carer Strain Index - mean change from baseline |
| GP views | ||
| Caplan 2006 | General Practitioner satisfaction 5 point scale (1=low, 5=high)Mean (sd) T=4.06 (0.96) C=3.78 (0.97) P=0.41 |
|
| Skwarska 2000 | For hospital at home group: 50% response rate: no increase in demand of service: 65%; 33% no decrease in demand for service; 2% reported increased demand for service |
|
| Readmission to hospital - short and long-term (not included in the meta- analysis) | ||
| Anderson 2000 | At 6 months T=15/42 (36%) C=11/44 (25%) difference 11% |
|
| Bautz-Holter 2002 | At 3 months T=2/34 C=4/32 At 6 months T=3/34 C=4/31 |
|
| Caplan 2006 | With 28 days after end of rehabilitation T=13/70 (21%) C=8/34 (24.2%) P=1.0 |
|
| Donald 1995 | Readmission at 6 months: T=9/30 C=6/30 |
|
| Donnelly 2004 | At 12 months t=6/59 (10.2%) c=7/54 (13%) |
|
| Martin 1994 | At 6 weeks: treatment: 4/29 (13.8%) control: 9/25 (36%), observed difference: - 22.2% 95% CI - 45% to 0.4% At 12 weeks: treatment: 5/29 (17.2%) control: 5/25 (20%) observed difference −2.8% 95% CI −23.6% to 18.1% At one year alive and never re admitted: treatment = 12/29 (41.4%) control = 4/25 (16%) observed difference 25.4% p < 0.05 95% CI 2.4% to 48% or readmitted treatment: 17/29 (58.6%) control: 21/25 (84%) difference −25.4%, 95% CI −48.4% to −2.4% |
|
| Rudd 1997 | At 1 year T=44/167 (26.4%) C=42/164 (25.6%) difference 0.74% |
|
| Widen-Holmqvist 1998 | At 6 months T=8/41 (19.5%) C=11/40 (27.5%) |
|
| Length of stay: in-patient days (including readmission days) - recovering from a stroke | ||
| Anderson 2000 | Total hospital bed days Median (IQR) T=15 (8.0, 22.0) C=30 (17.3, 48.5) Median difference −15, 95% CI −22.0 to −6.0 Readmission stay (days) Median (IQR) T=6.0 (3.0 to 39.0) C=4.0 (1.0 to 29.0) Median difference 2.0, 95% CI −7.0 to 18.0 P=0.26 |
|
| Askim 2004 | Inpatient length of stay Stroke Unit mean (sd) T=12.9 (10.3) C=13.6 (15.0) Stroke unit + rehabilitation clinics mean (sd) T=23.5 (30.5) C=30.5 (44.8) |
|
| Bautz-Holter 2002 | Length of stay Median T=22 days C=31 days P=0.09 |
|
| Donnelly 2004 | Length of stay T=42 days, median 31 C=50 days, median 32 |
|
| Indredavik 2000 | Average stroke unit length of stay: Treatment: 11 days Control: 11 days Average hospital length of stay (stroke unit plus rehabilitation): Treatment: 18.6 days Control: 31.1 days |
|
| Mayo 2000 | Length of hospital stay Mean days T=9.8 (5.3) C=12.4 (7.4) Length of stay to include hospital length of stay + rehabilitation hospital Mean days T=9.8 (5.3) C=16.1 (14.6) |
|
| Rodgers 1997 | Hospital length of stay: Median: Treatment : 13 days (IQR 8-25) Control: 22 days (IQR 10-57) P<0.02 |
|
| Rudd 1997 | Hospital length of stay: Length of stay to randomisation treatment mean: 22 (25) control mean: 25 (30) Length of stay from randomisation to discharge: Treatment mean (n = 167): 12 (19) Control mean (n = 164): 18 (24) Mean difference −6 days, 95% CI −10.7 to −1.32 Treatment median: 6 (range 0 to 149) Control median: 12 (range 0 to 236) P < 0.0001 (95% CI for median −6 to −2) No data for hospital at home length of stay CI for median difference reported by authors |
|
| Widen-Holmqvist 1998 | Hospital length of stay: Treatment mean 14 days (range 5 to 33) Control mean 29 days (range 5 to 136) 52% reduction, p < 0.0008 |
|
| Hospital length of stay - elderly medical | ||
| Caplan 2006 | Acute inpatient length of stay Acute ward T=18.73 (11.39) C=17.03 (8.68) P=0.45 Hospital los T=20.31 (12.45) C=40.09 (23.22) P=0.0001 Rehabilitation los T=15.97 (9.37) C=23.09 (19.41) P=0.02 Total los from admission to end of rehabilitation T=34.91 (15.37) C=40.09 (23.22) P=0.19 |
|
| Cotton 2002 | Mean days for initial stay T=3.2 (1 to 16) C=6.1 (1 to 13) Additional days due to readmission (n=12) T=8.75 C=7.83 difference 0.92 95% CI −6.5 to 8.3 |
|
| Cunliffe 2004 | Median IQR (mean) length of stay from randomization to discharge T=6 IQR 4 to 13 (12) C=13 IQR 6 to 24 (21) Median difference 4 (95% CI 3 to 7) Median IQR (mean) length of stay from randomization to 3 months T=9 IQR 4 to 22 (17) C=18 IQR 7 to 34 (23) Median difference 5 (95% CI 2 to 8) Median IQR (mean) length of stay from randomization to 12 months T=15 IQR 6 to 45 (29) C=21 IQR 9 to 50 (39) Median difference 4 (95% CI 1 to 9) |
|
| Donald 1995 | Hospital length of stay: Days between randomisation and discharge home (median days): treatment: 5 days control: 11 days p = 0.002 Total days of care (hospital plus hospital at home): No data |
|
| Martin 1994 | Hospital length of stay: At 12 weeks: treatment mean: 22.4 days control mean: 44.8 days Total days of care (hospital plus hospital at home): No data |
No p value given, insufficient data to calculate CI |
| Ojoo 2002 | Mean days T=5.9 C=7.4 difference −1.5 |
|
| Richards 1998 | Hospital length of stay: Hospital length of stay for patients with a medical condition: Treatment (n = 50) mean:39.12 (23.59) Control (n = 25) mean:50.12 (23.11) Difference -11, 95% CI −22.4 to −0.44 |
Mean (sd) unless stated otherwise Data obtained from authors |
| Shepperd 1998 | Hospital length of stay: Elderly medical Treatment (n=50): 12.84 (14.69) Control (n=44): 13.20 (14.19) difference −0.36 95% CI −6.30 to 5.57 Chronic obstructive airways disease treatment: 6.93 (3.39) control: 12.12 (7.49) difference −5.18 95% CI −9.48 to −0.89 |
|
| Skwarska 2000 | Median total length of stay treatment: 7 control: 5 median difference 2 days p<0.01 Hospital at home visits: Mean 3.8 per patient |
|
| Cost | ||
| Anderson 2000 | Initial length of hospital stay Median (range) T=2 (0-9) days [n=42] C=11.5 (0-76) days [n=44] P<0.001 Readmission length of stay Median (range) T=6 (2-24) [n=15] C=4 (1-85) [n=11] P=0.26 Hospital out patient visits Median (range) T=14.5 (7-50) [n=16] C=11 (1-40) [n=25] P=0.18 Home based rehabilitation days Median (range) T=35 (6-133) [n=42] C=0 [n=44] Hospital costs 6 months after randomization, mean costs per patient Australian $T=3142 (2743) C=7820 (6018) Mean difference −4678 95% CI −6680 to −2676 P<0.001 Home based rehabilitation 6 months after randomization Australian $ 1997/1998T=2985 (1659) C=79 (0) Mean difference 2906 95% CI 2389 to 3424 P<0.001 Community services 6 months after randomization Australian $ 1997/1998T=778 (1415) C=1460 (2502) Mean difference −682 95% CI −1552 to 187 P=0.12 Caregiver time 6 months after randomization Australian $ 1997/1998T=1135 (1402) C=695 (1020) Mean difference 440 95% CI −89 to 969 P=0.10 Total 6 months after randomization Australian $ 1997/1998 T=8040 (4439) C=10 054 (7676) Mean difference −2013 95% CI −4696 to 669 P=0.14 Sensitivity analysis: impact on health care costs $Aust Initial hospital costs 75% of baseline T=7255 (−785) C=8099 (−1955) Initial hospital costs 50% of baseline T=6469 (−1571) C=6144 (−3910) Home based rehabilitation at 25% increased cost T=8787 (747) C=10 074 (20) Home based rehabilitation at 50% increased cost T=9533 (1493) C=10 093 (39) Home based rehabilitation at 75% of baseline T=7294 (−746) C=10 034 (−20) Patients with mild disability (Barthel Index score 91-100) T=5565 (−2475) C=8165 (−1889) |
Costs calculated for each patient’s use of health care resources in the 6 months from randomisation, with an average per patient cost used if detailed information on patients was not available |
| Caplan 2006 | Overall Cost Acute + rehabilitation phase : overall cost T=A$ 18,147 ($9816) C=A$ 25,042 (£15,041) P=0.01 In UK £ T=7680 (4154) C=10598 (6365) Rehabilitation phase overall cost T= A$5,961 ($3210) C=A$14,413 ($12 631) P<0.0001 In UK£ T=2523 (1347) C=6100 (5345) |
Details of methods used to calculate costs not available. |
| Cunliffe 2004 | Total mean cost per case at 12 months T=£8,361 (£540) +/− £1,059 C=£10,088 (£713) +/− £1,398 Difference £−1,727 p=0.054 95%CI +/−£2,481 |
Health care service perspective, resource use quantified using data collected from service providers for 12 months after randomisation and on recorded client contact time for hospital at home. Cost of the initial hospital admission and readmissions was estmiated based on length of stay and cost per bed day by clinical specialty using NHS costs 2000/2001. Referrals to social services included in the costs |
| Donnelly 2004 | Cost At 6 months Mean cost per patient (sd) Hospital in patients T=£7831 (5000) C=£9864 (£8198) 95% CI −£2407 to £6472.5 P=0.74 All community services T=£3468 (£4612) C=£3655 (£4531) 95% CI £2917.8 to £3292.6 P=0.96 Combined package T=£11 759 (£8600) C=£13 337 (£11 182) 95% CI £5035.6 to £8189.1 P=0.92 |
Health service perspective, financial accounts were used to cost hospital care; costs collected from patients using a service use questionnaire and unit costs of health and social care to cost hospital at home care. |
| Mayo 2000 | Costs of resources used at 3 months: mean cost per patient Can $ (sd) Post randomization acute care bed days T=1383.28 (1599.97) C=2220.25 (2321.9) Rehabilitation bed days T=136.7 (1041.1) C=1061.89 (3484.24) Readmission bed days T=364.03 (1794.84) C=1793.01 (5504.66) Home intervention T=942.87 (505.45) C=0 CLSC visits T=124.83 (259.85) C=144.76 (280.09) Outpatient visits T=381.31 (760.17) C=730.7 (947.93) ER visits T=62.07 (117.93) C=61.72 (162.14) Physician billings T=539.67 (545.74) C=764.96 (724.83) Total costs T=77,84.25 (3858.36) C=11,065.2 (7504.19) difference $-3,280.95 p<0.0001 |
Health care perspective at the patient level. Unit costs included overhead costs and an allowance for the opportunity cost of buildings and land. Cost for 3 months follow-up included |
| Rudd 1997 | Average annual cost: Treatment: £811,984 (£4,862 per patient Control: £1,040,276 (£6,343 per patient) Cost of non inpatient care: Treatment: £323,625 (£1,938 per patient) Control: £178,526 (£1,089 per patient) Total health care costs: Treatment: £1,135,609 (£6,800 per patient) Control: £1,218,802 (£7,432 per patient) difference £−632.00 |
Cost data financial year 1997. Costs calculated at the level of the patient by using data from provider departments and other published sources |
| Shepperd 1998 | Costs at 3 months follow-up: Elderly medical patients: Hospital costs per patient: Median Treatment: £913.76 (IQR £243.31 to £2045.68) Mean: £1376.38 (1370) Median Control: £1,366.16 (IQR£629.1 to £2033. 5) Mean: £1654.2 (1501.4) p>0.21 Mean hospital at home costs: Treatment: £ 793.4 (811.4) Total health service costs: Treatment group: Median £1,705.3 (IQR 913.83 to 3,121.55) Mean: £2279.74 (1765.4) Control group: Median £1,388.8 (IQR 645.1 to 2,094.9) p>0.09 Mean £1712.6 (1518) CHRONIC OBSTRUCTIVE AIRWAYS DISEASE: Hospital costs: Median Treatment: £1,389.53 (IQR £821.65 to £1, 993.97) Median Control: £1,198 (IQR £712 to £1,508.2) p>0.56 Mean hospital at home costs: Treatment: £ 710.6 (526.5) Total health service costs: Median Treatment: £2,379.7 (IQR 1,458.1 to 2, 759.1) Median Control: £1,247.6 (IQR 772.5 to 1,619.2) median difference £1132.10 p<0.01 |
Mann Whitney U test Cost data financial year 1994/1995. Health service perspective, dependency scores developed to account for the different resouces used during a patient’s inpatient admission. Costs calculated at the patient level |
| Skwarska 2000 | Mean cost to the health service: treatment: £877. 00, control: £1,753 | Cost data financial year 97/98 Costs based on average cost per bed day in the respiratory unit. GP costs calculated from unit costs estimated by Personal & Social Services Research Unit, Kent |
| Use of other services - elderly with a medical condition | ||
| Cunliffe 2004 | Attending geriatric day hospital: Over 12 months T=21/185 (11%) C=57/185 (31%) RR 0.47 (95% CI 0.23 to 0.56) Mean hospital outpatient visits over 12 months T=3.4 C=3.3 P=0.85 Mean GP visits over 12 months T=6 C=6.7 P=0.16 |
|
| Martin 1994 | At 6 weeks: Home care: treatment: 2/24 (8.3%) control = 8/10 (80%) p< 0.05 observed difference: 71.7% 95% CI - 99% to - 44% At 12 weeks: District nurse visits: treatment: 11/21 (52.4%) control: 3/11 (27.3%) p< 0.05 observed difference: 25.1% 95% CI −9% to 59% Receipt of social services Over 12 months T=145/185 (78%) C=151/185 (82%) RR 0.96 (95% CI 0.87 to 1.06) |
|
| Use of other services - recovering from a stroke | ||
| Anderson 2000 | Use of community services T=28/42 (67%) C=30/44 (68%) Difference 1%, 95% CI −21% to 18% |
|
| Bautz-Holter 2002 | Provision of district nursing At 3 months T=13 (36.1) [n=34] C=7 (22) [n=32] At 6 months T=9 (26.5) [n=34] C=6 (19.4) [n=31] Provision of home care At 3 months T=16 (44.4) [n=34] C=13 (40.6) [n=32] At 6 months T=17 (50) [n=34] C=14 (45.2) [n=31] Provision of occupational therapy At 3 months T=7 (19) [n=34] C=5 (15.6) [n=32] At 6 months T=2 (5.9) [n=34] C=4 (12.9) [n=31] Provision of physiotherapy At 3 months T=22 (61.1) [n=34] C=14 (43.8) [n=32] At 6 months T=17 (50) [n=34] C=11 (35.5) [n=31] |
|
| Mayo 2000 | Average number of visits Physiotherapist T=6 C=9 Occupational therapist T=4 C=5 Speech therapy T=2 C=2.5 Nursing visits T=2.5 C=4 Although more visits on average in the control group, the proportion of patients receiving care in this group was less, 7 patients receiving extended rehabilitation account for the increased visits. All patients in the intervention group received nursing visits, compared with 52%in the control group; 75% in the intervention group received physiotherapy, compared with 50% in the control group |
|
| Patients’ place of residence at follow up | ||
| Anderson 2000 | At 6 months Admitted to residential care T=2/42 (5%) C=5/44 (11%) Difference −6%, 95% CI −18% to 4.8% |
|
| Bautz-Holter 2002 | Institional care At 3 months T=2/40 C=5/37 OR3.0 (0.5 to 24.0) At 6 months T=1/40 C=5/36 OR 6.3 95% CI 0.6 to 305 |
|
| Donald 1995 | At 6 months: Nursing home: treatment: 2/30 (6.6%) control: 5/30 (16.7%) observed difference: −10.1% 95% CI −26% to 6.05% |
|
| Indredavik 2000 | Discharge residence: Discharged to another institution at 6 weeks: Treatment: 37/160 (23.1%) Control: 64/160 (40%) Difference p < 0.001 Discharge residence: At home at 6 weeks: Treatment: 119/160 (74.4%) Control: 89/160 (55.6%) p < 0.01 At home at 26 weeks: Treatment: 126/160 (79%) Control: 117/160 (73%) p < 0.24 Discharged to another institution at 26 weeks: Treatment: 21/160 (13.1%) Control: 28/160 (17.5%) P < 0.001 |
|
| Martin 1994 | Home at 6 weeks: treatment: 24/29 (82.7%) control: 10/25 (40%) observed difference: 42.7% p < 0.001 95% CI 20% to 66% Home at 12 weeks: treatment: 21/29 (72%) control: 11/25 (44%) observed difference 28% p <0.05 95% CI 3% to 54% Home at one year: treatment: 17/29 (58.6%) control: 10/25 (40%) observed difference 18.6% 95% CI −8% to 45% Residential care: At 6 weeks: treatment: 0/29 (0%) control: 3/25 (12%) observed difference −12% 95% CI −24.7% to 0.74% At 12 weeks: treatment: 1/29 (3.4%) control: 4/25 (16%) observed difference −12.6% 95% CI −28.4% to 3.28% At 1 year: treatment: 2/29 (6.9%) control: 8/25 (32%) observed difference −25.1% 95% CI −45.6% to - 4.6% Continuing care At 1 year: treatment: 0/29 (0%) control: 2/25 (8%) observed difference 8% 95% CI −2.6% to 18.6% |
|
| Rodgers 1997 | Discharged to residential or nursing home care: Treatment: 3/46 (7%) Control: 5/46 (11%) Difference 5%, 95% CI −15.8% to 7.1% |
|
| Hospital at home length of stay | ||
| Anderson 2000 | Length of home based rehabilitation Median T=5 weeks (range 1 to 19 weeks) |
|
| Cunliffe 2004 | Median (IQR) visits from EDRS (mean) T=8 IQR 5 to 31 (22) Median IQR (mean) length of stay from randomization to discharge T=6 IQR 4 to 13 (12) |
|
| Rodgers 1997 | Median hospital at home length of stay: 9 weeks [range 1 to 44 weeks] | |
| Skwarska 2000 | Hospital at home visits: Mean 3.8 per patient |
|
| Total length of stay - hospital plus hospital at home | ||
| Harris 2005 | Total length of stay (IPD) T=23.5 SD15.6 C=17.7 SD18.3 difference 5.76 days, 95% CI 1.11 to 10.4, p<0.02 |
|
| Richards 1998 | Total length of stay for patients with a medical condition: Treatment (n = 50): 53.8 (26.59) Control (n = 25): 50.12 (23.11) Difference 3.68 days, 95% CI −8.77 to 16.1 |
|
| Shepperd 1998 | Total days of care (hospital plus hospital at home): Elderly medical treatment: 21.88 (18.30) control: 13.20 (14.19) difference 8.67 95% CI 1.90 to 15.45 Chronic obstructive airways disease treatment: 12.27 (3.69) control: 12.12 (7.49) difference 0.15 95% CI −4.21 to 4.51 |
|
| Falls | ||
| Anderson 2000 | Falls at 6 months T=5/42 (12%) C=7/44 (16%) P=0.82 95% CI −18.6, 10.6 |
|
| Harris 2005 | Falls Days 0-10 T=11/143 (8.1%) C=8/142 (5.6%) Days 11-30 T=8/143 (6.2%) C=6/142 (4.8%) Days 31-90 T=14/143 (10.9%) C=18/142 (14.4%) Total falls by 3 months: T=33/143 (23%) C=32/142 (22.5%) |
|
| Widen-Holmqvist 1998 | Falls (non recurrent): Treatment: 10/41 (24.4%) Control: 6/40 (15%) Difference 9.4%, 95% CI −7.8% to 26.6% |
2 falls in treatment group resulted in a fracture |
Analysis 1.2. Comparison 1 Hospital at home versus in-patient care, Outcome 2 Mortality at 3 months - older people with a mix of conditions
Review: Hospital at home early discharge
Comparison: 1 Hospital at home versus in-patient care
Outcome: 2 Mortality at 3 months - older people with a mix of conditions
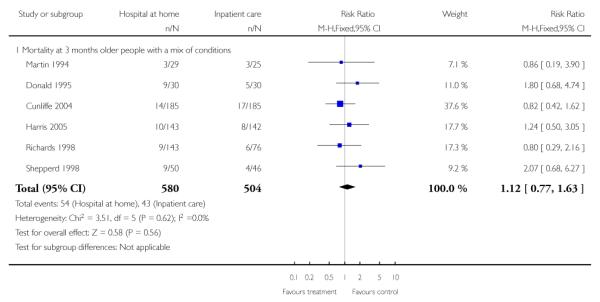
|
Analysis 1.3. Comparison 1 Hospital at home versus in-patient care, Outcome 3 Mortality at 6 months - older people with a medical condition requiring geriatric rehabilitation
Review: Hospital at home early discharge
Comparison: 1 Hospital at home versus in-patient care
Outcome: 3 Mortality at 6 months - older people with a medical condition requiring geriatric rehabilitation

|
Analysis 1.4. Comparison 1 Hospital at home versus in-patient care, Outcome 4 Mortality at 3 months - patients recovering from a stroke
Review: Hospital at home early discharge
Comparison: 1 Hospital at home versus in-patient care
Outcome: 4 Mortality at 3 months - patients recovering from a stroke
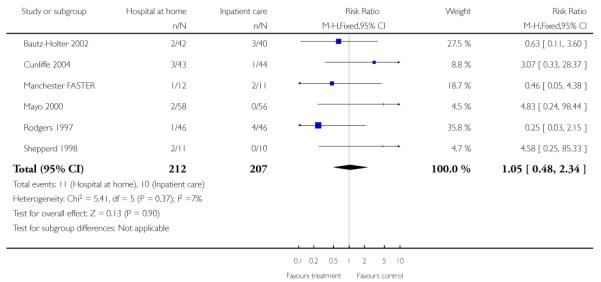
|
Analysis 1.5. Comparison 1 Hospital at home versus in-patient care, Outcome 5 Mortality at 6 months - patients recovering from a stroke
Review: Hospital at home early discharge
Comparison: 1 Hospital at home versus in-patient care
Outcome: 5 Mortality at 6 months - patients recovering from a stroke
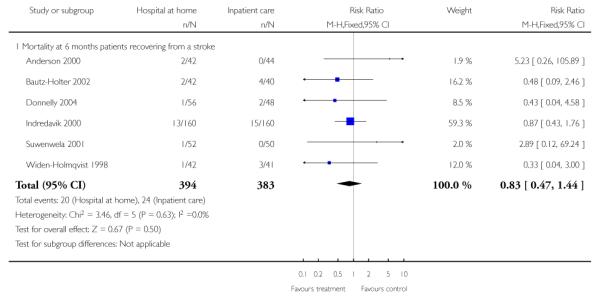
|
Analysis 1.6. Comparison 1 Hospital at home versus in-patient care, Outcome 6 Mortality at 1 year - patients recovering from a stroke
Review: Hospital at home early discharge
Comparison: 1 Hospital at home versus in-patient care
Outcome: 6 Mortality at 1 year - patients recovering from a stroke
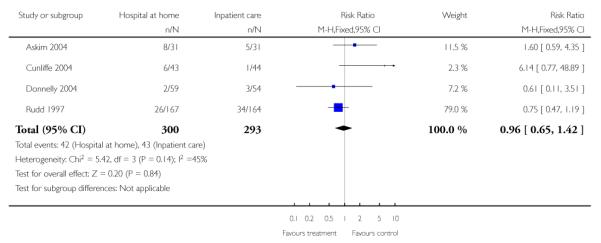
|
Analysis 1.7. Comparison 1 Hospital at home versus in-patient care, Outcome 7 Mortality - chronic obstructive airways disease
Review: Hospital at home early discharge
Comparison: 1 Hospital at home versus in-patient care
Outcome: 7 Mortality - chronic obstructive airways disease
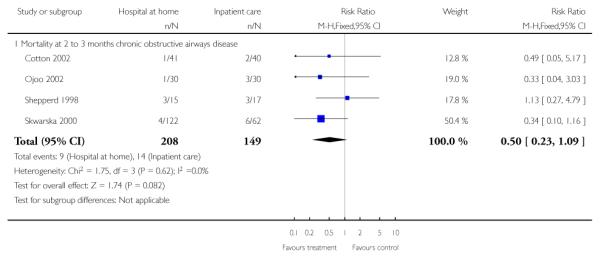
|
Analysis 1.8. Comparison 1 Hospital at home versus in-patient care, Outcome 8 Readmission to hospital at 3 months - older people with a mix of conditions
Review: Hospital at home early discharge
Comparison: 1 Hospital at home versus in-patient care
Outcome: 8 Readmission to hospital at 3 months - older people with a mix of conditions
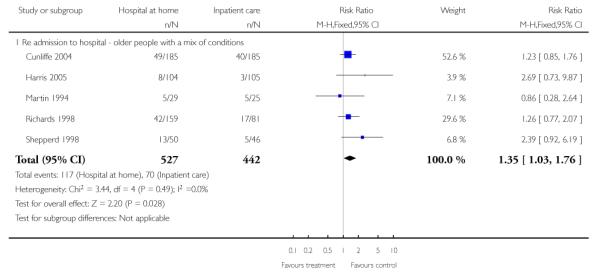
|
Analysis 1.9. Comparison 1 Hospital at home versus in-patient care, Outcome 9 Readmissions at 3 months - those recovering from a stroke
Review: Hospital at home early discharge
Comparison: 1 Hospital at home versus in-patient care
Outcome: 9 Readmissions at 3 months - those recovering from a stroke
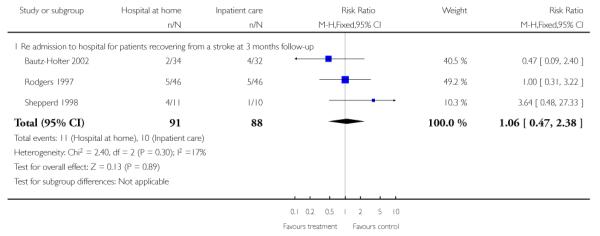
|
Analysis 1.10. Comparison 1 Hospital at home versus in-patient care, Outcome 10 Readmissions at 6 months - those recovering from a stroke
Review: Hospital at home early discharge
Comparison: 1 Hospital at home versus in-patient care
Outcome: 10 Readmissions at 6 months - those recovering from a stroke
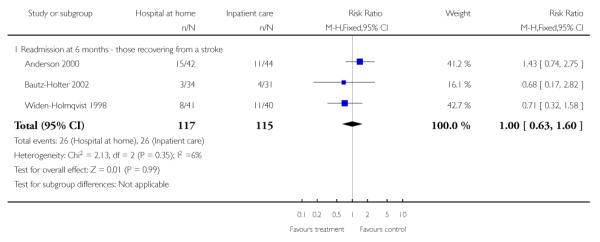
|
Analysis 1.11. Comparison 1 Hospital at home versus in-patient care, Outcome 11 Readmission at 1 year for those recovering from a stroke
Review: Hospital at home early discharge
Comparison: 1 Hospital at home versus in-patient care
Outcome: 11 Readmission at 1 year for those recovering from a stroke

|
Analysis 1.12. Comparison 1 Hospital at home versus in-patient care, Outcome 12 Readmission for those with COPD
Review: Hospital at home early discharge
Comparison: 1 Hospital at home versus in-patient care
Outcome: 12 Readmission for those with COPD
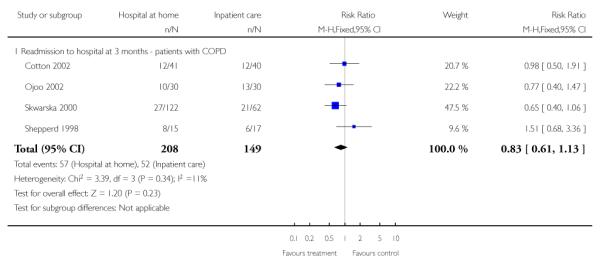
|
Analysis 1.13. Comparison 1 Hospital at home versus in-patient care, Outcome 13 Functional ability at 3 months - older people with a mix of conditions
Review: Hospital at home early discharge
Comparison: 1 Hospital at home versus in-patient care
Outcome: 13 Functional ability at 3 months - older people with a mix of conditions
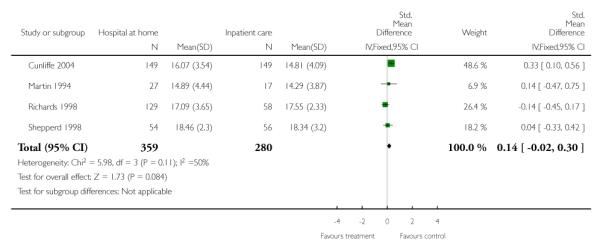
|
Analysis 1.14. Comparison 1 Hospital at home versus in-patient care, Outcome 14 Residential care at 1 year follow up (Donald 6 months) - older patients with a mix of conditions
Review: Hospital at home early discharge
Comparison: 1 Hospital at home versus in-patient care
Outcome: 14 Residential care at 1 year follow up (Donald 6 months) - older patients with a mix of conditions
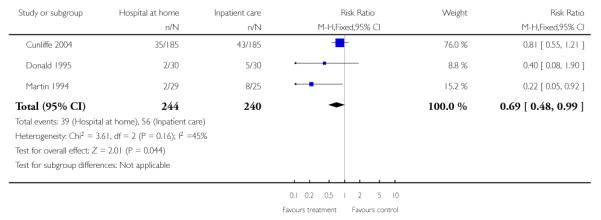
|
Analysis 1.15. Comparison 1 Hospital at home versus in-patient care, Outcome 15 Residential care at 6 months follow up (Rodgers 3 month data) - recovering from a stroke
Review: Hospital at home early discharge
Comparison: 1 Hospital at home versus in-patient care
Outcome: 15 Residential care at 6 months follow up (Rodgers 3 month data) - recovering from a stroke
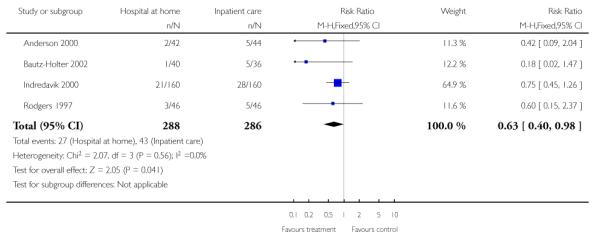
|
Analysis 1.16. Comparison 1 Hospital at home versus in-patient care, Outcome 16 Hospital length of stay - older people with a mix of conditions
Review: Hospital at home early discharge
Comparison: 1 Hospital at home versus in-patient care
Outcome: 16 Hospital length of stay - older people with a mix of conditions

|
Analysis 1.17. Comparison 1 Hospital at home versus in-patient care, Outcome 17 Hospital length of stay - those recovering from a stroke
Review: Hospital at home early discharge
Comparison: 1 Hospital at home versus in-patient care
Outcome: 17 Hospital length of stay - those recovering from a stroke
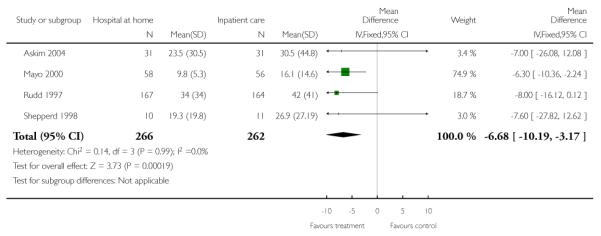
|
Analysis 1.18. Comparison 1 Hospital at home versus in-patient care, Outcome 18 Hospital length of stay - patients with chronic obstructive pulmonary disease
Review: Hospital at home early discharge
Comparison: 1 Hospital at home versus in-patient care
Outcome: 18 Hospital length of stay - patients with chronic obstructive pulmonary disease

|
Analysis 1.19. Comparison 1 Hospital at home versus in-patient care, Outcome 19 Total length of stay - older people with a mix of mainly medical conditions
Review: Hospital at home early discharge
Comparison: 1 Hospital at home versus in-patient care
Outcome: 19 Total length of stay - older people with a mix of mainly medical conditions
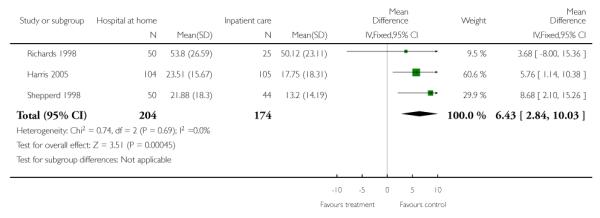
|
Analysis 1.20. Comparison 1 Hospital at home versus in-patient care, Outcome 20 Early discharge of patients following surgery
Early discharge of patients following surgery
| Study | Results | Notes |
| Patient outcomes: all clinical complications | ||
| Adler 1978 | All clinical complications: At 7 days after surgery: treatment: 7/56 (12.5%) control: 5/49 (10.2%) observed difference: 2.3% 95% CI −9.8% to 14% Varicose veins treatment: 8/61 (13.1%) control: 0/58 (0%) observed difference: 13.1% 95% CI 5% to 22% |
Hernia |
| Booth 2004 | In hospital clinical events T=20/65 (30%) C=8/32 (25%) P=0.55 |
|
| Ruckley 1978 | All clinical complications: At 2 - 3 weeks: treatment: 27/117 (23.1%) control: 17/121 (14%) observed difference: 9.1% 95% CI −19% to 1% |
Conditions were combined |
| Patient outcomes: mortality | ||
| Richards 1998 | Mortality: Treatment: 12/60 (7.5%) Control: 6/81 (7.4%) [0.1%, −7% to 7%] |
|
| Shepperd 1998 | Mortality: At 3 months: Hip replacements: Treatment: 0/37 Control: 1/49 Knee replacements: Treatment: 0/47 Control: 0/39 Hysterectomy: Treatment: 0/114 Control: 0/124 |
|
| Patient outcomes: functional status | ||
| Crotty 2002 | Functional status at 4 months (median change from baseline, 25th & 75th percentile): Modified Barthel Index treatment: 11.00 (5.5 to 16.0) Control: 8.0 (−2.5 to 13.5) median difference in change score 3.00 p < 0.05 Falls efficacy scale (median, 25th & 75th percentile) treatment: 90.5 (80.5 to 98) control: 79.5 (40.0 to 92. 5) p < 0.05 SF36 Physical component scale: (median change from baseline, 25th & 75th percentile) treatment: −3.4 (−14. 9 to 8.1) control: −3.9 (−19.5 to 11.7) SF36 Mental Component Scale: (median change from baseline, 25th & 75th percentile) treatment: 0.01 control: −11.7 (−23.4 to 0.05) |
SF36 PCS |
| Palmer Hill 2000 | change from baseline, 25th & 75th percentileno data reported | SF 36 physical component scale, and number of falls |
| Richards 1998 | Functional status: At 3 months follow-up: Treatment: 1.9 Control: 1.7 [0.17, −0.76 to 1.10] |
Barthel Index: Scale 0-20 (low score = high level of dependence) |
| Patient outcomes: quality of life | ||
| Booth 2004 | SF-36 PCS at 12 weeks Mean (sd) T=47.4 (11.8) C=49 (11.7) Difference −0.5, 95% CI −5.8 to 4.8, p=0.85 SF36 MCS at 12 weeks Mean (sd) T=48.9 (8.2) C=49.2 (8.6) Difference 0.6, 95% CI −2.7 to 3.8, p=0.73 |
|
| Richards 1998 | Physical fitness: At 3 months follow-up: [−0.05,−0.28 to 0.19] Feelings: At 3 months follow-up: [−0.09, −0.50 to 0.32] Daily activities: At 3 months follow-up: [−0.04, −0.47 to 0.38] Social activities: At 3 months follow-up: [0.07, −0.38 to 0.52] Change in health: At 3 months follow-up: [−0.01, −0.34 to 0.31] Overall health: At 3 months follow-up: [0.10, −0.21 to 0.42] EQ 5D scores: At 3 months: [−0.04, −0.13 to 0.06] EQ 5D thermometer: At 3 months: [−4.6, −11.0 to 2.0] |
EQ 5D scores: Possible range 5-15 EQ 5D thermometer: Possible range 0-100 |
| Shepperd 1998 | HIP REPLACEMENT Physical fitness: Treatment: 0.42 Control: 0.51 −0.09 (−0.48 to 0.29) Feelings: Treatment: 1.03 Control: 0.78 0.25 (−0.29 to 0.79) Daily activities: Treatment: 1.00 Control: 0.93 0.07 (−0.39 to 0.53) Social activities: Treatment: 1.43 Control: 1.02 0.41 (−0.15 to 0.97) Pain: Treatment: 1.54 Control: 1.69 −0.15 (−0.78 to 0.49) Change in health: Treatment: 0.74 Control: 0.13 0.61 (0.02 to 1.20) Overall health: 0.10 (−0.35 to 0.55) Social support: Treatment: 0.26 Control: 0.40 −0.14 (−0.57 to 0.28) Quality of life: Treatment: 0.97 Control: 0.47 0.50 (0.13 to 0.88) Oxford Hip Score *: Treatment: 4.77 Control: 3.13 1.64 (−1.23 to 4.5) KNEE REPLACEMENT Physical fitness: Treatment: 0.19 Control: 0.29 −0.10 (−0.49 to 0.29) Feelings: Treatment: 0.51 Control: 0.37 0.14 (−0.50 to 0.78) Daily activities: Treatment: 0.68 Control: 0.91 −0.23 (−0.71 to 0.26) Social activities: Treatment: 0.98 Control: 0.91 0.07 (−0.61 to 0.74) Pain: Treatment: 1.02 Control: 1.06 −0.04 (−0.62 to 0.53) Change in health: Treatment: 0.48 Control: 0.62 −0.14 (−0.73 to 0.45) Overall health: Treatment: −0.11 Control: 0.15 −0.26 (−0.65 to 0.12) Social support: Treatment: 0.18 Control: −0.03 [0.21, −0.33 to 0.74] Quality of life: Treatment: 0.42 Control: 0.40 [0.02, −0.37 to 0.41] Bristol knee score *: Treatment: −3.00 Control: −4.06 [1.06, −1.58 to 3.70] HYSTERECTOMY Physical fitness Treatment: 0.04 Control: 0.04 [0.00, −0.43 to 0.44] Feelings: Treatment: 0.70 Control: 0.84 [−0.14, −0.48 to 0.19] Daily activities: Treatment: 0.52 Control: 0.45 [0.07, −0.25 to 0.38] Social activities: Treatment: 0.56 Control: 0.52 [0.04, −0.30 to 0.38] Pain: Treatment: 1.22 Control:1.20 [0.02, −0.42 to 0.48] Change in health: Treatment: 1.45 Control: 1.36 [0.09, −0.22 to 0.40] Overall health: Treatment: 1.09 Control: 0.82 [0.27, −0.06 to 0.58] Social support: Treatment: 0.48 Control:0.42 [0.06, −0.27 to 0.37] Quality of life: Treatment: 0.65 Control: 0.67 [−0.02, −0.30 to 0.27] SF-36 physical functioning: Treatment: −4.82 Control: −3.02 [−1.80, −8.28 to 4.69] |
HIP REPLACEMENT Dartmouth COOP charts: Scale 1-5 (low score = good quality of life) Follow up data at 3 months for: Treatment=36 Control=45 *Oxford hip score. Baseline score measured at 1 month. Scale 12-60 (high score = high level of impairment) KNEE REPLACEMENT Dartmouth COOP charts: Scale 1-5 (low score = good quality of life) Follow up data at 3 months for: Treatment=45 Control=35 *Bristol knee score. Baseline score done at 1 month. Scale 0-50 (low score = poor level of functioning) HYSTERECTOMY Dartmouth COOP charts: Scale 1-5 (low score = good quality of life) Follow up data at 3 months for: Treatment=45 Control=35 |
| Patient outcomes: patient satisfaction | ||
| Adler 1978 | Patient satisfaction: At 14 days: treatment: 76/117 (64.9%) control: 62/107 (57.9%) observed difference: 7% 95% CI −6% to 20% |
Patients were asked if they were content with their length of stay in hospital |
| Crotty 2002 | Patient satisfaction: median score (25th & 75th percentile) treatment: 21.0 (19.0 to 23.0) control: 20.0 (18.0 to 22.0) |
Only 20% of those with a fracture were eligible and agreed to enter trial |
| Richards 1998 | Quality of service (excellent): Treatment: 50.7% Control: 44.6% [6.1%, −8.6% to 20.8%] Received needed services (all of the time): Treatment: 63% Control: 60% [3.0%, −11.5% to 17.4%] Content with care (all of the time): Treatment: 69.6 Control: 56.9 [12.7,−1.6 to 27.0] Received all help needed (yes): Treatment: 83.8 Control:75.4 [8.4, −3.7 to 20.6] Discussions with staff (excellent): Treatment: 47.4 Control: 27.7 [19.7, 5.9 to 33.5] Involved in decision making (as much as wanted): Treatment: 79.4 Control:71.5 [7.7, −5.7 to 21.1] Information about illness (as much as wanted): Treatment: 76.7 Control:80.0 [−3.3, −15.7 to 9.2] Information on treatment (as much as wanted): Treatment: 77.5 Control:80.7 [−3.2, −11.2 to 17.8] Privacy (as much as wanted): Treatment: 84.7 Control: 88.1 [−3.4, −13.7 to 6.9] Informal practical support (as much as wanted): Treatment: 87 Control: 93.2 [−6.2, −14.8 to 2.4] Informal emotional support (as much as wanted): Treatment: 93.9 Control: 96.6 [−2.7, −8.9 to 3.5] |
Patient satisfaction measured at 4 weeks follow-up |
| Ruckley 1978 | Patient satisfaction: Advantages seen by patients: treatment: 108/117 (92.3%) control: 95/121 (78.5%) difference: 13.8% 95% CI 5% to 23% Disadvantages seen by patients for carers: treatment = 39/117 (33.3%) control = 14/121 (11.6%) Difference: 21.8% 95% CI 11.5% to 32% At discharge from hospital at home, or hospital: Treatment=25.0 (3.11) Control=24.66 (3.05) [0.83, −5.23 to 6.89] At discharge from hospital at home, or hospital: Treatment=25.0 (3.11) Control=24.66 (3.05) [0.83, −5.23 to 6.89] |
|
| Shepperd 1998 | HIP REPLACEMENT Patient satisfaction: At discharge from hospital at home, or hospital: Treatment=27.2 (5.2) Control=25 (4.7) [2.2, −2.63 to 7.02] Patient preference: At discharge from place of care: Treatment: 85.7% Control: 50% [35.7%, 16.7% to 54.8%] KNEE REPLACEMENT Patient satisfaction: At discharge from hospital at home, or hospital: Treatment: 27.8 (4.1) Control: 25.00 (5.19) [2.77, −1.91 to 7.46] Patient preference: At discharge from place of care: Treatment: % Control [34%, 14% to 54%] HYSTERECTOMY Resumption of domestic duties: At discharge from hospital at home, or hospital: Mean difference [−0.15, −0.35 to 0.05] Resume parental responsibilities before feeling well enough: At discharge from hospital at home, or hospital: Mean difference [−0.24, −0.46 to −0.02] Patient preference: At discharge from place of care: Treatment: 85.15% Control: 66.7% [19%, 8% to 30%] |
Patient satisfaction - using modified version of satisfaction scale developed by Pound, maximum score of 33, indication high level of satisfaction Resumption of domestic duties and parental responsibilities - p;atients were asked to agree or disagree with statement on a 0 - 3 scale (3 indicating high level of agreement) Patient preference - patients reporting they had received their preferred place of care |
| Carer outcomes | ||
| Crotty 2002 | Median change from baseline and 25th & 75th percentile: SF36 Physical component scale: treatment: −0.9 (−7.1, 5.3) control: 5.2 (−16.4, 6.0) SF 36 Mental component scale: treatment: 3.7 (−2.5. 9.9) control: −4.7 (−19.8, 10.3) Caregiver Strain Index: treatment: 1.0 (0, 4.0) control: 2.0 (0, 6.8) Carer time spent: treatment: 18.6% (6.3 to 30.9) control: 22.1% (9.6 to 34.7) |
4 month follow up SF 36 higher score indicates greater improvement, Carer Strain Index a lower score indicates improvement |
| Shepperd 1998 | HIP REPLACEMENT Carer Strain Index: Treatment median: 0.00 Control median:1.00 Mann Whitney p = 0.34 Carer satisfaction: Treatment: 18.2 (2.5) Control: 18.8 (2.5) [−0.68, −4.09 to 2.75] Carer preference: At 3 months: Difference: 18.9%, (−1.36% to 39.2%) KNEE REPLACEMENT Carer Strain Index: Treatment: 0.25 Control:−0.58 [0.83, 95% CI −0.79 to 2.45] Carer satisfaction: Treatment: 19.57 (3.46) Control: 18.2 (3.9) [1.37, −2.55 to 5.29] Carer preference: At 3 months: Treatment: 87.5% Control: 71.4% Difference: 16.1% (−24.5% to 56.6%) HYSTERECTOMY Carer Strain Index: Treatment: 0.15 Control: 0.28 [−0.13, −0.77 to 0.52] Carer satisfaction: Resumption of domestic duties: mean difference −0.15, 95% CI −0.35 to 0.05 Resumption of parental responsibilities: mean differrence −0.24, 95% CI −0.46 to −0.02 Carer preference: At 3 months: Difference 19%, 95% CI 8% to 30% |
HIP REPLACEMENT Carer Strain Index - median change from baseline at 3 months Carer satisfaction - using modified version of satisfaction scale developed by Pound, scale 0-24, high score indicating high level of satisfaction Carer preference - carers reporting they had received their preferred place of care KNEE REPLACEMENT and HYSTERECTOMY Carer Strain Index - mean change from baseline at 3 months Carer satisfaction - modified version of scale developed by Pound, scale 0-24, high score indicating high level of satisfaction Carer preference - carers reporting they had received their preferred place of care (KNEE REPLACEMENT) |
| GP workload | ||
| Adler 1978 | Verbal report | No p value given, insufficient data to calculate CI |
| Crotty 2002 | Visits to GP treatment: 3.3 (2.4 to 30.9) control: 4.5 (3.3 to 5.8) Use of community services: treatment: 19/34 (63%) control: 23/32 (77%) |
At 4 month follow up |
| Ruckley 1978 | At 3 weeks post-op: 8 minutes extra for day care patients |
No p value given, insufficient data to calculate CI |
| Shepperd 1998 | Patients recovering from a hip replacement: Home and surgery visits: median difference: £27.35 p < 0.06 Patients recovering from a knee replacement: Home and surgery visits: median difference: £0.00 Patients recovering from a hysterectomy: Home and surgery visits: median difference: £0.00 |
Mann Whitney test |
| Readmission to hospital | ||
| Crotty 2002 | Mean readmission rate at 4 months: treatment: 0.22 (0.07 to 0.46) control: 0.22 (0.01 to 0.45) |
|
| Palmer Hill 2000 | Readmission treatment 1/32; control 1/28 Re admission days: treatment 0.22 (0.01 to .045) control: 0.27 (0.07 to 0.46) |
Follow up time not specified, 4 months follow up for re admission days |
| Richards 1998 | Treatment: 5.6 (13.84) Control: 4.8 (12.17) Difference 0.8 (−2.78 to 4.38) Treatment: 42/159 (26.4%) Control: 17/81 (21%) Difference 5.4% (−5.8% to 16.6%) |
Re admission days at 3 months (mix of surgical and medical patients) |
| Ruckley 1978 | At 2 to 3 weeks: treatment: 0/117 (0%) control: 2/121 (1.65%) observed difference 1.65% 95% CI −3.92% to 0.62% |
|
| Shepperd 1998 | KNEE REPLACEMENT At 3 months follow-up: Treatment: 4/47 (8.5%) Control: 1/39 (2.6%) Difference 5.9 (−3.5 to 15.3%) HIP REPLACEMENT At 3 months follow-up: Treatment: 2/37 (5.4%) Control: 1/49 (2.0%) Difference 3.4% (−4.9% to 11.7%) HYSTERECTOMY At 3 months follow-up Treatment: 7/114 (6.1%) Control: 13/124 (10.5%) Difference −4.3% (−11.3% to 2.6%) |
|
| Cost | ||
| Adler 1978 | 1971/72 prices Social cost (health service, society, patient) difference: £6.90 per male hernia patient, difference: £19.62 per female varicose vein patient |
No p value given, insufficient data to calculate CI |
| Booth 2004 | Hospital costs for surgery T=£5644 C=£5629 difference £15, 95% CI −363 to 457 Costs of readmission T=£185 C=£492 Difference £−306.00 95% CI £−758 to £61 Primary care costs T=£58 C=£63 Difference £−5, 95% CI −£32 to 18 Cost of hospital visits (includes pre admission clinic, inpatient care, and home costs) T=£240 C=£198 Difference £42, 95% CI −£45 to 124 Total costs at 12 weeks (include inpatient hospital care, home care, primary care, readmission and home visit costs. T=£6127 C=£6381 Difference £−254 95% CI −£919 to 348 |
Health service perspective. Costs estimated for each patient, unit costs obtained from the hospital financial figures and published data |
| Richards 1998 | Total cost: Treatment: £2,516 Control: £3,292 Difference £750 |
No estimates of variance, no test of statistical significance, confidence intervals can not be calculated Cost data financial year 1996 for community services |
| Ruckley 1978 | 1975/76 prices Health service costs (for a 48 hour admission): treatment = £16 per patient control: £46 per patient |
No p value given, insufficient data to calculate CI |
| Shepperd 1998 | HIP REPLACEMENT Mean hospital costs: Treatment: £515.42 (473.20) Control: £776.30 (364.53) Difference: −260.88, 95% CI −441.56 to −80.19 p<0.01 Mean hospital at home costs Treatment: £351.24 (240.58) Mean total health service costs: Treatment: £911.39 (563.76) Control: £815.70 (347.99) Difference: £95.69 ratio of geometric mean 1.05, 95% CI 0.87 to 1.27, p>0.50 KNEE REPLACEMENT Mean hospital costs: Treatment: £1092.24 (615.27) Control: £1348.35 (625.94) Difference: −256.11, 95% CI −524.61 to 12.38 p>0.06 Mean hospital at home costs Treatment: £348.16 (275.25) Mean total health service costs: Treatment: £1461.62 (666.61) Control: £1375.36 (637.76) Difference: £86.26 ratio of geometric mean 1.05, 95% CI 0.88 to 1.26 p>0.55 HYSTERECTOMY Mean hospital costs: Treatment: £487.43 (350.20) Control: £647.77 (496.27) Difference: −160.34, ratio of geometric mean 0.76, 95% CI 0.67 to 0.87 p<0.01 Mean hospital at home costs Treatment: £250.18 (273.54) Mean total health service costs: Treatment: £771.78 (408.72) Control: £679.39 (439.83) Difference: £92.39 ratio of geometric mean 1.15, 95% CI 1.04 to 1.29 p<0.01 |
Cost data financial year 1994/1995. Health service perspective, dependency scores developed to account for the different resouces used during a patient’s inpatient admission. Costs calculated at the patient level |
| Length of stay | ||
| Booth 2004 | Total hospital length of stay Mean (sd) T=5.3 (2.68) C=8.0 (1.78) P<0.001 |
|
| Crotty 2002 | Hospital length of stay, mean (95% CI) treatment 7.8 days sd 9.6 (4.5 to 11.0) control: 14.3 days sd 10.8 (10.5 to 18.1) difference 6.5 days p<0.05 Total days of care: treatment: 28.3 days (23.1 to 33.6) control: 14.3 days (10.5 to 18.1) |
SD calculated from published CI |
| Richards 1998 | Hospital length of stay for patients with a surgical condition: Treatment (n=104) mean:18.48 (17.1) Control (n=54) mean: 26.59 (24.61) Difference −8.11, 95% CI −14.7 to −1.51 Length of stay post randomisation (elective surgical centre) treatment mean (n=11): 1.8 (1.7) control mean(n=24): 4.2 (3.12) difference −2.4, 95% CI −4.05 to −0.75 Length of stay post randomisation (acute hospital) Treatment mean (n=130): 3.1 (3.24) Control (n=68): 13.5 (11.75) Difference −10.4, 95% CI 8.23 to 12.6 Total length of stay for patients with a surgical condition: Treatment (n=106) mean: 28.98 (18.12) Control (n=54) mean: 26.59 (24.6), difference 2.39, 95% CI −4.39 to 9.17 Length of stay post randomisation in rehabilitative care: treatment mean (n=79): 12.2 control mean (n=158): 16.8 |
Length of stay for patients with a surgical condition - data obtained from authors Length of stay post randomisation (elective surgical centre, acute hospital, in rehabilitative care - published data |
| Shepperd 1998 | HOSPITAL LENGTH OF STAY Patients recovering from a hip replacement: Treatment: 8.11 (5.52) Control: 11.87 (4.52) Difference −3.75 95% CI −5.92 to −1.58 Patients recovering from a knee replacement: Treatment: 10.28 (4.6) Control: 13.31 (4.57) Difference −3.02 95% CI-5.01 to −1.04) Patients recovering from a hysterectomy: Treatment: 4.34 (1.86) Control: 5.79 (2.98) Difference −1.44 95% CI-2.09 to −0.79 TOTAL DAYS OF CARE Patients recovering from a hip replacement: Treatment: 14.69 (5.13) Control: 11.87 (4.52) Difference −2.84 95% CI 0.75 to 4.93 Patients recovering from a knee replacement: Treatment: 16 (5.44) Control: 13.31 (4.57) Difference 2.69 95% CI 0.5 to 4.88 Patients recovering from a hysterectomy: Treatment: 7.45 (2.59) Control: 5.79 (2.98) Difference 1.66 95% CI 0.94 to 2.39 |
Hospital length of stay - mean (sd) unless stated otherwise Total days of care - mean (sd) unless stated otherwise |
| Carer satisfaction | ||
| Adler 1978 | Difference between groups reported as significant with carer in the treatment group less satisfied | No p value given, insufficient data to calculate CI |
| Ruckley 1978 | At 1 week: Advantages seen by carers for others: treatment: 31/117 (26.5%) control:12/121 (9.9%) observed difference: 16.6% p < 0.001 95% CI 6.9% to 26% Advantages seen by carers for patients: treatment: 97/117 (83%) control: 98/121 (81%) observed difference 1.9% 95% CI −7.8% to 11.7% Advantages seen by carers for themselves: treatment: 79/117 (67.5%) control: 86/121 (71.1%) observed difference - 3.6% 95% CI −15.3% to 8.2% Disadvantages seen by carers for patients: treatment: 26/117 (22.2%) control: 14/121 (11.6%) observed difference: 10.6% p < 0.05 95% CI 1.2% to 20% Disadvantages seen by carers of themselves: treatment: 38/117 (32.5%) control: 12/121 (9.9%) observed difference: 22.6% p < 0.001 95% CI 12% to 33% Disadvantages seen by carers for others: treatment: 5/117 (4.3%) control: 6/121 (4.9%) observed difference −0.7% 95% CI −6% to 4.6% |
|
Analysis 1.21. Comparison 1 Hospital at home versus in-patient care, Outcome 21 Hospital length of stay - older people recovering from surgery
Review: Hospital at home early discharge
Comparison: 1 Hospital at home versus in-patient care
Outcome: 21 Hospital length of stay - older people recovering from surgery
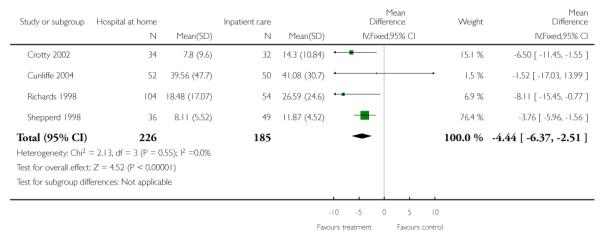
|
Analysis 1.22. Comparison 1 Hospital at home versus in-patient care, Outcome 22 Total length of stay - older people having elective surgery
Review: Hospital at home early discharge
Comparison: 1 Hospital at home versus in-patient care
Outcome: 22 Total length of stay - older people having elective surgery

|
Analysis 1.23. Comparison 1 Hospital at home versus in-patient care, Outcome 23 Readmission to hospital - surgery
Review: Hospital at home early discharge
Comparison: 1 Hospital at home versus in-patient care
Outcome: 23 Readmission to hospital - surgery
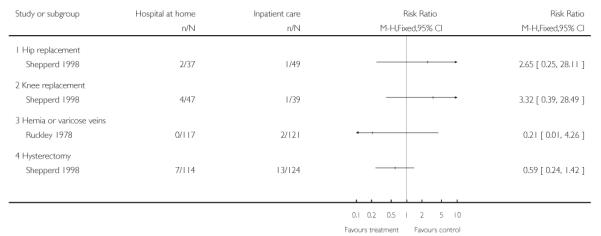
|
Analysis 2.1. Comparison 2 IPD data analysis, Outcome 1 IPD generic inverse variance early discharge elderly medical mortality at 3 months
Review: Hospital at home early discharge
Comparison: 2 IPD data analysis
Outcome: 1 IPD generic inverse variance early discharge elderly medical mortality at 3 months
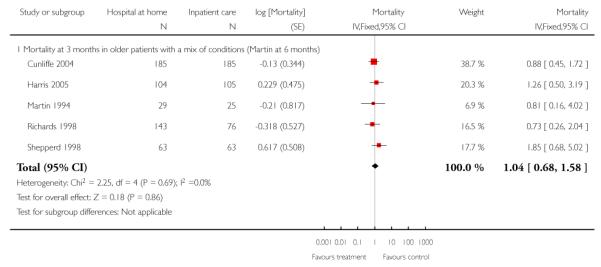
|
Analysis 2.2. Comparison 2 IPD data analysis, Outcome 2 IPD generic inverse variance early discharge readmission at 3 months
Review: Hospital at home early discharge
Comparison: 2 IPD data analysis
Outcome: 2 IPD generic inverse variance early discharge readmission at 3 months
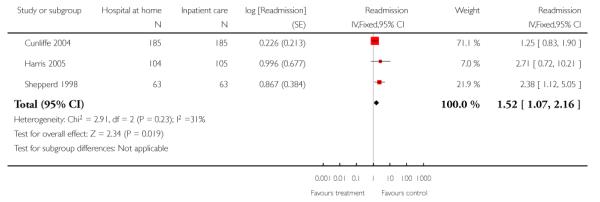
|
Analysis 2.3. Comparison 2 IPD data analysis, Outcome 3 IPD stroke mortality at 3 to 6 months - Manchester, Anderson, Cunliffe, Shepperd 3 months
Review: Hospital at home early discharge
Comparison: 2 IPD data analysis
Outcome: 3 IPD stroke mortality at 3 to 6 months - Manchester, Anderson, Cunliffe, Shepperd 3 months
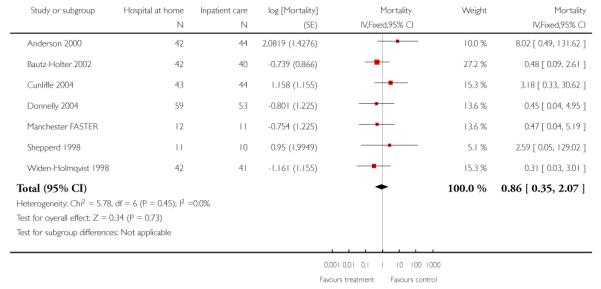
|
Analysis 2.4. Comparison 2 IPD data analysis, Outcome 4 Stroke Barthel at 3 months
Review: Hospital at home early discharge
Comparison: 2 IPD data analysis
Outcome: 4 Stroke Barthel at 3 months
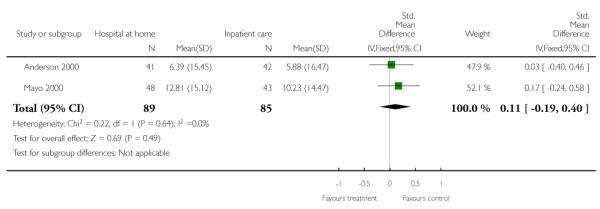
|
Analysis 2.5. Comparison 2 IPD data analysis, Outcome 5 Stroke Barthel at 6 months
Review: Hospital at home early discharge
Comparison: 2 IPD data analysis
Outcome: 5 Stroke Barthel at 6 months
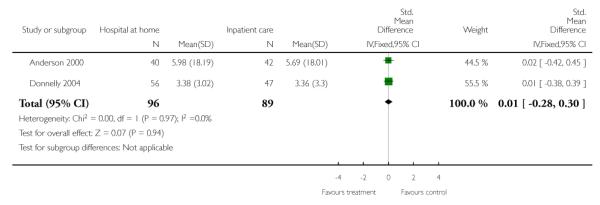
|
Analysis 2.6. Comparison 2 IPD data analysis, Outcome 6 Sensitivity analysis in favour of HAH
Review: Hospital at home early discharge
Comparison: 2 IPD data analysis
Outcome: 6 Sensitivity analysis in favour of HAH
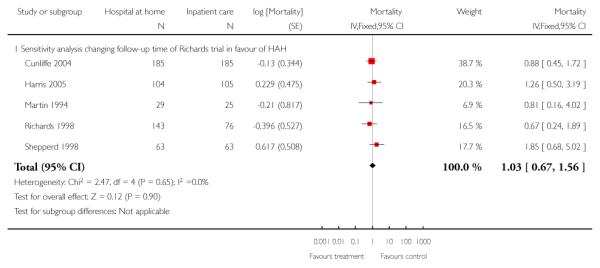
|
Analysis 2.7. Comparison 2 IPD data analysis, Outcome 7 Sensitivity analysis in favour of hospital
Review: Hospital at home early discharge
Comparison: 2 IPD data analysis
Outcome: 7 Sensitivity analysis in favour of hospital
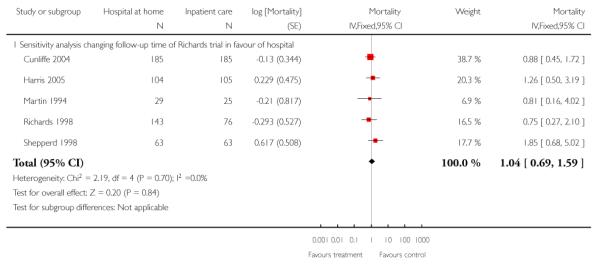
|
Analysis 2.8. Comparison 2 IPD data analysis, Outcome 8 Sensitivity analysis removing readmissions in the first 14 days
Review: Hospital at home early discharge
Comparison: 2 IPD data analysis
Outcome: 8 Sensitivity analysis removing readmissions in the first 14 days
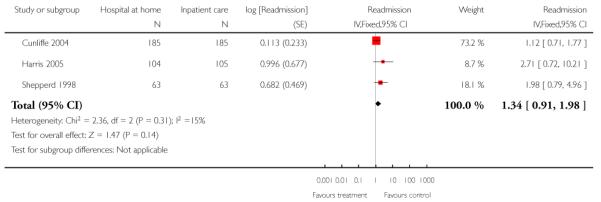
|
Analysis 2.9. Comparison 2 IPD data analysis, Outcome 9 Readmission stroke
Review: Hospital at home early discharge
Comparison: 2 IPD data analysis
Outcome: 9 Readmission stroke

|
Analysis 3.1. Comparison 3 IPD adjusted for age only, Outcome 1 IPD generic inverse variance early discharge elderly medical mortality at 3 months
Review: Hospital at home early discharge
Comparison: 3 IPD adjusted for age only
Outcome: 1 IPD generic inverse variance early discharge elderly medical mortality at 3 months
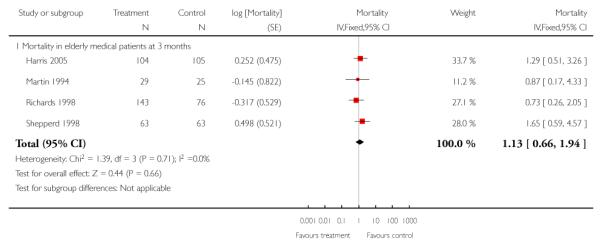
|
Analysis 3.2. Comparison 3 IPD adjusted for age only, Outcome 2 IPD mortality at 3 to 6 months (Manchester, Anderson & Shepperd at 3 months)
Review: Hospital at home early discharge
Comparison: 3 IPD adjusted for age only
Outcome: 2 IPD mortality at 3 to 6 months (Manchester, Anderson % Shepperd at 3 months)
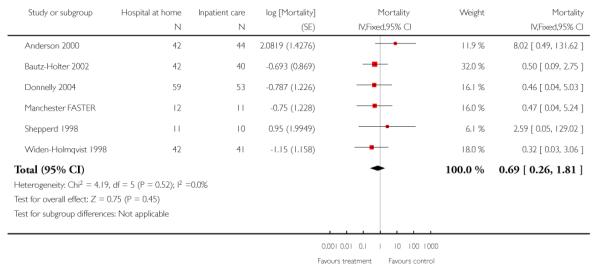
|
Analysis 3.3. Comparison 3 IPD adjusted for age only, Outcome 3 IPD generic inverse variance early discharge readmission at 3 months
Review: Hospital at home early discharge
Comparison: 3 IPD adjusted for age only
Outcome: 3 IPD generic inverse variance early discharge readmission at 3 months

|
Analysis 3.4. Comparison 3 IPD adjusted for age only, Outcome 4 Stroke Barthel at 3 months
Review: Hospital at home early discharge
Comparison: 3 IPD adjusted for age only
Outcome: 4 Stroke Barthel at 3 months
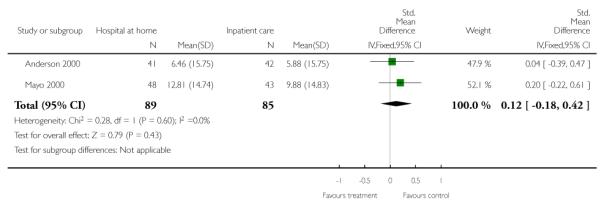
|
Analysis 3.5. Comparison 3 IPD adjusted for age only, Outcome 5 Stroke Barthel at 6 monhts
Review: Hospital at home early discharge
Comparison: 3 IPD adjusted for age only
Outcome: 5 Stroke Barthel at 6 monhts
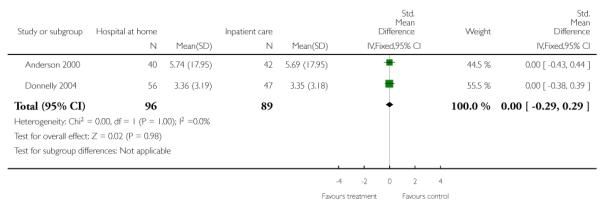
|
Analysis 3.6. Comparison 3 IPD adjusted for age only, Outcome 6 Sensitivity analysis mortality in favour of HAH
Review: Hospital at home early discharge
Comparison: 3 IPD adjusted for age only
Outcome: 6 Sensitivity analysis mortality in favour of HAH
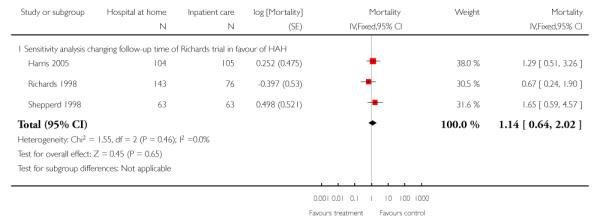
|
Analysis 3.7. Comparison 3 IPD adjusted for age only, Outcome 7 Sensitivity analysis mortality in favour of hospital
Review: Hospital at home early discharge
Comparison: 3 IPD adjusted for age only
Outcome: 7 Sensitivity analysis mortality in favour of hospital
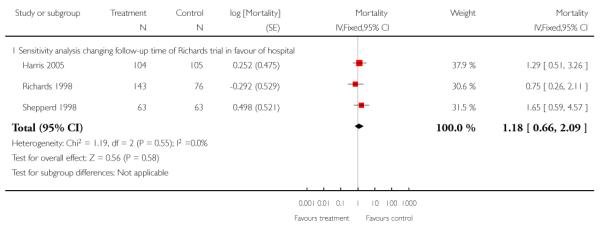
|
Analysis 4.1. Comparison 4 IPD adjusted for age and sex, Outcome 1 IPD generic inverse variance early discharge elderly medical mortality at 3 months
Review: Hospital at home early discharge
Comparison: 4 IPD adjusted for age and sex
Outcome: 1 IPD generic inverse variance early discharge elderly medical mortality at 3 months
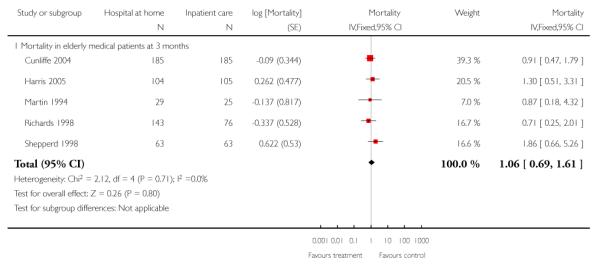
|
Analysis 4.2. Comparison 4 IPD adjusted for age and sex, Outcome 2 IPD stroke mortality at 3 to 6 months - Manchester, Anderson, Cunliffe & Shepperd 3 months
Review: Hospital at home early discharge
Comparison: 4 IPD adjusted for age and sex
Outcome: 2 IPD stroke mortality at 3 to 6 months - Manchester, Anderson, Cunliffe % Shepperd 3 months
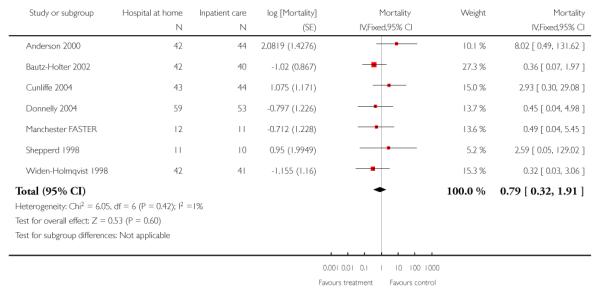
|
Analysis 4.3. Comparison 4 IPD adjusted for age and sex, Outcome 3 IPD generic inverse variance readmission elderly patients with a mix of conditions
Review: Hospital at home early discharge
Comparison: 4 IPD adjusted for age and sex
Outcome: 3 IPD generic inverse variance readmission elderly patients with a mix of conditions
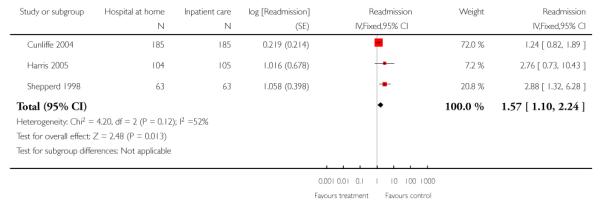
|
Analysis 4.4. Comparison 4 IPD adjusted for age and sex, Outcome 4 Stroke Barthel at 3 months
Review: Hospital at home early discharge
Comparison: 4 IPD adjusted for age and sex
Outcome: 4 Stroke Barthel at 3 months
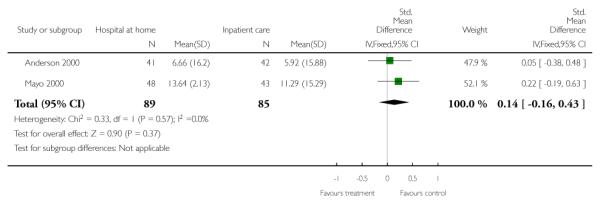
|
Analysis 4.5. Comparison 4 IPD adjusted for age and sex, Outcome 5 Stroke Barthel at 6 months
Review: Hospital at home early discharge
Comparison: 4 IPD adjusted for age and sex
Outcome: 5 Stroke Barthel at 6 months
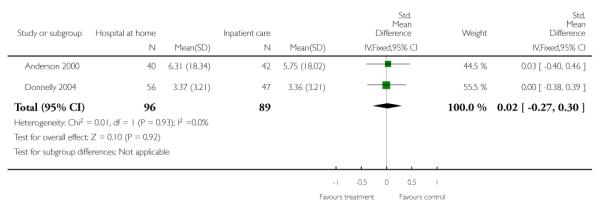
|
Analysis 4.6. Comparison 4 IPD adjusted for age and sex, Outcome 6 Sensitivity analysis mortality elderly patients with a mix of conditions in favour of HAH
Review: Hospital at home early discharge
Comparison: 4 IPD adjusted for age and sex
Outcome: 6 Sensitivity analysis mortality elderly patients with a mix of conditions in favour of HAH
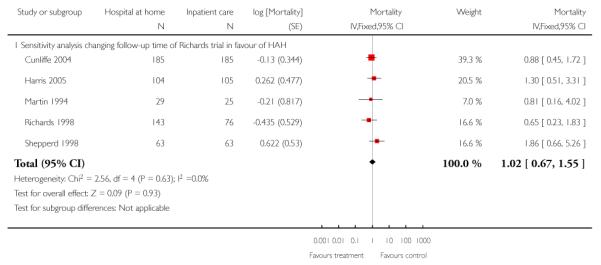
|
Analysis 4.7. Comparison 4 IPD adjusted for age and sex, Outcome 7 Sensitivity analysis mortality elderly patient with a mix of conditions in favour of hospital
Review: Hospital at home early discharge
Comparison: 4 IPD adjusted for age and sex
Outcome: 7 Sensitivity analysis mortality elderly patient with a mix of conditions in favour of hospital
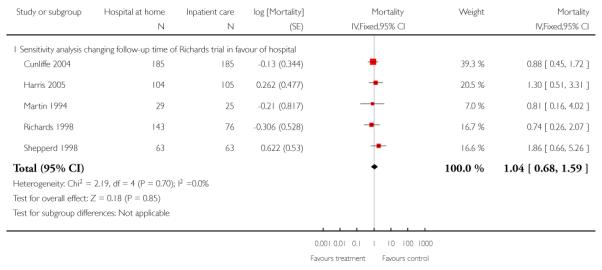
|
Analysis 4.8. Comparison 4 IPD adjusted for age and sex, Outcome 8 Sensitivity analysis changing follow-up time for Donnelly trial in favour of HAH
Review: Hospital at home early discharge
Comparison: 4 IPD adjusted for age and sex
Outcome: 8 Sensitivity analysis changing follow-up time for Donnelly trial in favour of HAH
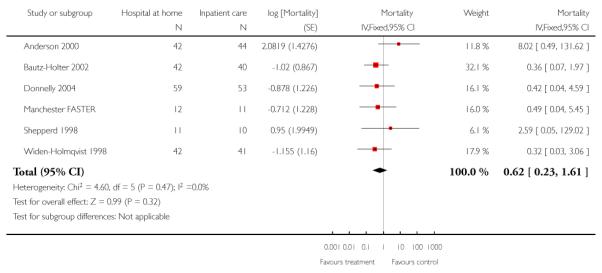
|
Analysis 4.9. Comparison 4 IPD adjusted for age and sex, Outcome 9 Sensitivity analysis changing follow-up time for Donnelly (stroke) in favour of hospital
Review: Hospital at home early discharge
Comparison: 4 IPD adjusted for age and sex
Outcome: 9 Sensitivity analysis changing follow-up time for Donnelly (stroke) in favour of hospital
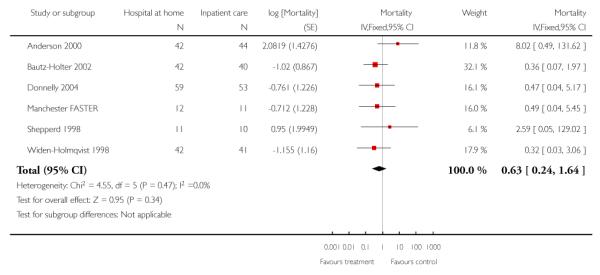
|
Analysis 4.10. Comparison 4 IPD adjusted for age and sex, Outcome 10 Sensitivity analysis removing readmissions for elderly with a mix of conditions during first 14 days adjusted for age and sex
Review: Hospital at home early discharge
Comparison: 4 IPD adjusted for age and sex
Outcome: 10 Sensitivity analysis removing readmissions for elderly with a mix of conditions during first 14 days adjusted for age and sex
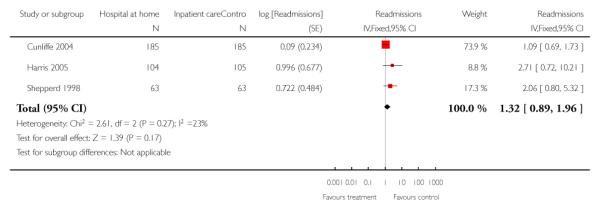
|
Analysis 4.11. Comparison 4 IPD adjusted for age and sex, Outcome 11 Readmission - recovering from a stroke
Review: Hospital at home early discharge
Comparison: 4 IPD adjusted for age and sex
Outcome: 11 Readmission - recovering from a stroke

|
Appendix 1. Search strategy
Database: Ovid MEDLINE(R) 1950 to January Week 3 2008
(hospital adj2 home).tw. (1933)
Home-based versus hospital-based.tw. (9)
Home hospitalization.tw. (89)
or/1-3
exp Home Care Services/
exp Hospitalization/
5 and 6
4 or 7
randomized controlled trial.pt.
controlled clinical trial.pt.
randomized controlled trials/
random allocation/
double blind method/
single blind method/
or/9-14
animal/
human/
16 not (16 and 17)
15 not 18
8 and 19
limit 20 to review
20 not 21
meta-analysis.pt.
22 not 23
Database: EMBASE 1980 to 2008 Week 11
(hospital adj2 home).tw.
Home-based versus hospital-based.tw.
Home hospitalization.tw.
or/1-3
exp Home Care Services/
exp Hospitalization/
5 and 6
4 or 7
clinical trial/
randomization/
randomized controlled trial/
crossover procedure/
double blind procedure/
single blind procedure/
(randomised or randomized).tw.
placebo/
(controlled adj study).tw.
or/9-17
nonhuman/
18 not 19
8 and 20
Database: CINAHL - Cumulative Index to Nursing and Allied Health Literature 1982 to February Week 5 2008
(hospital adj2 home).tw.
Home-based versus hospital-based.tw.
Home hospitalization.tw.
or/1-3
exp Home Care Services/
exp Hospitalization/
5 and 6
4 or 7
exp clinical trials/
clinical trial.pt.
(controlled adj (study or trial)).tw.
randomized controlled trial/
(randomised or randomized).tw.
(random$ adj1 (allocat$ or assign$)).tw.
or/9-14
8 and 15
Search methods for EPOC Register 21 January 2008
home-based and in-patient*
homecare and in-patient*
hospital-at-home and in-patient*
home-based and hospital*
homecare and hospital*
home-care and hospital*
home hospital* and in-patient*
WHAT’S NEW
Last assessed as up-to-date: 23 July 2008.
| Date | Event | Description |
|---|---|---|
| 6 July 2011 | Amended | Revised reference to published review |
HISTORY
Protocol first published: Issue 3, 1996
Review first published: Issue 1, 1998
| Date | Event | Description |
|---|---|---|
| 8 June 2011 | Amended | Title changed for consistency, changes to published notes |
| 17 February 2011 | Amended | Minor changes to published notes |
| 12 November 2008 | New citation required and conclusions have changed | Review has been split from original review. |
| 10 November 2008 | New search has been performed | This review is an update of Shepperd 2005 but has been split into three different reviews. |
| 28 July 2008 | Amended | Converted to new review format. |
Footnotes
NOTES This review is an update; the original review was first published in Issue 1, 1998 of The Cochrane Library (Shepperd 2005). The original review has been separated into three distinct reviews: Hospital at home admission avoidance, Hospital at home early discharge, and Hospital at home: home-based end of life care. The titles have been changed for consistency. Hospital at home admission avoidance (Shepperd 2008) and Hospital at home: home-based end of life care (Shepperd 2011) are published in The Cochrane Library.
DECLARATIONS OF INTEREST Jo Broad, John Gladman, Roger Harris, Finbarr Martin, Suzanne Richards and Sasha Shepperd were investigators on five of the included trials.
References to studies included in this review
* Indicates the major publication for the study
- Adler 1978 {published data only} .Adler MW, Waller JJ, Creese A, Thorne SC. Randomised controlled trial of early discharge for inguinal hernia and varicose veins. Journal of Epidemiology and Community Health. 1978;32:136–42. doi: 10.1136/jech.32.2.136. [DOI] [PMC free article] [PubMed] [Google Scholar]
- Anderson 2000 {published data only} .Anderson C, Mhurchu CN, Rubenach S, Clark M, Spencer C, Winsor A. Home or hospital for stroke rehabilitation? Results of a randomized controlled trial: II: cost minimization analysis at 6 months. Stroke. 2000;31:1032–7. doi: 10.1161/01.str.31.5.1032. [DOI] [PubMed] [Google Scholar]; Anderson C, Rubenach S, Mhurchu CN, Clark M, Spencer C, Winsor A. Home or hospital for stroke rehabilitation? Results of a randomized controlled trial: I: health outcomes at 6 months. Stroke. 2000;31:1024–31. doi: 10.1161/01.str.31.5.1024. [DOI] [PubMed] [Google Scholar]
- Askim 2004 {published data only} .Askim T, Rohweder G, Lydersen S, Indredavik B. Evaluation of an extended stroke unit service with early supported discharge for patients living in a rural community. A randomized controlled trial. Clinical Rehabilitation. 2004;18:238–48. doi: 10.1191/0269215504cr752oa. [DOI] [PubMed] [Google Scholar]
- Bautz-Holter 2002 {published and unpublished data} .Bautz-Holtert E, Sveen U, Rygh J, Rodgers H, Wyller TB. Early supported discharge of patients with acute stroke: a randomized controlled trial. Disability and Rehabilitation. 2002;24:348–55. doi: 10.1080/09638280110093677. [DOI] [PubMed] [Google Scholar]
- Booth 2004 {published data only} .Booth JE, Roberts JA, Flather M, Lamping DL, Mister R, Abdalla M, et al. A trial of early discharge with homecare compared to conventional hospital care for patients undergoing coronary artery bypass grafting. Heart. 2004;90:1344–5. doi: 10.1136/hrt.2003.024323. [DOI] [PMC free article] [PubMed] [Google Scholar]
- Caplan 2006 {published data only} .Caplan GA, Coconis J, Board N, Syers A, Woods J. Does home treatment affect delirium? A randomised controlled trial of rehabilitation of elderly and care at home or usual treatment (The REACH-OUT trial) Age and Ageing. 2006;35:53–60. doi: 10.1093/ageing/afi206. [DOI] [PubMed] [Google Scholar]
- Cotton 2002 {published data only} .Cotton MM, Bucknall CE, Dagg KD, Johnson MK, MacGregor G, Stewart C, et al. Early discharge for patients with exacerbations of chronic obstructive pulmonary disease: a randomised controlled trial. Thorax. 2000;55:902–6. doi: 10.1136/thorax.55.11.902. [DOI] [PMC free article] [PubMed] [Google Scholar]
- Crotty 2002 {published data only} .Crotty M, Whitehead CH, Gray S, Finucane PM. Early discharge and home rehabilitation after hip fracture achieves functional improvements: a randomised controlled trial. Clinical Rehabiliation. 2002;16:406–13. doi: 10.1191/0269215502cr518oa. [DOI] [PubMed] [Google Scholar]
- Cunliffe 2004 {published and unpublished data} .*; Cunliffe A, Gladman JRF, Husbands SL, Miller P, Dewey ME, Harwood RH. Sooner and healthier: a randomised controlled trial and interview study of an early discharge rehabilitation service for older people. Age and Ageing. 2004;33:246–52. doi: 10.1093/ageing/afh076. [DOI] [PubMed] [Google Scholar]
- Donald 1995 {published data only} .Donald IP, Baldwin RN, Bannerjee M. Gloucester hospital-at-home: a randomized controlled trial. Age and Ageing. 1995;24:434–9. doi: 10.1093/ageing/24.5.434. [DOI] [PubMed] [Google Scholar]
- Donnelly 2004 {published and unpublished data} .Donnelly M, Power M, Russell M, Fullerton K. Randomised controlled trial of an early discharge rehabilitation service: the Belfast community stroke trial. Stroke. 2004;35:127–33. doi: 10.1161/01.STR.0000106911.96026.8F. [DOI] [PubMed] [Google Scholar]
- Harris 2005 {published and unpublished data} .Harris R, Ashton T, Broad J, Connolly G, Richmond D. The effectiveness, acceptability and costs of a hospital-at-home service compared with acute hospital care: a randomized controlled trial. Journal of Health Services and Research Policy. 2005;10:158–66. doi: 10.1258/1355819054338988. [DOI] [PubMed] [Google Scholar]
- Indredavik 2000 {published data only} .Indredavik B, Bakke F, Slordahl SA, Rokseth R, Haheim LL. Treatment in a combined acute and rehabilitation stroke unit. Stroke. 2000;30:917–23. doi: 10.1161/01.str.30.5.917. [DOI] [PubMed] [Google Scholar]
- Manchester FASTER {unpublished data only} .Dey P, Woodman M. FASTER trial group. Not published.
- Martin 1994 {published and unpublished data} .Martin F, Oyewole A, Moloney A. A randomized controlled trial of a high support hospital discharge team for elderly people. Age and Ageing. 1994;23:228–34. doi: 10.1093/ageing/23.3.228. [DOI] [PubMed] [Google Scholar]
- Mayo 2000 {published and unpublished data} .Mayo NE, Wood-Dauphinee S, Cote R, Gayton D, Carlton J, Buttery J, et al. There’s no place like home: an evaluation of early supported discharge for stroke. Stroke. 2000;31:1016–23. doi: 10.1161/01.str.31.5.1016. [DOI] [PubMed] [Google Scholar]; Teng J, Mayo NE, Latimer E, Hanley J, Wood-Dauphinee S, Cote R, et al. Costs and caregiver consequences of early supported discharge for stroke patients. Stroke. 2003;34:528–36. doi: 10.1161/01.str.0000049767.14156.2c. [DOI] [PubMed] [Google Scholar]
- Ojoo 2002 {published data only} .Ojoo JC, Moon T, McGlone S, Martin K, Gardiner ED, Greenstone MA, et al. Patients’ and carers’ preferences in two models of care for acute exacerbations of COPD: results of a randomised controlled trial. Thorax. 2002;57:167–9. doi: 10.1136/thorax.57.2.167. [DOI] [PMC free article] [PubMed] [Google Scholar]
- Palmer Hill 2000 {published data only} .Palmer Hill S, Flynn J, Crawford EJP. Early discharge following total knee replacement - a trial of patient satisfaction and outcomes using an orthopaedic outreach team. Journal of Orthopaedic Nursing. 2000;4:121–6. [Google Scholar]
- Richards 1998 {published and unpublished data} .*; Coast J, Richards SH, Peters TJ, Gunnell DJ, Darlow MA, Pounsford J. Hospital at home or acute hospital care? A cost minimisation analysis. BMJ. 1998;316:1802–6. doi: 10.1136/bmj.316.7147.1802. [DOI] [PMC free article] [PubMed] [Google Scholar]; Gunnell D, Coast J, Richards S, Peters T, Pounsford J, Darlow M. How great a burden does early discharge to hospital-at-home impose on carers? A randomized controlled trial. Age and Ageing. 2000;29:137–42. doi: 10.1093/ageing/29.2.137. [DOI] [PubMed] [Google Scholar]; Richards SH, Coast J, Gunnell DJ, Peters TJ, Pounsford J, Darlow MA. Randomised controlled trial comparing effectiveness and acceptability of an early discharge, hospital at home scheme with acute hospital care. BMJ. 1998;316:1796–801. doi: 10.1136/bmj.316.7147.1796. [DOI] [PMC free article] [PubMed] [Google Scholar]
- Rodgers 1997 {published and unpublished data} .McNamee P, Christensen J, Soutter J, Rodgers H, Craig N, Pearson P. Cost analysis of early supported hospital discharge for stroke. Age and Ageing. 1998;27:345–51. [Google Scholar]; *; Rodgers H, Soutter J, Kaiser W, Pearson P, Dobson R, Skilbeck C, et al. Early supported hospital discharge following acute stroke: pilot study results. Clinical Rehabilitation. 1997;11:280–7. doi: 10.1177/026921559701100403. [DOI] [PubMed] [Google Scholar]
- Ruckley 1978 {published data only} .Ruckley CV, Cuthbertson C, Fenwick N, Prescott RJ, Garraway WM. Day care after operations for hernia or varicose veins: a controlled trial. The British Journal of Surgery. 1978;65:456–9. doi: 10.1002/bjs.1800650704. [DOI] [PubMed] [Google Scholar]
- Rudd 1997 {published and unpublished data} .Beech R, Rudd A, Tilling K, Wolfe C. Economic consequences of early inpatient discharge to community based rehabilitation for stroke in an inner London teaching hospital. Stroke. 1999;30:729–35. doi: 10.1161/01.str.30.4.729. [DOI] [PubMed] [Google Scholar]; *; Rudd AG, Wolfe CD, Tilling K, Beech R. Randomised controlled trial to evaluate early discharge scheme for patients with stroke. BMJ. 1997;315:1039–44. doi: 10.1136/bmj.315.7115.1039. [DOI] [PMC free article] [PubMed] [Google Scholar]
- Shepperd 1998 {published and unpublished data} .Shepperd S, Harwood D, Gray A, Vessey M, Morgan P. Randomised controlled trial comparing hospital at home care with inpatient hospital care. II: cost minimisation analysis. BMJ. 1998;316:1791–6. doi: 10.1136/bmj.316.7147.1791. [DOI] [PMC free article] [PubMed] [Google Scholar]; *; Shepperd S, Harwood D, Jenkinson C, Gray A, Vessey M, Morgan P. Randomised controlled trial comparing hospital at home care with inpatient hospital care. I: three month follow up of health outcomes. BMJ. 1998;316:1786–91. doi: 10.1136/bmj.316.7147.1786. [DOI] [PMC free article] [PubMed] [Google Scholar]
- Skwarska 2000 {published data only} .Skwarska E, Cohen G, Skwarski KM, Lamb C, Bushell D, Parker S, et al. Randomised controlled trial of supported discharge in patients with exacerbations of chronic obstructive pulmonary disease. Thorax. 2000;55:907–12. doi: 10.1136/thorax.55.11.907. [DOI] [PMC free article] [PubMed] [Google Scholar]
- Suwenwela 2001 {published data only} .Suwanwela NC, Phanthumchinda K, Limtongkul S, Suvanprakorn P. Thai Red Cross Volunteers Bureau. Comparison of short (3-day) hospitalization followed by home care treatment and conventional (10-day) hospitalization for acute ischemic stroke. Cerebrovascular Disease. 2002;13(4):267–71. doi: 10.1159/000057854. [DOI] [PubMed] [Google Scholar]
- Widen-Holmqvist 1998 {published and unpublished data} .von Koch L, Widen Holmqvist L, Kostulas V, Almazan J, de Pedro-Cuesta J. A randomized controlled trial of rehabilitation at home after stroke in southwest Stockholm: outcome at 6 months. Scandinavian Journal of Rehabilitation Medicine. 2000;32:80–6. doi: 10.1080/003655000750045596. [DOI] [PubMed] [Google Scholar]; *; Widén Holmqvist L, von Koch L, Kostulas V, Holm M, Widsell G, Tegler H, et al. A randomized controlled trial of rehabilitation at home after stroke in southwest Stockholm. Stroke. 1998;29:591–7. doi: 10.1161/01.str.29.3.591. [DOI] [PubMed] [Google Scholar]
References to studies excluded from this review
- Bonnema 1998 {published data only} .Bonnema J, van Wersch A, van Geel A, Pruyn J, Schmitz PIM, Uyl-de-Groot CA, et al. Cost of care in a randomised trial of early hospital discharge after surgery for breast cancer. European Journal of Cancer. 1998;34:2015–20. doi: 10.1016/s0959-8049(98)00258-5. [DOI] [PubMed] [Google Scholar]
- Brooten 1994 {published data only} .Brooten D, Roncoli M, Finkler S, Arnold L, Cohen A, Mennuti M. A randomized trial of early hospital discharge and home follow-up of women having cesarean birth. Obstetrics and Gynecology. 1994;84:832–8. [PMC free article] [PubMed] [Google Scholar]
- Bundred 1998 {published data only} .Bundred N, Maguire P, Reynolds J, Grimshaw J, Morris J, Thomson L, et al. Randomised controlled trial of effects of early discharge after surgery for breast cancer. BMJ. 1998;317:1275–9. doi: 10.1136/bmj.317.7168.1275. [DOI] [PMC free article] [PubMed] [Google Scholar]
- Cummings 1991 {published data only} .*; Cummings JE, Weaver FM. Cost-effectiveness of home care. Clinics in Geriatric Medicine. 1991;7:865–74. [PubMed] [Google Scholar]
- Farnworth 1994 {published data only} .Farnworth MG, Kenny P, Shiell A. The costs and effects of early discharge in the management of fractured hip. Age and Ageing. 1994;23:190–4. doi: 10.1093/ageing/23.3.190. [DOI] [PubMed] [Google Scholar]
- Gerson 1976 {published data only} .Gerson LW, Berry AF. Psycho-social effects of home care: results of a randomized controlled trial. International Journal of Epidemiology. 1976;5:159–65. doi: 10.1093/ije/5.2.159. [DOI] [PubMed] [Google Scholar]
- Hansen 1992 {published data only} .Hansen FR, Spedtsberg K, Schroll M. Geriatric follow-up by home visits after discharge from hospital: a randomized controlled trial. Age and Ageing. 1992;21:445–50. doi: 10.1093/ageing/21.6.445. [DOI] [PubMed] [Google Scholar]
- Hedrick 1986 {published data only} .Hedrick SC, Inui TS. The effectiveness and cost of home care: an information synthesis. Health Services Research. 1986;20:851–80. [PMC free article] [PubMed] [Google Scholar]
- Hernandez 2003 {published data only} .Hernandez C, Casas A, Escarrabill J, Alonso J, Puig-Junoy J, Farrero E, et al. partners in the CHRONIC project Home hospitalisation of exacerbated chronic obstructive pulmonary disease patients. European Respiratory Journal. 2003;21:58–67. doi: 10.1183/09031936.03.00015603. [DOI] [PubMed] [Google Scholar]
- Hill 1978 {published data only} .Hill JD, Hampton JR, Mitchell JR. A randomised trial of home-versus-hospital management for patients with suspected myocardial infarction. Lancet. 1978;1:837–41. doi: 10.1016/s0140-6736(78)90190-3. [DOI] [PubMed] [Google Scholar]
- Klettke 1999 {published data only} .Klettke U, Magdorf K, Staab D, Bission S, Paul K, Wahn U. Ambulatory vs. inpatient intravenous antibiotic therapy in mucoviscidosis patients - a controlled study [Mabulante vs stationare intravenose antibiotische Therapie bei Mukoviszidosepatienten – Einekontrollierte Studie] Pneumologie. 1999;53:31–6. [PubMed] [Google Scholar]
- Koopman 1996 {published data only} .Koopman MM, Prandoni P, Piovella F, Ockelford PA, Brandjes DP, van der Meer J, et al. Treatment of venous thrombosis with intravenous unfractionated heparin administered in the hospital as compared with subcutaneous low-molecular-weight heparin administered at home. The Tasman Study Group. New England Journal of Medicine. 1996;334:682–7. doi: 10.1056/NEJM199603143341102. [DOI] [PubMed] [Google Scholar]
- Levine 1996 {published data only} .Levine M, Gent M, Hirsh J, Leclerc J, Anderson D, Weitz J, et al. A comparison of low-molecular-weight heparin administered primarily at home with unfractionated heparin administered in the hospital for proximal deep-vein thrombosis. New England Journal of Medicine. 1996;334:677–81. doi: 10.1056/NEJM199603143341101. [DOI] [PubMed] [Google Scholar]
- Magid 1989 {published data only} .Magid DM, Vokes EE, Schilsky RL, Guarnieri CM, Whaling SM, Weichselbaum RR, et al. A randomized study of inpatient versus outpatient continuous intravenous infusion chemotherapy: psychosocial aspects. Selective Cancer Therapeutics. 1989;5:137–45. doi: 10.1089/sct.1989.5.137. [DOI] [PubMed] [Google Scholar]
- Mather 1976 {published data only} .Mather HG, Morgan DC, Pearson NG, Read KL, Shaw DB, Steed GR, et al. Myocardial infarction: a comparison between home and hospital care for patients. BMJ. 1976;1:925–9. doi: 10.1136/bmj.1.6015.925. [DOI] [PMC free article] [PubMed] [Google Scholar]
- Melin 1992 {published data only} .Melin AL, Bygren LO. Efficacy of the rehabilitation of elderly primary health care patients after short-stay hospital treatment. Medical Care. 1992;30:1004–15. doi: 10.1097/00005650-199211000-00004. [DOI] [PubMed] [Google Scholar]
- Melin 1993 {published data only} .Melin AL, Hakansson S, Bygren LO. The cost-effectiveness of rehabilitation in the home: a study of Swedish elderly. American Journal of Public Health. 1993;83:356–62. doi: 10.2105/ajph.83.3.356. [DOI] [PMC free article] [PubMed] [Google Scholar]
- Romano 1991 {published data only} .Romano L, Minicucci L, Spallone E, Girosi D, Campelli A, Fabbri A, et al. [Role of home therapy with ofloxacin in patients with cystic fibrosis (CF)] Giornale Italiano di Chemioterapia. 1991;38:181–3. [PubMed] [Google Scholar]
- Ronning 1998 {published data only} .Ronning OM, Guldvog B. Outcome of subacute stroke rehabilitation: a randomised controlled trial. Stroke. 1998;29:779–84. doi: 10.1161/01.str.29.4.779. [DOI] [PubMed] [Google Scholar]
- Stone 1968 {published data only} .Stone JR, Patterson E, Felson L. The effectiveness of home care for general hospital patients. JAMA. 1968;205:145–8. [PubMed] [Google Scholar]
- Wade 1985 {published data only} .Wade DT, Langton-Hewer R, Skilbeck CE, Bainton D, Burns-Cox C. Controlled trial of a home-care service for acute stroke patients. Lancet. 1985;1:323–6. doi: 10.1016/s0140-6736(85)91091-8. [DOI] [PubMed] [Google Scholar]
- Williams 1981 {published data only} .Williams PL, Crawley JC, Freeman AM, Lloyd DC, Gumpel JM. Feasibility of outpatient management after intra-articular yttrium-90: comparison of two regimens. BMJ (Clinical Research Edition) 1981;282:13–4. doi: 10.1136/bmj.282.6257.13. [DOI] [PMC free article] [PubMed] [Google Scholar]
- Wolter 2004 {published data only} .Wolter JM, Cagney RA, McCormack JG. A randomized trial of home vs hospital intravenous antibiotic therapy in adults with infectious diseases. Journal of Infection. 2004;48:263–8. doi: 10.1016/S0163-4453(03)00135-X. [DOI] [PubMed] [Google Scholar]
- Zimmer 1984 {published data only} .Zimmer JG, Groth-Juncker A, McCusker J. Effects of a physician-led home care team on terminal care. Journal of the American Geriatrics Society. 1984;32:288–92. doi: 10.1111/j.1532-5415.1984.tb02023.x. [DOI] [PubMed] [Google Scholar]
- Zimmer 1985 {published data only} .Zimmer JG, Groth-Juncker A, McCusker J. A randomized controlled study of a home health care team. American Journal of Public Health. 1985;75:134–41. doi: 10.2105/ajph.75.2.134. [DOI] [PMC free article] [PubMed] [Google Scholar]
Additional references
- Bosna 1993 .Bosna E. KITTZ: innovation in home care. Capital Conference; King’s Fund Centre; 1993. [Google Scholar]
- Clarke 1984 .Clarke F. Hospital at home: the alternative to general hospital admission. Macmillan Publishers Ltd; London, Basingstoke: 1984. [Google Scholar]
- Cochran 1954 .Cochran WG. The combination of estimates from different experiments. Biometrics. 1954;10:101–29. [Google Scholar]
- Crotty 2000 .Crotty M, Kittel A, Hayball N. Home rehabilitation for older adults with fractured hips: how many will take part? Journal of Quality in Clinical Practice. 2000;20:65–8. doi: 10.1046/j.1440-1762.2000.00367.x. [DOI] [PubMed] [Google Scholar]
- Deeks 1998 .Deeks J, Bradburn M, Bilker W, Localio R, Berlin J. Much ado about nothing: meta-analysis for rare events. 6th Cochrane Colloquium; Baltimore: 1998. [Google Scholar]
- EPOC 2008 .Bero L, Deane K, Eccles M, Grimshaw J, Gruen RL, Mayhew A, et al. Cochrane Effective Practice and Organisation of Care Group. The Cochrane Library. issue 4. Wiley-Blackwell; Chichester: 2008. Updated quarterly. [Google Scholar]
- Gunnell 2000 .Gunnell D, Coast J, Richards SH, Peters TJ, Pounsford JC, Darlow MA. How great a burden does early discharge to hospital-at-home impose on carers? A randomized controlled trial. Age and Ageing. 2000;29(2):137–42. doi: 10.1093/ageing/29.2.137. [DOI] [PubMed] [Google Scholar]
- Higgins 2003 .Higgins JPT, Thompson SG, Deeks JJ, Altman DG. Measuring inconsistency in meta-analysis. BMJ. 2003;327:557–60. doi: 10.1136/bmj.327.7414.557. [DOI] [PMC free article] [PubMed] [Google Scholar]
- Hollingworth 1993 .Hollingworth W, Todd C, Parker M, Roberts JA, Williams R. Cost analysis of early discharge after hip fracture. BMJ. 1993;307:903–6. doi: 10.1136/bmj.307.6909.903. [DOI] [PMC free article] [PubMed] [Google Scholar]
- Holmqvist 2000 .Holmqvist LW, von Koch L, Pdero-Cuesta J. Use of healthcare, impact on family caregivers and patient statisfaction of rehabilitation at home after stroke in South West Stockholm. Scandinavian Journal of Rehabilitation Medicine. 2000;32:173–9. doi: 10.1080/003655000750060922. [DOI] [PubMed] [Google Scholar]
- Hughes 2000 .Hughes SL, Weaver FM, Giobbe-Hurder A, Manheim L, Henderson W, Kubal JD, et al. Effectiveness of team managed home based primary care: a randomized multicenter trial. JAMA. 2000;284:2877–85. doi: 10.1001/jama.284.22.2877. [DOI] [PubMed] [Google Scholar]
- Leff 2005 .Leff B, Burton L, Mader SL, Naughton B, Burl J, Inouye SK, et al. Hospital at home: feasibility and outcomes of a program to provide hospital level care at home for acutely ill older people. Annals of Internal Medicine. 2005;143:798–808. doi: 10.7326/0003-4819-143-11-200512060-00008. [DOI] [PubMed] [Google Scholar]
- Lilford 1998 .Lilford RJ, Shaw H. Hospital at home. Costings were inadequate. BMJ. 1998;317:1651–2. [PubMed] [Google Scholar]
- Matthews 2007 .Matthews PC, Conlon CP, Berendt AR, Kayley J, Jeffries L, Atkins BL. Outpatient parenteral antimicrobial therapy (OPAT): is it safe for selected patients to self administer at home? A retrospective analysis of a large cohort over 13 years. Journal of Antimicrobial Chemotherapy. 2007;60:356–62. doi: 10.1093/jac/dkm210. [DOI] [PubMed] [Google Scholar]
- Miller 2005 .Miller P, Gladman JRF, Cunliffe AL, Husbands SL, Dewey ME, Harwood RH. Economic analysis of an early discharge rehabilitation service for older people. Age and Ageing. 2005;34:274–80. doi: 10.1093/ageing/afi058. [DOI] [PubMed] [Google Scholar]
- Montalto 1998 .Montalto M. How safe is hospital in the home care? Medical Journal of Australia. 1998;168:277–80. doi: 10.5694/j.1326-5377.1998.tb140161.x. [DOI] [PubMed] [Google Scholar]
- Morris 1983 .Morris DE. Sante Service Bayonne: a French approach to home care. Age and Ageing. 1983;12:323–8. doi: 10.1093/ageing/12.4.323. [DOI] [PubMed] [Google Scholar]
- O’Cathain 1994 .O’Cathain A. Evaluation of a hospital at home scheme for the early discharge of patients with fractured neck of femur. Journal of Public Health Medicine. 1994;16:205–10. doi: 10.1093/oxfordjournals.pubmed.a042958. [DOI] [PubMed] [Google Scholar]
- Parker 2002 .Parker G, Bhakta P, Lovett CA, Paisley S, Olsen R, Turner D, et al. A systematic review of the costs and effectiveness of different models of paediatric home care. Health Technology Assessment. 2002;6:iii–108. doi: 10.3310/hta6350. [DOI] [PubMed] [Google Scholar]
- Pryor 1989 .Pryor GA, Williams DR. Rehabilitation after hip fractures. Home and hospital management compared. The Journal of Bone and Joint Surgery. British Volume. 1989;71:471–4. doi: 10.1302/0301-620X.71B3.2722942. [DOI] [PubMed] [Google Scholar]
- Shepperd 2005 .Shepperd S, Iliffe S. Hospital at home versus in-patient hospital care. Cochrane Database of Systematic Reviews. 2005;(Issue 3) doi: 10.1002/14651858.CD000356.pub2. [DOI: 10.1002/14651858.CD000356.pub2] [DOI] [PubMed] [Google Scholar]
- Shepperd 2007 .Shepperd S, Doll H, Gowers S, James T, Fazel M, Pollock A, Fitzpatrick Alternatives to inpatient mental health care for children and young people. Cochrane Database of Systematic Reviews. 2007;(Issue 1) doi: 10.1002/14651858.CD006410.pub2. [DOI: 10.1002/14651858.CD006410] [DOI] [PMC free article] [PubMed] [Google Scholar]
- Shepperd 2008 .Shepperd S, Doll H, Angus R, Clarke M, Iliffe S, Kalra L, Ricauda NA, Wilson A. Admission avoidance hospital at home. Cochrane Database of Systematic Reviews. 2008;(Issue 4) doi: 10.1002/14651858.CD007491. [DOI: 10.1002/14651858.CD007491] [DOI] [PMC free article] [PubMed] [Google Scholar]
- Shepperd 2011 .Shepperd S, Wee B, Straus SE. Hospital at home: home-based end of life care. Cochrane Database of Systematic Reviews. 2011;(Issue 7) doi: 10.1002/14651858.CD009231. [DOI: 10.1002/14651858.CD009231] [DOI] [PMC free article] [PubMed] [Google Scholar]
- SPSS 2006 .SPSS Inc . SPSS statistical software. SPSS Inc; 2006. [Google Scholar]
- STATA 2004 .College Station, TX: StataCorp LP . Stata Statistical Software. StataCorp LP; College Station, TX: 2004. [Google Scholar]


