


Abstract
Unlike other members of the methyl-cytosine binding domain (MBD) family, MBD4 serves as a potent DNA glycosylase in DNA mismatch repair specifically targeting mCpG/TpG mismatches arising from spontaneous deamination of methyl-cytosine. The protein contains an N-terminal MBD (MBD4MBD) and a C-terminal glycosylase domain (MBD4GD) separated by a long linker. This arrangement suggests that the MBD4MBD either directly augments enzymatic catalysis by the MBD4GD or targets the protein to regions enriched for mCpG/TpG mismatches. Here we present structural and dynamic studies of MBD4MBD bound to dsDNA. We show that MBD4MBD binds with a modest preference formCpG as compared to mismatch, unmethylated and hydroxymethylated DNA. We find that while MBD4MBD exhibits slow exchange between molecules of DNA (intermolecular exchange), the domain exhibits fast exchange between two sites in the same molecule of dsDNA (intramolecular exchange). Introducing a single-strand defect between binding sites does not greatly reduce the intramolecular exchange rate, consistent with a local hopping mechanism for moving along the DNA. These results support a model in which the MBD4MBD4 targets the intact protein to mCpG islands and promotes scanning by rapidly exchanging between successive mCpG sites which facilitates repair of nearby mCpG/TpG mismatches by the glycosylase domain.
INTRODUCTION
DNA methylation involves enzymatic addition of a methyl group at the C5 position of the symmetrically opposed cytosine bases in a double stranded cytosine-guanosine sequence (CpG) and serves as a key epigenetic signal in developmental and tissue type specific regulatory mechanisms such as gene silencing, chromatin modifications and aberrant silencing of tumor suppressor genes in cancer (1). Central to these regulatory functions is a family of proteins that selectively bind symmetrically methylated CG dinucleotide sequences (mCpG) through a common methyl-cytosine binding domain (MBD). The MBD was first described as a ∼70 amino acid region in the MeCP2 protein (2) and subsequently identified by homology in four additional proteins, MBD1–4 (3). MBD4 represents a unique member of the MBD family in that it contains intrinsic enzymatic activity provided by a C-terminal glycosylase domain (MBD4GD) in addition to an N-terminal MBD (MBD4MBD). The MBD4GD can remove thymine or hydroxymethyluracil in mCpG/TpG and mCpG/hmUpG double-stranded mismatches (3–7). The mCpG/TpG (or mCpG/hmUpG) mismatch arises from hydrolytic deamination of a methyl-cytosine (or hydroxymethylcytosine) to thymine (or hydroxmethyluracil) and represents one of the more common sources of germ line and somatic DNA point mutations.
The MBD4MBD binds in the major groove of DNA while the MBD4GD binds the minor groove (8) and the two are separated by a long spacer region (∼280 amino acids). Since the two domains bind opposite faces of the DNA, the MBD4MBD could selectively recognize a mCpG/TpG mismatch and augment the enzymatic activity of the MBD4GD at the same site - either by providing mismatch selectivity, overall binding affinity or stabilizing the transition state. Alternatively the MBD4MBD could target the protein to regions enriched for mCpG sites and allow the MBD4GD to repair mismatches at nearby sites (4). Several pieces of experimental evidence favor the latter model. The MBD4GD markedly distorts the DNA backbone which likely inhibits simultaneous binding with the MBD4MBD (4,8). The isolated MBD4GD maintains enzymatic activity in isolation while addition of free MBD4MBD inhibits activity towards a single mCpG/TpG mismatch site (9). MBD4GD orthologs in invertebrates frequently lack an associated MBD (Supplementary Table S1), again supporting the observation that the MBD4GD does not require a MBD for function.
In the studies presented here, we determine the solution structure of human MBD4MBD and show that it has a similar overall architecture as exhibited by other MBD domains. We show that MBD4MBD can bind methylated as well as unmethylated, hydroxymethylated and mismatched (mCpG/TpG) DNA with only modest preference for mCpG (∼5-fold). Hence MBD4MBD does not show a strong preference for methylated DNA, which can be attributed to the reorientation of a critical tyrosine residue. Based on these observations, we hypothesized that dynamic intramolecular exchange by MBD4MBD could contribute to function by allowing MBD4 to scan along CpG rich regions of chromatin. To test this hypothesis, we measured chemical exchange rates to compare intermolecular and intramolecular exchange of MBD4MBD between two DNA binding sites. These studies show that intermolecular exchange of MBD4MBD occurs in the nuclear magnetic resonance (NMR) slow exchange time regime while intramolecular exchange occurs in the NMR fast exchange time regime and demonstrate that MBD4MBD preferentially exchanges along the DNA between sequentially binding sites. They represent the first example reported to date that demonstrates rapid intramolecular exchange for the MBD family of proteins. Together the data support a model in which the MBD4MBD contributes to function by recruiting the protein to mCpG rich regions and rapidly scanning among the mCpG sites.
MATERIAL AND METHODS
Protein expression and purification
The MBD4MBD (amino acids 80–148) was cloned and expressed with a hexahistidine tag and a thioredoxin fusion in a modified pET32a vector (10). The expression vector was transformed into the BL21(DE3) Escherichia coli strain, grown at 37°C and induced with 1 mM isopropyl-β-d-thiogalactopyranoside at an A600 ∼0.8. Induced bacteria were harvested and lysed with the B-PER reagent (Thermo Scientific). The soluble fraction was passed over a nickel-sepharose column and protein was eluted with a step gradient of imidazole. The cMBD2MBD was expressed and purified as described previously. (11) For NMR analyses, uniform double (13C, 15N) and triple (13C, 15N, 2H) labeled protein samples were generated by standard techniques and the thioredoxin and hexahistidine fusion tags were removed by thrombin cleavage overnight at room temperature. The labeled protein was further purified by gel filtration over a Superdex-75 column (GE Healthcare) followed by reverse phase chromatography over a SOURCE-15RPC column (GE Healthcare). For SPR analysis, the fusion protein was purified over a nickel-sepharose column followed by ion exchange chromatography over a MonoS 10/100 GL (GE Healthcare) and size exclusion chromatography. The Y109F mutation was introduced using the QuickChange® site-directed mutagenesis kit (Agilent) following the manufacturer's protocol. The final proteins for all experiments were > 95% pure as estimated by SDS-PAGE analysis.
DNA purification
Complimentary DNA oligonucleotides were purchased from integrated DNA technologies. Forward and reverse oligonucleotides were dissolved in standard buffer (20 mM Tris pH 8.0), mixed in equimolar concentrations, incubated at >90ºC for 10 min and cooled slowly to anneal. Subsequently, dsDNA was purified by ion exchange chromatography on MonoQ 10/100 column (GE Healthcare). 3′ biotinylated forward oligonucleotides (purchased from integrated DNA technologies) were mixed with regular unlabeled complimentary reverse oligonucleotides, annealed and further purified using MonoQ 10/100 column for surface plasmon resonance binding studies.
Surface plasmon resonance
Protein and DNA samples were prepared in standard buffer (10 mM HEPES pH 6.5, 50 mM NaCl, 3 mM MgCl2, 0.1 mM EDTA, 1 mM DTT). Binding affinities of MBD domain with 3′ biotinylated DNA variants were determined using a NLC sensor chip on ProteOnTM XPR36 (Bio-Rad). Biotinylated dsDNAs were immobilized to the ligand channels of NLC chip using biotin-streptavidin chemistry until the final response units were in the range of ∼100 RU, control channels were blocked without linking DNA. Various concentrations of MBD4MBD were passed over the analyte channels (at a flow rate of 30 μl/min) in running buffer (10 mM HEPES pH 7.4, 50 mM NaCl, 3 mM MgCl2, 0.1 mM EDTA, 1 mM DTT, 0.1%BSA, 0.005% polysorbate 20). Data analysis, plotting and curve fitting were performed with pro Fit software (QuantumSoft).
NMR spectroscopy
Purified protein was combined with 10% excess purified dsDNA and buffer exchanged into 10 mM NaPO4 pH 6.5, 1 mM dithiothreitol, 10% 2H2O and 0.02% sodium azide and concentrated to 0.2–1 mM. NMR spectra from standard experiments for resonance assignments, distance and torsional angle restraints were collected on a Bruker Avance III 700 MHz instrument at 25ºC. Data were processed using NMRPipe (12) and analyzed with CcpNmr (13). Residual dipolar couplings were measured for complexes containing 2H,13C,15N labeled protein using standard IPAP experiments and samples aligned by adding ∼12 mg/ml pf1 bacteriophage (Asla Biotech, Ltd.) (14,15).
Structure calculations
The solution structure was determined for MBD4MBD bound to a dsDNA fragment with a central symmetrically methylated mCpG dinucleotide. Initially, a complete NMR dataset was collected for MBD4MBD bound to a 17 bp fragment derived from the p16INK4a promoter as described previously (16). These data revealed significant line-broadening for residues at the protein–DNA interface which suggested dynamic exchange between binding modes. To limit intramolecular exchange, a second dataset was collected for MBD4MBD bound to a 10 bp fragment of dsDNA (GGATmCGGCTC) identical to that in the solution structure of cMBD2 (11). This dataset showed a significant reduction of line-broadening and was used for all subsequent structure calculations and analyses. The structure was calculated by standard simulated annealing techniques using the Xplor-NIH software package (17) and minimized against a target function that included Nuclear Overhauser Effect (NOE)-derived interproton distances, torsion angles and residual dipolar couplings restraints; a quartic van der Waals repulsion term for the non-bonded contacts (18); a torsion angle data base potential of mean force (19) and a radius of gyration restraint to ensure optimal packing (20). Backbone torsion angle restraints were derived from chemical shift indexing as implemented by TALOS-N software (21,22). 3JN-C and 3JCO-C coupling constants were measured to determine a limited number of sidechain torsion angle restraints. Hydrogen bond distance and angle restraints were incorporated for regions of secondary structure as predicted by TALOS-N and confirmed by characteristic NOE crosspeak patterns. Based on chemical shift changes observed for Arg97 15Nϵ (as described previously (11,16)), hydrogen bond distance and angle restraints between Arg97 Hϵ/HH21 and Asp107 Oδ1/Oδ2, respectively, were incorporated in structure calculations.
The DNA assignments and NOE restraints were derived from double filtered (13C,15N) homonuclear NOE experiments and by comparison with previous spectra and assignments for cMBD2 bound to the same DNA (11). Assignments of the key 5-methyl-cytosine H5 protons were confirmed by the presence of strong NOEs between Thy204 H6 and both Thy204 H5 and mCyt205 H5. In addition to the NOE restraints, hydrogen bond distance and planarity restraints as well as B-form DNA backbone torsion angle restraints were incorporated into structure calculations. Intermolecular protein–DNA NOEs were derived from an isotope-filtered 3D 13C HMQC-NOESY spectrum. As was described previously (11), hydrogen bond distance and angular restraints were incorporated between Arg97/Arg109 NH2 and Gua206/Gua216 O6 and N7, respectively, in the final simulated annealing calculations.
Molecular dynamics simulations
A B-form methylated DNA structure comprising the 10 bp sequence with three additional cytosine bases on each end for added stability was generated using the 3D-DART webserver (23) and Visual Molecular Dynamics software (24). The DNA and preliminary MBD4MBD structures were docked and solvated in a box with 10 Å of TIP3P water surrounding the complex and 75 mM NaCl. All dynamics simulations were carried out using NAMD 2.9 (25) and the CHARMM27 (26) force field. The system was equilibrated with two rounds of preparative constant number, volume, and temperature (NVT) simulations. In the first round, 5000 steps of minimization were followed by 30 ps of dynamics ps at 300 K with all atoms of the protein–DNA complex held rigid. In the second round, the same protocol was used except that the rigid restraints on the protein–DNA complex were replaced by a harmonic restraint (5 kcal/mol/Å) applied to the backbone atoms of the protein–DNA complex. Finally a 1 ns preparative constant number, pressure, and temperature (NPT) simulation was carried out on the system using a Langevin piston barostat (27,28) with a target pressure of 1.01325 bar, a decay period of 100 fs and a piston temperature of 300 K followed by 40 ns of unrestrained NPT dynamics.
Nz-exchange spectroscopy
Two separate samples comprising 2H,15N labeled MBD4MBD at a final concentrations of 200 μM and 333 μM were combined with a mixture of wild-type and inverted 10 bp methylated DNA at final molar ratios of 1:2:2 (protein:wild-type DNA:inverted DNA). A series of 2D 1H-15N TROSY based Nz-exchange spectra (29) were collected with total exchange delays of 11.9, 14.3, 16.8, 21.8, 29.3, 36.8, 49.3, 61.8, 111.8 and 211.8 ms. The data were processed as pseudo-3D spectra using a Lorentz-to-Gaussian window function in both dimensions and the spectra fit using an automated lineshape fitting algorithm within the NMRPipe software (12). The intensities for the auto and exchange crosspeaks were fit to four coupled equations describing chemical exchange in the slow exchange limit (30) using pro Fit software (Quantum Soft). For comparison, two samples of 1H,15N labeled cMBD2MBD at final concentrations of 185 μM and 370 μM were combined with a mixture of wild-type and inverted 10 bp methylated DNA at final molar ratios of 1:2:2 (protein:wild-type: inverted DNA). A series of 2D 1H-15N Nz-exchange spectra (non-TROSY versions) were collected and analyzed in a similar manner.
RESULTS
Solution structure of MBD4MBD bound to methylated DNA
We determined the solution structure of the methyl binding domain from human MBD4 (amino acids 80–148) bound to a 10 bp DNA fragment containing a central symmetrically methylated mCpG dinucleotide. This 10 bp DNA was derived from the chicken ρ globin promoter and was used previously in structural studies of cMBD2MBD (11) (Table 1). The structure was well determined with an overall root mean square deviation (RMSD) from the mean for the backbone of the MBD4MBD = 0.7 ± 0.1 Å and for the complex = 1.2 ± 0.3 Å (Table 2, Figure 1a). The structure comprises a 3-strand β-sheet that extends down and across the major groove and includes many of the DNA contacts (Figure 1b). The loop connecting the first two β-strands shows conformational heterogeneity within the ensemble of structures, which is similar to that seen for MBD3 (16). An α-helix follows the β-sheet which is similar in length to the same helix in MeCP2 and longer than for MBD1, cMBD2 and MBD3 (Figure 1c). The length of this helix reflects a four amino acid insertion common to both MeCP2 and MBD4, which results in a larger hydrophobic core.
Table 1. Oligonucleotide sequences.
| Oligonucleotide | Sequence |
|---|---|
| mCpG (17 bp) | 5′-GAGGCGC TmCGG CGGCAG-3′ |
| 3′-CTCCGCG AGmCC GCCGTC-5′ | |
| CpG (17 bp) | 5′-GAGGCGC TCGG CGGCAG-3′ |
| 3′-CTCCGCG AGCC GCCGTC-5′ | |
| hmCpG (17 bp) | 5′-GAGGCGC ThmCGG CGGCAG-3′ |
| 3′-CTCCGCG AGhmCC GCCGTC-5′ | |
| mCpG/TpG (17 bp) | 5′-GAGGCGC TmCGG CGGCAG-3′ |
| 3′-CTCCGCG AGTC GCCGTC-5′ | |
| mCpG (10 bp) | 5′-GGA TmCGG CTC-3′ |
| 3′-CCT AGmCC GAG-5′ | |
| Inverted (10 bp) | 5′-GGA CmCGA CTC-3′ |
| 3′-CCT GGmCT GAG-5′ | |
| Tandem (30 bp) | 5′-CACGGA TmCGG CT CCCC CGAG TmCGG TCCCGC-3′ |
| 3′-GTGCCT AGmCC GA GGGG GCTC AGmCC AGGGCG-5′ | |
| Tandem nicked (30 bp) | 5′-CACGGA TmCGG CT CCCC CGAG TmCGG TCCCGC-3′ |
| 3′-GTGCCT AGmCC GA GG - - GCTC AGmCC AGGGCG-5′ | |
| Tandem (20 bp) | 5′-GGA TmCGG CTC GGA CmCGA CTC-3′ |
| 3′-CCT AGmCC GAG CCT GGmCT GAG-5′ |
Table 2. NMR and refinement statistics.
| Protein | Nucleic acid | |
|---|---|---|
| NMR distance and dihedral constraints | ||
| Distance restraints | ||
| Total NOE | 487 | 115 |
| Intraresidue | 105 | 68 |
| Inter-residue | 382 | 47 |
| Sequential (|i − j| = 1) | 149 | 30 |
| Non-sequential (|i − j| > 1) | 233 | 17 |
| Hydrogen bonds | 18 | 37 |
| Hydrogen bonds protein–nucleic acid | 4 | |
| Protein–nucleic acid intermolecular | 12 | |
| Total dihedral angle restraints | ||
| Protein | ||
| ψ | 48 | |
| φ | 47 | |
| χ1 | 15 | |
| Nucleic acid | ||
| Backbone | 120 | |
| Sugar pucker | 20 | |
| RDC Q% (number of constraints) | ||
| NH | 1.0 ± 0.4 (37) | |
| Structure statistics | ||
| Violations (mean and s.d. for the complex) | ||
| Distance constraints (Å) | 0.035 ± 0.004 | |
| Dihedral angle constraints (º) | 0.34 ± 0.04 | |
| Maximum dihedral angle violation (º) | 2.2 | |
| Maximum distance constraint violation (Å) | 0.39 | |
| Deviations from idealized geometry | ||
| Bond lengths (Å) | 0.0027 ± 0.0002 | |
| Bond angles (º) | 0.546 ± 0.008 | |
| Impropers (º) | 0.32 ± 0.01 | |
| Average pairwise RMS deviationa (Å) | ||
| Protein | ||
| Heavy | 1.3 ± 0.2 | |
| Backbone | 0.7 ± 0.1 | |
| DNA | ||
| Heavy | 0.3 ± 0.1 | |
| Backbone | 0.5 ± 0.1 | |
| Complex | ||
| Heavy | 1.4 ± 0.3 | |
| Backbone | 1.2 ± 0.3 | |
| Ramachandran plot summarya | ||
| Most favored regions | 94.0% | |
| Additionally allowed regions | 5.9% | |
| Generously allowed regions | 0.1% | |
| Disallowed regions | 0.0% | |
aPairwise RMS deviation and Ramachandran plot summary was calculated among 20 refined structures for structured residues (amino acids 86–140 of MBD4MBD and base pairs 202–212 of DNA).
Figure 1.

Solution structure of MBD4MBD bound to methylated DNA. (a) A best-fit superimposition stereo cartoon diagram depicts the twenty calculated structures of the MBD4MBD (yellow) and DNA (green) with key interacting protein residues shown as stick diagrams. (b) A cartoon diagram depicts the lowest energy structure of MBD4MBD (yellow) and DNA (green) with key interacting protein residues shown as stick diagrams. (c) A best-fit superimposition cartoon diagram of the MBD4MBD (yellow), MeCP2MBD (blue) and cMBD2MBD (green) shows that the C-terminal α-helix is longer in MeCP2 and MBD4 as compared to cMBD2. Horizontal bars below the diagram highlight the relative lengths of this α-helix in each. (d) An expanded mixed rendering diagram shows critical interactions involved in DNA binding with key residues shown as sticks and potential hydrogen bonds highlighted with yellow dashed lines. Note that Tyr109 points away from DNA, which differs from other MBD proteins.
Only a relatively few intermolecular NOEs between protein and DNA could be measured which is consistent with an interface dominated by solvent mediated interactions and few base specific contacts (Figure 1d). The base specific interactions primarily involve two arginine side chains (Arg97 and Arg119) that establish bidentate hydrogen bonds with the symmetrically related bases of the CpG dinucleotide. A highly conserved aspartate (Asp107) makes side chain hydrogen bonds and stabilizes Arg97 in the appropriate conformation. Unlike other MBD proteins, a critical tyrosine residue (Tyr109) no longer points towards the methyl group of mCyt, instead this residue points towards the phosphate backbone and solvent. The latter observation is confirmed both by NOEs detected between Tyr109 and Val93/Lys95 as well as J-coupling measurements for the χ1 torsion angle of Tyr109 (JC'Cγ ≈ 0 Hz). As we previously described in the solution structure of cMBD2:dsDNA, base specific intermolecular NOEs between MBD4MBD and DNA indicate that the protein binds predominantly in a single orientation on DNA. Distinct NOEs between Arg97 and mCyt205 and between Arg119 and mCyt215 can only be satisfied by a single orientation on the DNA. In addition, we detected intermolecular NOEs between Thr102 and both Gua206 and Gua207 that confirm this orientation.
Molecular dynamics simulations of the MBD4MBD:dsDNA complex
To further characterize the MBD4MBD:DNA interface and better understand the orientation preference of Tyr109, we carried out molecular dynamics simulations of the MBD4MBD:dsDNA complex. The two key arginine residues Arg97 and Arg119 established persistent bidentate hydrogen bonds with the symmetrically related guanosine bases of the CpG dinucleotide Gua206 and Gua216, respectively (Figure 2a), which is consistent with the experimental solution structure. Likewise the side chain of Asp107 also forms persistent bidentate hydrogen bonds with Arg97 (Figure 2a). Plots of distances between hydrogen bond donors and acceptors for these interactions show that these hydrogen bonds are established early and broken only intermittently during the simulation (Figure 2c). In addition, Tyr109 maintains a gauche(+) χ1 torsion angle throughout the simulation as opposed to the gauche(−) χ1 torsion angle in MeCP2 (Figure 2b). As can be seen in Figure 2b, Tyr109 fits within a hydrophobic pocket formed by the side chains of Val93, Lys95, Ile111 and Lys117. The conformation of these side chains is stabilized by interactions between the lysine ϵ-amino groups and the phosphate backbone of DNA as well as between the tyrosine hydroxyl and the phosphate backbone of DNA.
Figure 2.

Molecular dynamics simulation highlights critical MBD4MBD–DNA interactions. (a-b) Expanded mixed rendering diagrams from the final frame of a 40 ns molecular dynamics simulation show key interactions with DNA. Basic specific interactions between arginine residues and DNA are highlighted in (a) including the potentially orienting interaction between Arg105 and Gua213. Methyl groups of mCyt are depicted as translucent spheres while potential hydrogen bonds are shown as yellow dashed lines. Residues that stabilize the gauche(+) χ1 torsion angle of Tyr109 are highlighted in (b) with potential hydrogen bonds to the phosphate backbone of DNA shown as yellow dashed lines. For comparison the orientation of the equivalent tyrosine in MeCP2 (Tyr123) is shown in blue. (c) Distances between specific heavy atoms are plotted every 10 ps of the 40 ns molecular dynamics simulation. These distances are shown for potential bidentate hydrogen bonds between Arg119 and Gua216, Arg97 and Asp107, Arg97 and Gua206 and Arg105 and Gua213.
We previously showed that Lys32 of cMBD2MBD makes base specific interactions with Gua107 which contributes to the binding affinity and preferred orientation on an mCpGG trinucleotide (11). Since MBD4MBD binds in a similar orientation on this same DNA sequence, we hypothesized that the equivalent residue, Arg105, would make similar base specific interactions. During the molecular dynamics simulation, the side chain of Arg105 reaches across the major groove to form intermittent bidentate hydrogen bonds with Gua213 (Figure 2b). This base specific interaction differs from that observed cMBD2MBD in that the guanosine is on the opposite strand and one base removed from the CpG dinucleotide while the base specific interaction identified in cMBD2 involved Gua107, which immediately follows the CpG dinucleotide. The interaction between Arg105 and Gua213 helps explain the preferred orientation on DNA since Ade203, which has only one hydrogen bond acceptor, occupies the equivalent position to Gua213 if MBD4MBD were to bind in the reverse orientation. A different and palindromic DNA sequence was used in a recently deposited crystal structure of human MBD4MBD such that Arg105 hydrogen bonds to O4 of thymidine immediately following the CpG dinucleotide (PDB ID: 4LG7). In contrast, lysine occupies the equivalent position in a crystal structure of mouse MBD4MBD which interacts with the phosphate backbone instead of making a base specific interaction (31).
Comparison with other MBDs
Structural information is now available for most of the MBD family of proteins (MeCP2, MBD1–4). The crystal structure of MeCP2MBD (32) and the NMR structures of MBD1MBD (33), MBD2MBD (11) and MBD3MBD (16) have previously been reported. More recently the crystal structures of mouse MBD4MBD bound to methylated, hydroxymethylated and mismatch DNA were reported (31) and a crystal structure of human MBD4MBD bound to methylated DNA was deposited in the RCSB (PDB ID: 4LG7) by the Structural Genomics Consortium Toronto. All of the MBD structures show similar folds and demonstrate that the key DNA contacting residues are largely conserved and form a similar DNA recognition interface (Figure 1). The backbone RMSD between the solution structure of MBD4MBD and other MBDs is as follows: MeCP2 - 1.7 Å; MBD1 - 2.0 Å; cMBD2 - 2.5 Å; MBD3 - 2.3 Å; human MBD4MBD crystal structure - 1.5 Å; mouse MBD4MBD (excluding a small C-terminal helix) bound to mCpG - 1.8 Å, hmCpG - 1.8 Å, mCpG/TpG mismatch - 1.8 Å; and mouse MBD4MBD bound to both a mCpG/TpG mismatch and a non-specific complex - 1.6 Å. The MBD family can be divided into two groups (MBD1/2/3 and MeCP2/MBD4) reflecting the four amino acid insertion described above. Because of this insertion, both MBD4MBD and MeCP2MBD contain a longer C-terminal α-helix that provides a larger hydrophobic core. Consistent with this observation, both MeCP2 (34) and MBD4 adopt a regular folded structure in isolation as opposed to MBD2 and MBD3 which undergo a disorder to order transition upon binding DNA (11,16). 2D 15N-HSQC spectra of the isolated MBD4MBD (not bound to DNA) contains sharp well-dispersed peaks indicative of a folded domain while that of cMBD2 does not (Supplementary Figure S1).
A few changes at the protein–DNA interface potentially explain binding affinity and methylation selectivity differences among the MBDs. Both mouse and human crystal structures of MBD4MBD as well as our solution structure of MBD4 show the same reorientation of Tyr109, which plays a critical role in methylation specific DNA binding for MBD2 and MBD3. As described by Otani et al. (31), this change in Tyr109 conformation opens up a large solvent accessible cavity at the protein–DNA interface. In addition, this change removes one of the key interactions that drives binding selectivity for methylated DNA which indicates that MBD4MBD would not show the same level of methylation selectivity as cMBD2MBD and mutating this Tyr109 would not reduce binding affinity and selectivity as seen with other MBDs. We test both of these hypotheses in the binding analysis reported below.
One of the more notable differences between the crystal structures of mouse MBD4MBD reported by Otani et al. (31) and the solution structure reported here is that a small C-terminal helical region adopts an extended conformation and swaps positions with symmetry related molecules in three of the crystal structures (PDB IDs: 3VXX, 3VXV and 3VYB). This same region adopts the more typical compact monomeric fold in the solution structure reported here as well as in the fourth mouse MBD4MBD(PDB ID: 3VYQ) and human MBD4MBD crystal structures. To confirm the relative orientation of this region, we fit the residual dipolar couplings measured for MBD4MBD in solution to the crystal structure of mouse MBD4MBD bound to methylated DNA using singular value decomposition as implemented by PALES software (35). If we included the entire dataset, the quality of fit was poor (Q = 78.9%) but if we excluded values from the C-terminal helical region, the fit markedly improves(Q = 26.7%). Hence residual dipolar coupling measurements confirm the monomeric fold in solution which supports the interpretation by Otani et al. (31) that apparent dimerization of mouse MBD4MBD reflects a crystal lattice induced artifact.
MBD4MBD preferentially binds methylated over mismatch, hydroxymethylated and unmethylated DNA
The binding affinity of MBD4MBD for modified and unmodified 17 bp oligonucleotides (Table 1) was determined by surface plasmon resonance (Figure 3) and the results are summarized in Table 3. Although the overall affinity for DNA is relatively weak, MBD4MBD shows a modest preference for methylated DNA (KD ∼6.4 μM) over mCpG/TpG mismatch (KD ∼11.5 μM), hydroxymethylated (KD ∼14.2 μM) and unmethylated DNA (KD ∼17.2 μM). These findings are similar to those reported by Hashimoto et al. (36) for human MBD4MBD and suggest that the reorientation of Tyr109 reduces the overall affinity and methylation selectivity. Hence MBD4MBD can bind a variety of modified CpGs with comparable affinity and only modest selectivity for mCpG. Based on these observations, we hypothesized that a Y109F mutation in MBD4MBD would not affect binding affinity to the same degree as observed for other MBDs (16,37,38). As shown in Figure 3 and Table 3, MBD4MBD(Y109F) binds methlylated DNA with similar overall affinity (KD ∼7.9 μM) and relative selectivity over mCpG/TpG mismatch (KD ∼14.0 μM), hydroxymethylated (KD ∼16.0 μM) and unmethylated (KD ∼19.6 μM) DNA. These findings contrast with the large reduction in binding affinity and reduction in methylation selectivity associated with the same modification in cMBD2 and the differences in binding specificity between MBD3 and MBD2 (16,37,38).
Figure 3.

MBD4MBD shows a modest binding preference for methylated DNA. Steady state response curves are shown for surface plasmon resonance analyses of wild-type MBD4MBD (upper panel) and mutant MBD4MBD(Y109F) (lower panel) binding to methylated (green), mismatch (blue), unmethylated (purple) and hydroxymethylated (green) DNA. Both wild-type and mutant MBD4MBD show a similar modest preference for methylated DNA.
Table 3. DNA binding affinity.
| KD (μM) | Rmax | X2 (10−4) | |
|---|---|---|---|
| MBD4MBD-mCpG | 6.4 ± 1.5 | 0.74 | 34 |
| MBD4MBD-TpG | 11.5 ± 1.2 | 0.59 | 2.3 |
| MBD4MBD-CpG | 17.2 ± 2.0 | 0.91 | 3.5 |
| MBD4MBD-hmCpG | 14.2 ± 1.9 | 0.72 | 3.9 |
| MBD4MBD(Y109F)-mCpG | 7.9 ± 1.6 | 0.63 | 14 |
| MBD4MBD(Y109F)-TpG | 14.0 ± 1.4 | 0.51 | 1.0 |
| MBD4MBD(Y109F)-CpG | 19.6 ± 3.5 | 0.76 | 3.5 |
| MBD4MBD(Y109F)-hmCpG | 16.0 ± 3.0 | 0.59 | 3.4 |
We previously showed that the 15N, 1H chemical shifts of select residues in the MBD reflected a distribution between CpG specific and non-specific binding modes of MBD2 and MBD3. Hence we compared the chemical shifts of the same residues in MBD4MBD. As described previously for MBD2, the 1Hϵ chemical shift of Arg97 is shifted far downfield to ∼9.6 ppm when bound to mCpG (Supplementary Figure S2), which is consistent with stabilization of the side chain hydrogen bond with Asp107. When MBD4MBD binds unmethylated DNA, this peak shifts ∼0.8 ppm upfield to ∼8.8 ppm and when bound to hydroxymethylated DNA, the same peak falls between the two extrema at ∼9.1 ppm. Likewise, the 15N chemical shift of Gly100 is shifted far upfield when bound to mCpG (Supplementary Figure S2) and is shifted downfield by ∼1 ppm when bound to unmethylated and hydroxymethylated DNA. Interestingly the peak for Gly100 15N-1H is shifted upfield while the peak for Arg97 15Nϵ-1Hϵ is broadened and not observed when bound to mCpG/TpG mismatch. Together these findings support the relative binding affinities for the different modified substrates and indicate that, like MBD3 and MBD2, MBD4MBD distributes between CpG specific and non-specific binding modes when bound to DNA.
Intermolecular and intramolecular exchange of MBD4MBD between methylated sites
We previously established that exchanging the bases immediately flanking the mCpG causes the MBD2MBD to reverse orientation on the DNA (11). In doing so, we noted that binding to the inverted sequence led to chemical shift changes in select backbone amide (15N, 1H) resonances. 2D 15N-1H HSQC spectra of 15N-MBD4MBD also show distinct chemical shifts for selected reporter residues, Arg105 and Phe106, (Figure 4) when bound to DNA with the central four bases in the inverted orientation (Table 1). This observation allows us measure chemical exchange between these closely related mCpG binding sites by Nz-exchange NMR spectroscopy (29). When bound to a mixture of the wild-type and inverted sequences (1:2:2 molar ratio of MBD4MBD, wild-type and inverted DNA), two distinct peaks were observed for these same reporter residues (Figure 4a and b) which indicate that MBD4MBD exchanges slowly on the NMR timescale between two DNA molecules.
Figure 4.

MBD4MBD exchanges between molecules of DNA on the slow NMR timescale. (a) 2D 1H-15N HSQC spectra of MBD4MBD bound to wild-type (black) and inverted (red) DNA sequences show that the chemical shifts for Arg105 and Phe106 differ between the two complexes. (b) 2D 1H-15N Nz-exchange spectra of MBD4MBD bound to a 1:1 mixture of wild-type and inverted (10 bp) sequences shows two distinct peaks for Arg105 and Phe106 which represent between binding to the different DNA sequences. The exchange crosspeaks, AB and BA, increase in intensity with increasing exchange delay (2.5 and 25 ms) and represent intermolecular exchange between DNA molecules. (c) The intensities for auto (AA and BB) and exchange (AB and BA) crosspeaks for Arg105 (upper panels) and Phe106 (lower panels) were fit to four coupled equations to determine the rate of intermolecular exchange at 200 μM (left panels) and 333 μM (right panels) MBD4MBD concentration.
To measure the intermolecular exchange rate, we collected 1H-15N TROSY based Nz-exchange spectra (29) with exchange delays ranging from 11.9–211.8 ms. As can be seen in Figure 4b exchange crosspeaks, AB and BA (which represent exchange from wild-type to inverted or inverted to wild-type sequences, respectively) buildup with increasing delay. The intensities of the auto and exchange peaks were fit to four coupled equations describing chemical exchange in the slow exchange limit (Figure 4c) (30). These data show that at 200 μM protein and 800 μM total DNA intermolecular exchange of MBD4MBD occurs with a mean lifetime of ∼40 ms. Increasing the protein and total DNA concentration to 333 μM and 1.33 mM, respectively, shortens the mean lifetime to ∼23 ms as would be expected for intermolecular exchange.
To test whether MBD4MBD exchanges more rapidly between two binding sites in the same DNA molecule, we bound MBD4MBD to a 30 bp oligonucleotide containing both wild-type and inverted mCpG sequences separated by 12 bp (Table 1) at a protein concentration of 200 μM and total mCpG binding site concentration of 800 μM. A 2D TROSY 15N-HSQC of this complex no longer showed distinct peaks for the two bound states (Figure 5b). Instead the spectrum contains only a single peak for Arg105 located at approximately 62% of the distance between the peaks for same residue in the wild-type and inverted DNA complexes. Assuming the chemical shifts for MBD4MBD bound to either the wild-type or inverted sequences do not change within the context of the 30 bp DNA, these findings indicate rapid exchange between the two binding sites. Hence the position of the crosspeak reflects a weighted average for the two binding modes, which suggests that MBD4MBD slightly favors binding to the inverted sequence, spending ∼62% of time on that site. The crosspeak for Phe106 is not observed in the 30 bp complex likely reflecting additional internal dynamic motions leading to significant line broadening. Together these results show that MBD4MBD exchanges more efficiently between binding sites in the same molecule consistent with rapid facilitated diffusion along the DNA.
Figure 5.
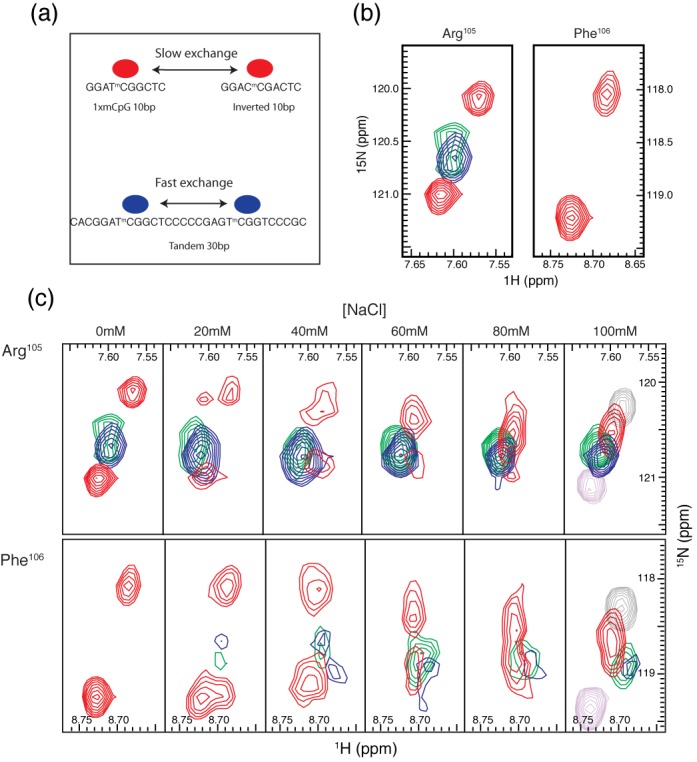
MBD4MBD exchanges between methylated sites in the same molecule of DNA on the fast NMR timescale. (a) A diagram depicting slow intermolecular and fast intramolecular exchange by MBD4MBD. (b) 2D 1H-15N TROSY HSQC spectra of MBD4MBD bound to methylated wild-type and inverted (10 bp) DNA (red), tandem (30 bp) DNA (blue) and tandem nicked (30 bp) DNA (green) show that MBD4MBD more rapidly exchanges between sites in the same molecule of DNA. The spectra show only a single crosspeak for Arg105 (left panel) when bound to DNA containing both wild-type and inverted sites, which is consistent with fast intramolecular exchange. A similar comparison for Phe106 (right panel) shows marked broadening of the intramolecular crosspeaks consistent with intermediate exchange on the NMR timescale which likely reflects line-broadening from additional internal dynamic motions. Incorporating a single-strand defect does significantly alter rapid intramolecular exchange. (c) In contrast, increasing NaCl concentration accelerates both intermolecular and intramolecular exchange. The two separate peaks reflective of intermolecular exchange (red) for both Arg105 (upper panels) and Phe106 (lower panels) coalesce into a single peak with increasing NaCl concentration. This change indicates that the intermolecular exchange rate has increased from the slow to fast NMR timescale. Likewise the crosspeaks reflective of intramolecular exchange (blue and green) sharpen with increasing NaCl concentration, which is consistent with accelerated intramolecular exchange. For comparison, 2D1H-15N TROSY HSQC spectra of MBD4MBD bound to methylated wild-type (gray) and inverted (purple) DNA are shown at 100 mM NaCl.
Rapid intramolecular exchange does not require continuous double-stranded DNA
To test whether a defect in the DNA can impact rapid intramolecular exchange by MBD4MBD, we introduced a two-base stretch of single-stranded DNA between the mCpG binding sites (Table 1). A 2D TROSY 15N-HSQC of MBD4MBD bound to the 30 bp nicked tandem DNA (Figure 5b, green) shows similar fast exchange peaks as seen for the 30 bp tandem DNA complex. Adding a small defect in double stranded DNA does not impede rapid intramolecular exchange of MBD4MBD. This data indicate that MBD4MBD does not necessarily maintain continuous contact with the major groove of dsDNA during translocation, consistent with the local hopping mechanism of facilitated diffusion (39–43).
Increasing salt concentration accelerates both intermolecular and intramolecular exchange by MBD4MBD
Intermolecular exchange rates for protein–DNA complexes often show a strong dependence on NaCl concentration (44). Therefore we evaluated the effect of increasing NaCl concentrations on exchange rates for MBD4MBD when bound to (i) 1:1 mixture of wild-type and inverted DNA, (ii) 30 bp tandem DNA and (iii) 30 bp nicked tandem DNA. At very low salt concentrations, Arg105 (Figure 5c, top panel) shows slow intermolecular exchange and rapid intramolecular exchange as described above. With increasing concentrations of NaCl, the intramolecular peaks for Arg105 become sharper (blue and green) indicating an increase in exchange rate. Concomitantly the intermolecular exchange peaks for Arg105 (red) undergo profound changes such that the two peaks observed at low salt concentrations (slow exchange) merge into one peak (fast exchange) at an average chemical shift. Likewise, Phe106 (Figure 5c, bottom panel) shows slow intermolecular exchange and marked line broadening indicative of intermediate intramolecular exchange at low salt concentrations. With increasing concentrations of NaCl the intramolecular exchange peak for Phe106 sharpens and becomes detectable (blue and green) consistent with a transition from intermediate to fast exchange on the NMR timescale. At 100 mM NaCl concentration, the crosspeaks for the individual wild-type (gray, Figure 5c) and inverted DNA (purple, Figure 5c) complexes remain well separated while the intermolecular exchange peaks (red) collapse into a single peak indicating fast exchange. Importantly, these changes in intramolecular exchange kinetics are similar whether the DNA has a 2 bp defect or not (Figure 5c, green).
Although at 100 mM NaCl both exchange rates fall within the fast exchange time regime, the linewidths indicate that the intramolecular exchange rate remains much faster than the intermolecular exchange rate. As can be seen in Figure 5c and Supplementary Figure S3, the intermolecular exchange peaks (red) are much broader, especially in the 15N dimension, than the intramolecular exchange peaks (blue and green). The 15N linewidths at half-height for intramolecular exchange are 16.7 Hz (Arg105) and 25.0 Hz (Phe106) and for intermolecular exchange are 25.5 Hz (Arg105) and 34.2 Hz (Phe106) (Supplementary Figure S3), even though the molecular weight of MBD4MBD bound to the 30 bp tandem DNA (26 551 g/mol) is nearly double that of MBD4MBD bound to either the wild-type or inverted DNA sequences (14 159 g/mol).
For comparison, we measured intermolecular exchange kinetics for cMBD2MBD binding to the same DNA (Figure 6a). Consistent with an increased binding affinity, the mean lifetime for intermolecular exchange of cMBD2MBD is somewhat longer at similar protein concentrations (τ ∼66 ms, 185 μM protein; τ ∼34 ms, 370 μM protein). Spectra of cMBD2MBD bound to 20 and 30 bp tandem mCpG sequences (Figure 6b) show that intramolecular exchange changes from fast to slow exchange with a small increase in binding site separation. Hence cMBD2MBD does not exchange between binding sites as efficiently as MBD4MBD.
Figure 6.
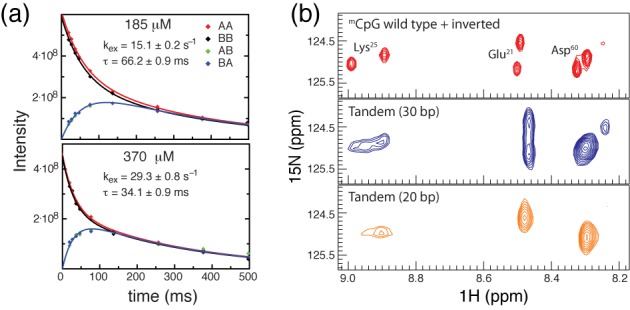
cMBD2MBD does not exchange between binding sites as efficiently as MBD4MBD. (a) The intensities for auto (AA and BB) and exchange (AB and BA) crosspeaks for Glu21 from Nz-exchange spectra were fit to four coupled equations to determine the rate of intermolecular exchange at 185 μM (upper panel) and 370 μM (lower panel) cMBD2MBD concentration. (b) 2D 1H-15N TROSY HSQC spectra of cMBD2MBD bound to methylated wild-type and inverted (10 bp) DNA (red, upper panel), tandem (30 bp) DNA (blue, middle panel) and tandem (20 bp) DNA (orange, lower panel) show that intramolecular exchange for cMBD2MBD remains in the slow to intermediate NMR timescale when bound to the tandem (30 bp) DNA. If the sites are 4 bp closer together as in the tandem (20 bp), then cMBD2MBD exchanges between sites on the fast NMR timescale.
DISCUSSION
MBD4 occupies a unique niche within the MBD family of proteins. It is the only member of this family that incorporates enzymatic activity within the same protein, contributes directly to DNA mismatch repair and does not specifically recruit histone deacetylase activity. The observation that the MBD4GD can recognize and repair mismatch in isolation raises questions about the functional role of the MBD4MBD. Two alternative, yet not mutually exclusive, models of MBD4MBD can be proposed: (i) the MBD4MBD bind to the same site as the MBDGD and thereby augment sequence specificity or enzymatic activity; or (ii) the MBD4MBD could target the protein to regions enriched for mCpG and by virtue of the long intervening linker allow the MBD4GD to identify and repair nearby mismatches. Our recent work on the dynamic distribution of MBD3 on DNA (16) suggests that a similar dynamic behavior of MBD4MBD would augment the scanning mechanism inherent in the second model of MBD4MBD function. Hence we studied the structure and dynamics of this protein on DNA.
The basic structural motifs and DNA binding interface of MBD4MBD are very similar to other MBDs, yet local structural differences modify binding specificity and affinity. Changing a single tyrosine to phenylalanine at the DNA interface in MBD3MBD dramatically reduces methylation selectivity and overall binding affinity. This same tyrosine in MBD4MBD (Tyr109) changes orientation with respect to the DNA which correlates with reduced selectivity for mCpG. Binding analyses by surface plasmon resonance reveals a relatively low overall affinity for methylated DNA and only a modest preference for symmetrically methylated CpG over mCpG/TpG mismatch, hydroxymethlyated and unmethylated DNA. Consistent with the reorientation of Tyr109 away from DNA, the Y109F mutation does not appreciably alter binding affinity and selectivity. The same mutation in cMBD2 reduced binding affinity by ∼50-fold. The structural rearrangement of Tyr109 places MBD4MBD between the highly mCpG selective MBD2MBD and the minimally mCpG selective MBD3MBD.
As demonstrated by the crystal structures of mouse, MBD4MBD bound to a variety of modified substrates (31), a solvent filled protein–DNA interface allows MBD4MBD to adapt to different binding sites. We hypothesized that this adaptability and limited selectivity would promote efficient exchange between mCpG along the same DNA molecule. This hypothesis arises from the well-established model of facilitated diffusion by which DNA binding proteins use one-dimensional diffusion along the DNA to more rapidly identify a specific binding site (39). In Figure 7, a diagram depicting facilitated diffusion shows the different modes of exchange between DNA binding sites which include: (i) simple 3D diffusion through bulk solvent, (ii) jumping between nearby strands of DNA; (iii) sliding along the DNA between sites; and (iv) local hopping which does not required continuous contact with the DNA.
Figure 7.

A diagram depicting a model of MBD4MBD function in which rapid intramolecular exchange allows MBD4 to efficiently scan CpG islands for mCpG/TpG mismatches. The left side of the diagram shows the different modes of searching for binding sites by transcription factors. The transcription factor (light blue circle) can search for binding sites by diffusion through bulk solvent (3D diffusion) or by different modes of facilitated diffusion (1D diffusion) including long-range jumps, local hops and sliding. The right side of the diagram shows the MBD4MBD (blue circle) exchanging between methylated (red ovals) and unmethylated CpG sites (black marks). Intramolecular exchange involves local hops that allow MBD4 to navigate around obstacles. The tethered MBD4GD (blue oval) identifies and repairs nearby mCpG/TpG mismatches (blue oval). In this manner, the MBD4MBD facilitates identification of mCpG/TpG mismatches within regions of increased CpG content.
To study intermolecular and intramolecular exchange for MBD4MBD, we took advantage of a previous observation that inverting the central 4 bp of the target DNA leads to chemical shift changes for select residues (11). Based on this observation, we used NMR spectroscopy to measure exchange between binding sites as described for other transcription factors (29,45–47). Following the peaks for these residues allowed us to measure the mean lifetime for intermolecular exchange (τ ∼40 ms at 200 μM protein) of MBD4MBD. In contrast, exchange between two binding sites in the same molecule of dsDNA occurs on the fast exchange timescale which indicates that the mean lifetime is much less than the difference in chemical shift for the two states (τ << Δν) (30). Hence, the mean lifetime can be estimated to be < 2 ms, which is at least a 20-fold increase in rate for intramolecular as compared to intermolecular exchange. Introducing a small stretch of single stranded DNA does not significantly reduce the intramolecular exchange rate. However, raising the NaCl concentration does increase both intermolecular and intramolecular exchange rates. Together, these data show that MBD4MBD efficiently exchanges between binding sites along the DNA and suggest that a local hopping mechanism contributes to the exchange process. It would be interesting to test whether efficient intramolecular exchange by MBD4 can be detected on a longer length scale using alternative approaches such as single molecule fluorescence measurements.
Small changes in the protein–DNA binding interface allow MBD4MBD to exchange more efficiently between successive binding sites along the same DNA molecule. This intramolecular exchange appears to involve a local hopping mechanism, which would allow MBD4MBD to avoid obstacles such as other DNA binding proteins on the DNA. This attribute is consistent with a model of MBD4MBD function in which the MBD targets the protein to regions of increased mCpG density and allows the glycosylase domain to scan nearby sites for mCpG/TpG mismatches. The disorder prediction algorithm PONDR® VLXT (48,49) indicates that the majority of the ∼280 amino acid linker separating the MBD4MBD and MBD4GD is disordered in solution (Supplementary Figure S4). The average end-to-end length of a 280 amino acid unstructured polypeptide is approximately 190 Å (as calculated from (C∞nl2)1/2 where C∞ is the limiting characteristic ratio (9.27), n is the number of residues and l the average Cα-Cα distance (3.8 Å)) (50,51). With this long linker, the two domains can span at least 50 bp (3.4 Å rise in B-DNA), which will contain many CpG dinucleotides in a CpG island. This arrangement allows the two domains to occupy distinct sites in the DNA such that the MBD could scan along the same molecule of DNA or hop between neighboring strands and thereby function to keep the protein in regions of increased mCpG density when the MBDGD transiently diffuses off of the DNA.
In Figure 7, a diagram of this model depicts the MBD4MBD and MBD4GD as blue circle and oval, respectively, separated by a long linker. The MBD4MBD binds to DNA and exchanges among the different methylated (red circles), unmethylated (no circle) and mCpG/TpG mismatch (blue circle) sites. The exchange process is depicted as a combination of sliding local hopping events that avoids a protein obstacle while the MBD4GD identifies and repairs a nearby mCpG/TpG mismatch. This model helps explain why the MBD4MBD appears to impede (not augment) enzymatic activity when using a small synthetic oligonucleotide with a single T-G mismatch (4). The MBD4MBD competes with MBD4GD when there is only a single binding site in the substrate. In contrast, full-length MBD4 shows increased activity when a large nucleosome substrate with a single T-G mismatch is methylated and in the presence of competing unmethylated DNA (52). Hence the MBD4MBD helps localize the enzyme to methylated regions when there is a large amount of competing unmethylated DNA but does not augment activity on isolated mismatches. Since a T-G mismatch arises from spontaneous deamination of methyl-cytosine, preferential localization to methylated regions would increase the likelihood that MBD4 would rapidly identify a newly formed mismatch. The ultimate test of this model will require comparing the rate at which spontaneous C to T point mutations arise and the location of these mutations in cell lines or whole animals with and without MBD4 or with a truncated MBD4 that lacks the MBD4MBD.
In summary, the studies presented here show how a subtle structural rearrangement, one that is not readily identified by primary sequence analysis alone, can lead to functional differences and specialization within the MBD family of proteins
ACCESSION NUMBERS
The coordinates and NMR restraints for the MBD4MBD–dsDNA complex have been deposited in the Protein Data Bank (PDB ID: 2moe); the NMR assignments have been deposited in the Biological Magnetic Resonance Bank (BMRB accession: 19939).
SUPPLEMENTARY DATA
Supplementary Data are available at NAR Online.
Acknowledgments
We would like to thank the University of North Carolina at Chapel Hill and the Research Computing group for providing computational resources and support that have contributed to these research results. The VCU Massey Cancer Center Biological Macromolecule Shared Resource and the Structural Biology Core provided services, instrumentation and products for this research project. The University of North Carolina at Chapel Hill Center for Structural Biology provided instrumentation for this research project.
FUNDING
National Institutes of Health (NIH) [R01-GM098624 to D.C.W.]. NCI Cancer Center Core Support (in part) for VCU Massey Cancer Center Biological Macromolecule Shared Resource and the Structural Biology Core [Grant P30 CA016059]. Funding for open access charge: National Institutes of Health (NIH) [R01-GM098624].
Conflict of interest statement. None declared.
REFERENCES
- 1.Hendrich B., Tweedie S. The methyl-CpG binding domain and the evolving role of DNA methylation in animals. Trends Genet. 2003;19:269–277. doi: 10.1016/S0168-9525(03)00080-5. [DOI] [PubMed] [Google Scholar]
- 2.Nan X., Meehan R.R., Bird A. Dissection of the methyl-CpG binding domain from the chromosomal protein MeCP2. Nucleic Acids Res. 1993;21:4886–4892. doi: 10.1093/nar/21.21.4886. [DOI] [PMC free article] [PubMed] [Google Scholar]
- 3.Hendrich B., Bird A. Identification and characterization of a family of mammalian methyl-CpG binding proteins. Mol. Cell. Biol. 1998;18:6538–6547. doi: 10.1128/mcb.18.11.6538. [DOI] [PMC free article] [PubMed] [Google Scholar]
- 4.Wu P., Qiu C., Sohail A., Zhang X., Bhagwat A.S., Cheng X. Mismatch repair in methylated DNA. Structure and activity of the mismatch-specific thymine glycosylase domain of methyl-CpG-binding protein MBD4. J. Biol. Chem. 2003;278:5285–5291. doi: 10.1074/jbc.M210884200. [DOI] [PMC free article] [PubMed] [Google Scholar]
- 5.Hendrich B., Hardeland U., Ng H.H., Jiricny J., Bird A. The thymine glycosylase MBD4 can bind to the product of deamination at methylated CpG sites. Nature. 1999;401:301–304. doi: 10.1038/45843. [DOI] [PubMed] [Google Scholar]
- 6.Sjolund A.B., Senejani A.G., Sweasy J.B. MBD4 and TDG: multifaceted DNA glycosylases with ever expanding biological roles. Mutat. Res. 2013;743–744:12–25. doi: 10.1016/j.mrfmmm.2012.11.001. [DOI] [PMC free article] [PubMed] [Google Scholar]
- 7.Hashimoto H., Zhang X., Cheng X. Excision of thymine and 5-hydroxymethyluracil by the MBD4 DNA glycosylase domain: structural basis and implications for active DNA demethylation. Nucleic Acids Res. 2012;40:8276–8284. doi: 10.1093/nar/gks628. [DOI] [PMC free article] [PubMed] [Google Scholar]
- 8.Manvilla B.A., Maiti A., Begley M.C., Toth E.A., Drohat A.C. Crystal structure of human methyl-binding domain IV glycosylase bound to abasic DNA. J. Mol. Biol. 2012;420:164–175. doi: 10.1016/j.jmb.2012.04.028. [DOI] [PMC free article] [PubMed] [Google Scholar]
- 9.Aziz M.A., Schupp J.E., Kinsella T.J. Modulation of the activity of methyl binding domain protein 4 (MBD4/MED1) while processing iododeoxyuridine generated DNA mispairs. Cancer Biol. Ther. 2009;8:1156–1163. doi: 10.4161/cbt.8.12.8536. [DOI] [PubMed] [Google Scholar]
- 10.Cai M., Williams D.C., Wang G., Lee B.R., Peterkofsky A., Clore G.M. Solution structure of the phosphoryl transfer complex between the signal-transducing protein IIAGlucose and the cytoplasmic domain of the glucose transporter IICBGlucose of the escherichia coli glucose phosphotransferase system. J. Biol. Chem. 2003;278:25191–25206. doi: 10.1074/jbc.M302677200. [DOI] [PubMed] [Google Scholar]
- 11.Scarsdale J.N., Webb H.D., Ginder G.D., Williams D.C., Jr. Solution structure and dynamic analysis of chicken MBD2 methyl binding domain bound to a target-methylated DNA sequence. Nucleic Acids Res. 2011;39:6741–6752. doi: 10.1093/nar/gkr262. [DOI] [PMC free article] [PubMed] [Google Scholar]
- 12.Delaglio F., Grzesiek S., Vuister G.W., Zhu G., Pfeifer J., Bax A. NMRPipe: a multidimensional spectral processing system based on UNIX pipes. J. Biomol. NMR. 1995;6:277–293. doi: 10.1007/BF00197809. [DOI] [PubMed] [Google Scholar]
- 13.Vranken W.F., Boucher W., Stevens T.J., Fogh R.H., Pajon A., Llinas M., Ulrich E.L., Markley J.L., Ionides J., Laue E.D. The CCPN data model for NMR spectroscopy: development of a software pipeline. Proteins. 2005;59:687–696. doi: 10.1002/prot.20449. [DOI] [PubMed] [Google Scholar]
- 14.Clore G.M., Starich M.R., Gronenborn A.M. Measurement of residual dipolar couplings of macromolecules aligned in the nematic phase of a colloidal suspension of rod-shaped viruses. J. Am. Chem. Soc. 1998;120:10571–10572. [Google Scholar]
- 15.Hansen M.R., Hanson P., Pardi A. Filamentous bacteriophage for aligning RNA, DNA and proteins for measurement of nuclear magnetic resonance dipolar coupling interactions. Methods Enzymol. 2000;317:220–240. doi: 10.1016/s0076-6879(00)17017-x. [DOI] [PubMed] [Google Scholar]
- 16.Cramer J.M., Scarsdale J.N., Walavalkar N.M., Buchwald W.A., Ginder G.D., Williams D.C., Jr Probing the dynamic distribution of bound states for methylcytosine-binding domains on DNA. J. Biol. Chem. 2014;289:1294–1302. doi: 10.1074/jbc.M113.512236. [DOI] [PMC free article] [PubMed] [Google Scholar]
- 17.Schwieters C.D., Kuszewski J.J., Tjandra N., Clore G.M. The xplor-NIH NMR molecular structure determination package. J. Magn. Reson. 2003;160:65–73. doi: 10.1016/s1090-7807(02)00014-9. [DOI] [PubMed] [Google Scholar]
- 18.Clore G.M., Gronenborn A.M. New methods of structure refinement for macromolecular structure determination by NMR. Proc. Natl. Acad. Sci. U.S.A. 1998;95:5891–5898. doi: 10.1073/pnas.95.11.5891. [DOI] [PMC free article] [PubMed] [Google Scholar]
- 19.Clore G.M., Kuszewski J. Chi(1) rotamer populations and angles of mobile surface side chains are accurately predicted by a torsion angle database potential of mean force. J. Am. Chem. Soc. 2002;124:2866–2867. doi: 10.1021/ja017712p. [DOI] [PubMed] [Google Scholar]
- 20.Kuszewski J., Gronenborn A.M., Clore G.M. Improving the packing and accuracy of NMR structures with a pseudopotential for the radius of gyration. J. Am. Chem. Soc. 1999;121:2337–2338. [Google Scholar]
- 21.Cornilescu G., Delaglio F., Bax A. Protein backbone angle restraints from searching a database for chemical shift and sequence homology. J. Biomol. NMR. 1999;13:289–302. doi: 10.1023/a:1008392405740. [DOI] [PubMed] [Google Scholar]
- 22.Shen Y., Bax A. Protein backbone and sidechain torsion angles predicted from NMR chemical shifts using artificial neural networks. J. Biomol. NMR. 2013;56:227–241. doi: 10.1007/s10858-013-9741-y. [DOI] [PMC free article] [PubMed] [Google Scholar]
- 23.Van Dijk M., Bonvin A.M. 3D-DART: a DNA structure modelling server. Nucleic Acids Res. 2009;37:W235–W239. doi: 10.1093/nar/gkp287. [DOI] [PMC free article] [PubMed] [Google Scholar]
- 24.Humphrey W., Dalke A., Schulten K. VMD: visual molecular dynamics. J. Mol. Graph. 1996;14:33, 27–38. doi: 10.1016/0263-7855(96)00018-5. [DOI] [PubMed] [Google Scholar]
- 25.Phillips J.C., Braun R., Wang W., Gumbart J., Tajkhorshid E., Villa E., Chipot C., Skeel R.D., Kale L., Schulten K. Scalable molecular dynamics with NAMD. J. Comput. Chem. 2005;26:1781–1802. doi: 10.1002/jcc.20289. [DOI] [PMC free article] [PubMed] [Google Scholar]
- 26.MacKerell A.D., Jr, Banavali N., Foloppe N. Development and current status of the CHARMM force field for nucleic acids. Biopolymers. 2000;56:257–265. doi: 10.1002/1097-0282(2000)56:4<257::AID-BIP10029>3.0.CO;2-W. [DOI] [PubMed] [Google Scholar]
- 27.Feller S.E., Zhang Y., Pastor R.W., Brooks B.R. Constant pressure molecular dynamics simulation: the langevin piston method. J. Chem. Phys. 1995;103:4613–4621. [Google Scholar]
- 28.Martyna G.J., Tobias D.J., Klein M.L. Constant pressure molecular dynamics algorithms. J. Chem. Phys. 1994;101:4177–4189. [Google Scholar]
- 29.Sahu D., Clore G.M., Iwahara J. TROSY-based z-exchange spectroscopy: application to the determination of the activation energy for intermolecular protein translocation between specific sites on different DNA molecules. J. Am. Chem. Soc. 2007;129:13232–13237. doi: 10.1021/ja074604f. [DOI] [PubMed] [Google Scholar]
- 30.Rule G., Hitchens T. Fundamentals of Protein NMR Spectroscopy. Dordrecht, The Netherlands: Springer; 2006. [Google Scholar]
- 31.Otani J., Arita K., Kato T., Kinoshita M., Kimura H., Suetake I., Tajima S., Ariyoshi M., Shirakawa M. Structural basis of the versatile DNA recognition ability of the methyl-CpG binding domain of methyl-CpG binding domain protein 4. J. Biol. Chem. 2013;288:6351–6362. doi: 10.1074/jbc.M112.431098. [DOI] [PMC free article] [PubMed] [Google Scholar]
- 32.Ho K.L., McNae I.W., Schmiedeberg L., Klose R.J., Bird A.P., Walkinshaw M.D. MeCP2 binding to DNA depends upon hydration at methyl-CpG. Mol. Cell. 2008;29:525–531. doi: 10.1016/j.molcel.2007.12.028. [DOI] [PubMed] [Google Scholar]
- 33.Ohki I., Shimotake N., Fujita N., Jee J., Ikegami T., Nakao M., Shirakawa M. Solution structure of the methyl-CpG binding domain of human MBD1 in complex with methylated DNA. Cell. 2001;105:487–497. doi: 10.1016/s0092-8674(01)00324-5. [DOI] [PubMed] [Google Scholar]
- 34.Wakefield R.I., Smith B.O., Nan X., Free A., Soteriou A., Uhrin D., Bird A.P., Barlow P.N. The solution structure of the domain from MeCP2 that binds to methylated DNA. J. Mol. Biol. 1999;291:1055–1065. doi: 10.1006/jmbi.1999.3023. [DOI] [PubMed] [Google Scholar]
- 35.Zweckstetter M., Bax A. Prediction of sterically induced alignment in a dilute liquid crystalline phase: aid to protein structure determination by NMR. J. Am. Chem. Soc. 2000;122:3791–3792. [Google Scholar]
- 36.Hashimoto H., Liu Y., Upadhyay A.K., Chang Y., Howerton S.B., Vertino P.M., Zhang X., Cheng X. Recognition and potential mechanisms for replication and erasure of cytosine hydroxymethylation. Nucleic Acids Res. 2012;40:4841–4849. doi: 10.1093/nar/gks155. [DOI] [PMC free article] [PubMed] [Google Scholar]
- 37.Saito M., Ishikawa F. The mCpG-binding domain of human MBD3 does not bind to mCpG but interacts with NuRD/Mi2 components HDAC1 and MTA2. J. Biol. Chem. 2002;277:35434–35439. doi: 10.1074/jbc.M203455200. [DOI] [PubMed] [Google Scholar]
- 38.Fraga M.F., Ballestar E., Montoya G., Taysavang P., Wade P.A., Esteller M. The affinity of different MBD proteins for a specific methylated locus depends on their intrinsic binding properties. Nucleic Acids Res. 2003;31:1765–1774. doi: 10.1093/nar/gkg249. [DOI] [PMC free article] [PubMed] [Google Scholar]
- 39.Tafvizi A., Mirny L.A., van Oijen A.M. Dancing on DNA: kinetic aspects of search processes on DNA. Chemphyschem. 2011;12:1481–1489. doi: 10.1002/cphc.201100112. [DOI] [PMC free article] [PubMed] [Google Scholar]
- 40.Bonnet I., Biebricher A., Porte P.L., Loverdo C., Benichou O., Voituriez R., Escude C., Wende W., Pingoud A., Desbiolles P. Sliding and jumping of single EcoRV restriction enzymes on non-cognate DNA. Nucleic Acids Res. 2008;36:4118–4127. doi: 10.1093/nar/gkn376. [DOI] [PMC free article] [PubMed] [Google Scholar]
- 41.Loverdo C., Benichou O., Voituriez R., Biebricher A., Bonnet I., Desbiolles P. Quantifying hopping and jumping in facilitated diffusion of DNA-binding proteins. Phys. Rev. Lett. 2009;102:188101-1–188101-4. doi: 10.1103/PhysRevLett.102.188101. [DOI] [PubMed] [Google Scholar]
- 42.Gorman J., Plys A.J., Visnapuu M.L., Alani E., Greene E.C. Visualizing one-dimensional diffusion of eukaryotic DNA repair factors along a chromatin lattice. Nat. Struct. Mol. Biol. 2010;17:932–938. doi: 10.1038/nsmb.1858. [DOI] [PMC free article] [PubMed] [Google Scholar]
- 43.Gorman J., Wang F., Redding S., Plys A.J., Fazio T., Wind S., Alani E.E., Greene E.C. Single-molecule imaging reveals target-search mechanisms during DNA mismatch repair. Proc. Natl. Acad. Sci. U.S.A. 2012;109:E3074–E3083. doi: 10.1073/pnas.1211364109. [DOI] [PMC free article] [PubMed] [Google Scholar]
- 44.Iwahara J., Clore G.M. Detecting transient intermediates in macromolecular binding by paramagnetic NMR. Nature. 2006;440:1227–1230. doi: 10.1038/nature04673. [DOI] [PubMed] [Google Scholar]
- 45.Iwahara J., Clore G.M. Direct observation of enhanced translocation of a homeodomain between DNA cognate sites by NMR exchange spectroscopy. J. Am. Chem. Soc. 2006;128:404–405. doi: 10.1021/ja056786o. [DOI] [PubMed] [Google Scholar]
- 46.Iwahara J., Zweckstetter M., Clore G.M. NMR structural and kinetic characterization of a homeodomain diffusing and hopping on nonspecific DNA. Proc. Natl. Acad. Sci. U.S.A. 2006;103:15062–15067. doi: 10.1073/pnas.0605868103. [DOI] [PMC free article] [PubMed] [Google Scholar]
- 47.Doucleff M., Clore G.M. Global jumping and domain-specific intersegment transfer between DNA cognate sites of the multidomain transcription factor Oct-1. Proc. Natl. Acad. Sci. U.S.A. 2008;105:13871–13876. doi: 10.1073/pnas.0805050105. [DOI] [PMC free article] [PubMed] [Google Scholar]
- 48.Romero Obradovic, Dunker K. Sequence data analysis for long disordered regions prediction in the calcineurin family. Genome Inform. Ser. Workshop Genome Inform. 1997;8:110–124. [PubMed] [Google Scholar]
- 49.Li X., Romero P., Rani M., Dunker A.K., Obradovic Z. Predicting protein disorder for N-, C-, and internal regions. Genome Inform. Ser. Workshop Genome Inform. 1999;10:30–40. [PubMed] [Google Scholar]
- 50.Cantor C.R., Schimmel P.R. Biophysical Chemistry. San Francisco, CA, USA: W. H. Freeman; 1980. [Google Scholar]
- 51.Williams D.C., Jr, Cai M., Clore G.M. Molecular basis for synergistic transcriptional activation by Oct1 and Sox2 revealed from the solution structure of the 42-kDa Oct1.Sox2.Hoxb1-DNA ternary transcription factor complex. J. Biol. Chem. 2004;279:1449–1457. doi: 10.1074/jbc.M309790200. [DOI] [PubMed] [Google Scholar]
- 52.Ishibashi T., So K., Cupples C.G., Ausio J. MBD4-mediated glycosylase activity on a chromatin template is enhanced by acetylation. Mol. Cell. Biol. 2008;28:4734–4744. doi: 10.1128/MCB.00588-08. [DOI] [PMC free article] [PubMed] [Google Scholar]
Associated Data
This section collects any data citations, data availability statements, or supplementary materials included in this article.