Abstract
The first two decades of brain research using fMRI have been dominated by studies that measure signal changes in response to a presented task. A rapidly increasing number of studies are showing that consistent activation maps appear by assessment of signal correlations during time periods in which the subjects were not directed to perform any specific task (i.e. “resting state correlations”). Even though neural interactions can happen on much shorter time scales, most “resting state” studies assess these temporal correlations over a period of about 5 to 10 minutes. Here we investigate how these temporal correlations change on a shorter time scale. We examine changes in brain correlations to the posterior cingulate cortex (PCC) across a 10 minutes scan. We show: (1) fMRI correlations fluctuate over time, (2) these fluctuations can be periodic, and (3) correlations between the PCC and other brain regions fluctuate at distinct frequencies. While the precise frequencies of correlation fluctuations vary across subjects and runs, it is still possible to parse brain regions and combinations of brain regions based on fluctuation frequency differences. To evaluate the potential biological significance of these empirical observations, we then use synthetic time series data with identical amplitude spectra, but randomized phase to show that similar effects can still appear even if the timing relationships between voxels are randomized. This implies that observed correlation fluctuations could occur between regions with distinct amplitude spectra, whether or not there are dynamic changes in neural connectivity between such regions. As more studies of brain connectivity dynamics appear, particularly studies using correlation as a key metric, it is vital to better distinguish true neural connectivity dynamics from connectivity fluctuations that are inherently part of this method. Our results also highlight the rich information in the power spectra of fMRI data that can be used to parse brain regions.
Keywords: BOLD, fMRI, posterior cingulated, Default Mode, Spontaneous fluctuations, Resting-state
Introduction
When fMRI data is collected from volunteers lying in the MRI scanner without performing any specific task, voxels with similar time series characteristics cluster in anatomically or functionally consistent and interesting patterns. For example, fMRI time series from voxels in the right motor cortex are strongly correlated to the time series of a voxel in the left motor cortex (Biswal, Yetkin et al. 1995) and time series from areas that constitute what is known as the default network correlate well with each other (Greicius, Krasnow et al. 2003; Fox, Snyder et al. 2005). The most commonly used methods to analyze these types of data rely on correlations to a time series from a seed region (Biswal, Yetkin et al. 1995) or model-free methods like independent component analysis (Beckmann, DeLuca et al. 2005; Jafri, Pearlson et al. 2008). Moreover, the existence of these correlations in BOLD time series is commonly interpreted as evidence that networks of brain regions tend to alter their levels of neuronal activity in concert over a long time scale.
Most of these analyses examine correlations over a 5 to 10 minute period since it has been shown that a high level of test-retest reliability is achievable with these durations (Van Dijk, Hedden et al. 2010). Nevertheless, fMRI connectivity patterns cannot be assumed to be stationary and independent of cognitive load. Shirer et al. recently showed how connectivity patterns computed over 10 minute windows differ as a function of cognitive task (Shirer, Ryali et al. 2012). Moreover, several studies now have shown that spatial connectivity patterns vary within the typical 5 – 10 minutes scan using different analysis methods. For example, Majeed et al. showed how functional connectivity to a seed regions spatially shifted across time in an anaesthetized rat using high temporal resolution fMRI (TR=100ms) (Majeed, Magnuson et al. 2009). Raichle showed how correlation maps in humans appear to be non-stationary in that the level of correlations change over short time windows (Raichle 2009). Others have shown how phase or frequency relationships between brain regions also change over time (Kitzbichler, Smith et al. 2009; Chang and Glover 2010). Given this accumulating evidence regarding the non-stationarity of connectivity patterns several recent studies characterized the temporal stability of various resting state networks in humans (Kang, Wang et al. 2011; Hutchison, Womelsdorf et al. 2012; Smith, Miller et al. 2012) and their potential biological significance (Petridou, Gaudes et al. 2012). In particular, although Petridou et al. showed that some correlation changes over time can be modeled with estimates of discrete, regional fMRI signal changes and electromyography, they did not fully demonstrate whether or not changes inter-regional fluctuations in fMRI signal correlations represent dynamic changes in connectivity relationships of the underlying tissue (e.g., their potential neuronal significance).
As an attempt to better understand the potential biological and neurological meaning of dynamic changes in inter-regional BOLD signal fluctuations over different temporal scales, here we examine in detail the dynamic behavior of the correlation between a seed region and the rest of the brain using a short, sliding temporal window. Plotting the correlation from within this small window as it changes over time, we observe a periodic behavior that sometimes corresponds to several well-known networks in the brain that would not otherwise show a significant average correlation to this seed region. Interestingly, for a single seed, different combinations of brain regions appear at different correlation frequencies.
One challenge of examining any connectivity fluctuation is that sliding window “correlation analysis applied to any two processes, even independent processes, produces what appears to be low-frequency periodic evolution in correlation.” (Robinson, de la Pena et al. 2008). Existing statistical methods for accounting for these inherent fluctuations assume a null condition of white noise (Gershunov, Schneider et al. 2001) or other models (Robinson, de la Pena et al. 2008) that aren't as temporally and spatially structured as fMRI data and don't have the same multiple comparisons challenges. Here, we map these interesting fluctuating correlations and then examine the likelihood they are neuronally relevant. For this, we use simulated time series that contain actual fMRI time series amplitude spectra but whose phase has been randomized. If the frequency peaks in the sliding window correlation time series remain after phase randomization, this would show that the original temporal ordering of events is not required to get periodic correlation fluctuations. If phase randomization removes or decreases periodic correlation fluctuations, then the temporal ordering of the original fMRI time series is relevant and adds evidence that most of these correlation fluctuations are neural in origin.
Methods
Data collection
Data were collected from twelve healthy adults (ages mean±std=29±8, 7 female) who provided informed consent under an IRB approved protocol. A 3T General Electric HDx MRI scanner equipped with a 16-element receive-only brain array coil was used. T1 anatomical scans were collected using an MPRAGE sequence (voxel size=0.94×0.94×1.2mm3). Single shot, full k-space gradient recalled EPI was used for all functional scans. Whole brain coverage fMRI scans with 27 sagittal slices were collected with the following scan parameters: TR=2s, TE=30ms, matrix=64×64, FOV=24mm, slice thickness/gap= 5mm/0mm, flip angle = 90°, reps=300 or 304 (10 minutes). Physiological data were recorded during each scan using a pulse-oximeter placed on the left 2nd or 4th finger and a pneumatic belt positioned at the level of the diaphragm. During the scan, the room lights and projector were turned off and the volunteer was told to keep eyes open and head still. We termed this run the “resting scan.” As part of a separate study (Murphy, Birn et al. 2009), volunteers performed other tasks during the same scanning session, but these data were collected after the resting scan used in this study.
Preprocessing
The EPI data were preprocessed primarily using AFNI (Cox 1996) with in-house Matlab (www.mathworks.com) scripts and C code. The first 4 volumes were discarded to allow magnetization to reach steady state. Data were corrected for subject motion using a rigid-body volume registration, slice-timing differences, and then the time series signal magnitudes were converted to percent change from the mean. Signal oscillations from aliased cardiac and respiration were removed using RETROICOR (Glover, Li et al. 2000). Slow respiratory volume changes over time (RVT) were also removed (Birn, Diamond et al. 2006). For the RVT correction, the RVT time series were deconvolved from the data with lags from 0 to 15 volumes (0-30s) using a general linear model (GLM). This was performed to remove any signal that might have a linear relationship to the RVT curve. In the same GLM, the 6 translational and rotational motion parameters and their first derivatives were deconvolved from the data. Low frequency signal drifts were also removed from the data using 0-5th degree polynomials in the same GLM. The data were then low pass filtered at 0.1Hz. The data were spatially smoothed using a Gaussian filter (full-with-half-max=5.6mm).
Correlation frequency maps
Fig. 1 shows our fundamental observation as well as the analysis steps. The posterior cingulate cortex (PCC) seed region was a 12 mm diameter sphere centered at the Talairach coordinate [-5, -49, 40]. While a spherical seed (Fig. 1A) can't precisely define the PCC, this ROI this is commonly called the PCC is consistent with other papers (Fox, Snyder et al. 2005; Murphy, Birn et al. 2009) that utilize this region. The seed time-series was the average of the voxels in the specified region. The unthresholded correlation map from the PCC seed to the rest of the brain across the entire ten minute time-series is shown in Fig. 1B and the Supplementary video. This is the standard type of correlation map presented in most correlation-based connectivity studies. In the next step, instead of calculating a correlation across the entire time series, we calculated correlations over brief temporal windows. The same time range in each voxel's time series was tapered using a Hamming filter to remove window edge artifacts. Fig. 1D shows the time series of the correlations between the seed ROI and another voxel marked by the green crosshairs in Fig 1A-C. The blue dashed lines in Fig. 1E mark the 16 time point (32s) window and show the correlation of the two time series over this window. The window was then shifted by one time point (2 sec) and a new correlation value was calculated. For 296 time points in the data, the end result was a time series of 281 correlation values. Fisher's transform was used to convert correlation coefficients to z values for all analyses (Fig 1E). This voxel, which shows only a z=0.23 correlation to the seed voxel in the ten minute time series, shows a highly oscillatory correlation over time windows of all the lengths shown. The window duration acts as a low-pass filter and defines what frequencies of fluctuations are visible in later analysis steps.
Figure 1.
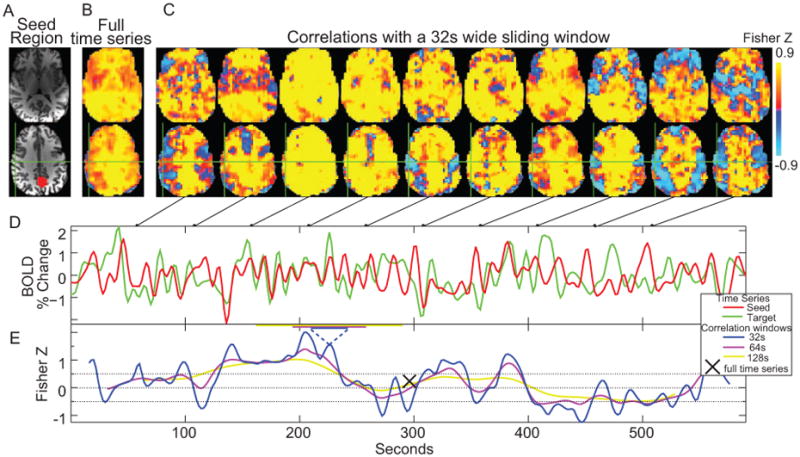
(A) Posterior Cingulate Seed (PCC) seed region that was used. Here it is shown on a high resolution anatomical image. (B) Correlation map created from the seed using the entire ten minute time series. (C) Correlation maps created over 32s temporal windows centered at the time points in the connected figures D and E. (D) Sample time series from the seed region (red) and a voxel at the green crosshairs (motor cortex region) (E) Correlation values over time for the sample time series using three different correlation windows with widths (32, 64, and 128 sec), showing that the temporal correlation varies significantly over time but shows minimal dependence on correlation window at the widths used.
Correlations to the PCC change across most brain voxels over time (Fig. 1 C). Many voxels shift between being correlated and anti-correlated to the PCC. For the volunteer shown in Fig. 1, 51% of brain voxels had a Z statistic less than -0.1 for at least 10% of the correlations calculated across time. Only 2% of brain voxels never had Z statistics below 0.
Power spectra were calculated on the correlation time series using Welch's method (Welch 1967). Several window sizes and overlaps were tested, but all of the presented data calculates spectra using 3 averaged Hamming windowed (with 10% tapering) periodograms with 192 time points each and 77% overlap. Even though the specific parameters are arbitrary, they allowed for some averaging while using all data in the correlation time series and keeping sufficiently narrow frequency bins to show distinct maps.
Phase Randomized Simulations
Since low frequency fluctuations may appear in sliding window correlation time series whether or not there is a true dynamic relationship between the two time series, we used simulations to test the likelihood our observed correlation fluctuations depend on the precise timing in our fMRI data. To generate time series as similar to our actual data as possible, we created seed and target time series by taking the inverse Fourier transform of the amplitude spectrum from real data (the absolute value of the discrete Fourier transform) combined with uniformly distributed phase spectrum. The advantage of this approach is that the resulting synthetic data looks very similar to our fMRI time series — it even retains the original time series' autoregressive properties — yet the precise timing of signal fluctuations in our seed and target time series are random. Thus, a correlation fluctuation that appears in these simulations does not represent dynamic connectivity changes between two time series. One can use these simulated data to create probability distributions and determine the likelihood that observed properties in the original fMRI data couldn't come from merely random event timing and are more likely to represent dynamic neuronal connectivity changes.
For the simulations, the phase randomization process was run on the time series after all preprocessing steps including the removal of cardiac & respiratory noise, and low frequency drifts. The phase randomized time series were low pass filtered at 0.1Hz before sliding window correlations were calculated.
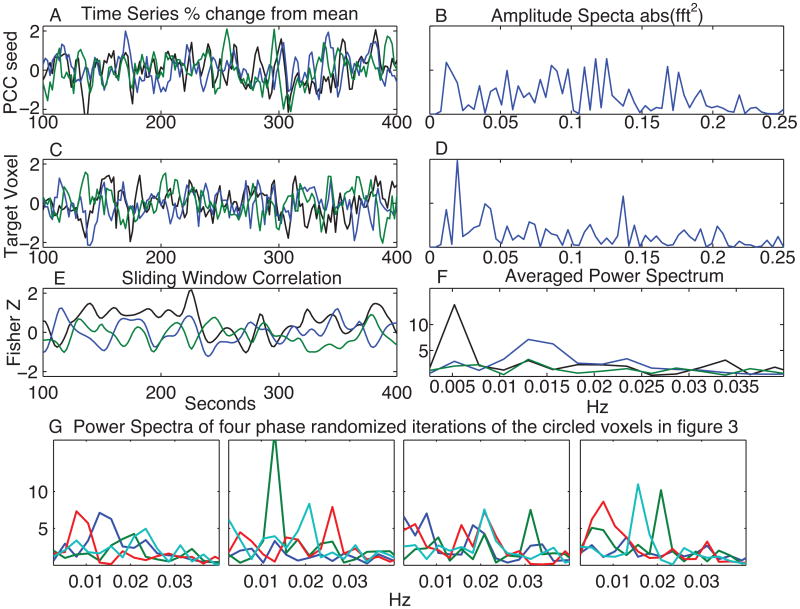
Figure 2A shows a segment of the PCC ROI time series from one volunteer in black and two time series with randomized phase in blue and green. Fig. 2C shows actual and simulated time series from a voxel in the blue circle in Fig. 3. Fig. 2B and 2D show the amplitude spectra for these series. These are identical for the original and phase randomized time series. For every time series pair, we calculated sliding window. The correlations for the time series in Fig 2A and C are shown in Fig 2E. Power spectra were calculated in the same way as with the original data (Fig. 2F).
Figure 2.
A demonstration of the phase randomization procedure. (A) A segment of the PCC ROI time series from a volunteer (black) and two phase randomized time series with the same amplitude spectra (blue and green). (B) The common amplitude spectra for the time series in A. (C) The time series from the voxel labeled with a blue circle in Figure 3 (black) and two phase randomized time series. (D) The common amplitude spectra for the time series in C. (E) Sliding window correlations between the time series in A and C. (F) The averaged power spectrum for E. (G) The averaged power spectra from four iterations of the phase randomization procedure using the time series of the voxels circled in Figure 3. The same color coding is used for these 4 power spectra
Figure 3.
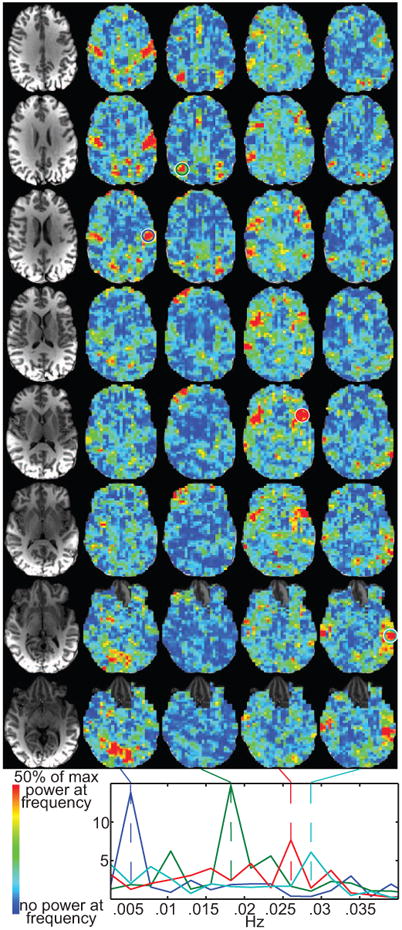
Example frequency maps from the same subject as shown in Fig. 1. The underlying correlation time series used a 16 time point (32 s) sliding window. The left column shows the anatomical slices for the frequency maps. Each frequency map shows the relative power across the brain at the frequency marked by the dashed lines at the bottom. The four colored circles surround the voxels from which the power spectra at the bottom were calculated.
We then calculated several spectral metrics, described in Results, on the actual correlation time series and the simulated iterations. For each metric, the distribution of the range of values that appeared in simulations was compared to the values in the actual data to give a probability that the actual value could appear by chance.
Results
Correlation Fluctuation Maps
For each volunteer, we calculated a power spectrum for the correlation time series as shown in Fig. 1C & E. The correlation time series are all based on a seed time series from the PCC. Fig. 3 shows example spatial maps of relative power magnitude from a single volunteer. Thus, a map for each frequency bin shows which regions have relatively more power at that frequency. For example, the power of correlation fluctuations (with the PCC) at 0.005 Hz is greater in primary sensorimotor cortex and primary visual cortex than the rest of the brain. At 0.018Hz, the inferior parietal lobe has more power. At 0.026 Hz, there is more power around the inferior frontal gyrus and insula along with part of the superior temporal and inferior parietal lobes. At 0.029 Hz, there is more power in the middle temporal gyrus. The power spectra at the bottom of Fig. 3 are from voxels with high relative power in each of the four maps. Voxels in different clusters have distinct spectral profiles. While the average correlation calculated for the entire time series of data generates only a single map of relationships to the PCC (i.e. Fig. 1B), using this sliding window approach, we were able to identify several distinct maps based solely on the frequency of the temporal fluctuations of their correlations to the PCC. These maps show that the correlation time series from other brain regions to the PCC seed fluctuate with distinct frequency profiles. Maps do not appear in all frequency bins of the power spectrum. Supplementary Fig 1 shows maps from the same slices and subject as Fig 3 for all frequency bins up to 0.055Hz. For this subject, visual inspection identified 17 of 54 frequency bins from 0-0.143Hz that contained spatially contiguous clusters that were mostly in gray matter and often showed bilateral symmetry. For this same range, there were 8-20 frequency bins with such clusters in each of the 12 subjects (mean 15.2).
We also examined whether these maps were sensitive to the window duration for the correlation calculations. Fig. 4 shows the same frequencies from the same subject as Fig. 4 for a single brain slice. Data are shown using 8-128s duration windows (4-64 time points). While shorter duration windows cause what looks like more fluctuations in the sliding window correlations (Fig. 1E), those fluctuations are at higher frequencies. The window duration is essentially a low pass filter. If the power spectrum frequency is within the filter's pass band, then the maps are similar regardless of filter duration (Fig 4). Only when a frequency is higher than resolvable with a long duration window, as in the bottoms right slices in Fig. 4, do the spatial maps significantly change. The 32s window used in the rest of this manuscript was an arbitrary selection, but was sufficiently long to remove some noise from the correlations without overly filtering potentially interesting frequencies.
Figure 4.
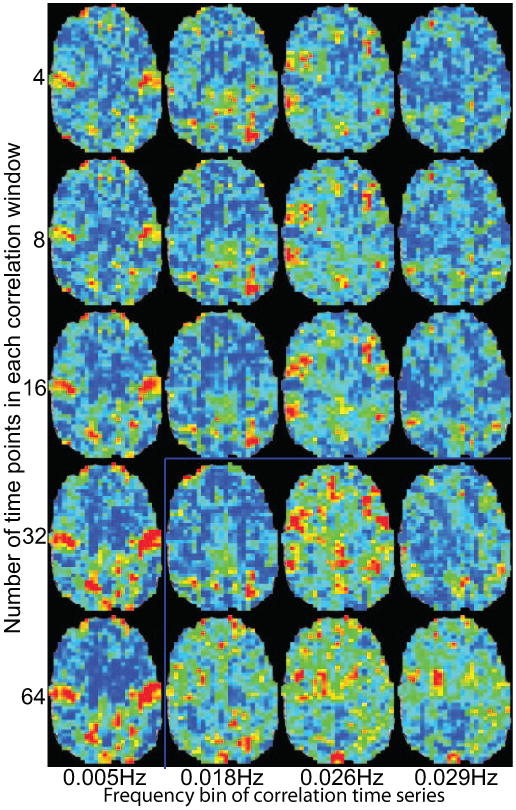
A single slice from example frequency maps in Fig. 2 calculated with different correlation window durations. Slices below and to the right of the blue lines are were the frequency of the correlation window is lower than the presented frequency from the power spectrum of the correlation time series. The color bar and scaling are the same as in Fig 2.
For 11 of the 12 volunteers, we collected two 10 min rest runs separated by other tasks (Murphy, Birn et al. 2009). We examined test-retest reliability by spatially correlating all combinations of frequencies between each person's two runs. The maps corresponding to similar frequencies were rarely the best correlated between the two runs and there was no clear or consistent pattern in which frequencies showed various spatial maps. We also identified the frequency maps in each volunteer that had the relatively higher power in primary sensorimotor cortex compared other regions. In 3 of 11 people the frequency that showed this map was within 0.003 Hz (a single frequency bin) between the two runs.
Although similar maps didn't consistently appear at the same frequencies of the temporal correlation change power spectrum, spatially consistent maps do reliably appear across volunteers, and some have patterns that resemble well known functional networks such as those for visual or sensorimotor processing. Every volunteer had maps at multiple frequencies that formed anatomically relevant clusters. Similar clusters appeared in multiple volunteers. To demonstrate this, we transferred the power spectra into a common space that was mapped to the Talairach-Tourneux atlas. For each anatomical clustering in subjects and frequencies, we used a combination of automated ranking based on spatial correlations and visual inspection to find frequencies in volunteers that showed similar combinations of brain regions. Figure 5 shows four anatomical clusters that appeared consistently across the population. Supplementary Figures 2-5 show the maps from each volunteer that were averaged to make the four rows in Fig. 5. While the supplementary figures show there is variation across these subjects, the averaged images show the inter-subject similarity.
Figure 5.
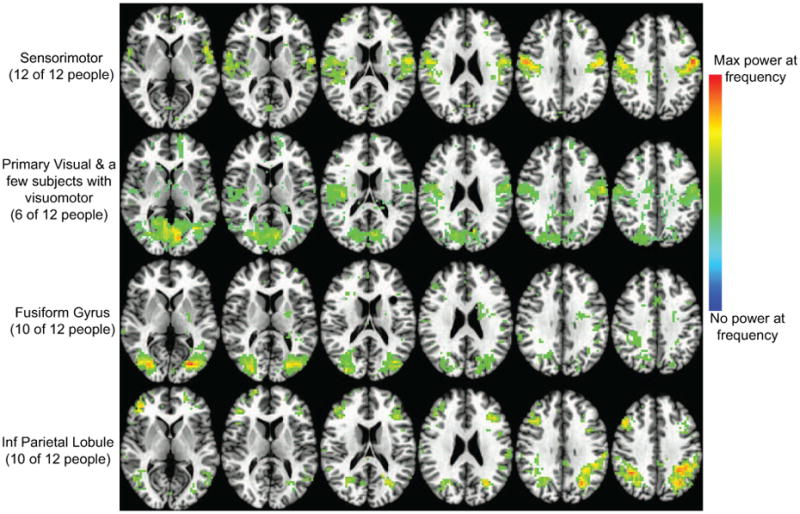
Four maps of clusters of regions that appear at a correlation frequency to the PCC across volunteers. Each row is a different map. The maximum power in each volunteer is scaled to 1 and then the maps are averaged across volunteers and thresholded to 20% of max power across the brain at the stated frequency. The anatomical slices are from the TT_N27 atlas normalized brain in AFNI.
Phase Randomized Simulations
While sliding window correlations of fMRI data clearly show spatial structure and sparse brain regions, our desire is to show that these correlations cannot be due to random processes. Figure 3 shows the power spectra from 4 voxels in a representative subject. The time series from these 4 voxels along with the PCC ROI were phase randomized for 10,000 iterations and the power spectra of the sliding window correlations were calculated for each iteration. Figure 2G shows spectra from 4 such iterations. With these phase randomizations, times series are no longer representative of dynamic changes in neural connectivity, Fig 2G sometimes shows frequency peaks and distinct frequencies for each voxel. While this demonstration shows that phased randomized fMRI data can produce correlation changes between regions, it does not imply that this is the case with fMRI data.
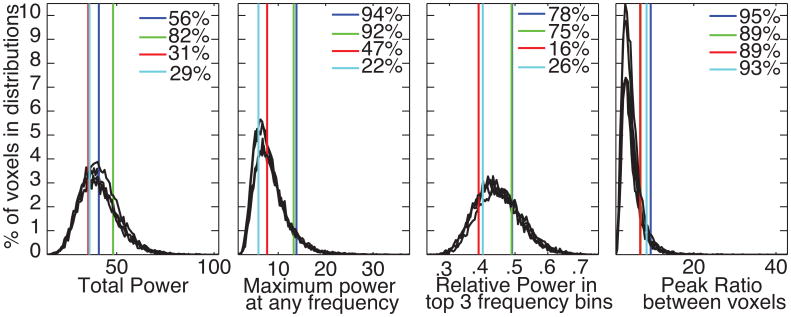
We defined several metrics, to quantify interesting aspects of the original power spectra. These metrics were calculated for each phase randomized iteration and the distributions were plotted in black in Figure 6. The metrics are:
Total Power – This is defined as the sum of power across all frequency bins of the power spectrum. Is this consistent across iterations?
Maximum power at any frequency – While the frequencies where specific brain regions clustered varied, if one could reliably find peak frequencies that clustered in anatomical regions. How often do these peaks appear at any frequency?
Relative power in the top 3 frequency bins – This is a less stringent version of maximum power that examines how much of the total power is contained in just a fraction of the frequency bins. This metric should be sensitive to a few distinct frequency peaks or a single, wide peak.
Peak ratio between voxels – When one looks at the maps and plots in figures 3-5, the results are not just about peak frequencies. They require the peak frequency in one anatomical region to be larger than others. This is what causes regional distinctions at different frequencies. We took these 4 voxels, which represent 4 different clusters of brain regions in a volunteer and, at each frequency, created a ratio of one spectrum's values to the mean of the other three spectra. The maximum ratio across all frequencies was recorded. This value is proportional to the ability to distinguish voxels by frequency. For each of these histograms, Fig. 6 also includes vertical lines marking the actual values from the 4 voxels, using the same color coding as in Fig. 3. For all 4 metrics, none of voxels were well outside values that occurred in the phase randomized distributions. For one voxel, the peak ratio between voxels was 95% p=0.05 without any multiple comparisons corrections.
Figure 6.
Histograms based on phase randomized simulations of the 4 voxels circled in figure 3 (black). There is a separate histogram based on simulations run for each voxel. Each metric defines an aspect of the histograms as defined in the manuscript text. The vertical colored lines are the actual values from each voxel and use the same colors as figure 3. Each subplot reports the percentiles for the actual data compared to the phase randomized distributions. The units for power calculations are the same as in figures, 2, 3, and 4.
To test these results across potentially significant voxels in the population, we identified high magnitude clusters in the subjects and frequency bins presented in Fig. 5 and supplementary figures 2-5. The peak magnitude voxel was selected from each cluster. For each volunteer, voxels were removed if the time series correlated at r>0.6. This made sure we didn't compare highly similar voxels. This procedure resulted in peak voxels in 19-136 clusters in each of the twelve volunteers (mean=70, median=71). 1000 phase randomized iterations were done for each voxel's time series. Sliding window correlations and the resulting power spectra were calculated between each time series and the PCC ROI from the same volunteer.
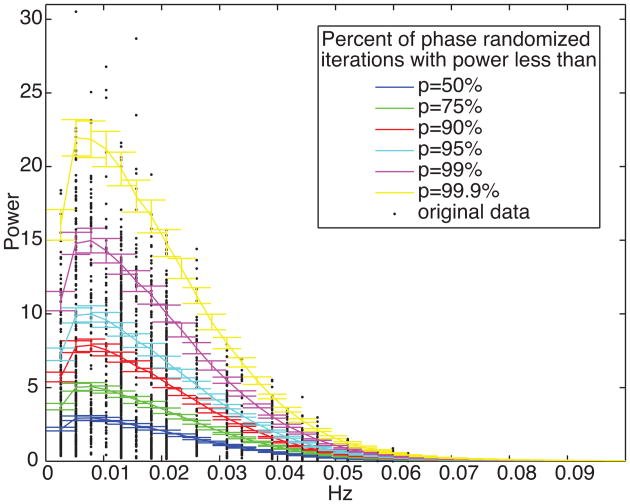
The same metrics presented in Fig 6. were calculated for these data and compared to the distributions from the phase randomized iterations. For the peak ratio between voxels, the magnitudes for the voxel of interest were compared to the magnitudes of voxels that weren't peaks in the same frequency bin. For total power, maximum power, relative power at the top 3 frequency bins, and peak ratio 0.6%, 0.5%, 0.1%, 0.1% of voxels crossed a p<0.001 significance threshold and 5.4%, 4.4%, 2.6%, and 2.9% of voxels crossed a p<0.01 significance threshold respectively. Figure 7 uses these phase randomized iterations to show the probability of various magnitudes occurring at each frequency. Each line is a different threshold from 50% (the median value) to 99.9% (i.e. p=0.01 significance). The black dots show the magnitudes from the original data at the frequencies were they were identified as the maximum magnitude in a cluster. Even though each of these voxels was selected for having a large magnitude, most are well within the phase randomized distributions.
Figure 7.
Percentile probability lines for amplitude at each frequency. Distributions were calculated using phase randomized time series from peak amplitude voxels in clusters from all volunteers. Distributions were calculated for each subject separately. The lines are the mean across subjects and the error bars show standard deviation. Black dots are the peak amplitudes and frequencies from the data that were used to create these simulations.
Discussion
We demonstrate a novel way to summarize information contained in the changing correlations between a reference seed and fMRI time series. This is a unique way to portray a potentially relevant aspect of the non-stationarity of correlation over time as a spatial map of the brain and is based on the observation that the correlations to anatomically clustered brain regions seem to fluctuate in a periodic manner. While the correlation frequencies of fluctuations where specific spatial maps appear are not consistent across individuals or runs, all volunteers show this effect. Brain regions were parcellated based on their relationship to a single seed time series.
In much of the existing literature on non-stationarity of connectivity over time, there is a general assumption that changes in how fMRI time series between brain regions connect over time represent changes in the neural interactions between these areas. For example, a similar analysis showed periodicity in sliding window correlations and interpreted these results as pairs of brain regions oscillating between correlations and anti-correlations (Hutchison, Womelsdorf et al. 2012). The results of our simulations show that such fluctuations can appear based solely on the frequency power spectra of brain regions' time series. If the temporal phase relationships between brain regions are unnecessary, then, without additional information, it would be premature to conclude that the observed fluctuations in correlations are due to changes in a seed region's interactions with the rest of the brain. For example, Petridou et. al. created activation time series based on discrete peaks in fMRI time series. By removing these discrete events from the data the periodicity of correlation fluctuations were reduced (Petridou, Gaudes et al. 2012). While this constitutes additional evidence of a neural basis for some of these fluctuations, the method removed some of the largest fluctuations in the original time series. Any method that removes signal peaks that are distinct to specific brain regions will affect the temporal relationships between those brain regions whether or not the method is correctly identifying neuronal fluctuations. Petridou et. al. show that their method sometimes aligns with electromyography, which makes it more likely some of these discrete events are neuronal.
If these results do not represent brain region interaction, a possible alternative explanation for our results is that the fMRI signal in each brain region is fluctuating at slightly different combinations of frequencies. Recent work has shown the different brain networks have distinct spectral profiles (He, Snyder et al. 2008; He, Zempel et al. 2010; Niazy, Xie et al. 2011). When correlations between brain regions are calculated over time, frequencies that are common across regions don't cause correlation fluctuations. When the remaining, different frequencies are correlated, they result in periodic fluctuations in the correlation time series that are similar to beat frequencies. It is the interaction of the distinct frequencies of the seed time series and the target region that might cause some of the power maps shown in figures 3-5. Since the frequency magnitude peaks for the sliding window time series remain even after randomizing phase, this implies that the effect is partially driven by distinct amplitude spectra in voxels. Thus, precise event timing isn't relevant. Even if the sliding window correlations don't definitively represent neural dynamics, the approach described in this manuscript may be highlighting frequency differences in networks that aren't easily visible.
An interesting challenge arises from this work. Based on the thousands of task paradigms that cause distinct patterns of brain activity and connectivity, we know that brain connectivity dynamics can change over time and that we can measure these changes with fMRI. It is extremely likely that neural connectivity changes happen even during rest. We present fluctuations that anatomically cluster and look like effects that could be neural in origin. Still the magnitudes of fMRI correlation changes to the PCC that exist during spontaneous brain activity are often lower than magnitude changes in structured noise (the phase randomized time series). Figure 7 includes a few voxels with more fluctuation power than is likely to occur in the null distribution. One might simply set a threshold at p<0.001 and interpret only the voxels above it as neuronally significant. Still, the observed data points in figure 7 are from the peaks of clusters representing the largest power magnitudes across the population. Since 99.9% of the null distribution covers almost all these values, this highlights the wide range of power magnitudes that can appear by chance. While one cannot identify the specific voxels that are neuronally significant, such a threshold is likely to produce many false negatives results. Since spurious correlation fluctuations can arise in many types of data, this issue is not limited to fMRI.
The challenge is finding better ways to identify clear markers of neural dynamics. For sliding window correlations, there might be multivariate metrics that distinguish spectra with neural origins. Frequency based connectivity methods, like time-frequency coherence analysis (Chang and Glover 2010), might not be sensitive to beat frequency effects or distinct amplitude spectra in the same way as correlation, but it is unclear how much fMRI data is needed to estimate robust and reliable time-frequency plots and which summary metrics are neuronally relevant.
Overall, these results clearly demonstrate that temporal correlations in the brain are not only highly dynamic, oscillatory, and perhaps transient, but that they can be mapped and probed further by temporal analyses of dynamic changes in correlation within a single time series. Much work remains to be performed to explain the mechanisms behind these dynamics as well as to identify when they represent dynamically interacting neuronal networks.
Supplementary Material
Acknowledgments
Some of these data were collected by K. Murphy and R.M. Birn. Comments from the handling editor, Stephen Smith, and anonymous reviewers significantly altered and improved this manuscript. Catie Chang gave advice and suggested useful references. This research was supported by the NIMH Intramural Research Program at NIH.
Footnotes
Publisher's Disclaimer: This is a PDF file of an unedited manuscript that has been accepted for publication. As a service to our customers we are providing this early version of the manuscript. The manuscript will undergo copyediting, typesetting, and review of the resulting proof before it is published in its final citable form. Please note that during the production process errors may be discovered which could affect the content, and all legal disclaimers that apply to the journal pertain.
References
- Beckmann CF, DeLuca M, et al. Investigations into resting-state connectivity using independent component analysis. Philosophical transactions of the Royal Society of London Series B, Biological sciences. 2005;360(1457):1001–1013. doi: 10.1098/rstb.2005.1634. [DOI] [PMC free article] [PubMed] [Google Scholar]
- Birn RM, Diamond JB, et al. Separating respiratory-variation-related fluctuations from neuronal-activity-related fluctuations in fMRI. Neuroimage. 2006;31(4):1536–1548. doi: 10.1016/j.neuroimage.2006.02.048. [DOI] [PubMed] [Google Scholar]
- Biswal B, Yetkin FZ, et al. Functional connectivity in the motor cortex of resting human brain using echo-planar MRI. Magn Reson Med. 1995;34(4):537–541. doi: 10.1002/mrm.1910340409. [DOI] [PubMed] [Google Scholar]
- Chang C, Glover GH. Time-frequency dynamics of resting-state brain connectivity measured with fMRI. Neuroimage. 2010;50(1):81–98. doi: 10.1016/j.neuroimage.2009.12.011. [DOI] [PMC free article] [PubMed] [Google Scholar]
- Cox RW. AFNI: software for analysis and visualization of functional magnetic resonance neuroimages. Computers and biomedical research, an international journal. 1996;29(3):162–173. doi: 10.1006/cbmr.1996.0014. [DOI] [PubMed] [Google Scholar]
- Fox MD, Snyder AZ, et al. The human brain is intrinsically organized into dynamic, anticorrelated functional networks. Proc Natl Acad Sci U S A. 2005;102(27):9673–9678. doi: 10.1073/pnas.0504136102. [DOI] [PMC free article] [PubMed] [Google Scholar]
- Gershunov A, Schneider N, et al. Low-frequency modulation of the ENSO-Indian monsoon rainfall relationship: Signal or noise? Journal of Climate. 2001;14(11):2486–2492. [Google Scholar]
- Glover GH, Li TQ, et al. Image-based method for retrospective correction of physiological motion effects in fMRI: RETROICOR. Magn Reson Med. 2000;44(1):162–167. doi: 10.1002/1522-2594(200007)44:1<162::aid-mrm23>3.0.co;2-e. [DOI] [PubMed] [Google Scholar]
- Greicius MD, Krasnow B, et al. Functional connectivity in the resting brain: a network analysis of the default mode hypothesis. Proc Natl Acad Sci U S A. 2003;100(1):253–258. doi: 10.1073/pnas.0135058100. [DOI] [PMC free article] [PubMed] [Google Scholar]
- He BJ, Snyder AZ, et al. Electrophysiological correlates of the brain's intrinsic large-scale functional architecture. Proceedings of the National Academy of Sciences of the United States of America. 2008;105(41):16039–16044. doi: 10.1073/pnas.0807010105. [DOI] [PMC free article] [PubMed] [Google Scholar]
- He BJ, Zempel JM, et al. The temporal structures and functional significance of scale-free brain activity. Neuron. 2010;66(3):353–369. doi: 10.1016/j.neuron.2010.04.020. [DOI] [PMC free article] [PubMed] [Google Scholar]
- Hutchison RM, Womelsdorf T, et al. Resting-state networks show dynamic functional connectivity in awake humans and anesthetized macaques. Human brain mapping. 2012 doi: 10.1002/hbm.22058. [DOI] [PMC free article] [PubMed] [Google Scholar]
- Jafri MJ, Pearlson GD, et al. A method for functional network connectivity among spatially independent resting-state components in schizophrenia. Neuroimage. 2008;39(4):1666–1681. doi: 10.1016/j.neuroimage.2007.11.001. [DOI] [PMC free article] [PubMed] [Google Scholar]
- Kang J, Wang L, et al. Characterizing dynamic functional connectivity in the resting brain using variable parameter regression and Kalman filtering approaches. Neuroimage. 2011;56(3):1222–1234. doi: 10.1016/j.neuroimage.2011.03.033. [DOI] [PubMed] [Google Scholar]
- Kitzbichler MG, Smith ML, et al. Broadband criticality of human brain network synchronization. PLoS computational biology. 2009;5(3):e1000314. doi: 10.1371/journal.pcbi.1000314. [DOI] [PMC free article] [PubMed] [Google Scholar]
- Majeed W, Magnuson M, et al. Spatiotemporal dynamics of low frequency fluctuations in BOLD fMRI of the rat. Journal of magnetic resonance imaging : JMRI. 2009;30(2):384–393. doi: 10.1002/jmri.21848. [DOI] [PMC free article] [PubMed] [Google Scholar]
- Murphy K, Birn RM, et al. The impact of global signal regression on resting state correlations: are anti-correlated networks introduced? Neuroimage. 2009;44(3):893–905. doi: 10.1016/j.neuroimage.2008.09.036. [DOI] [PMC free article] [PubMed] [Google Scholar]
- Niazy RK, Xie J, et al. Spectral characteristics of resting state networks. Progress in brain research. 2011;193:259–276. doi: 10.1016/B978-0-444-53839-0.00017-X. [DOI] [PubMed] [Google Scholar]
- Petridou N, Gaudes CC, et al. Periods of rest in fMRI contain individual spontaneous events which are related to slowly fluctuating spontaneous activity. Human brain mapping. 2012 doi: 10.1002/hbm.21513. [DOI] [PMC free article] [PubMed] [Google Scholar]
- Raichle ME. Time; Conference on Advances in Resting-State fMRI; Palo Alto, CA. 2009. [Google Scholar]
- Robinson LF, de la Pena VH, et al. Detecting shifts in correlation and variability with application to ENSO-monsoon rainfall relationships. Theoretical and Applied Climatology. 2008;94(3-4):215–224. [Google Scholar]
- Shirer WR, Ryali S, et al. Decoding subject-driven cognitive states with whole-brain connectivity patterns. Cerebral cortex. 2012;22(1):158–165. doi: 10.1093/cercor/bhr099. [DOI] [PMC free article] [PubMed] [Google Scholar]
- Smith SM, Miller KL, et al. Temporally-independent functional modes of spontaneous brain activity. Proceedings of the National Academy of Sciences of the United States of America. 2012;109(8):3131–3136. doi: 10.1073/pnas.1121329109. [DOI] [PMC free article] [PubMed] [Google Scholar]
- Van Dijk KR, Hedden T, et al. Intrinsic functional connectivity as a tool for human connectomics: theory, properties, and optimization. Journal of neurophysiology. 2010;103(1):297–321. doi: 10.1152/jn.00783.2009. [DOI] [PMC free article] [PubMed] [Google Scholar]
- Welch PD. The use of fast Fourier transform for the estimation of power spectra: A method based on time averaging over short, modified periodograms. IEEE Trans on Audio and Electroacoustics. 1967;15(2):70–73. [Google Scholar]
Associated Data
This section collects any data citations, data availability statements, or supplementary materials included in this article.


