

Abstract
Purpose
To characterize relationships between specific immune cell subsets in bone marrow (BM) or granulocyte colony-stimulating factor–mobilized peripheral blood (PB) stem cells collected from unrelated donors and clinical outcomes of patients undergoing transplantation in BMTCTN 0201.
Patients and Methods
Fresh aliquots of 161 BM and 147 PB stem-cell allografts from North American donors randomly assigned to donate BM or PB stem cells and numbers of transplanted cells were correlated with overall survival (OS), relapse, and graft-versus-host disease (GvHD).
Results
Patients with evaluable grafts were similar to all BMTCTN 0201 patients. The numbers of plasmacytoid dendritic cells (pDCs) and naïve T cells (Tns) in BM allografts were independently associated with OS in multivariable analyses including recipient and donor characteristics, such as human leukocyte antigen mismatch, age, and use of antithymocyte globulin. BM recipients of > median number of pDCs, naïve CD8+ T cells (CD8Tns), or naïve CD4+ T cells (CD4Tns) had better 3-year OS (pDCs, 56% v 35%; P = .025; CD8Tns, 56% v 37%; P = .012; CD4Tns, 55% v 37%; P = .009). Transplantation of more BM Tns was associated with less grade 3 to 4 acute GvHD but similar rates of relapse. Transplantation of more BM pDCs was associated with fewer deaths resulting from GvHD or from graft rejection. Analysis of PB grafts did not identify a donor cell subset significantly associated with OS, relapse, or GvHD.
Conclusion
Donor immune cells in BM but not PB stem-cell grafts were associated with survival after unrelated-donor allogeneic hematopoietic stem-cell transplantation. The biologic activity of donor immune cells in allogeneic transplantation varied between graft sources. Donor grafts with more BM-derived Tns and pDCs favorably regulated post-transplantation immunity in allogeneic hematopoietic stem-cell transplantation.
INTRODUCTION
Much of the clinical utility of allogeneic hematopoietic stem-cell transplantation (alloHSCT) in treating patients with hematologic malignancies depends on the graft-versus-leukemia (GvL) activity of donor T cells.1–3 Improving outcomes after alloHSCT requires understanding how the GvL or graft-versus-host disease (GvHD) functions of donor T cells are regulated, including interactions with donor or host dendritic cells (DCs) and homing to hematolymphoid or GvHD-target organs.1,4 Previous reports have suggested the content of donor DCs is associated with incidence of chronic GvHD and relapse,5 and the content of CD34+ cells is associated with survival6 and GvHD among peripheral blood (PB) stem-cell allograft recipients.7
To explore associations between cell subsets in the allograft with clinical outcomes in a prospective clinical trial, fresh aliquots of bone marrow (BM) and PB stem-cell grafts collected from unrelated volunteer donors recruited in BMTCTN (Blood and Marrow Transplant Clinical Trials Network) 0201 were analyzed for their content of CD34+ and immune cells. BMTCTN 0201 randomly assigned patients with myelodysplastic syndrome or leukemia to receive either BM or PB stem cells and demonstrated equivalent overall survival (OS), acute GvHD, and relapse rates in both arms, with significantly more chronic GvHD seen among recipients of PB stem-cell grafts.8 Results of preplanned analyses of graft constituents with outcomes suggest a significant association of the content of donor plasmacytoid DCs (pDCs) and naïve T cells (Tns) in BM grafts with transplantation outcomes—associations that were not seen among recipients of PB stem-cell grafts.
PATIENTS AND METHODS
Study Population
BMTCTN 0201 enrolled 551 pairs of unrelated donors and corresponding patients age < 66 years with a diagnosis of leukemia, myelodysplasia, or myelofibrosis for whom allogeneic transplantation was planned. Details of randomization, eligibility, and the statistical design of the study have been published previously.8 Our study included 308 of the 526 patients (59%) who underwent transplantation in BMTCTN 0201 and excluded transplantation recipients involving grafts acquired in Germany. Recipients of BM grafts had the entire graft infused (after RBC or plasma depletion, if required), whereas 84% of recipients of PB stem-cell grafts had a portion of the graft cryopreserved for possible donor leukocyte infusion. The final data set consisted of samples of 161 BM and 147 PB stem-cell allografts collected at North American donor centers and shipped at 4°C to a central laboratory for immediate analysis. The data set excluded samples without laboratory or clinical data necessary to calculate infused cell doses, samples that arrived too late at the central laboratory for analysis or failed quality control testing, and transplantation recipients without complete clinical data. Median follow-up among survivors was 36 months.
Analysis of Graft Constituents
Studies were conducted according to the BMTCTN manual of procedures on graft characterization. Bead-based quantitation of CD34+ progenitor cells was performed by staining up to 10 million leukocytes for 10 minutes at room temperature with a stem-cell antibody panel (CD34 PE, CD45 FITC, 7AAD, and CD38 APC), followed by ammonium chloride–potassium buffer lysis of RBCs and addition of equal volume of phosphate-buffered saline without washing (lyse no-wash assay), and adding fluorescent counting beads (Perfect Count Beads; Life Technologies, Carlsbad, CA) just before evaluation by flow cytometry. Phenotyping of B cells, natural killer cells, T cells, and DCs9 was performed by staining samples with antibody panels (Appendix Table A1, online only) at room temperature for 30 minutes followed by a 10-minute lysis of RBCs and washing and pelleting cells twice before resuspending in 500 μL of staining media (Appendix Fig A1, online only). Subsets of lymphocytes and DCs are listed in Appendix Table A2 (online only).
Statistical Analyses
The primary objective of the study was to correlate cell subsets in the graft with OS. Because the appropriate cut point was not known for individual graft cell subsets, the sample of PB stem-cell and BM recipients was divided into those who survived ≥ 1 year and those who died in the first year, because nearly all deaths occurred within the first year. Median values of cells transplanted per kilogram for graft cell subsets of interest were then described separately for survivors and those who died and compared using a nonparametric Mann-Whitney Wilcoxon test. To reduce the number of comparisons, and because several of these measurements were strongly correlated with one another, preliminary analysis was restricted to 46 cell subsets that were not strongly correlated with one another (Pearson's or Spearman correlation > 0.8). We used the false discovery rate criterion (q) to screen for cell subsets and selected only those with a q value < 0.15 for further investigation.10,11 Finally, for graft cell subsets of interest, Kaplan-Meier estimates of the survival curves and cumulative incidence estimates for competing risk end points (acute GvHD, chronic GvHD, treatment-related mortality [TRM], and relapse) based on dichotomizing the values above or below the median were constructed. Hazard ratios (HRs) and 95% CIs from univariable and multivariable Cox models were constructed.
RESULTS
Characteristics of Transplantation Recipients
The demographics and characteristics of the final study patients and their BM or PB stem-cell grafts are listed in Table 1. There were no significant differences between the recipients of BM and PB stem-cell grafts analyzed in this study, and both groups reflected the demographics of those randomly assigned in BMTCTN 0201 (data not shown). As was true for all patients enrolled onto BMTCTN 0201, OS was similar among the recipients of BM versus PB stem-cell grafts included in this study (Appendix Fig A2, online only).
Table 1.
Demographic Characteristics of BMTCTN 0201 Patients and Donors for Whom Cellular Constituents of Grafts Were Characterized
| Variable | Bone Marrow (n = 161) |
Peripheral Blood Stem Cells (n = 147) |
||
|---|---|---|---|---|
| No. | % | No. | % | |
| Recipient sex | ||||
| Male | 86 | 53.4 | 85 | 57.8 |
| Female | 75 | 46.6 | 62 | 42.2 |
| Recipient age, years | ||||
| 0-10 | 6 | 3.7 | 2 | 1.4 |
| 11-20 | 16 | 9.9 | 6 | 4.1 |
| 21-30 | 30 | 18.6 | 29 | 19.7 |
| 31-40 | 23 | 14.3 | 28 | 19.0 |
| 41-50 | 29 | 18.0 | 33 | 22.4 |
| 51-60 | 36 | 22.4 | 33 | 22.4 |
| ≥ 60 | 21 | 13.0 | 16 | 10.9 |
| CMV status | ||||
| Positive | 88 | 54.7 | 67 | 45.6 |
| Negative | 72 | 44.7 | 80 | 54.4 |
| Missing | 1 | 0.6 | 0 | 0 |
| Karnofsky performance status, % | ||||
| 90-100 | 107 | 66.5 | 88 | 59.9 |
| < 90 | 41 | 25.5 | 43 | 29.3 |
| Missing | 13 | 8.1 | 16 | 10.9 |
| Primary disease at enrollment | ||||
| Acute myelogenous leukemia | 68 | 42.2 | 78 | 53.1 |
| Acute lymphoblastic leukemia | 40 | 24.8 | 30 | 20.4 |
| Chronic myelogenous leukemia | 16 | 9.9 | 21 | 14.3 |
| Myelodysplastic syndrome | 35 | 21.7 | 15 | 10.2 |
| Chronic myelomonocytic leukemia | 1 | 0.6 | 1 | 0.7 |
| Agnogenic myeloid metaplasia with myelofibrosis | 1 | 0.6 | 2 | 1.4 |
| Disease risk | ||||
| Low | 122 | 75.8 | 105 | 71.4 |
| High | 39 | 24.2 | 42 | 28.6 |
| Interval from diagnosis to treatment, months | ||||
| ≤ 6 | 58 | 36.0 | 55 | 37.4 |
| 6-12 | 41 | 25.5 | 41 | 27.9 |
| > 12 | 61 | 37.9 | 51 | 34.7 |
| Unknown | 1 | 0.6 | 0 | 0.0 |
| Conditioning regimen | ||||
| C-TBI | 75 | 46.6 | 70 | 47.6 |
| Bu-Cy | 49 | 30.4 | 42 | 28.6 |
| Flu-Bu-ATG | 29 | 18.0 | 25 | 17.0 |
| Flu-Mel | 8 | 5.0 | 10 | 6.8 |
| GvHD prophylaxis regimen | ||||
| Cyclosporine/methotrexate | 39 | 24.2 | 26 | 17.7 |
| Tacrolimus/methotrexate | 108 | 67.1 | 112 | 76.2 |
| Other | 14 | 8.7 | 9 | 6.1 |
| Donor sex | ||||
| Male | 109 | 67.7 | 93 | 63.3 |
| Female | 52 | 32.3 | 54 | 36.7 |
| Donor CMV status | ||||
| Positive | 53 | 32.9 | 56 | 38.1 |
| Negative | 108 | 67.1 | 91 | 61.9 |
| Donor age, years | ||||
| 18-30 | 68 | 42.2 | 57 | 38.8 |
| 31-40 | 53 | 32.9 | 43 | 29.3 |
| 41-50 | 34 | 21.1 | 35 | 23.8 |
| 51-60 | 5 | 3.1 | 12 | 8.2 |
| Missing | 1 | 0.6 | 0 | 0 |
| No. of HLA mismatches at HLA-A, -B, -C, -DRB1 | ||||
| 0 | 121 | 75.1 | 118 | 80.3 |
| 1 | 32 | 19.9 | 27 | 18.4 |
| 2 | 6 | 3.7 | 2 | 1.4 |
| 3 | 2 | 1.2 | 0 | 0 |
Abbreviations: BMTCT, Blood and Marrow Clinical Trials Network; Bu-Cy, busulfan and cyclophosphamide; CMV, cytomegalovirus; C-TBI, cyclophosphamide and total-body irradiation; Flu-Bu-ATG, fludarabine, busulfan, and antithymocyte globulin; Flu-Mel, fludarabine and melphalan; GvHD, graft-versus-host disease.
Donor Characteristics
Donors from whom BM or PB stem-cell grafts were collected were similar to recipients with regard to sex, cytomegalovirus serostatus, age, and number of HLA mismatches (Table 1). Of note, 20% to 25% of donors were HLA mismatched, with most mismatches occurring at a single HLA locus.
Graft Characteristics
As expected, numbers of nucleated cells transplanted into recipients of the PB stem-cell grafts were approximately three-fold higher than cells infused into BM recipients (median, 780 v 260 × 106 cells/kg; Appendix Table A3, online only). In addition, PB stem-cell recipients received a median of 4.2 × 10⁶ CD34+ cells/kg versus a median of 2.8 × 10⁶ CD34+ cells/kg among recipients of BM grafts (P = .003). The T-cell content of the PB stem-cell grafts was approximately 10-fold higher than that of BM grafts; the content of pDCs was only two-fold higher among recipients of PB stem-cell grafts compared with BM grafts (0.6 v 0.3 × 10⁶ cells/kg). Numbers of other transplanted cells were proportionally greater in PB stem-cell than BM grafts (Appendix Table A3, online only).
Content of pDCs and Tns in BM Grafts Associated With Improved OS
Analysis of the association of the dose of transplanted cells with 1-year survival among recipients of BM transplantations identified two cell subsets of interest (pDCs and naïve CD8+ T cells [CD8Tns]) as being potentially associated with post-transplantation survival based on q values of 0.128 for each. We also included the results of an analysis of naïve CD4+ T cells (CD4Tns) because of their strong correlation with CD8Tns and similar findings. BM transplantation recipients who survived 1 year received more pDCs (0.4 × 10⁶ cells/kg) compared with deceased patients (0.2 × 10⁶ cells/kg; P = .006). Surviving BM patients had also received more Tns (median, 1.7 × 10⁶ CD8Tns/kg and 3.5 × 10⁶ CD4Tns/kg) compared with deceased patients (median, 1.0 × 10⁶ CD8Tns/kg and 1.8 × 10⁶ CD4Tns/kg; P = .004 and .018, respectively). Of note, neither the content of transplanted CD34+ cells (median, 2.5 v 2.8 × 10⁶ cells/kg) nor the total number of T cells (median, 23.6 v 22.7 × 10⁶/kg) was significantly different between deceased BM transplantation recipients and those who survived 1 year. No cell subset from PB stem-cell grafts was significantly associated with 1-year OS. In particular, patients who survived to 1 year after transplantation had received a median of 13.3 × 10⁶ CD8Tns/kg and 0.5 × 10⁶ pDCs/kg compared with transplanted cell doses of 13.5 × 10⁶ CD8Tns/kg and 0.83 × 10⁶ pDCs/kg among deceased PB stem-cell allograft recipients (P > .05). Multivariable analysis of individual cell subsets and ratios of Tns to total T cells, pDCs to total viable nucleated cells, and pDCs to T cells showed better OS among BM recipients of higher ratios of pDCs to viable nucleated cells Tns to T cells (Fig 1A). Analysis of PB stem-cell recipients showed a trend toward better OS among recipients of higher ratios of Tns to T cells that was not statistically significant; there was no indication that ratio of pDCs to nucleated cells or pDCs to T cells was associated with OS in recipients of PB grafts (Fig 1B). Multivariable analyses of other cell ratios listed in Appendix Table A3 (online only; eg, T regulatory cells [Tregs] to CD4 T cells, natural killer T cells to T cells, and memory T cells to T cells) did not reveal an association with relapse or GvHD in recipients of either graft type (data not shown). Subsequent analyses of associations of grafts constituents with clinical outcomes were therefore limited to BM graft recipients.
Fig 1.

Significant association between content of cells in bone marrow (BM) and granulocyte colony-stimulating factor–mobilized peripheral blood (PB) stem-cell grafts with overall survival (OS) among those undergoing allogeneic transplantation with unrelated donor. Multivariable analysis showing hazard ratios (HRs) for OS based on content of viable nucleated cells (VNCs), CD34+ cells, B cells, natural killer (NK) cells, T cells (T), and dendritic cells (DCs) as well as calculated ratios of cell subsets in graft. (A) Multivariable analysis of BM graft constituents. (B) Multivariable analysis of PB graft constituents. CD4Tn, naïve CD4+ T cell; CD8Tn, naïve CD8+ T cell; mDC, myeloid dendritic cell; pDC, plasmacytoid dendritic cell; Tn, naïve T cell; Treg, T regulatory cell.
Recipients of More pDCs in BM Grafts Had Less TRM and Improved Long-Term OS
Three-year OS for BM recipients receiving > the median number of donor pDCs (0.3 × 10⁶ cells/kg) was 56% versus 35% for those patients who received < the median number (P = .025; Fig 2A). Incidence curves for TRM (Fig 2B) show increased early mortality among recipients of a smaller number of pDCs in the graft but no significant effect on relapse (Fig 2C), acute GvHD (Fig 2D), or chronic GvHD (Fig 2E). Multivariable analyses of the association of donor pDCs with OS, disease-free survival (DFS), relapse, TRM, and chronic and acute GvHD are shown graphically as HRs in Figure 2F. Patients who received > the median number of pDCs had improved OS and DFS and less TRM compared with patients who received fewer pDCs. Of note, there were significantly fewer deaths resulting from graft rejection and from GvHD among patients who received > the median number of pDCs in BM grafts compared with recipients of fewer pDCs (Table 2).
Fig 2.

Larger numbers of donor plasmacytoid dendritic cells (pDCs) in bone marrow (BM) graft are associated with improved survival and decreased treatment-related mortality (TRM) after allogeneic transplantation with unrelated donor. (A) Estimated probability of 3-year overall survival (OS), stratifying 143 evaluable recipients of BM grafts by median number of transplanted donor pDCs; (B) incidence of TRM; (C) incidence of relapse; (D) incidence of grade 3 to 4 acute graft-versus-host disease (aGvHD); (E) incidence of chronic GvHD; and (F) multivariable analysis showing hazard ratio of content of pDCs in BM graft with aGvHD, chronic GvHD, TRM, relapse, disease-free survival, and OS. P values in (A) to (E) represent log-rank tests for patients undergoing transplantation with number of pDCs < or > median value of 0.3 × 10⁶ cells/kg. P values in (F) represent results of multivariable analysis, as described in Patients and Methods.
Table 2.
Causes of Death Among Deceased BM Transplantation Recipients Stratified by Content of pDCs, CD4Tns, and CD8Tns in Graft
| Cause of Death | Content of pDCs in BM Allograft* |
|||
|---|---|---|---|---|
| < 0.3 × 10⁶/kg (n = 71) |
> 0.3 × 10⁶/kg (n = 72) |
|||
| No. | % of 46 Deaths | No. | % of 33 Deaths | |
| Relapse | 21 | 46 | 22 | 67 |
| Graft rejection | 5 | 11 | 0 | 0 |
| Acute GvHD | 6 | 13 | 2 | 6 |
| Chronic GvHD | 5 | 11 | 3 | 9 |
| Infection | 3 | 7 | 1 | 3 |
| Other | 6 | 13 | 5 | 15 |
| Total | 46 | 100 | 33 | 100 |
| Content of CD4Tns in BM Allograft† |
||||
|---|---|---|---|---|
| < 2.6 × 10⁶/kg (n = 66) |
> 2.6 × 10⁶/kg (n = 63) |
|||
| No. | % of 44 Deaths | No. | % of 26 Deaths | |
| Relapse | 22 | 50 | 17 | 65 |
| Graft rejection | 1 | 2 | 1 | 4 |
| Acute GvHD | 6 | 14 | 1 | 4 |
| Chronic GvHD | 4 | 9 | 4 | 15 |
| Infection | 5 | 11 | 0 | 0 |
| Other | 6 | 14 | 3 | 12 |
| Total | 44 | 100 | 26 | 100 |
| Content of CD8Tns in BM Allograft‡ |
||||
|---|---|---|---|---|
| < 1.3 × 10⁶/kg (n = 67) |
> 1.3 × 10⁶/kg (n = 62) |
|||
| No. | % of 44 Deaths | No. | % of 26 Deaths | |
| Relapse | 20 | 46 | 19 | 73 |
| Graft rejection | 2 | 5 | 0 | 0 |
| Acute GvHD | 7 | 16 | 0 | 0 |
| Chronic GvHD | 5 | 11 | 3 | 12 |
| Infection | 5 | 11 | 0 | 0 |
| Other | 5 | 11 | 4 | 15 |
| Total | 44 | 100 | 26 | 100 |
Abbreviations: BM, bone marrow; CD4Tn, naïve CD4+ T cell; CD8Tn, naïve CD8+ T cell; GvHD, graft-versus-host disease; pDC, plasmacytoid dendritic cell.
Recipients of BM allografts analyzed for content of pDCs (n = 143) were stratified according to median number of pDCs transplanted per kilogram.
Recipients of BM allografts analyzed for content of CD4Tns (n = 129) were stratified according to median number of CD4Tns transplanted per kilogram.
Recipients of BM allografts analyzed for content of CD8Tns (n = 129) were stratified according to median number of CD8Tns transplanted per kilogram.
Recipients of More Tns in BM Grafts Had Less TRM and Acute GvHD and Improved Long-Term OS
OS was significantly associated with a higher content of CD8Tns and CD4Tns (HR, 0.51 and 0.48; P = .01 and .007, respectively), as was a reduction in TRM (HR for death, 0.3 and 0.4; P = .01 and .035, respectively) and grade 3 to 4 acute GvHD (HR, 0.3 and 0.27; P = .04 and .012, respectively). Representing these associations graphically, patients who received > the median number of 1.3 × 10⁶ CD8Tns/kg had a probability of 3-year OS of 56% compared with 37% among patients who received fewer CD8Tns/kg (Fig 3A). TRM was significantly higher among patients who received < the median number of CD8Tns (Appendix Fig A3, online only); there was no association with relapse (Appendix Fig A3, online only). Incidence of grade 3 to 4 acute GvHD was significantly higher among patients who received < the median number of CD8Tns compared with patients who received more CD8Tns (Fig 3B). Of note, the incidence of chronic GvHD at 2 years was not significantly higher (55%) among patients who received more CD8Tns, compared with 25% incidence among a larger number of surviving patients who received transplantations with fewer CD8Tns (Appendix Fig A3, online only). Results of a multivariable analysis for the association of the content of CD8Tns with clinical outcomes are shown in Figure 3C. Analysis of the same clinical outcomes with respect to CD4Tns in BM grafts yielded similar survival and incidence curves for OS, TRM, relapse, and acute and chronic GvHD in univariable and multivariable analyses (Fig 3D to 3F; Appendix Fig A3, online only). There were significantly fewer deaths resulting from acute GvHD (P = .03) among patients receiving > the median number of CD4Tns or CD8Tns in BM grafts compared with recipients of fewer Tns (Table 2). Additional phenotypic analysis suggested that transplantation of more BM CD4+ and CD8+ T cells expressing CD45RA, CCR7, and CD62L (Tns), CD127 (interleukin-7 receptor), and Ki-67 (proliferating T cells) was associated with better survival. Patients who survived > 1 year after transplantation received a median number of 2.6 × 10⁶ CD45RA+/CCR7+/CD62L+ CD4Tns/kg and 0.9 × 10⁶ CD45RA+/CCR7+/CD62L+ CD8Tns/kg compared with corresponding median values of 1.2 and 0.4 × 10⁶/kg for CD4Tn and CD8Tn subsets among patients who died within the first year after transplantation (P = .006 and .003, respectively). These data suggest that transplanting activated Tns expressing interleukin-7 receptor and receptors targeting high endothelial venules (CD62L) and lymph nodes (CCR7) is associated with improved survival among recipients of BM grafts from unrelated donors.
Fig 3.

Larger numbers of donor naïve T cells (Tns) in bone marrow (BM) graft are associated with improved survival, decreased treatment-related mortality (TRM), and decreased grade 3 to 4 acute graft-versus-host disease (aGvHD) after allogeneic transplantation with unrelated donor. Estimated probability of 3-year overall survival (OS), stratifying 129 evaluable recipients of BM grafts by median number of transplanted donor (A) naïve CD8+ T cells (CD8Tns) or (B) naïve CD4+ T cells (CD4Tns). Incidence of TRM stratified by content of donor (B) CD8Tns or (E) CD4Tns. Multivariable analysis showing hazard ratio of content of (C) CD8Tns or (F) CD4Tns in BM graft with aGvHD, chronic GvHD (cGvHD), TRM, relapse, disease-free survival (DFS), and OS. P values in (A), (B), (D), and (E) represent log-rank tests for survival of patients undergoing transplantation with number of CD8Tns or CD4Tns < or > median value of 1.3 × 10⁶ cells/kg or 2.6 × 10⁶ cells/kg, respectively. P values in (C) and (F) represent results of multivariable analysis, as described in Patients and Methods.
Independent Effect of Donor-Naïve T Cells and pDCs on Transplantation Outcomes After Unrelated-Donor BM Transplantation
OS for the BM transplantation recipients who received > the median numbers of both CD8Tns and pDCs was superior to that of groups receiving more of one and less of the other cell subsets or < the median number of both cell subsets (Fig 4). This exploratory analysis suggested that there was no interaction between the numbers of either cell subsets in the graft (P = .9), but the small numbers in each subgroup precluded formal analysis of interactions between the groups.
Fig 4.

Overall survival (OS) of bone marrow (BM) transplantation recipients stratified by content of both naïve CD8+ T cells (CD8Tns) and plasmacytoid dendritic cells (pDCs) in BM graft. Estimated probability of 3-year OS, stratifying 129 evaluable recipients of BM grafts by median number of transplanted donor CD8Tns and pDCs into four groups: patients who received > median number of both cell subsets (red line), patients who received > median number of one cell subset and < median number of other cell subset (gold and gray lines), and patients who received < median number of both cell subsets (blue line).
DISCUSSION
Analysis of the association of cell subsets among > 300 patients undergoing transplantation in BMTCTN 0201 suggests significant associations of the content of pDCs, CD4Tns, and CD8Tns with OS among patients who received BM grafts. The study population was representative of recent transplantation practices (2003 to 2009) for patients receiving myeloablative conditioning regimens, and the demographics and clinical outcomes of patients whose grafts were available for analysis were similar to all patients enrolled onto BMTCTN 0201. Strengths of our study include enrollment of a large number of patients across multiple sites and prospective analysis of fresh aliquots of donor grafts. Findings from our study are relevant to the immunology of hematopoietic cell transplantation; more BM transplantations are performed because of lower rates of chronic GvHD.8 However, conclusions from this study may not be applicable to patients with more advanced malignancies or those undergoing nonmyeloablative conditioning regimens.
One significant difference between BM and PB stem-cell grafts is that PB stem-cell grafts contain 10-fold more T cells than BM grafts, despite having similar numbers of CD34+ cells and DC subsets. To explore whether the relative number of cell subsets might show an association with OS, we examined ratios of different graft cell subsets and OS in recipients of BM and PB stem cells. We found significantly less mortality in BM recipients who received grafts with a higher ratio of Tns to T cells and a nonsignificant trend favoring a higher ratio of Tns to T cells in PB stem-cell grafts. Although Tns per kilogram were higher in BM grafts from younger donors, multivariable models that showed an effect of Tns per kilogram on OS, relapse, and GvHD were adjusted for donor age. Although pDC content and ratio of pDCs to T cells were significantly associated with survival among BM recipients, there was no suggestion of an association between ratio of pDCs to T cells in PB stem-cell grafts and survival. Notably, BM grafts had a higher ratio of pDCs to T cells than PB stem-cell grafts (Appendix Table A3, online only). The salutatory effect of pDCs in BM may thus reflect the relatively higher proportions of pDCs compared with total T cells in the graft.
Another explanation for the lack of a significant association between the content of donor immune cells with transplantation outcomes in recipients of PB stem-cell grafts is that phenotypically defined cell subsets in BM and PB stem-cell grafts have distinct immune functions. The finding that the content of pDCs from BM but not PB stem-cell grafts is associated with less GvHD and graft rejection is supported by murine studies in which immature CCR9+ pDCs are tolerogenic12 and immunosupressive13 compared with more mature pDCs from granulocyte colony-stimulating factor–mobilized blood.14 Analysis of chemokine expression on murine pDCs suggests CCR9 expression is necessary for pDCs to home to sites of inflammation,15 and recent studies have suggested chemokine receptor expression varies between pDCs from BM versus PB stem-cell grafts (unpublished data, S. Hosoba and E. Waller, 2014). Although an earlier report on BM transplantation from HLA-matched siblings found that more donor pDCs were associated with more relapse and less chronic GvHD,5 our study found that transplantation of more donor BM–derived pDCs in BMTCTN 0201 was associated with decreased TRM and graft rejection, with a trend toward fewer deaths resulting from GvHD. A consistent finding from both studies is that donor pDCs reduced alloimmunity (GvL and/or GvHD) of donor T cells. BMTCTN differed from the earlier study from our institution in the use of HLA-mismatched unrelated rather than HLA-matched donors; also, fewer patients with chronic myelogenous leukemia underwent transplantation (who were sensitive to the GvL activity of donor T cells) in BMTCTN 0201.16 The finding that pDCs modulate the alloreactivity of host cells is corroborated by preclinical observations from murine BM transplantation studies and human kidney allogeneic transplantations, in which donor pDCs have homed to and expanded in the lymph nodes of transplantation recipients,17,18 facilitating donor allograft survival19,20 and stem-cell engraftment.19 Murine studies have shown that interferon gamma–induced expression of indoleamine 2,3-dioxygenase in donor pDCs regulates post-transplantation immunity,21,22 limiting GvHD by generating Tregs23 without inhibiting GvL activity of donor T cells.18 Thus, donor pDCs may modulate both donor and host T-cell alloreactivity and attenuate both donor-versus-graft and GvHD reactions. Of note, pDCs are the primary source of interferon alfa in response to viral infections,24 and a study correlating donor pDCs with post-transplantation infections is under way.
A weakness of our study is that associations of particular cell subsets in the grafts with survival or GvHD could represent chance or the effect of another highly correlated cell subset. The independent association of both CD4Tns and CD8Tns with transplantation outcomes makes a chance error less likely, but the high correlation between the content of both Tn subsets obscures the distinction between effects of CD4Tns versus CD8Tns on transplantation outcomes. Findings that the content of CD4Tns and CD8Tns is associated with OS and severe acute GvHD are in contrast with a body of work from murine models of BM transplantation that suggests donor splenic Tns are responsible for acute GvHD.25–27 Explanations for the difference between our clinical data and that from murine studies include species differences for Tns in post-transplantation immunology, as has been observed in other systems,28–30 and the fact that source of T cells can affect their alloreactivity, such that that BM T cells cause less GvHD than the peripheral T cells typically used in murine studies.31 In our study, among recipients of more CD4Tns and CD8Tns, there were fewer deaths resulting from infection, graft rejection, or GvHD, suggesting donor Tns contributed to reconstitution of normal immune function. Although transplantation of allogeneic Tregs has been associated with protection from severe acute GvHD,18 direct measurement of Treg content in the BM grafts in this study did not suggest a significant association with OS. In conclusion, on the basis of these results, additional clinical studies to evaluate BM-derived pDCs and Tns in alloHSCT are warranted.
Supplementary Material
Acknowledgment
We thank the patients and unrelated donors who participated in BMTCTN 0201, the clinical teams who acquired bone marrow and granulocyte colony-stimulating factor–mobilized blood graft from consenting participants, the clinical research data coordinators and managers, and the BMTCTN protocol review team.
Appendix
Table A1.
Antibody Panels Used to Characterize Cellular Subsets in Aliquots of BM and G-CSF–Mobilized PB Stem-Cell Allografts From Donors Enrolled Onto BMTCTN 0201
| Immune Subset Panels | Tube No. | FL1 | FL2 | FL3 | FL4 | FL5 | FL6 | FL7 |
|---|---|---|---|---|---|---|---|---|
| T-cell subsets | 1 | CD8 FITC | CD27 PE | 7AAD | CD69 Cy7-PE | CD3 PE-Alx610 | CD25 APC | CD4 Cy7-APC |
| NK and γ/δ T cells | 2 | CD8 FITC | CD56 PE | 7AAD | CD16 Cy7-PE | CD3 PE-Alx610 | TCR γ/δ APC | CD8 Cy7-APC |
| CD4/CD8 T cells (Ki67) | 3 | CD45RA FITC | Ki-67 PE | CD8 PerCP | CCR7 Cy7-PE | CD3 PE-Alx610 | CD62L APC | CD4 Cy7-APC |
| CD4/CD8 T cells (CD127) | 4 | CD45RA FITC | CD127 PE | CD8 PerCP | CCR7 Cy7-PE | CD3 PE-Alx610 | CD62L APC | CD4 Cy7-APC |
| B cells | 5 | CD5 FITC | CD27 PE | 7AAD | CD19 Cy7-PE | CD3 PE-Alx610 | CD14 APC | HLD-DR CY7-APC |
| Activated T cells and Tregs | 7 | CD8 FITC | foxp3 PE | — | CD69 Cy7-PE | CD3 PE-Alx610 | CD25 APC | CD4 Cy7-APC |
| Isotype controls | 8 | IgG FITC | IgG PE | 7AAD | IgG Cy7-PE | IgG PE-Alx610 | IgG APC | IgG Cy7-APC |
NOTE. Eight seven-color flow cytometry analysis tubes were prepared from fresh (nonfrozen) aliquot of each graft product shipped overnight at 4°C from collection center. Analysis of plasmayctoid and myeloid dendritic cell subsets used commercial cocktail of lineage antibodies (Becton Dickson, Mountain View, CA), as previously described.9
Abbreviations: APC, allophycocyanin; BM, bone marrow; BMTCTN, Blood and Marrow Clinical Trials Network; FITC, fluorescein; G-CSF, granulocyte colony-stimulating factor; IgG, immunoglobulin G; NK, natural killer; PB, peripheral blood; PE, phycoerythrin; PerCP, peridinin chlorophyll; Treg, T regulatory cell.
Table A2.
Hematopoietic Cell Subsets Enumerated in Aliquots of BM and G-CSF–Mobilized PB Stem-Cell Allografts From Donors Enrolled Onto BMTCTN 0201
| Selected Cell Subsets | Tube No. | Phenotype | Subset Definition |
|---|---|---|---|
| T-cell subsets | 1 | CD3+ | T cells |
| CD3+ CD4+ | CD4 T cells | ||
| CD3+ CD8+ | CD8 T cells | ||
| CD3+ CD25+ | CD25+ T cells | ||
| CD3+ CD25+ CD69+ | Activated T cells | ||
| CD3+ CD4+ CD8- CD69+ | Activated CD4 T cells | ||
| CD3+ CD4− CD8+ CD69+ | Activated CD8 T cells | ||
| CD3+ CD4+ CD8− CD25+ CD69+ | IL-2R++ activated CD4 T cells | ||
| CD3+ CD4− CD8+ CD25+ CD69+ | IL-2R++ activated CD8 T cells | ||
| CD3+ CD4+ CD8− CD25+ CD27+ CD69− | Regulatory T-cell compartment | ||
| NK and γ/δ T cells | 2 | CD3− CD4− CD8+ | CD8+ NK cells |
| CD3− CD16+ CD56+ | NK cells | ||
| CD3+ CD56+ | NK-T cells | ||
| CD3+ γδTCR+ | γ/δ T cells | ||
| CD3+ γδTCR+ CD8+ | CD8+ γ/δ T cells | ||
| CD3+ γδTCR+ CD56+ | CD56+ γ/δ T cells | ||
| CD3− CD16− CD56+ | CD16− NK cells | ||
| T-cell subsets | 3 and 4 | CD3+ | T cells |
| CD3+ CD127+ | IL-7R+ T cells | ||
| CD3+ Ki67+ | Proliferating T cells | ||
| CD3+ CD4+ | CD4 T cells | ||
| CD3+ CD8+ | CD8 T cells | ||
| CD3+ CD4+ CD127+ | IL-7R+ CD4+ T cells | ||
| CD3+ CD4 Ki67+ | Proliferating CD4+ T cells | ||
| CD3+ CD8+ CD127+ | IL-7R+ CD8+ T cells | ||
| CD3+ CD8+ Ki67+ | Proliferating CD4+ T cells | ||
| CD3+ CD4+ CD45RA+ CD62L+ | Naïve CD4 T cells | ||
| CD3+ CD4+ CD45RA− CD62L+ | Central memory CD4 T cells | ||
| CD3+ CD4+ CD45RA− CD62L− | Effector memory CD4 T cells | ||
| CD3+ CD4+ CD45RA+ CD62L− | Terminal effector memory CD4 T cells | ||
| CD3+ CD8+ CD45RA+ CD62L+ | Naïve CD8 T cells | ||
| CD3+ CD8+ CD45RA− CD62L+ | Central memory CD8 T cells | ||
| CD3+ CD8+ CD45RA− CD62L− | Effector memory CD8 T cells | ||
| CD3+ CD8+ CD45RA+ CD62L− | Terminal effector memory CD8 T cells | ||
| CD3+ CD4+ CD45RA+ CD62L+ CCR7+ CD127± | Triple-positive naïve CD4 T cells | ||
| CD3+ CD8+ CD45RA+ CD62L+ CCR7+ CD127± | Triple-positive naïve CD8 T cells | ||
| B cells | 5 | CD3− CD19+ CD14− | B cells |
| CD3− CD19+ CD14− CD27+ | Activated B cells | ||
| CD3− CD5+ CD14− CD19+ | B1 B cells | ||
| CD3− CD5+ CD14− CD19+ CD27+ | Activated B1 B cells | ||
| DCs | 6 | CD3− Lin− HLADR+ CD16− CD123lo CD11c+ | mDC precursors |
| CD3− Lin− HLADR+ CD16− CD123+ CD11c− | pDC precursors | ||
| CD3− CD16+ HLADR+ Lin− | CD16+ DC | ||
| Activated T cells and Tregs | 7 | CD3+ | T cells |
| CD3+ CD4+ | CD4 T cells | ||
| CD3+ CD8+ | CD8 T cells | ||
| CD3+ CD25+ | CD25+ T cells | ||
| CD3+ CD25+ CD69+ | Activated T cells | ||
| CD3+ CD4+ CD8− CD69+ | Activated CD4 T cells | ||
| CD3+ CD4− CD8+ CD69+ | Activated CD8 T cells | ||
| CD3+ CD4+ CD8− CD25+ CD69+ | IL-2R++ activated CD4 T cells | ||
| CD3+ CD4− CD8+ CD25+ CD69+ | IL-2R++ activated CD8 T cells | ||
| CD3+ CD4+ CD8− CD25+ foxp3+ CD69− | Regulatory T cells |
NOTE. Phenotype of NK cell, T-cell, B-cell, and DC subsets (analyzed according to markers in flow cytometry panels in Appendix Table A1) are shown with description of subset to right.
Abbreviations: BM, bone marrow; BMTCTN, Blood and Marrow Clinical Trials Network; DC, dendritic cell; G-CSF, granulocyte colony-stimulating factor; IL, interleukin; PB, peripheral blood; mDC, myeloid dendritic cell; NK, natural killer; pDC, plasmacytoid dendritic cell; Treg, T regulatory cell.
Table A3.
Median and Interquartile Range of No. of Hematopoietic Progenitors and Immune Cells Transplanted in Recipients of BM and PB Stem-Cell Grafts
| Cell Subset | BM |
PB Stem Cells |
P | ||||
|---|---|---|---|---|---|---|---|
| No. | Median | IQR | No. | Median | IQR | ||
| Nucleated cells | 161 | 259 | 205-331 | 136 | 778 | 486-1,144 | < .001 |
| CD34+ progenitors | 157 | 2.8 | 1.9-4.5 | 131 | 4.2 | 1.9-7.8 | .003 |
| CD38− | 148 | 0.11 | 0.06-0.26 | 130 | 0.07 | 0.03-0.14 | < .001 |
| BAAA+ | 98 | 1.7 | 0.67-2.1 | 100 | 3 | 0.82-6.2 | < .001 |
| T cells | 148 | 23 | 14-32 | 132 | 246 | 131-409 | < .001 |
| CD4+ T cells | 148 | 12 | 6.7-17 | 132 | 148 | 83-274 | < .001 |
| Naïve | 129 | 2.6 | 0.89-4.7 | 107 | 31 | 3.9-80 | < .001 |
| Central memory | 127 | 3.2 | 1.3-6.2 | 107 | 27 | 7-56 | < .001 |
| Effector memory | 128 | 2.3 | 0.96-4.6 | 107 | 32 | 3.9-73 | < .001 |
| TEMRA | 128 | 1.7 | 0.6-3.4 | 108 | 14 | 2.4-51 | < .001 |
| Tregs | 146 | 2.2 | 0.68-6.3 | 132 | 30 | 8-92 | < .001 |
| CD69+ (activated) | 147 | 0.73 | 0.42-1.2 | 132 | 2 | 0.67-5.1 | < .001 |
| CD25+ | 148 | 2.7 | 0.87-7.6 | 132 | 31 | 8.7-102 | < .001 |
| Ki67+ (proliferating) | 104 | 0.28 | 0.14-0.48 | 62 | 0.75 | 0.24-2 | .001 |
| IL-7 receptor positive | 130 | 7.5 | 3.3-13 | 109 | 117 | 45-185 | < .001 |
| CD8+ T cells | 130 | 9.2 | 5.3-13 | 112 | 67 | 30-117 | < .001 |
| Naïve | 129 | 1.3 | 0.55-2.1 | 107 | 13 | 1.9-39 | < .001 |
| Central memory | 129 | 0.28 | 0.13-0.61 | 109 | 3.2 | 0.45-7.9 | < .001 |
| Effector memory | 129 | 3.3 | 1.6-5 | 108 | 13 | 3.7-23 | < .001 |
| TEMRA | 129 | 3.3 | 2-5.5 | 108 | 24 | 6-47 | < .001 |
| CD69+ (activated) | 144 | 2 | 1.2-3.4 | 132 | 2.3 | 0.80-4.9 | .442 |
| Ki67+ (proliferating) | 103 | 0.16 | 0.05-0.36 | 61 | 0.36 | 0.11-1.2 | .004 |
| IL-7 receptor positive | 130 | 3.8 | 1.9-7.2 | 111 | 40 | 10-72 | < .001 |
| Gamma delta T cells | 145 | 0.63 | 0.29-1.28 | 127 | 5.2 | 2-10 | < .001 |
| CD8+ | 144 | 0.16 | 0.06-0.28 | 127 | 0.65 | 0.23-1.7 | < .001 |
| CD56+ | 142 | 0.04 | 0.02-0.13 | 126 | 0.53 | 0.13-1.3 | < .001 |
| NK T cells | 145 | 2.5 | 0.71-8.4 | 127 | 14 | 4.4-102 | < .001 |
| B cells | 146 | 8.3 | 5.5-14 | 131 | 48 | 21-97 | < .001 |
| CD69+ (activated) | 146 | 1.2 | 0.64-2.1 | 130 | 8.5 | 3.6-17 | < .001 |
| CD5+ CD69+ (activated) | 136 | 0.15 | 0.06-0.25 | 124 | 0.77 | 0.19-1.7 | < .001 |
| CD16+/CD56++ | 144 | 1.2 | 0.71-2.5 | 127 | 16 | 6.5-27 | < .001 |
| CD16−/CD56+ | 145 | 0.66 | 0.36-1.2 | 127 | 2.4 | 1.2-4.6 | < .001 |
| CD8+ | 145 | 1.1 | 0.61-2.1 | 127 | 11 | 4.5-17 | < .001 |
| DCs | |||||||
| mDCs | 144 | 0.41 | 0.12-1.16 | 122 | 0.58 | 0.18-1.3 | .175 |
| pDCs | 143 | 0.31 | 0.17-0.66 | 122 | 0.56 | 0.19-2.1 | < .001 |
| CD16+ | 56 | 0.007 | 0.002-0.061 | 46 | 0.054 | 0.013-0.28 | < .001 |
| Relative concentrations | |||||||
| Naïve CD4/CD4 T cells | 120 | 24% | 10%-38% | 105 | 28% | 12%-45% | .478 |
| Naïve CD8/CD8 T cells | 118 | 14% | 8%-25% | 105 | 28% | 9.5%-56% | < .001 |
| Naïve T/T cells | 120 | 18% | 8.9%-29% | 103 | 27% | 13%-42% | .015 |
| pDCs/T cells | 132 | 1.7% | 0.85%-2.6% | 119 | 0.39% | 0.12%-0.86% | < .001 |
| pDCs/NCs | 143 | 0.15% | 0.06%-0.24% | 121 | 0.09% | 0.04%-0.22% | .031 |
| Central memory CD4/CD4 T cells | 119 | 19% | 11%-32% | 105 | 25% | 11%-41% | .254 |
| Central memory CD8/CD8 T cells | 118 | 3.6% | 1.6%-6.7% | 107 | 6.2% | 1.4%-14% | .046 |
| Gamma delta T cell/T cells | 133 | 3.1% | 1.6%-5.3% | 124 | 2.1% | 1.3%-4% | .005 |
| Treg/CD4 T cells | 146 | 26% | 7.3%-64% | 132 | 32% | 7.5%-65% | .519 |
| NK T cells/T cells | 133 | 11% | 3.9%-34% | 124 | 9.4% | 2.5%-50% | .801 |
NOTE. Nos. of cells transplanted represent 106 cells/kg for each specified subset. P values comparing No. of cells transplanted in BM versus PB stem-cell grafts are based on Mann-Whitney Wilcoxon test. Relative concentrations of cells in graft are shown as percentages in bottom portion of table. Quality control procedures compared content of total T cells analyzed in separate tubes using different antibody panels and excluded samples in which frequency of T cells was > 10% more or less than mean frequency of T cells based on all panels/tubes analyzed for that sample (Appendix Tables A1 and A2). No. columns represent Nos. of samples evaluable for each cell subset or relative concentration of cells in BM or PB stem-cell grafts. Analysis of Tregs and ratio of Tregs to CD4 T cells used larger No. of evaluable samples from panel 1, in which Tregs were defined as CD3+ CD4+ CD69− CD25+ CD27+. BAAA is fluorescent substrate for ALDH, which diffuses into intact and viable cells. In presence of ALDH, BAAA is converted into fluorescent reaction product BODIPY-aminoacate, which is retained inside cells.
Abbreviations: ALDH, Aldehyde dehydrogenase; BAAA+, BODIPY-amino acetaldehyde; BM, bone marrow; DC, dendritic cell; IQR, interquartile range; mDC, myeloid dendritic cell; NC, nucleated cell; NK, natural killer; PB, peripheral blood; pDC, plasmacytoid dendritic cell; TEMRA, T-cell effector memory, CD45RA positive; Treg, T regulatory cell.
Fig A1.

Flow cytometry dot plots of representative data showing phenotype of CD34+ cells, dendritic cells, T regulatory cells (Tregs), and memory and naïve T-cell (Tn) subsets for single patient in donor peripheral blood (PB) apheresis sample (A to F) and donor bone marrow (BM) from participants in BMTCTN (Blood and Marrow Transplant Clinical Trials Network) 0201 (G to L). Cell populations of interest are shown gated with gold polygons. (A, G) Samples are gated on forward scatter and side scatter (SSC), with percentage of CD34+ stem cells shown as fraction of CD45lo/+ 7AAD− population. (B, H) Percentages of CD11c+ myeloid and CD123+ plasmacytoid dendritic cells as fraction of lineage-negative (CD3, CD14, CD16, CD19, CD20) HLA DR+ population are shown. (C, I) Data shown are gated on CD27+, CD69− PB and BM T cells and show percentage of CD4+ T cells with Treg phenotype CD3+ CD4+ CD27+ CD69− CD25+. (D, J) Percentages of central memory and Tn subsets within total population of CD3+ T cells are shown. (E, F, K, L) Expression of CCR7 and CD127 (interleukin-7 receptor) on central memory and Tn subsets from the previously gated subsets in (D) and (J). (F, L) CD45RA+, CD62L+, and CCR7+ triple-positive Tn populations are shown.
Fig A2.
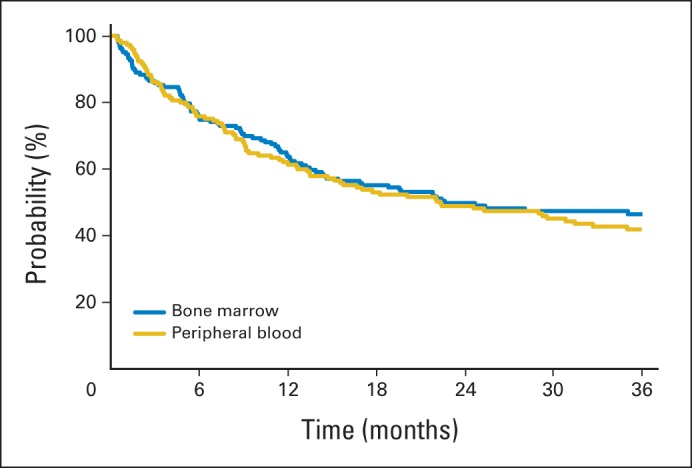
Overall survival among recipients enrolled onto BMTCTN (Blood and Marrow Transplant Clinical Trials Network) 0201 for whom graft samples were analyzed.
Fig A3.

Larger numbers of donor naïve T cells (Tns) in bone marrow (BM) grafts are associated with decreased incidence of severe acute graft-versus-host disease (GvHD) after allogeneic transplantation with unrelated donor without significant effect on relapse or chronic GvHD. Incidence of grade 3 to 4 acute GvHD stratifying 129 evaluable recipients of BM grafts by median number of transplanted donor (A) naïve CD8+ T cells (CD8Tns) or (B) naïve CD4+ T cells (CD4Tns). Incidence of chronic GvHD stratified by content of donor (B) CD8Tns or (E) CD4Tns. Incidence of relapse stratified by content of donor (C) CD8Tns or (F) CD4Tns.
Footnotes
Supported by Grant No. U10HL069294 from the National Heart, Lung, and Blood Institute; by the National Cancer Institute, Department of the Navy, Office of Naval Research, and National Marrow Donor Program; and by the German Bone Marrow Donor Center (enrollment support).
Any views, opinions, findings, conclusions, or recommendations expressed in this material are those of the authors and do not reflect the views or the official policies or positions of the parties providing support.
Authors' disclosures of potential conflicts of interest and author contributions are found at the end of this article.
AUTHORS' DISCLOSURES OF POTENTIAL CONFLICTS OF INTEREST
The author(s) indicated no potential conflicts of interest.
AUTHOR CONTRIBUTIONS
Conception and design: Edmund K. Waller, Dennis L. Confer, Claudio Anasetti
Provision of study materials or patients: David L. Porter, Oleg I. Krijanovski
Collection and assembly of data: Edmund K. Waller, Steven M. Devine, David L. Porter, Shin Mineishi, John M. McCarty, Corina E. Gonzalez, Thomas R. Spitzer, Oleg I. Krijanovski, Michael L. Linenberger, Ann Woolfrey
Data analysis and interpretation: Edmund K. Waller, Brent R. Logan, Steven M. Devine, David L. Porter, Shin Mineishi, Thomas R. Spitzer, Michael L. Linenberger, Ann Woolfrey, Claudio Anasetti
Manuscript writing: All authors
Final approval of manuscript: All authors
REFERENCES
- 1.Anderson BE, McNiff JM, Jain D, et al. Distinct roles for donor- and host-derived antigen-presenting cells and costimulatory molecules in murine chronic graft-versus-host disease: Requirements depend on target organ. Blood. 2005;105:2227–2234. doi: 10.1182/blood-2004-08-3032. [DOI] [PubMed] [Google Scholar]
- 2.Duffner UA, Maeda Y, Cooke KR, et al. Host dendritic cells alone are sufficient to initiate acute graft-versus-host disease. J Immunol. 2004;172:7393–7398. doi: 10.4049/jimmunol.172.12.7393. [DOI] [PubMed] [Google Scholar]
- 3.Durakovic N, Bezak KB, Skarica M, et al. Host-derived Langerhans cells persist after MHC-matched allografting independent of donor T cells and critically influence the alloresponses mediated by donor lymphocyte infusions. J Immunol. 2006;177:4414–4425. doi: 10.4049/jimmunol.177.7.4414. [DOI] [PubMed] [Google Scholar]
- 4.Sackstein R. A revision of Billingham's tenets: The central role of lymphocyte migration in acute graft-versus-host disease. Biol Blood Marrow Transplant. 2006;12(suppl 1):2–8. doi: 10.1016/j.bbmt.2005.09.015. [DOI] [PubMed] [Google Scholar]
- 5.Waller EK, Rosenthal H, Jones TW, et al. Larger numbers of CD4(bright) dendritic cells in donor bone marrow are associated with increased relapse after allogeneic bone marrow transplantation. Blood. 2001;97:2948–2956. doi: 10.1182/blood.v97.10.2948. [DOI] [PubMed] [Google Scholar]
- 6.Heimfeld S. Bone marrow transplantation: How important is CD34 cell dose in HLA-identical stem cell transplantation? Leukemia. 2003;17:856–858. doi: 10.1038/sj.leu.2402893. [DOI] [PubMed] [Google Scholar]
- 7.Przepiorka D, Weisdorf D, Martin P, et al. 1994 Consensus conference on acute GVHD grading. Bone Marrow Transplant. 1995;15:825–828. [PubMed] [Google Scholar]
- 8.Anasetti C, Logan BR, Lee SJ, et al. Peripheral-blood stem cells versus bone marrow from unrelated donors. N Engl J Med. 2012;367:1487–1496. doi: 10.1056/NEJMoa1203517. [DOI] [PMC free article] [PubMed] [Google Scholar]
- 9.Olweus J, BitMansour A, Warnke R, et al. Dendritic cell ontogeny: A human dendritic cell lineage of myeloid origin. Proc Natl Acad Sci U S A. 1997;94:12551–12556. doi: 10.1073/pnas.94.23.12551. [DOI] [PMC free article] [PubMed] [Google Scholar]
- 10.Benjamini Y, Hochberg Y. Controlling the false discovery rate: A practical and powerful approach to multiple testing. J R Stat Soc Series B Stat Methodol. 1995;57:289–300. [Google Scholar]
- 11.Storey JD. A direct approach to false discovery rates. J R Stat Soc Series B Stat Methodol. 2002;64:479–498. [Google Scholar]
- 12.Hadeiba H, Sato T, Habtezion A, et al. CCR9 expression defines tolerogenic plasmacytoid dendritic cells able to suppress acute graft-versus-host disease. Nat Immunol. 2008;9:1253–1260. doi: 10.1038/ni.1658. [DOI] [PMC free article] [PubMed] [Google Scholar]
- 13.Rutella S, Danese S, Leone G. Tolerogenic dendritic cells: Cytokine modulation comes of age. Blood. 2006;108:1435–1440. doi: 10.1182/blood-2006-03-006403. [DOI] [PubMed] [Google Scholar]
- 14.Banovic T, Markey KA, Kuns RD, et al. Graft-versus-host disease prevents the maturation of plasmacytoid dendritic cells. J Immunol. 2009;182:912–920. doi: 10.4049/jimmunol.182.2.912. [DOI] [PubMed] [Google Scholar]
- 15.Wendland M, Czeloth N, Mach N, et al. CCR9 is a homing receptor for plasmacytoid dendritic cells to the small intestine. Proc Natl Acad Sci U S A. 2007;104:6347–6352. doi: 10.1073/pnas.0609180104. [DOI] [PMC free article] [PubMed] [Google Scholar]
- 16.Kolb HJ, Mittermüller J, Clemm C, et al. Donor leukocyte transfusions for treatment of recurrent chronic myelogenous leukemia in marrow transplant patients. Blood. 1990;76:2462–2465. [PubMed] [Google Scholar]
- 17.Li JM, Southerland LT, Lu Y, et al. Activation, immune polarization, and graft-versus-leukemia activity of donor T cells are regulated by specific subsets of donor bone marrow antigen-presenting cells in allogeneic hemopoietic stem cell transplantation. J Immunol. 2009;183:7799–7809. doi: 10.4049/jimmunol.0900155. [DOI] [PMC free article] [PubMed] [Google Scholar]
- 18.Lu Y, Giver CR, Sharma A, et al. IFN-γ and indoleamine 2,3-dioxygenase signaling between donor dendritic cells and T cells regulates graft versus host and graft versus leukemia activity. Blood. 2012;119:1075–1085. doi: 10.1182/blood-2010-12-322891. [DOI] [PMC free article] [PubMed] [Google Scholar]
- 19.Cardenas PA, Huang Y, Ildstad ST. The role of pDC, recipient T(reg) and donor T(reg) in HSC engraftment: Mechanisms of facilitation. Chimerism. 2011;2:65–70. doi: 10.4161/chim.2.3.17588. [DOI] [PMC free article] [PubMed] [Google Scholar]
- 20.Leventhal J, Abecassis M, Miller J, et al. Tolerance induction in HLA disparate living donor kidney transplantation by donor stem cell infusion: Durable chimerism predicts outcome. Transplantation. 2013;95:169–176. doi: 10.1097/TP.0b013e3182782fc1. [DOI] [PMC free article] [PubMed] [Google Scholar]
- 21.King NJ, Thomas SR. Molecules in focus: Indoleamine 2,3-dioxygenase. Int J Biochem Cell Biol. 2007;39:2167–2172. doi: 10.1016/j.biocel.2007.01.004. [DOI] [PubMed] [Google Scholar]
- 22.Jasperson LK, Bucher C, Panoskaltsis-Mortari A, et al. Indoleamine 2,3-dioxygenase is a critical regulator of acute graft-versus-host disease lethality. Blood. 2008;111:3257–3265. doi: 10.1182/blood-2007-06-096081. [DOI] [PMC free article] [PubMed] [Google Scholar]
- 23.Sela U, Olds P, Park A, et al. Dendritic cells induce antigen-specific regulatory T cells that prevent graft versus host disease and persist in mice. J Exp Med. 2011;208:2489–2496. doi: 10.1084/jem.20110466. [DOI] [PMC free article] [PubMed] [Google Scholar]
- 24.Colonna M, Trinchieri G, Liu YJ. Plasmacytoid dendritic cells in immunity. Nat Immunol. 2004;5:1219–1226. doi: 10.1038/ni1141. [DOI] [PubMed] [Google Scholar]
- 25.Anderson BE, Taylor PA, McNiff JM, et al. Effects of donor T-cell trafficking and priming site on graft-versus-host disease induction by naïve and memory phenotype CD4 T cells. Blood. 2008;111:5242–5251. doi: 10.1182/blood-2007-09-107953. [DOI] [PMC free article] [PubMed] [Google Scholar]
- 26.Chen BJ, Cui X, Sempowski GD, et al. Transfer of allogeneic CD62L− memory T cells without graft-versus-host disease. Blood. 2004;103:1534–1541. doi: 10.1182/blood-2003-08-2987. [DOI] [PubMed] [Google Scholar]
- 27.Giver CR, Li JM, Hossain MS, et al. Reconstructing immunity after allogeneic transplantation. Immunol Res. 2004;29:269–282. doi: 10.1385/IR:29:1-3:269. [DOI] [PubMed] [Google Scholar]
- 28.Seok J, Warren HS, Cuenca AG, et al. Genomic responses in mouse models poorly mimic human inflammatory diseases. Proc Natl Acad Sci U S A. 2013;110:3507–3512. doi: 10.1073/pnas.1222878110. [DOI] [PMC free article] [PubMed] [Google Scholar]
- 29.Shay T, Jojic V, Zuk O, et al. Conservation and divergence in the transcriptional programs of the human and mouse immune systems. Proc Natl Acad Sci U S A. 2013;110:2946–2951. doi: 10.1073/pnas.1222738110. [DOI] [PMC free article] [PubMed] [Google Scholar]
- 30.Mestas J, Hughes CC. Of mice and not men: Differences between mouse and human immunology. J Immunol. 2004;172:2731–2738. doi: 10.4049/jimmunol.172.5.2731. [DOI] [PubMed] [Google Scholar]
- 31.Zeng D, Hoffmann P, Lan F, et al. Unique patterns of surface receptors, cytokine secretion, and immune functions distinguish T cells in the bone marrow from those in the periphery: Impact on allogeneic bone marrow transplantation. Blood. 2002;99:1449–1457. doi: 10.1182/blood.v99.4.1449. [DOI] [PubMed] [Google Scholar]
Associated Data
This section collects any data citations, data availability statements, or supplementary materials included in this article.