

Abstract
Motivation: Imputation using external reference panels (e.g. 1000 Genomes) is a widely used approach for increasing power in genome-wide association studies and meta-analysis. Existing hidden Markov models (HMM)-based imputation approaches require individual-level genotypes. Here, we develop a new method for Gaussian imputation from summary association statistics, a type of data that is becoming widely available.
Results: In simulations using 1000 Genomes (1000G) data, this method recovers 84% (54%) of the effective sample size for common (>5%) and low-frequency (1–5%) variants [increasing to 87% (60%) when summary linkage disequilibrium information is available from target samples] versus the gold standard of 89% (67%) for HMM-based imputation, which cannot be applied to summary statistics. Our approach accounts for the limited sample size of the reference panel, a crucial step to eliminate false-positive associations, and it is computationally very fast. As an empirical demonstration, we apply our method to seven case–control phenotypes from the Wellcome Trust Case Control Consortium (WTCCC) data and a study of height in the British 1958 birth cohort (1958BC). Gaussian imputation from summary statistics recovers 95% (105%) of the effective sample size (as quantified by the ratio of association statistics) compared with HMM-based imputation from individual-level genotypes at the 227 (176) published single nucleotide polymorphisms (SNPs) in the WTCCC (1958BC height) data. In addition, for publicly available summary statistics from large meta-analyses of four lipid traits, we publicly release imputed summary statistics at 1000G SNPs, which could not have been obtained using previously published methods, and demonstrate their accuracy by masking subsets of the data. We show that 1000G imputation using our approach increases the magnitude and statistical evidence of enrichment at genic versus non-genic loci for these traits, as compared with an analysis without 1000G imputation. Thus, imputation of summary statistics will be a valuable tool in future functional enrichment analyses.
Availability and implementation: Publicly available software package available at http://bogdan.bioinformatics.ucla.edu/software/.
Contact: bpasaniuc@mednet.ucla.edu or aprice@hsph.harvard.edu
Supplementary information: Supplementary materials are available at Bioinformatics online.
1 INTRODUCTION
Genome-wide association studies (GWAS) are the prevailing approach for finding disease risk loci, having successfully identified thousands of variants associated to complex phenotypes (Hindorff et al., 2009). An important component of the GWAS analysis toolkit is genotype imputation, an approach that leverages publicly available data [e.g. 1000 Genomes (1000G; The 1000 Genomes Project Consortium, 2012)] to estimate genotypes at markers untyped in the study to increase power for finding new risk loci (Browning and Browning, 2007; Howie et al., 2012; Li et al., 2010; Marchini and Howie, 2010a). In addition to GWAS, genotype imputation is a key component in meta-analysis of studies that use different genotyping platforms, where single nucleotide polymorphisms (SNPs) that were genotyped in one study can be imputed in the other studies, thus increasing the association power (Estrada et al., 2012; Lango Allen et al., 2010; Liu et al., 2010; Morris et al., 2012).
Many approaches for genotype imputation have been proposed, with methods based on hidden Markov models (HMM) showing the highest accuracy in simulations and empirical data (Browning and Browning, 2007; Howie et al., 2012; Li et al., 2010; Marchini and Howie, 2010a). However, privacy and logistic constraints often prohibit access to individual-level genotype data, thus precluding HMM-based imputation, whereas summary association statistics are becoming widely available. For example, summary statistics are required to be publicly released for any GWAS published in Nature Genetics and have been publicly released for many traits (Nature Genetics, 2012; Schork et al., 2013).
In this work, we propose methods for testing association at SNPs untyped in the study when only summary association statistics are available at the typed SNPs. Unlike HMM-based imputation from individual-level genotypes, our proposed approach requires only the association statistics at typed variants as input. To accomplish this, we approximate the distribution of association statistics at a given locus using a multivariate Gaussian. Previous studies have shown that a Gaussian approximation of linkage disequilibrium (LD) leads to accurate inference across a wide range of problems (Conneely and Boehnke, 2007; Han et al., 2009; McPeek, 2012; Wen and Stephens, 2010; Zaitlen et al., 2010). In particular, (Wen and Stephens, 2010) highlighted the potential utility of Gaussian imputation methods for individual-level and pooled data, but that study did not provide methods or software for imputation from summary association statistics (see Section 4).
Through extensive simulations based on 1000G data, we show that our approach is almost as powerful as the gold standard of HMM-based imputation from individual-level genotypes, and is able to avoid an increase in false-positive associations by accounting for the limited size of the reference panel. Our approach recovers 84% (54%) of the effective sample size for common (>5%) and low-frequency (1–5%) variants versus 89% (67%) for HMM-based imputation, with a reduction in running time of several orders of magnitude. When summary information on the pairwise LD structure among typed variants in GWAS samples is made available [as is also recommended in other contexts (Lee et al., 2013b)], our method recovers 87% (60%) of the effective sample size, again with no increase in false-positive associations.
We validate our approach using real GWAS data from Wellcome Trust Case Control Consortium (WTCCC) across seven phenotypes as well as a height GWAS from the 1958 Birth Cohort (1958BC), where we show that Gaussian imputation from summary statistics recovers the same signal as HMM-based imputation from individual-level genotypes, with no increase in false-positive rate. For example, we attain an average association statistic of 18.28 as compared with 19.17 for HMM-based imputation at the 227 published SNPs in the WTCCC data and 4.76 (versus 4.55 for HMM-based imputation) at the 176 published SNPs in the 1958BC height data.
For publicly available summary statistics from large meta-analyses of four lipid traits [triglycerides (TG), total cholesterol (TC), high density lipoprotein (HDL) and low density lipoprotein (LDL)], we publicly release imputed summary statistics at 1000G SNPs, which could not have been obtained using previously published methods. We validate the accuracy of the imputed statistics across the four studies using a masking approach and show that we attain a correlation of 0.98 (0.95) to masked summary statistics for common (low-frequency) variants, consistent with simulations. Finally, we explore the utility of imputed association statistics to functional enrichment analysis (Schork et al., 2013). For the four lipid traits, we find that imputed data increase the magnitude and statistical evidence of enrichment at genic versus non-genic loci, as compared with an analysis without 1000G imputation (Schork et al., 2013).
2 METHODS
2.1 Overview of Gaussian imputation of summary statistics
We assume that summary association statistics consist of z-scores known to be normally distributed with mean 0 and variance 1 under the null model of no association. LD between SNPs i and j induces a covariance between their observed z-scores, according to the correlation rij between the two SNPs. Thus, under null data, the vector Z of z-scores at all SNPs in a locus is approximately distributed as a Gaussian distribution, , with Σ being the correlation matrix among all pairs of SNPs induced by LD () (see Supplementary Note). In a given study, we only observe z-scores at the typed SNPs (Zt), with no information about untyped SNPs. We estimate Σ using reference panels of haplotypes (e.g. 1000G) and analytically derive the posterior mean of z-scores at unobserved SNPs (Zi) given Zt and Σ (ImpG-Summary). We use the conditional variance to estimate the imputation accuracy (), in a manner similar to the estimator in HMM-based imputation (Li et al., 2010).
The finite sample size of the reference panel adds statistical noise to the estimate of Σ. We account for noisy estimates at distant SNPs by using a windowing strategy that models distant SNPs as uncorrelated. This strategy also leads to efficient computational runtime (a smaller matrix needs to be inverted for each window in the genome). In particular, we partition the genome into non-overlapping windows (e.g. 1 Mb), and for each window independently, we estimate the LD matrix Σ using the reference panel of haplotypes. To account for SNPs at the boundaries of these windows, we include SNPs within a buffer around the window in the computation (e.g. 250 kb on either side). We also account for statistical noise in estimates at proximal SNPs by adding to the LD matrix estimated from the data Σ. This procedure is similar to ridge regression (Hoerl and Kennard, 1970) and can also be interpreted in a Bayesian context as adding a prior of to the typed SNP coefficients (Hastie et al., 2001). Accounting for this statistical noise is necessary to eliminate false-positive associations (see below).
The imputed z-scores (from the conditional Gaussian distribution) can be viewed as a linear combination of typed z-scores with weights precomputed from the reference panel. Therefore, the variance of the imputed z-score can be estimated on the basis of the weights and the LD among typed SNPs. We estimate the LD structure among typed SNPs using the reference panel as above (accounting for statistical noise in the reference panel) and normalize the imputed z-scores such that their theoretical variance under the null is 1 [in a real scan, the observed variance may be >1 because of polygenic effects (Yang et al., 2011)]. The computational time of our approach scales linearly with the number of windows across the genome and can be further reduced by precomputing the inverse Σ for each genotyping array platform at each window, although special requirement is required for typed SNPs that are removed by quality control (QC). In particular, matrix inversion should be repeated at windows where typed SNPs used in the imputation are removed by QC.
If summary LD statistics (pairwise LD among typed SNPs within a window in GWAS samples) are also available, they can be directly used to estimate the variance of each imputed z-score (which can be viewed as a linear combination of typed z-scores). This produces an accurate estimate of the expected variance under the null for the imputed z-scores, with no need of adjustment for the statistical noise in the reference panel (ImpG-SummaryLD). This leads to well-calibrated association statistics under the null with increased power relative to ImpG-Summary.
Association statistics in GWAS. A standard test for association in GWAS is the normalized difference in frequencies between cases and controls (z-score z) defined as where () denotes the frequency in cases (controls), f is the overall frequency and N the number of samples. This statistic extends to continuous phenotypes by considering times the correlation between the vector of genotypes (0,1,2) and phenotype. In the case of imputed data, this statistic extends by using genotype dosages in the computation of the correlation of dosages to phenotype. LD between pairs of SNPs s and induces a correlation among the observed z-scores at these SNPs, which can be expressed through the correlation coefficient (see Supplementary Note).
Multivariate Gaussian approximation. Similar to other works (Conneely and Boehnke, 2007; Han et al., 2009; Wen and Stephens, 2010; Zaitlen et al., 2010), we approximate the full distribution of association statistics Z at n SNPs in LD using a multivariate Gaussian distribution with probability density function depending on the mean μ and variance covariance Σ. Let the vector Z be partitioned into two components Zt and Zi corresponding with the typed and imputed SNPs, where Zt is a vector of size m (assuming m SNPs have been typed) and Zi has n − m elements. Similarly, we will partition the mean vector and variance–covariance matrix into corresponding to the means at typed and imputed SNPs, covariances among imputed (), covariances among typed and imputed () and covariance among typed data (). Then the conditional random variable follows a Gaussian distribution with mean and variance .
2.2 Gaussian imputation of association statistics (ImpG-Summary)
When estimating the variance–covariance matrix Σ, we adopt a windowing strategy aimed at decreasing runtime (a smaller matrix needs to be inverted for each window in the genome) and at reducing statistical noise that can show distant SNPs to be spuriously correlated. In particular, we partition the genome into non-overlapping windows of 1 Mb (with a buffer of 250 kb on either side to account for LD at boundaries). For each window independently, we estimate Σ from the reference panel of haplotypes, with an adjustment for sampling noise (see below). Let Zt be the set of observed z-scores restricted to current window. We impute Zi as . To speed up computation, we precompute for all genotyping array platforms. For windows where QC has removed part of the typed SNPs used in imputation needs to be reestimated. Because the window length is fixed across the genome, the overall computational runtime can be thought of linear in the number of SNPs (when has been precomputed already).
The imputed z-scores at SNP i can be viewed as a linear combination of typed z-scores Zt with weights precomputed from the reference panel. Let A denote the variance–covariance matrix among typed SNPs in the population. Because we assume , it follows that has variance . Therefore, we use as the imputation z-score at imputed SNP i. To account for the statistical noise, while also making sure that Σ is invertible we adopt a procedure similar to ridge regression (Hoerl and Kennard, 1970) and use in both and in the estimation of W (we use as default; see Supplementary Tables S1–S3 for results across other values of λ). We approximate A with using LD information from reference panel (ImpG-Summary).
An alternative is to use the true A, i.e. the summary LD statistics from the GWAS sample, if they are available; in this case, a more substantial adjustment for statistical noise in Σ is not needed because A is derived from the GWAS sample, and we set to make sure that Σ is invertible in the estimation of W (ImpG-SummaryLD). We do not use the summary LD statistics across typed SNPs in the sample for estimation of W in ImpG-SummaryLD, to maintain consistency among pairwise LD statistics between typed and imputed SNPs. Software implementing the ImpG-Summary and ImpG-SummaryLD methods has been made publicly available.
We propose a metric for imputation accuracy based on the variance of the conditional random variable : we define . Supplementary Figure S1 shows that behaves similarly to the standard imputation accuracy metric (Li et al., 2010; correlation of 0.90 to the true r2 accuracy as compared with 0.92 for ).
2.3 Simulation framework
We simulated data starting from the 381 diploid European individuals from the phase 2 release of the 1000 Genomes Project (June 2011; The 1000 Genomes Project Consortium, 2012). The 381 individuals include 87 CEPH individuals of North European ancestry, 93 Finnish individuals from Finland, 89 British individuals from England and Scotland (GBR), 98 Tuscan individuals and 14 individuals from the Iberian peninsula. Genotype calls and haplotypic phase had been previously inferred from low-coverage sequencing (4×) using an imputation strategy that borrowed information across samples and loci (The 1000 Genomes Project Consortium, 2012). The set haplotypes were split at random between a set of 178 (number chosen to match the 89 samples of British ancestry) haplotypes used to build simulated data, and the other set was used as an imputation reference panel. Starting from the simulation panel of haplotypes, we used HAPGEN (Su et al., 2011) to simulate 10 000 diploid individuals. All simulation results were generated over 50 distinct 1 Mb regions (total of 50 Mb) randomly chosen across Chromosome 1 totaling 321 226 SNPs. For each of the SNPs with MAF >1% in the reference panel (133 025 in total), we simulated case–control datasets by randomly choosing a subset of 1000 controls, and then choosing 1000 cases from the remaining samples so that samples with 0:1:2 reference alleles have relative probabilities 1: OR: OR2 of being chosen (for a given odds ratio (OR)). For null simulations, we randomly selected 1000 samples as cases and 1000 samples as controls.
2.4 Real data
WTCCC dataset. We examined data from the WTCCC phase 1 comprising GWAS studies of seven diseases: Bipolar disorder (BD), Coronary heart disease (CAD), Crohn’s disease (CD), Hypertension (HT), Rheumatoid arthritis (RA), Type 1 diabetes (T1D) and Type 2 diabetes (T2D) (see Supplementary Table S4 for detailed sample sizes; Wellcome Trust Case Control Consortium, 2007). We removed all SNPs that had overall deviation from Hardy–Weinberg equilibrium at a P-value below 0.01. Then, we removed any SNP that had differential missigness (P < 0.01) in any of the case–control cohort, overall missingness >0.001 or minor allele frequency <0.01. This yielded 325 553 SNPs. We performed HMM-based imputation using the prephasing approach of (Howie et al., 2012); we used HAPI-UR (Williams et al., 2012) to infer haplotypes from genotypes and then ran IMPUTE2 (Howie et al., 2012) using default parameters on the inferred haplotypes. Unless otherwise noted, we filtered out imputed SNPs using an imputation accuracy cutoff of 0.6, as well as SNPs that had >5% of the individual imputed calls missing at a posterior probability level of 0.9. This procedure yielded ∼4.7 M SNPs for the considered phenotypes (Supplementary Table S4).
1958 Birth Cohort data. The British 1958 birth cohort is an ongoing follow-up of all persons born in England, Scotland and Wales during 1 week in 1958. At the age of 44–45 years, the cohort was followed up with a biomedical examination and blood sampling (Strachan et al., 2007), from which a DNA collection was established as a nationally representative reference panel (http://www.b58cgene.sgul.ac.uk/). Non-overlapping subsets of the DNA collection were genotyped by the Wellcome Trust Case–Control Consortium (WTCCC; Wellcome Trust Case Control Consortium, 2007), the Type 1 Diabetes Genetics Consortium (T1DGC; Barrett et al., 2009) and the GABRIEL consortium (Moffatt et al., 2010). Genotyping by the WTCCC used both the Affymetrix 500K array and the Illumina 550K (version 1) array. Because the T1DGC used the Illumina 550K (version 3) array and GABRIEL used the Illumina 610K array, a combined dataset was created of SNPs in common across these three panels. SNPs were excluded from subsequent imputation if they had MAF <1%, call rate <95%, HWE P < 0.0001 or differences in allele frequency across the three deposits (P < 0.0001 on pairwise comparisons). Preimputation phasing was performed using Mach (Li et al., 2010). Imputations against the March 2012 release of 1000-genomes all-ethnicities reference haplotypes were performed using Minimac (Howie et al., 2012). Associations of imputed allele dosages with standing height, as measured at the 44–45-year follow-up, were analyzed using ProbAbel (Aulchenko et al., 2010).
Publicly available summary statistics for four lipid traits. Publicly available GWAS summary data across four blood lipids phenotypes (TG, TC, HDL and LDL) were downloaded from public access Web sites (Teslovich et al., 2010). These data have been recently used in a study of overlap of GWAS findings and functional data (Schork et al., 2013); all QC steps are described elsewhere (Teslovich et al., 2010). The data comprised roughly 2.7 M summary statistics based on ∼100 000 samples for each of the four phenotypes. To remove strand ambiguity, we removed all A/T and C/G SNPs (∼15.4% of all SNPs); we also removed all SNPs with meta-analysis sample sizes under 80 000, leaving ∼2.0 M SNPs for each of the phenotypes. We imputed to 1000G using ImpG-Summary under three scenarios. In the first scenario, we removed 10% of the SNPs at random. In the second scenario, we removed all SNPs not present on the Illumina 610 genotyping platform (∼600 k in total). In both of these scenarios, we imputed from the remaining SNPs and assessed accuracy using the previously masked SNPs. As a metric of accuracy, we computed the correlation between imputed and previously masked association statistics. In the third scenario, we imputed from all 2.0 M SNPs to obtain the summary statistics at 7.3 M SNPs that we publicly release.
Enrichment analysis for four lipid traits. We used an analysis similar to Schork et al. (2013) to quantify enrichment per classes of SNPs. We categorized each SNP according to its distance to genes using the all SNPs track (snp137) (http://genome.ucsc.edu/cgi-bin/hgTables). All SNPs within an exon, up to 5 kb upstream and up to 5 kb downstream, located in the 3′ UTR or in the 5′ UTR were labeled as genic. SNPs with no annotation in the data were considered as being Intergenic. For each dataset, we normalized the association statistics using genomic control attained only over the Intergenic SNPs (Schork et al., 2013), followed by computation of average variance across SNPs within each functional class. We estimate the variance as the average of the squared association z-scores minus 1 (Schork et al., 2013). We compared the magnitude of enrichment in association statistics across different functional classes within the same dataset (either the public data or the imputed one) using the median of the Kolmogorov–Smirnov (KS) test statistic at 100 random draws each of 10 000 random SNPs across the genome. This conservative computation avoids correlations due to LD and does not account for the larger number of SNPs in the 1000G imputed data, which would further increase statistical significance.
2.5 Gaussian imputation of individual genotypes
Although we focus primarily on imputation of summary statistics, for completeness, we also discuss Gaussian imputation when individual-level data are available. We compare two different approaches. The first approach is to apply ImpG-SummaryLD as described above, relying only on summary association statistics and summary LD statistics. The second approach (which attains slightly worse results) is similar to the approach proposed by Wen and Stephens (2010). As described in that study, we can impute allele frequencies and treat each genotype as a sample of size 2. Following Wen and Stephens (2010), we set μ to be the observed allele frequency in the reference panel and to be the covariance between SNP i and j. Next, we apply the same windowing approach above to each sample independently to impute individual-level genotypes. Although rare, in practice Gaussian imputation can output values <0 or >2; we adjust these values to 0 and 2, respectively. As association statistic, we use the 1 df statistic , where N is the number of samples and is the squared correlation between the vectors of imputed genotypes and the phenotype.
3 RESULTS
3.1 Simulations
To explore the effectiveness of Gaussian imputation using summary statistics (ImpG-Summary and ImpG-SummaryLD), we simulated case–control datasets at various effect sizes across a wide range of SNPs (see Section 2). To assess the performance of imputation at recovering the true association signal when present, we used the relative effective sample size, defined as the ratio of average imputed statistics at untyped SNPs versus statistics computed from true genotypes. Here statistics refer to the squared z-score, which has a with 1 df distribution under the null hypothesis. We envision that real scans will restrict their analyses to variants with high-estimated imputation accuracy [, analogous to the estimator in HMM-based imputation (Li et al., 2010), Supplementary Fig. S1], but we computed the relative effective sample size with all values of included to provide an appropriate assessment of power. However, we restricted most of our analyses of false positives to accurately imputed variants (), as these are the variants that would be analyzed in a real scan.
We first explored the robustness of imputation from summary statistics. ImpG-Summary attains genomic control of 0.94 (Supplementary Fig. S2), with no increase in false-positive rate at the tail of the distribution (Supplementary Tables S1–S3). Although ImpG-Summary attains a slight deflation (because of the adjustment procedure that has the effect of shrinking the predictor weights), this is necessary to avoid false positives. As expected from the conditional distribution, Gaussian imputation with no variance normalization is deflated (), while the naive normalization that does not account for the statistical noise in the LD matrix is also susceptible to false positives [we observe a near 4-fold increase in P-values < as compared with a well-calibrated statistic in null data simulations (Supplementary Tables S1 and S2 and Supplementary Fig. S2)]. Similar results are obtained at different QC thresholds based on (Supplementary Table S1). However, when pairwise correlations among typed SNPs are available from the GWAS data, the expected variance under null of the imputed statistics can be accurately estimated and used for normalization (ImpG-SummaryLD). This removes the need for adjusting the LD matrix estimated from the reference panel leading to distributed association statistics with no susceptibility to false positives (, Supplementary Fig. S2).
Recent work in parallel to ours has also investigated the use of Gaussian models for summary association imputation but do not propose an adjustment for the statistical noise in the reference panel (DIST; Lee et al., 2013a). DIST shares many similarities to the version of our approach that does not perform an adjustment for the statistical noise in estimating Σ. Because we caution that adjusting for the statistical noise in the reference panel is required to avoid false positives when using our method (Supplementary Fig. S2), we investigated whether such an adjustment would also be needed for DIST. We simulated a null GWAS by randomly partitioning the 1000G European data, computed z-scores as above and performed Gaussian imputation of summary statistics from SNPs present on a standard genotyping array using both DIST(v0.1.4) and ImpG-Summary (Table 1). We observe that DIST, which does not adjust for statistical noise in the reference panel, is susceptible to false positives at these reference panel sizes (Table 1 and Supplementary Fig. S3); this is consistent to simulations for the variant of our approach that does not adjust Σ (Supplementary Fig. S2). Thus, an adjustment is needed to control the false-positive rate at small reference panel sizes; it is possible that the adjustment factor could be reduced at larger reference panel sizes.
Table 1.
Number of variants attaining a given confidence level in a simulated null GWAS
| Method | All SNPs | Significance level |
|||
|---|---|---|---|---|---|
| 1E-3 | 1E-4 | 1E-5 | 5E-8 | ||
| Simulated data | 5 961 977 | 4747 | 451 | 56 | 0 |
| DIST(v0.1.4, info >0.6) | 5 620 505 | 6954 | 946 | 186 | 22 |
| DIST(v0.1.4, info >0.9) | 4 969 996 | 5133 | 584 | 78 | 1 |
| ImpG-Summary | 5 469 489 | 1806 | 103 | 4 | 0 |
Note: The 381 European individuals from 1000G were randomly split in half; one half was used as reference panel, while the other half was used to simulate a null GWAS by randomly assigning 85(85) samples as cases(controls). We performed Gaussian imputation using DIST (v0.1.4) and ImpG-Summary with default parameters starting from the variants present on the Illumina 610 genotyping platform and that attained a MAF >5% in both cases and controls (464 897 in total). We kept only accurately imputed variants (MAF > 1%, for ImpG-Summary and info for DIST).
We next assessed the ability of ImpG-Summary to identify true-positive associations by measuring the decrease in effective sample size. Table 2 shows the relative effective sample size in 1000G simulations with target and reference haplotypes randomly sampled from 762 European haplotypes (i.e roughly matched for ancestry). As a gold standard for imputation accuracy, we used Beagle, an HMM-based method that requires individual-level data (Browning and Browning, 2007, 2009). Beagle has previously been shown to achieve similar accuracy as other HMM-based methods, with far superior accuracy compared with tagging-based imputation (Browning and Browning, 2009; Marchini and Howie, 2010b). At an odds ratio of 1.5, ImpG-Summary recovers 84% (54%) of the effective sample size for common (>5%) and low-frequency (1–5%) variants versus 89% (67%) for Beagle imputation. Interestingly, when LD information among the typed variants from the GWAS is available, ImpG-SummaryLD recovers 87% (60%) of the effective sample size, nearly as high as Beagle. Table 2 also shows the decrease in effective sample size across a wide array of odds ratios showing that the results are robust to different effect sizes. Thus, imputation from summary statistics can recover most of the association power available from GWAS with individual-level data.
Table 2.
Relative effective sample size at imputed SNPs (ratio of the average association statistics attained at imputed versus typed SNPs) in simulated case–control studies at different effect sizes (OR >1)
| Method | Odds Ratio (OR) |
||||
|---|---|---|---|---|---|
| 1.0 | 1.2 | 1.5 | 1.7 | 2.0 | |
| All SNPs | |||||
| Beagle | 0.999 | 0.892 | 0.872 | 0.870 | 0.868 |
| ImpG-Summary | 0.937 | 0.835 | 0.823 | 0.827 | 0.836 |
| ImpG-SummaryLD | 0.999 | 0.872 | 0.851 | 0.852 | 0.855 |
| Common SNPs (>5%) | |||||
| Beagle | 0.999 | 0.900 | 0.885 | 0.883 | 0.881 |
| ImpG-Summary | 0.956 | 0.850 | 0.841 | 0.845 | 0.855 |
| ImpG-SummaryLD | 0.999 | 0.882 | 0.867 | 0.868 | 0.872 |
| Low-frequency SNPs (1–5%) | |||||
| Beagle | 0.997 | 0.808 | 0.667 | 0.640 | 0.620 |
| ImpG-Summary | 0.881 | 0.685 | 0.539 | 0.512 | 0.491 |
| ImpG-SummaryLD | 0.997 | 0.768 | 0.597 | 0.565 | 0.542 |
Note: The column corresponding to OR = 1 shows the average association statistic under the null model of no association.
We also tested the effect of a mismatch in ancestry between the reference haplotype panel and the target population. We simulated case–control GWAS using the GBR haplotypes for target samples and the remaining 1000G European haplotypes as reference haplotypes. Table 3 shows only marginal decrease in performance for each of HMM, ImpG-Summary and ImpG-SummaryLD as compared with previous results, with no excess of false positives (Supplementary Table S2).
Table 3.
Relative effective sample size at imputed SNPs (ratio of the average association statistics attained at imputed versus typed SNPs) when imputation is performed in a random subsample of the 1000G European data or over only Great Britain haplotypes (odds ratio is set to 1.5)
| Method | Rand | Great Britain |
|---|---|---|
| Common SNPs (>5%) | ||
| Beagle | 0.885 | 0.880 |
| ImpG-Summary | 0.841 | 0.835 |
| ImpG-SummaryLD | 0.867 | 0.860 |
| Low-frequency SNPs (1–5%) | ||
| Beagle | 0.667 | 0.671 |
| ImpG-Summary | 0.539 | 0.549 |
| ImpG-SummaryLD | 0.597 | 0.603 |
We note that both ImpG-Summary and ImpG-SummaryLD are computationally very fast, with running times several orders of magnitude lower than HMM-based methods for imputation from individual-level genotypes. Table 4 shows a reduction in running time of several orders of magnitude for ImpG-Summary as compared with HMM-based approaches. The magnitude of the difference in running time will only increase with larger studies (such as the N = 100 000 studies analyzed below), as the running time of ImpG-Summary is independent of the number of target samples, while the running time of HMM-based imputation is linear in this quantity. However, we note that all of the methods listed in Table 4 can be parallelized across regions of the genome for faster wall-clock running time.
Table 4.
Estimated runtimes for 1000G imputation for various numbers of individuals (N) in imputation
| Method | N = 1000 | N = 10 000 | N = 50 000 |
|---|---|---|---|
| IMPUTE1 | 893.8 | 8,937.5 | 44,687.5 |
| IMPUTE2 (sampling) | 100 | 1000 | 5000 |
| IMPUTE2 (prephasing) | 4.2 | 41.7 | 208.3 |
| IMPUTE2 (prephasing)a | 21.5 | 215.3 | 1,076.4 |
| Beagle | 250 | 2,500 | 12,500 |
| ImpG-Summary | 0.4 | 0.4 | 0.4 |
| ImpG-SummaryLD | 0.4 | 0.4 | 0.4 |
Note: Runtimes given in central processing unit (CPU) days needed to impute across the whole genome (11.6 million SNPs polymorphic in Europeans). Runtimes for all versions of IMPUTE extrapolated from Howie et al. (2012).
aIncludes GWAS phasing time of 25 min per individual (Howie et al., 2012). Beagle runtime extrapolated from an average of 3 CPU h runtime for N = 300 samples across a 5 Mb window in the genome. ImpG-Summary takes <10 h for imputation starting from 600k typed variants and under 4 CPU days for imputation from 2 M typed variants with no precomputation.
Although our work focuses on imputation from summary statistics, for completeness we also investigate Gaussian imputation when individual-level data are available. This has been proposed in (Wen and Stephens, 2010) and shown to achieve similar accuracy as HMM-based imputation in the context of HapMap 3 data. In simulations from 1000G, we find that our implementation of the (Wen and Stephens, 2010) approach (see Section 2) achieves slightly but significantly lower accuracy than ImpG-SummaryLD (Supplementary Tables S7 and S8) across a wide range of effect sizes. The slight improvement of ImpG-SummaryLD over Gaussian imputation using individual-level genotypes suggests that there is an advantage to phenotype-aware imputation. When individual-level genotypes are available, HMM-based imputation remains the approach of choice because of its slightly higher accuracy, but we recommend the use of ImpG-SummaryLD in preference to previous methods for performing Gaussian imputation when rapidly prioritizing regions for HMM-based analysis.
3.2 Application to WTCCC and height datasets
We explored whether similar results could be attained in real empirical GWAS data. We validated our approach using a WTCCC study spanning seven diseases (Wellcome Trust Case Control Consortium, 2007) [roughly 2000 cases for each disease and 3000 shared controls genotyped on Affymetrix 500K array (Supplementary Table S4)], and a study of height involving 6500 individuals from the British 1958 birth cohort (1958BC) genotyped on the Affymetrix 6.0 array (see Section 2). Starting from the real genotype data, we used as reference all 758 European haplotypes of the 1000G phase 2 data to accurately impute ∼4.3 million SNPs with minor allele frequency either using an HMM-based method [IMPUTE2 with prephasing (Howie et al., 2012)] or ImpG-Summary (Supplementary Table S4).
We compared association statistics at accurately imputed SNPs with either the HMM-based method or using ImpG-Summary (with the latter assuming no access to individual-level data). We observed an average correlation of 0.94 between the two set of association statistics for both WTCCC and 1958BC phenotypes (Fig. 1), showing high similarity between the two approaches (see Supplementary Fig. S4 for each WTCCC phenotype). In general, we observe that the QQ and Manhattan plots show similar behavior for HMM-based association as compared with ImpG-Summary imputation, emphasizing no excess of false positives when only summary data are used in imputation (Supplementary Figs S5–S13). In some instances, we observe differences that we hypothesize represent false positives for the HMM-based imputation, likely because of insufficient QC filtering for the HMM-based approach (Supplementary Figs S10–S12). Importantly, statistics at known associated SNPs from the NHGRI GWAS catalog for each of the considered phenotypes (Hindorff et al., 2009; Table 5) show similar association power across the two compared methods (e.g. an average of 19.17 for HMM-based imputation versus 18.28 across the WTCCC data and 4.55 versus 4.76 for the height phenotype; Fig. 2 and Supplementary Table S5).
Fig. 1.

HMM-imputed (x-axis) versus ImpG-Summary (y-axis) association statistics (z-scores) for the BD phenotype in WTCCC Data (left) and over height phenotype in 1958 Birth Cohort Data (right). Results for all other WTCCC phenotypes can be found in Supplementary Figure S4
Table 5.
Average association statistics () over known associated SNPs from NHGRI GWAS Catalog for the eight studied phenotypes
| Phenotype | SNPs | HMM | ImpG-Summary | Ratio |
|---|---|---|---|---|
| BD | 9 | 7.02 | 6.66 | 0.95 |
| CAD | 32 | 13.39 | 13.11 | 0.98 |
| CD | 70 | 20.78 | 19.74 | 0.95 |
| HT | 7 | 4.47 | 3.95 | 0.88 |
| RA | 22 | 20.36 | 19.00 | 0.93 |
| T1D | 36 | 36.39 | 34.98 | 0.96 |
| T2D | 51 | 12.08 | 11.45 | 0.95 |
| All WTCCC | 227 | 19.17 | 18.28 | 0.95 |
| Height 1958 BC | 176 | 4.55 | 4.76 | 1.05 |
Note: The average across all SNPs except HLA region (chr6:20–35 Mb) in WTCCC data consisting of 216 SNPs in a total of 16.02 for HMM versus 15.29 for ImpG-Summary. All WTCCC denotes averages across all WTCCC data.
Fig. 2.

HMM-imputed (x-axis) versus ImpG-Summary (y-axis) association statistics (z-scores) at known associated SNPs from NHGRI GWAS Catalog in WTCCC (left) and height in 1958 Birth Cohort Data (right)
3.3 Application to publicly available summary statistics for four lipid traits
We investigated the performance of ImpG-Summary on publicly available summary association statistic datasets of four blood lipid traits (Teslovich et al., 2010). These data have been imputed using HMM-based imputation to an average of 2.0 M markers (see Section 2). We imputed this data to 7.3 M 1000G markers. We randomly masked 10% of the data, reimputed using ImpG-Summary and assessed accuracy by comparing ImpG-Summary with the masked data. As expected, we observe a high correlation between the two sets of summary statistics [correlation r = 0.98 (0.95) at common (low-frequency) variants; see Fig. 3 and Supplementary Fig. S14]. To quantify the expected accuracy when imputation is performed from array-based association statistics, we also masked all association statistics not present on a standard genotyping array and reimputed using ImpG-Summary. We again observe a high correlation [r = 0.97 (0.91) at common (low-frequency) variants; see Fig. 3 and Supplementary Fig. S14], thus showing that our approach recovers association statistics similar to those obtained by HMM-based imputation requiring individual-level genotypes. We have publicly released imputed summary association statistics obtained using the full set of 2.0 M markers, without masking (see Web Resources). As expected, we observed lower for ImpG-Summary data as compared with original data (e.g. 0.92 versus 0.98 for HDL phenotype, see Supplementary Table S9).
Fig. 3.

HMM-imputed (x-axis) versus ImpG-Summary (y-axis) association statistics (z-scores) for the TG phenotype in the blood lipids data. Left denotes imputation of 10% of the z-scores using the remaining 90%, while right shows imputation results starting from all variants present on the Illumina 610 array. Results for all blood lipids phenotypes can be found in Supplementary Figure S13. ImpG-Summary took 4 CPU days for the 10% data and under 10 CPU h for the array-based imputation
3.4 Enrichment analysis for four lipid traits
We categorized each SNP according to functional classes (see Section 2). We performed genomic control correction using estimated from only the Intergenic SNPs, as in (Schork et al., 2013). After normalization, we estimated the average excess variance for each functional class as the average square of the association z-score minus 1 (Schork et al., 2013). We observe that 1000G imputation using ImpG-Summary increases the average variance for each functional class, with Genic SNPs (and in some cases, Intronic SNPs) showing larger increases than Intergenic SNPs (Fig. 4 and Supplementary Fig. S15). The increase in for each functional class, even after normalization by , indicates that 1000G imputation increases the ratio /, i.e. causes true signals to be more concentrated at the tail of the distribution.
Fig. 4.
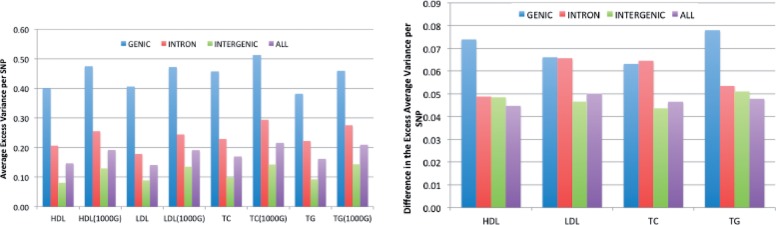
Average variance per SNP (average association z2 − 1) binned by different functional classes for all four blood phenotypes. Left displays the absolute numbers attained across the original data and the ImpG-Summary imputation to 1000G (r2pred >0.8). Right figure shows the absolute difference between original data and 1000G imputed association statistics
1000G imputation using ImpG-Summary increases statistical evidence of enrichment at Genic versus Intergenic SNPs, both because the magnitude of the enrichment is larger and because of the increased number of SNPs. We focus here on just the former effect by computing KS test statistics at random subsets of 10 000 SNPs, a conservative computation that avoids correlations because of LD (see Section 2). Across all four phenotypes, median KS test statistics were more significant in the 1000G imputed data versus the original dataset (e.g. 4.75E-08 versus 7.63E-05 for HDL; see Supplementary Table S10 for all phenotypes). This highlights the increased utility of the 1000G imputed summary statistics that we have publicly released for analyses of functional enrichment.
4 DISCUSSION
We have introduced an approach for imputation of association statistics at untyped variants directly from summary association statistics using publicly available reference panels of haplotypes such as 1000G (The 1000 Genomes Project Consortium, 2012), in contrast to widely used HMM-based approaches that require individual-level genotypes (Howie et al., 2012). Through extensive simulations and real data analyses, we show that our approach is almost as powerful as imputation from individual-level genotypes (for both common and low-frequency variants) with no excess of false positives. We have described a method that uses summary association statistics (ImpG-Summary), as well as a method that uses summary association statistics and summary LD statistics (ImpG-SummaryLD). Because summary LD statistics are not currently widely shared, we expect that ImpG-Summary will be of greatest practical value in the immediate future. However, the slightly higher power attained by ImpG-SummaryLD provides a motivation for sharing of summary LD statistics to become a widely accepted practice. This is likely to also prove valuable in other settings, such as conditional analysis or rare variant testing (Lee et al., 2013b; Yang et al., 2012).
It is often the case that privacy and logistic constraints prohibit the sharing of individual-level data. On the other hand, summary association statistics from large-scale association studies are often readily available (Schork et al., 2013; Teslovich et al., 2010), despite the fact that privacy concerns may extend to summary data (Homer et al., 2008; Sankararaman et al., 2009). For example, a recent study used publicly available summary association statistics over a wide range of phenotypes to draw inferences about the enrichment of disease-associated variants in several functional categories (Schork et al., 2013). Using the methods introduced here, such analyses can be expanded to the set of all 1000G variants. In particular, we have publicly released imputed association statistics at 1000G variants for four lipid traits. We show that for these four lipid traits, 1000G imputed summary statistics show a consistently larger and more statistically significant signal of enrichment in genic versus non-genic regions as compared with the original publicly available data. Thus, 1000G imputed summary statistics can be used to increase power in studies of functional enrichment.
The Gaussian approximation for LD among SNPs has previously been used in a wide range of problems (Conneely and Boehnke, 2007; Han et al., 2009; McPeek, 2012; Wen and Stephens, 2010; Zaitlen et al., 2010). We showed that an adjustment similar to ridge regression removed the false-positive associations in imputed summary statistics that occurred when unadjusted estimates of LD were used. As reference panels become larger, we expect a smaller adjustment factor to be needed, thus increasing accuracy. Large reference panels of typed SNPs could potentially also be used to reduce the adjustment factor needed for avoiding false positives (Yang et al., 2012). Other recent works have proposed to reduce the computational burden of imputation using a technique similar to matrix completion; however, that approach does not extend to imputation from summary statistics (Chi et al., 2013).
Our proposed procedure relies on accurate estimates of pairwise LD that match the population of the GWAS sample, in contrast to HMM-based approaches that use cosmopolitan reference panels that include all available haplotype data (Howie et al., 2012). Our method is directly applicable to admixed populations such as African Americans and Latino Americans for which 1000G reference panels are currently available (The 1000 Genomes Project Consortium, 2012), but is not applicable to samples of uncertain ethnicity or samples for which reference panels are not available.
The method proposed here relies on a windowing approach to reduce the number of pairwise LD parameters to be estimated from the reference panels. Although this procedure reduces dramatically the number of pairwise LD parameters, our choice of window size (1 cM) may still allow for overestimation of pairwise LD because of finite reference panel sizes. Recent work has shown that population genetic principles can be used to derive shrinkage factors based on recombination maps and reference panel sizes (Wen and Stephens, 2010). A potentially fruitful direction for future work is to combine such derivations with window-based approaches to increase accuracy.
The work of Wen and Stephens (2010) presented methods for Gaussian imputation from allele frequencies in cases and controls or from individual-level genotypes. There are many key differences between that work and this study. First, we impute association statistics (i.e. z-scores) rather than allele frequencies. For case–control traits, it is unclear how to use imputed allele frequencies in cases and controls (Wen and Stephens, 2010) to obtain association statistics that are robust to false positives; for quantitative traits, imputation of allele frequencies does not apply. Thus, the methods and software of Wen and Stephens (2010) cannot be used to impute association statistics, as we have done here. Second, we evaluate our approach in simulations based on 1000G data (The 1000 Genomes Project Consortium, 2012), assessing both power and false-positive associations. Third, we validate our approach using real empirical data across several GWAS involving both discrete and continuous phenotypes, including the four lipid traits for which we have publicly released imputed association statistics at 1000G variants. We note that recent parallel work has also proposed to use summary statistics with reference panels of haplotypes for imputation [(Lee et al., 2013a); a related approach is proposed in (Hu et al., 2013)], but that work does not provide a strategy to address false-positive associations arising from the limited size of the reference panel, as we do here.
We conclude with several limitations for the approaches we presented here. First, when summary LD statistics from the study are not available, our adjustment procedure leads to a slight deflation of association statistics under null data. This could hamper efforts to assess confounding because of population stratification or cryptic relatedness via genomic control (Devlin and Roeder, 1999). However, it is now widely recognized that genomic control is not an effective approach for assessing confounding in large studies, because of the expected inflation from polygenic effects (Yang et al., 2011). Second, application of our approach to summary statistics with inappropriate levels of QC is a potential concern because of the possibility of introducing false positives. Therefore, we caution that appropriate QC should be performed on typed variants before estimation of summary association statistics, as is standard procedure in any GWAS. Third, recent work has shown that low-coverage sequencing is a more powerful alternative to genotyping arrays per unit of cost invested (Flannick et al., 2012; Li et al., 2011; Nielsen et al., 2011; Pasaniuc et al., 2012). The extension of Gaussian imputation to low-coverage sequencing data remains a direction for future work. Finally, as with all imputation approaches, the methods presented here are more accurate for common variants than for low-frequency variants. Accuracy will be even lower at rare variants, although GWAS involving single-variant associations are generally focused on common and low-frequency variants.
Supplementary Material
ACKNOWLEDGEMENTS
We are grateful to J. Yang and D. Reich for helpful discussions that have allowed to greatly improve the quality of our manuscript. The authors acknowledge use of phenotype and genotype data from the British 1958 Birth Cohort DNA collection, funded by the Medical Research Council grant G0000934 and the Wellcome Trust grant 068545/Z/02. (http://www.b58cgene.sgul.ac.uk/).
Funding: This work is supported in part by the National Institutes of Health (R01 HG006399 to B.P., N.Z., N.P., A.L.P.; R03 CA162200 to B.P.; and R01 GM053275 to B.P.). The funders had no role in study design, data collection and analysis, decision to publish, or preparation of the manuscript.
Conflict of interest: none declared.
REFERENCES
- Aulchenko Y, et al. Probabel package for genome-wide association analysis of imputed data. BMC Bioinformatics. 2010;11:134. doi: 10.1186/1471-2105-11-134. [DOI] [PMC free article] [PubMed] [Google Scholar]
- Barrett JC, et al. Genome-wide association study and meta-analysis find that over 40 loci affect risk of type 1 diabetes. Nat. Genet. 2009;41:703–707. doi: 10.1038/ng.381. [DOI] [PMC free article] [PubMed] [Google Scholar]
- Browning BL, Browning SR. A unified approach to genotype imputation and haplotype-phase inference for large data sets of trios and unrelated individuals. Am. J. Hum. Genet. 2009;84:210–223. doi: 10.1016/j.ajhg.2009.01.005. [DOI] [PMC free article] [PubMed] [Google Scholar]
- Browning SR, Browning BL. Rapid and accurate haplotype phasing and missing data inference for whole genome association studies using localized haplotype clustering. Am. J. Hum. Genet. 2007;81:1084–1097. doi: 10.1086/521987. [DOI] [PMC free article] [PubMed] [Google Scholar]
- Chi EC, et al. Genotype imputation via matrix completion. Genome Res. 2013;23:509–518. doi: 10.1101/gr.145821.112. [DOI] [PMC free article] [PubMed] [Google Scholar]
- Conneely KN, Boehnke M. So many correlated tests, so little time! Rapid adjustment of P values for multiple correlated tests. Am. J. Hum. Genet. 2007;81:1158–1168. doi: 10.1086/522036. [DOI] [PMC free article] [PubMed] [Google Scholar]
- Devlin B, Roeder K. Genomic control for association studies. Biometrics. 1999;55:997–1004. doi: 10.1111/j.0006-341x.1999.00997.x. [DOI] [PubMed] [Google Scholar]
- Estrada K, et al. Genome-wide meta-analysis identifies 56 bone mineral density loci and reveals 14 loci associated with risk of fracture. Nat. Genet. 2012;44:491–501. doi: 10.1038/ng.2249. [DOI] [PMC free article] [PubMed] [Google Scholar]
- Flannick J, et al. Efficiency and power as a function of sequence coverage, snp array density, and imputation. PLoS Comput. Biol. 2012;8:e1002604. doi: 10.1371/journal.pcbi.1002604. [DOI] [PMC free article] [PubMed] [Google Scholar]
- Han B, et al. Rapid and accurate multiple testing correction and power estimation for millions of correlated markers. PLoS Genet. 2009;5:e1000456. doi: 10.1371/journal.pgen.1000456. [DOI] [PMC free article] [PubMed] [Google Scholar]
- Hastie T, et al. The Elements of Statistical Learning. vol. 1. New York: Springer; 2001. [Google Scholar]
- Hindorff LA, et al. Potential etiologic and functional implications of genome-wide association loci for human diseases and traits. Proc. Natl Acad. Sci. USA. 2009;106:9362–9367. doi: 10.1073/pnas.0903103106. [DOI] [PMC free article] [PubMed] [Google Scholar]
- Hoerl AE, Kennard RW. Ridge regression: biased estimation for nonorthogonal problems. Technometrics. 1970;12:55–67. [Google Scholar]
- Homer N, et al. Resolving individuals contributing trace amounts of dna to highly complex mixtures using high-density SNP genotyping microarrays. PLoS Genet. 2008;4:e1000167. doi: 10.1371/journal.pgen.1000167. [DOI] [PMC free article] [PubMed] [Google Scholar]
- Howie B, et al. Fast and accurate genotype imputation in genome-wide association studies through pre-phasing. Nat. Genet. 2012;44:955–959. doi: 10.1038/ng.2354. [DOI] [PMC free article] [PubMed] [Google Scholar]
- Hu Y-J, et al. Meta-analysis of gene-level associations for rare variants based on single-variant statistics. Am. J. Hum. Genet. 2013;93:236–248. doi: 10.1016/j.ajhg.2013.06.011. [DOI] [PMC free article] [PubMed] [Google Scholar]
- Lango Allen H, et al. Hundreds of variants clustered in genomic loci and biological pathways affect human height. Nature. 2010;467:832–838. doi: 10.1038/nature09410. [DOI] [PMC free article] [PubMed] [Google Scholar]
- Lee D, et al. Dist: direct imputation of summary statistics for unmeasured SNPs. Bioinformatics. 2013a;29:2925–2927. doi: 10.1093/bioinformatics/btt500. [DOI] [PMC free article] [PubMed] [Google Scholar]
- Lee S, et al. General framework for meta-analysis of rare variants in sequencing association studies. Am. J. Hum. Genet. 2013b;93:42–53. doi: 10.1016/j.ajhg.2013.05.010. [DOI] [PMC free article] [PubMed] [Google Scholar]
- Li Y, et al. Mach: using sequence and genotype data to estimate haplotypes and unobserved genotypes. Genet. Epidemiol. 2010;34:816–834. doi: 10.1002/gepi.20533. [DOI] [PMC free article] [PubMed] [Google Scholar]
- Li Y, et al. Low-coverage sequencing: implications for design of complex trait association studies. Genome Res. 2011;21:940–951. doi: 10.1101/gr.117259.110. [DOI] [PMC free article] [PubMed] [Google Scholar]
- Liu X, et al. Genome-wide meta-analyses identify three loci associated with primary biliary cirrhosis. Nat. Genet. 2010;42:658–660. doi: 10.1038/ng.627. [DOI] [PMC free article] [PubMed] [Google Scholar]
- Marchini J, Howie B. Genotype imputation for genome-wide association studies. Nat. Rev. Genet. 2010;11:499–511. doi: 10.1038/nrg2796. [DOI] [PubMed] [Google Scholar]
- McPeek MS. Blup genotype imputation for case-control association testing with related individuals and missing data. J. Comput. Biol. 2012;19:756–765. doi: 10.1089/cmb.2012.0024. [DOI] [PMC free article] [PubMed] [Google Scholar]
- Moffatt MF, et al. A large-scale, consortium-based genomewide association study of asthma. N. Engl. J. Med. 2010;363:1211–1221. doi: 10.1056/NEJMoa0906312. [DOI] [PMC free article] [PubMed] [Google Scholar]
- Morris A, et al. Large-scale association analysis provides insights into the genetic architecture and pathophysiology of type 2 diabetes. Nat. Genet. 2012;44:981–990. doi: 10.1038/ng.2383. [DOI] [PMC free article] [PubMed] [Google Scholar]
- Nature Genetics. Asking for more. Nat. Genet. 2012;44:733–831. doi: 10.1038/ng.2345. [DOI] [PubMed] [Google Scholar]
- Nielsen R, et al. Genotype and SNP calling from next-generation sequencing data. Nat. Rev. Genet. 2011;12:443–451. doi: 10.1038/nrg2986. [DOI] [PMC free article] [PubMed] [Google Scholar]
- Pasaniuc B, et al. Extremely low-coverage sequencing and imputation increases power for genome-wide association studies. Nat. Genet. 2012;44:631–635. doi: 10.1038/ng.2283. [DOI] [PMC free article] [PubMed] [Google Scholar]
- Sankararaman S, et al. Genomic privacy and limits of individual detection in a pool. Nat. Genet. 2009;41:965–967. doi: 10.1038/ng.436. [DOI] [PubMed] [Google Scholar]
- Schork AJ, et al. All snps are not created equal: genome-wide association studies reveal a consistent pattern of enrichment among functionally annotated SNPs. PLoS Genet. 2013;9:e1003449. doi: 10.1371/journal.pgen.1003449. [DOI] [PMC free article] [PubMed] [Google Scholar]
- Strachan DP, et al. Lifecourse influences on health among british adults: effects of region of residence in childhood and adulthood. Int. J. Epidemiol. 2007;36:522–531. doi: 10.1093/ije/dyl309. [DOI] [PubMed] [Google Scholar]
- Su Z, et al. Hapgen2: simulation of multiple disease SNPs. Bioinformatics. 2011;27:2304–2305. doi: 10.1093/bioinformatics/btr341. [DOI] [PMC free article] [PubMed] [Google Scholar]
- Teslovich TM, et al. Biological, clinical and population relevance of 95 loci for blood lipids. Nature. 2010;466:707–713. doi: 10.1038/nature09270. [DOI] [PMC free article] [PubMed] [Google Scholar]
- The 1000 Genomes Project Consortium. An integrated map of genetic variation from 1,092 human genomes. Nature. 2012;491:56–65. doi: 10.1038/nature11632. [DOI] [PMC free article] [PubMed] [Google Scholar]
- Wellcome Trust Case Control Consortium. Genome-wide association study of 14,000 cases of seven common diseases and 3,000 shared controls. Nature. 2007;447:661–678. doi: 10.1038/nature05911. [DOI] [PMC free article] [PubMed] [Google Scholar]
- Wen X, Stephens M. Using linear predictors to impute allele frequencies from summary or pooled genotype data. Ann. Appl. Stat. 2010;4:1158–1182. doi: 10.1214/10-aoas338. [DOI] [PMC free article] [PubMed] [Google Scholar]
- Williams AL, et al. Phasing of many thousands of genotyped samples. Am. J. Hum. Genet. 2012;91:238–251. doi: 10.1016/j.ajhg.2012.06.013. [DOI] [PMC free article] [PubMed] [Google Scholar]
- Yang J, et al. Genomic inflation factors under polygenic inheritance. Eur. J. Hum. Genet. 2011;19:807–812. doi: 10.1038/ejhg.2011.39. [DOI] [PMC free article] [PubMed] [Google Scholar]
- Yang J, et al. Conditional and joint multiple-SNP analysis of GWAS summary statistics identifies additional variants influencing complex traits. Nat. Genet. 2012;44:369–375. doi: 10.1038/ng.2213. [DOI] [PMC free article] [PubMed] [Google Scholar]
- Zaitlen N, et al. Leveraging genetic variability across populations for the identification of causal variants. Am. J. Hum. Genet. 2010;86:23–33. doi: 10.1016/j.ajhg.2009.11.016. [DOI] [PMC free article] [PubMed] [Google Scholar]
Associated Data
This section collects any data citations, data availability statements, or supplementary materials included in this article.