

Abstract
In addition to forming macrophages and dendritic cells, monocytes in adult peripheral blood retain the ability to develop into osteoclasts, mature bone-resorbing cells. The extensive morphological and functional transformations that occur during osteoclast differentiation require substantial reprogramming of gene and protein expression. Here we employ -omic-scale technologies to examine in detail the molecular changes at discrete developmental stages in this process (precursor cells, intermediate osteoclasts, and multinuclear osteoclasts), quantitatively comparing their transcriptomes and proteomes. The data have been deposited to the ProteomeXchange with identifier PXD000471.
Our analysis identified mitochondrial changes, along with several alterations in signaling pathways, as central to the development of mature osteoclasts, while also confirming changes in pathways previously implicated in osteoclast biology. In particular, changes in the expression of proteins involved in metabolism and redirection of energy flow from basic cellular function toward bone resorption appeared to play a key role in the switch from monocytic immune system function to specialized bone-turnover function. These findings provide new insight into the differentiation program involved in the generation of functional osteoclasts.
An emerging understanding indicates that cells of monocyte-macrophage lineage are not simply effectors of host defense but able to take on a variety of other functional roles in different tissues ranging from wound healing and growth support (1) to bone remodeling when they differentiate into mature osteoclasts. Osteoclasts are bone-degrading cells that form through fusion of multiple monocyte-macrophage-like cells exposed to the cytokine RANKL1 (also known as Tnfrsf11a), a member of the tumor necrosis factor superfamily (2, 3). The action of osteoblastic bone deposition and osteoclastic bone degradation maintains both calcium homeostasis and bone integrity. However, if the activities of osteoblasts and osteoclasts become imbalanced, especially if osteoclastic activity is higher than osteoblastic activity, individuals can develop arthritis (4), osteoporosis (5), Paget disease (6), and bone metastasis (7) causing pain and fractures. The long-term use of drugs used to treat these skeletal diseases can cause side effects such as osteonecrosis (8).
Given the obvious medical importance of these conditions, as well as interest in basic cellular physiology, many studies have been conducted to analyze the specific cellular components that endow osteoclasts with their functionality. Early analysis of cDNA libraries from osteoclastoma tissue (9) and bone immunostainings (10, 11) led to the discovery of high levels of tartrate-resistant acid phosphatase (TRAP), V-ATPases, and cathepsin K as characteristic molecular components of osteoclasts. More recently, -omics approaches such as siRNA library screening (12, 13), proteomics (14–16), and transcriptomics (17) were used to impute osteoclast proteins and their changes during differentiation in vitro using RANKL-exposed RAW 264.7 cells (a mouse monocyte-macrophage cell line) as an osteoclast precursor (OP) cell model. However, OPs (18) undergo multiple steps in their differentiation into osteoclasts. TRAP-negative OPs begin to express TRAP upon RANKL treatment as the initial step, and then these TRAP-positive (+) mononuclear “intermediate osteoclasts” (IOs) fuse together to form TRAP+ multinuclear osteoclasts (OCs). OPs respond to RANKL heterogeneously, possibly because of differences in RANK (the receptor for RANKL) expression, cell cycle stage, cell density, and/or transcriptional noise (19). All of the aforementioned in vitro -omics studies of OCs were conducted using heterogeneous cell populations that contained varying mixture of IOs and OCs, complicating the assignment of transcriptome and proteome findings to OCs alone, as is common in these reports.
Here we report the results of experiments specifically designed to use high-throughput technologies and a systems biology perspective to quantitatively characterize the transcriptomes (microarray) and proteomes (SILAC and LC-MS/MS) of highly purified OP, IO, and OC cell populations arising from RAW 264.7 cell differentiation following treatment with RANKL in an effort to better describe the molecular processes and cell organelles involved in OC formation and function. Using this model system, we investigated transcriptome and proteome landscapes and concordance between mRNA and proteins at the cell-type level and at the organelle level, and we identified major differences among all three cell types (Fig. 1). Besides detecting up-regulation of previously reported proteins (V-ATPase, Acp5, cathepsin K, and integrins) in RANKL-treated cells, we found evidence that relative to precursor cells, OCs conserve energy by down-regulating pathways involved in cell cycle control, gene expression, and protein synthesis. Proteins involved in ATP synthesis and catabolism were in contrast up-regulated in OCs, suggesting that OCs increase ATP production relative to OPs and IOs. Finally, differences in the abundance of cytoskeletal proteins suggest that, not surprisingly, the OC-specific function of bone resorption requires cytoskeletal remodeling. These findings demonstrate how the use of modern high-throughput tools and a carefully designed, integrative, systematic approach can rapidly identify processes and molecules critical for a biological system.
Fig. 1.

Methodology used to identify and quantify changes in protein and mRNA expression during osteoclast differentiation. 3-plex SILAC strategy with LC-MS/MS for proteomics and bead array for transcriptomics were used to study the molecular mechanism of osteoclast formation. RAW 264.7 cells were labeled with heavy, medium, and light isotopes in culture and stimulated with RANKL for 5 days, and the OCs were separated from mononucleated cells expressing TRAP using the difference in adhesion. The proteins were extracted from each of the three samples, the samples were combined, and proteins were separated via SDS-PAGE and modified and digested with trypsin as described in “Experimental Procedures.” The samples were analyzed via LC-MS/MS. In parallel, RNA was extracted from three cell types, and the expression was assessed using microarrays. The results were quantified, and correlation analysis between the two datasets was performed. qPCR, Western blot, and/or targeted mass spectrometry were used to validate the findings using samples from different sources or the same source.
EXPERIMENTAL PROCEDURES
Cell Culture and Treatment
RAW 264.7 cells were purchased from the American Type Culture Collection (Manassas, VA). The cells were routinely maintained in phenol red–free Alpha Minimum Essential Medium (Invitrogen, Carlsbad, CA) containing 10% FBS (HyClone), 100 U/ml penicillin, 100 μg/ml streptomycin, and 25 ng/ml amphotericin B (Invitrogen) and cultured on 0.1% gelatin-coated (Sigma) dishes. To distinguish between proteomes of OPs, IOs, and OCs, we performed 3-plex SILAC and used mass spectrometry to quantify the proteome of each cell type. RAW 264.7 cells were subcultured in phenol red–free custom-made Alpha Minimum Essential Medium, as phenol red has an estrogen activity (20) that is reported to suppress RANKL-induced osteoclast formation (21), and arginine (Arg) and lysine (Lys) were replaced by 12C6-Arg and 14N212C6-Lys (light, Sigma), 13C6-Arg and 2H4-Lys (medium, Cambridge Isotope Laboratories, Tewksbury, MA), or 13C615N4-Arg and 13C615N2-Lys (heavy, Cambridge Isotope Laboratories). After these isotopes were fully incorporated into the cellular proteins (roughly four passages; each sample of medium- and heavy-labeled cells was checked to measure the label incorporation percentage), 412,300 cells of light-, medium-, and heavy-labeled cells were seeded onto 0.1% gelatin-coated 10-cm dishes (density: 7,500 cells/cm2) on day 0. Both medium- and heavy-labeled cells were treated with 40 ng/ml RANKL (R&D Systems, Minneapolis, MN) on day 1, and the medium was replaced with fresh medium with RANKL on day 3. On day 5, OCs were enriched from IOs in RANKL-treated culture dishes using the following stringent but gentle washing steps: (i) rinse with PBS and Moscona's high bicarbonate (23), (ii) incubate with Moscona's high bicarbonate for 15 min at 37 °C, (iii) collect the detached cells (IOs, used in the subsequent experiments), (iv) trypsinize for 15 min at 37 °C, and (v) pipette gently to detach and collect OCs. The goal of this stringent wash step was to remove as many of the IOs as possible from the dishes. To collect the IOs, the final pipetting wash was omitted, so as not to include OCs in the IO samples. We performed the reverse-labeling experiments using OCs from two different biological replicates and IOs from two other biological replicates. TRAP staining (Sigma) was performed to evaluate the enrichment method according to the manufacturer's instructions.
Microarray Analysis
Total RNA from the three sets of cells after RANKL treatment was extracted on day 5 using the RNeazy Mini Kit (Qiagen) and QIAshredder Mini Spin Columns (Qiagen, Los Angeles, CA) according to the manufacturer's instructions. RNA concentrations were measured using a NanoDrop UV-visible spectrophotometer (Thermo Scientific), and the quality of the total RNA was evaluated using a Bioanalyzer 2100 (Agilent Technologies, Columbia, MD). Three, four, and five biological replicates of total RNA with the highest RNA quality from the OPs, IOs, and OCs, respectively, were used for the transcriptome studies. Amplification of total RNA was performed using the Illumina TotalPrep RNA Amplification Kit (Invitrogen) according to the manufacturer's instructions, and purified cRNA was hybridized to the Illumina MouseWG-6 BeadChip and scanned using the Illumina HiScan-SQ imager according to the manufacturer's instructions. The average bead signal from GenomeStudio image analysis was log2-transformed and normalized using quantile normalization (JMP/Genomics software version 5.0, SAS, Cary, NC). Density plots and principal component analyses were performed using R to identify outlier samples.
There are papers addressing a normalization issue in a system where universal amplification (c-myc, for example) plays a role (24–26). Because similar levels of RNA/cells are usually assumed, one will fail to detect amplification of entire genes when bigger cells yield higher levels of total RNAs and the data are normalized to total RNA. However, in our study, the average volume of the nuclei of OPs was similar to the average volume of the nuclei of OCs, but the cell shape was little bit different because nuclei are clustered in OCs (supplemental Fig. S16). The sizes of OPs and IOs are similar, so we assumed that they produce a similar amount of RNA per cell. The concept that larger cells yield a greater amount of total RNA is not applicable to our system. Therefore, we believe that our normalization method was appropriate.
Mass Spectrometry Sample Preparation and LC-MS/MS Analysis
Proteins were extracted from cells using RIPA buffer (Sigma) containing protease inhibitors (27), and the same amounts of proteins from each cell type (non-labeled OPs, medium-labeled OCs, and heavy-labeled IOs) were combined. Proteins were reduced with 50 mm DTT in Laemmli buffer for 5 min at 90 °C and separated using one-dimensional SDS-PAGE (Invitrogen). Approximately 40 bands were sliced from each lane and subjected to in-gel trypsin digestion (Promega, Madison, WI) (28). Extracted tryptic peptides were dissolved in 0.1% formic acid. Each sample was injected using an autosampler and loaded onto a C18 trap column (5-μm diameter C18 media, 300-μm trap column inner diameter, 5-mm trap column length) with a flow rate of 300 μl/min with 100% buffer A (0.1% v/v formic acid), and the sample was subsequently separated using an in-house-packed column containing Magic C18 AQ beads (200-Å pore C18 media, 5-μm diameter C18 media, 50-μm column inner diameter, 30-cm column length; Michrom Bioresources, Auburn, CA) at a flow rate of 200 nl/min using an Eksigent nano-HPLC system. The mobile phases consisted of 0.1% v/v formic acid in H2O (buffer A) and 0.1% v/v formic acid in acetonitrile (buffer B). A 65-min linear gradient from 5% to 45% buffer B was used. Eluted peptides were directly introduced into the mass spectrometer through a nano-electrospray source (ThermoElectron, Bremen, Germany). The spray voltage was set at 2 kV, and the heated capillary at 250 °C. The LTQ-Orbitrap Velos (ThermoElectron) was operated in a data-dependent mode in which each cycle consisted of one full MS survey scan performed with the Orbitrap at a 60,000 resolution with accuracy better than 10 ppm, and subsequently the top 10 most abundant ions (minimum signal threshold of 5,000) were selected for collision-induced dissociation MS/MS in the LTQ. The targeted ion count in the mass spectrometer trap was 500,000 for the MS scans and 10,000 for the MS/MS scans. Peptides were fragmented in the linear ion trap using collision-induced dissociation with helium, and the normalized collision energy value was set at 35%. The precursor ion mass tolerance was 50 ppm, and the fragment ion mass tolerance was 600 ppm. The mass spectrometry proteomics data (RAW files and DTA Select .csv files) have been deposited in the ProteomeXchange Consortium (http://proteomecentral.proteomexchange.org) via the PRIDE partner repository (29) with the dataset identifier PXD000471.
Global Protein Profiling and Quantitation
MS spectra were extracted from the raw data using Raw Xtractor (30). Protein identification was performed by searching against the mouse UniProt database (downloaded on January 18, 2011, and containing 16,332 entries) using IP2 software (Integrated Proteomics Application, San Diego, CA) equipped with Sequest (31) and ProLuCID (32). The search results from IP2 were filtered using DTASelect 2.0 (33). The database search assumed fully enzymatic tryptic cleavage with up to two missed cleavages. For peptide identification, the samples were searched twice: (i) Lys +4 and Arg +6 settings were used as variable modifications for the unlabeled and medium-labeled cells, and (ii) Lys +8 and Arg +10 were used for the unlabeled and heavy-labeled cells (8.0142 for Lys and 10.00827 for Arg for heavy-labeled sample, and 4.025 for Lys and 6.02 for Arg for medium-labeled sample). Other variable modifications included in all analyses were Met oxidation, phosphorylation on STY, acetylation on K, and acrylamide adduction on C. For false discovery rate calculation, we used a target/decoy database containing reverse sequences of target proteins. The threshold for accepting spectra was set in IP2 at a false discovery rate of 0.05. Each searched file was quantified using the Census algorithm (34) and normalized using the median ratio (labeled/unlabeled). ANOVA was carried out to compare protein expression levels among the three sets of cells.
Network Analysis
To identify differentially regulated protein networks within the three sets of cells (OP, IO, and OC), Ingenuity Pathway Analysis software was used to analyze protein I.D.s and relative expression levels. First, analyses were performed using all of the data to generate a general overview of the networks. A second analysis was performed using only the data from the significantly altered protein or transcripts (log2 transformed ratios with absolute value ≥ 0.5) to visualize significant up- and down-regulation. Functions regarding cell cycle, gene expression, RNA trafficking, and protein synthesis were extracted to build networks and then overlaid with the data from the second analysis with the significance threshold applied.
Protein and mRNA Correlation Analyses
To correlate the transcript and protein expression levels, we removed redundancies in multiple matching gene symbols as follows. When a gene had multiple microarray probes, we took the brightest probe (35) with respect to the fold change. For gene symbols with multiple protein hits, we took the median matching value. The Pearson correlation was calculated for mRNA–protein pairs whose IO or OC mRNA expression levels were significantly different from those of OPs (p value < 0.05).
The geneset-test p value obtained from comparison to the external mRNA study was calculated by testing whether the external-study differentially expressed (DE) genes were highly ranked (by DE p value) relative to all of the other genes profiled in our study. We performed the test using the Wilcoxon rank-sum test implemented as the genesetTest function in the BioConductor Limma package in R.
Data Visualization
Protein expression values of OPs, IOs, and OCs were standardized and grouped into five clusters using GProX with following parameters: 1.4 for upper regulation threshold, 0.7 for lower regulation threshold, 2 for fuzzification value, and 100 for iterations. An enrichment test was performed for cellular location using Fisher's exact test with Benjamini and Hochberg used for p value adjustment using a minimum p value of 0.05.
Statistical Analysis
GraphPad Prism built-in analysis was used to perform one-way ANOVA (Tukey's range test) multiple t testing using the Holm–Sidak method with α = 5%, resulting in a set of p values. Log2-transformed ratios with absolute values of at least 0.5 were the applied threshold for both proteomic and transcriptomic data. DE genes from Sharma et al.'s (17) study were required to have p < 0.05 and up-/down-regulation fold change ≥ 1.2 as computed by the NextBio resource (36). Fisher's exact test was used to calculate p values for biological functions and canonical pathways in Ingenuity Pathway Analysis, and p < 0.05 was used as the threshold value.
Imaging
To image the mitochondria number and voltage potential, three sets of live cells were labeled with MitoTracker Green (Invitrogen) and MitoTracker Red (Invitrogen) according to the manufacturer's instructions. Images for bright field, green, and red were collected using a Leica confocal microscope or a Zeiss Axiovert epifluorescence microscope and quantified using Imaris software. Prism software was used to test for significant differences using ANOVA. TRAP stained cells were imaged using an epiflourescence microscope or a Leica M205 FA stereo microscope.
VDAC siRNA Knockdown
TransIT-TKO transfection reagent (Mirus Bio LLC, Madison, WI) and siRNA oligonucleotides (19 nucleotides) for both VDAC1 and VDAC2 (Thermo Scientific) or for a random nucletotide sequence at a final concentration of 200 nm (100 nm each) were mixed and incubated to form siRNA–lipid complexes. After the transfection reagent and siRNA mixtures had been added into each well in 24-well plates, RAW 264.7 cells were plated at 3 × 10⁵ cells per well. Knockdown efficiency was quantified via Western blotting using an antibody against VDACs (Cell Signaling Technologies, Beverly, MA). To evaluate ATP production, cells were collected either 48 or 72 h post-transfection, and ATP assays were performed using an ATP Assay Kit (EMD Biosciences, Bedford, MA). To measure the effect of VDACs during osteoclast formation, siRNA-transfected cells were replated at 1.5 × 10³ cells per well at 48 h post-transfection in 24-well plates, and RANKL (40 ng/ml) was added as described above. Cells were fixed with 4% paraformaldehyde (PFA), and TRAP staining was performed.
Validation of Discordant mRNA–Protein Pairs
First, we performed Western blotting with protein samples to check protein expression and compared the results with qPCR data obtained with RNA that was used for microarray analysis. For the Western blot analysis, proteins from each sample were separated via SDS-PAGE (4–12% Bis-Tris Gel, Invitrogen) under reducing conditions and transferred to nitrocellulose membrane (Bio-Rad). Nonspecific binding sites were blocked with 5% milk (Bio-Rad), and the membrane was incubated overnight with antibodies for target proteins (rabbit anti-GFM1 (Abcam, Cambridge, MA) at 1:500; rabbit AIFM3 (Abcam) at 1:1,000; mouse anti-ATP5F1 (Abcam) at 1:1,000; rabbit anti-MTX2 (Abcam) at 1:1,000; rabbit anti-VDAC1 (Cell Signaling Technology) at 1:1,000; and rabbit anti-VDAC2 (Cell Signaling Technology) at 1:1,000) in 2.5% milk. The next day, the membrane was rinsed with Tris-buffered saline (137 mm NaCl, 2.7 mm KCl, 19 mm Tric Base, pH 7.4) containing 0.1% Tween-20 and incubated with secondary anti-rabbit and anti-mouse antibodies (1:20,000 for both) conjugated with horseradish peroxidase. Immunoblots were visualized by chemiluminescence (GE Healthcare) and recorded on Fujifilm LAS-4000. Target protein expression was normalized to the GAPDH expression level. Then we performed direct comparison for targeted RNA–protein pairs from the same samples, which allowed us to validate microarray and proteomic analysis that used a different biological source. Total RNA and proteins were isolated simultaneously from each cell group using RNeasy for qPCR and semi-targeted quantitation, respectively. Briefly, OPs on a 10-cm dish were lysed by 600 μl of RLT buffer, and the cells were scraped from the dish. OCs were enriched as described above, and 350 μl of RLT buffer was added to the dish, after which cells were further lysed by being scraped from the dish. Each lysate was homogenized using QIAshredder (Qiagen), 70% ethanol (1 volume) was added to the homogenized lysate, and the solution was transferred to an RNeasy column and spun down using a countertop centrifuge. After the centrifugation, RNAs remained on the RNeasy membrane and proteins passed the membrane, so flow-though was collected for protein harvest. The membrane was washed with RW1 buffer to remove remaining protein on the membrane, and the flow-through was collected and combined with the previous flow-through for protein harvest. Total RNA on the membrane was processed according to the manufacturer's instructions, and proteins in the flow-through were precipitated using cold acetone. Total RNA (250 ng) was converted to cDNA using a High Capacity RNA to cDNA Kit (Applied Biosystems, Grand Island, NY) according to the manufacturer's instructions, and duplex reactions using VIC-labeled primer limited internal control assay and FAM-labeled target assay (supplemental Table S7) were used for real-time PCR using TaqMan Gene Expression Master Mix (Applied Biosystems) according to the manufacturer's instructions. The 2-ΔΔCT method (37) was used to calculate relative changes in gene expression. The expression level of target FAM-labeled mRNA (list) was normalized with VIC-labeled internal control mRNA, and the mean target mRNA expression level for the three mRNA measurements was calculated in two different cell groups (OP and OC). Extracted proteins from acetone precipitation were used to quantify protein expression in OPs and OCs. A global mass list with a schedule for MS/MS was used for semi-targeted protein quantitation on the Orbitrap-Velos using a 3-h separation method. At least two peptides per target protein were included in the global mass list, and an Extracted Ion Chromatogram (XIC) of each peptide was normalized to an XIC of two GAPDH peptides for quantitation.
RESULTS
Transcriptomic Profiling of Purified Cell Subsets Reveals Genes Regulated during Osteoclast Differentiation
To define intermediate stages of differentiation between OPs and OCs, we examined the morphology, size, nuclear status, and classical marker phenotype of RAW 264.7 (18) cells exposed to RANKL in vitro. When OPs were treated with RANKL for 5 days, the majority of the cells did not form mature multinucleate OCs, but they nevertheless expressed high levels of TRAP (supplemental Fig. S1) while maintaining the same cell size as OPs. When the TRAP+ mononucleated OCs were seeded at a low density, they promptly differentiated into OCs on day 2 (supplemental Fig. S2), whereas TRAP-negative OPs incubated with RANKL did not start to form OCs until day 4. For the purposes of this study, we refer to TRAP+ mononucleated cells as intermediate osteoclasts. Given the clear demarcation of these cells from fully mature OCs, we made special efforts to separate purified IOs, OCs, and RANKL-unexposed OPs. After 5 days of RANKL treatment, OCs were successfully enriched based on their stronger adherent properties relative to IOs (supplemental Fig. S3). Such separation of OCs from the mononucleated cells expressing marker enzymes proved to be essential for the characterization of the OC transcriptome and proteome.
Using purified cell populations, we proceeded to characterize the transcriptome of each subset using microarrays. Microarray data, comprising normalized measurements of 23,624 oligonucleotide probes representing the transcripts of 13,521 genes, were obtained for at least three biological replicates for each cell population: OPs (n = 3), IOs (n = 4), and OCs (n = 4, after removing a single outlier) (supplemental Fig. S4). To estimate the expression level of genes represented by multiple probes, we selected the probe with the strongest average signal in the starting OP population. We first obtained an overview of the cellular processes altered during OC differentiation by grouping genes based on the log2-transformed fold change of their expression levels between differentiated cells (IOs or OCs) and the starting OP population and using known functional annotations (supplemental Fig. S5). This overview showed the transcriptome of OPs to be more similar to that of IOs than that of OCs (supplemental Fig. S5A). This observation was also confirmed through a clustering analysis of the 10,379 transcripts that were found to be different among the three cell types (at a false discovery rate of 5% and ANOVA p < 0.01) (supplemental Fig. S7A) and demonstrated the need for enriching OCs from IOs after RANKL treatment in order to study processes unique to OCs.
To understand the cell-type-specific transcriptional patterns in more detail, we next performed two comparisons: one comparing expression levels of genes in IOs versus OPs, and another in OC versus OP populations. Expression levels of 13,025 genes (96.3%) mapped from 22,927 probe sets (97%) were unchanged (absolute log2 fold change within 0.5) in the IOs relative to OPs, and 11,336 genes (83.8%) mapped from 20,368 probe sets (86%) of OCs were within the same threshold (supplemental Fig. S6). The transcript expression distribution in IOs was tighter than in OCs when normalized to OPs (Figs. 2A and 2B). A total of 1,846 genes (910 down-regulated genes mapped from 1,415 down-regulated transcripts and 936 up-regulated genes mapped from 1,372 up-regulated transcripts) were detected as differentially regulated exclusively in the comparison of OCs versus OPs, and a total of 157 genes were detected as differentially expressed only in IOs versus OPs. Whereas 135 genes were down-regulated and 152 genes were up-regulated in both RANKL-treated cell types relative to OPs (i.e. in both IO versus OP and OC versus OP comparisons), a total of 46 genes had their direction of regulation (up or down) reversed between the IO versus OP and OC versus OP comparisons (supplemental Fig. S5A).
Fig. 2.

Expression level changes at the transcriptional level and translated level during osteoclast development. Transcriptomes from IOs (A) and OCs (B) changed slightly during osteoclast differentiation. However, proteomes from IOs (C) and OCs (D) indicated that protein expression levels were further regulated during the differentiation (bin size = 0.10). The ratios were calculated using the corresponding OP values.
To place these transcriptional changes in a more functional context, we used pathway analysis. Many of the individual changes in the transcript data could be mapped to a modest number of molecular and cellular functions or canonical pathways. Transcripts encoding proteins involved in the cell cycle, cellular growth and proliferation, DNA replication, recombination, and repair were down-regulated only in OCs and not in IOs relative to OPs. Transcripts involved in cellular assembly and organization, TCA cycle, and integrin signaling were found to be up-regulated only in OCs (see supplemental Table S1 for p values). Z-score analysis for the direction of transcript change revealed that the expression of genes encoding proteins involved in cellular assembly and organization increased in OCs relative to OPs and IOs versus OPs, whereas those encoding proteins involved in DNA replication, recombination and repair, cellular growth and proliferation, and free radical scavenging decreased only in OCs. In IOs, the expression of genes encoding proteins involved in DNA replication, recombination and repair, and RNA processing pathways increased relative to OPs; transcripts encoding molecules involved in cellular movement decreased in OCs (see supplemental Table S2 for p values).
The Proteome Changes Significantly during Osteoclast Formation
Although analysis of transcriptional changes is a powerful method for global analysis of a cell state, it is the translated proteins that play a dominant role in cellular function. To obtain an integrated view of the changes in protein expression during OC development, we compared the proteomes of OPs, IOs, and OCs. Even though the SILAC method has been widely used and reverse labeling is not necessary in most experiments using homogeneous cell cultures, reverse labeling (38, 39) was used here to ensure quality control of the OC enrichment process. A total of 5,515 non-redundant proteins (corresponding to 5,615 redundant proteins) were identified in this dataset if just one peptide per protein was considered adequate for identification. Moreover, if we took protein isoforms as different proteins and searched against a redundant database (40, 41), we project that the number of identified proteins would be similar to what other deep proteomics papers have reported (40, 41). However, in our investigation we used the relatively stringent requirement of ≥2 peptides per protein for protein identification using highly curated database. In this way, we identified a total of 2,826 non-redundant proteins (defined as ≥2 peptides per protein identification with a false discovery rate of 0.05) from two biological, reverse-labeled replicates. Of these, 2,068 proteins (73.4%) were comparatively quantified in all three cell types (2,073 proteins were quantified between OPs and OCs) using Census (34). OP values were used as the reference when computing fold change ratios. (supplemental Table S3). The one-dimensional SDS-PAGE protein separation method helped in the accurate measurement of protein ratios, partially distinguishing between the ratios of isoforms and truncated forms (supplemental Table S3). The proteome data were processed using the same fold change threshold as the transcriptome data (i.e. each log2-transformed fold change ratio was required to have an absolute value of ≥0.5). Of the 2,068 proteins quantified in all three cell types, 867 proteins (42%) had levels that were altered exclusively in the OCs relative to OPs (i.e. the expression levels of these proteins didn't change between IOs and OPs). In contrast, only 98 proteins were differentially regulated exclusively in the IOs. The expression levels of 257 proteins (12.4%) were either down- or up-regulated (122 and 135 proteins, respectively) in both IOs and OCs (relative to OPs), and 48 (29 and 19 proteins) showed a reversed direction of change between IOs and OCs (supplemental Fig. S5B).
The most significant molecular and cellular functions of the 492 down-regulated proteins in the OCs relative to OPs involved RNA post-transcriptional modification, protein synthesis, molecular transport, RNA trafficking, cell cycle, DNA replication, recombination, repair, and gene expression (for the p values, see supplemental Table S1). In contrast, the 375 up-regulated proteins in OCs were involved in cellular assembly and organization, cellular function and maintenance, and cell morphology (supplemental Table S1). The majority of the proteins involved in these functions were not differentially expressed between the IOs and OPs, except for a few proteins involved in protein synthesis, lipid metabolism, and molecular transport (supplemental Fig. S5B), which points to the complementary view of cellular regulation provided by the proteomic data. The IOs had a protein expression landscape that was generally similar to that of the OPs (supplemental Fig. S5B), and the protein expression distribution between OPs and IOs was tighter than the protein distribution between OPs and OCs (Fig. 2, supplemental Fig. S7B), demonstrating that IOs are more similar to OPs at the proteome level, as observed also at the mRNA level.
A Cross-comparison of Transcriptome and Proteome Findings
A total of 13,521 genes whose transcripts were profiled by microarray and a total of 2,073 quantified proteins examined by mass spectrometry were used to conduct an analysis that (i) searched for coordinate mRNA and protein changes during differentiation based on molecular functional classification, (ii) looked at the extent of correlation in overall expression levels of mRNAs versus proteins, and (iii) searched for coordinate mRNA and protein changes during differentiation based on cellular localization of the encoded proteins.
To ensure that the proteins quantified in our proteomic study were not only those more highly expressed than non-quantified proteins (which would introduce a bias to the correlation analysis), we used the expression mean of the probe and detection p value from the microarray data from this study and the detection p value from independent microarray data from RAW 264.7 cells and bone-marrow-derived macrophages with an assumption that probe signal and detection p value have a linear relationship with protein production. Our data suggest that the quantified proteins were not limited to the proteins translated from the most abundant transcripts (supplemental Fig. S8).
We first looked for correlated changes based on the classification of molecular functions in IOs and OCs relative to OPs at both transcriptome (supplemental Fig. S5A) and proteome levels (supplemental Fig. S5B). Although expression levels of mRNAs and encoded proteins for individual genes did not necessarily change in the same direction (supplemental Figs. S5 and S6), the direction of change when analyzed at a functional level showed good correlation between transcriptomic and proteomic data. For example, transcripts and proteins involved in the cell cycle, DNA replication, recombination, and repair were down-regulated, and the ones involved in cellular assembly and organization, cellular function, and maintenance were up-regulated in OCs (supplemental Fig. S5A).
When we compared the OCs to the OPs without applying any threshold to filter both datasets, 1,933 genes and proteins encoded by the same genes were identified in both the transcriptome and the proteome, and changes in their mRNA and protein levels exhibited weak (albeit statistically significant) correlations with a big spread (Pearson's correlation = 0.28 with p = 8E-36, supplemental Fig. S9A, supplemental Table S4; similar correlations were observed between OPs and OCs as shown in supplemental Fig. S9B). These correlations improved when certain technical filters similar to ones employed in earlier studies were applied to the transcriptome and proteome datasets, but very strong correlations could still not be achieved, possibly because of underlying differences in mRNA/protein turnover rates and post-transcriptional, translational, or similar mechanisms (the very factors that motivated the simultaneous profiling of transcriptome and proteome in the first place). For example, when an adjusted differential expression p value of 0.1 or 0.05 was used to filter transcriptome data so as to retain only differentially regulated genes, the Pearson's correlation improved to 0.37 for both OCs and IOs (supplemental Table S4). Similarly, when we filtered proteome data to retain only measurements that were successful on two biological replicates, the correlation between changes in transcripts and proteome improved to 0.36 in OCs (supplemental Fig. S9C) and showed less clear changes in IOs (supplemental Fig. S9D). When we applied both the transcriptome and the proteome dataset filters together, the Pearson's correlation improved to 0.5 (OCs) and 0.43 (IOs), comparable to published data (18, 41–45). However, we focused on the overall dataset without additional filters to retain more of the transcript–protein pairs for downstream analysis.
Regulation of Nuclear and Membrane Proteins Mirrors the Functional Changes in Osteoclasts
Classification of all 2,073 quantified proteins for each of the three cell types based on cellular localization was performed using information from UniProt (Fig. 3A) and expressed in terms of the relative quantitative changes seen during differentiation. This analysis revealed that the mean expression of nuclear proteins was down-regulated but the mean expression of mitochondrial proteins was up-regulated in OCs (Figs. 3B and 3C) relative to their less differentiated precursors. An enrichment analysis for cellular location and unsupervised clustering of the data by fuzzy-c means (Fig. 3D) using GProX (46) provided results consistent with this analysis.
Fig. 3.

Protein abundance changes at different subcellular locations. A, bar graph of protein distribution for the whole set of proteins quantified. B, line graph of mean protein ratio of the total protein expression (top, black line graph), of the nuclear proteins (yellow line graph), and of mitochondrial proteins (dark blue line graph). C, the protein distribution of IOs (dotted line) and OCs (solid line) shows that IO proteins had a tighter protein distribution than OC proteins, and the mean distributions of nuclear and mitochondrial proteins were altered as shown in B. D, protein expression profile depends on cellular location. For example, nuclear proteins were enriched in cluster 5, where protein expression was down-regulated, whereas mitochondrial proteins were enriched in cluster 3, where protein expression was up-regulated in OCs.
Proteins in the Ras-related nuclear protein signaling pathway involved in recognizing nuclear localization signals and translocation of nuclear proteins were down-regulated in OCs (supplemental Fig. S10), perhaps explaining the overall decrease in the expression of nuclear proteins (Fig. 3B). Also, nuclear proteins were enriched in a cluster where nuclear proteins were down-regulated in OCs (Fig. 3D). Whereas the majority of nuclear proteins were decreased in expression in OCs relative to less differentiated cells, transcription factors responsible for the expression of key osteoclast genes were up-regulated at the transcriptional level (Fig. 4). In addition, based on the expression levels of target transcripts (and not on the expression levels of the transcription factors), Ingenuity Pathway Analysis predicted the activity state of these transcription regulators. The majority of these transcription factors (including transcription enhancers and repressors) were inversely expressed in IOs and OCs. This was especially true of Cdkn2a, Tcf3, Trp53, Rb, and Mxi1. Interestingly, Nfatc1 and Mitf, known transcription regulators of OC formation (47, 48), were predicted to be activated only in OCs based on the expression level of their target transcripts. Multiple transcription factors such as Nfatc1 (a.k.a. NFAT2), Mitf, Sfpi1 (a.k.a. PU.1), and Jun (a.k.a. AP-1; heterodimer of proteins from the Fos and Jun families) are well documented as being involved in osteoclast differentiation, and nuclear translocation of these transcription factors is essential to promote expression of OC maturation-associated genes (49–51). Among these transcription factors, Nfatc1 is considered a master regulator of OC differentiation because Mitf and Sfpi1 recruit Nfatc1 to the promoters of OC-specific genes (51), and NF-κB and Jun drive Nfatc1 expression (52, 53). Upon binding of RANKL to RANK, TRAFs are recruited to RANK and induce kinase signaling pathways that activate Rela (a.k.a NF-κB) and subsequently activate and/or initiate the expression of transcription factors. Interestingly, it was reported that RANKL induces Ca2+ elevation in OCs (54), and Nfatc1 and Jun are regulated by Ca2+/calmodulin (55). The levels of mRNAs and proteins involved in RANK and Ca2+ signaling pathways in IOs and OCs were examined (Fig. 4), and the expression of several kinases and transcription factors directly downstream from TRAFs was found to be up-regulated or unchanged, except that of Rela, which was down-regulated at the protein level. Transcription factors involved in Ca2+ signaling were clearly up-regulated in both IOs and OCs, suggesting that RANK signaling initiates the expression of target genes during OC differentiation and that Ca2+ signaling is involved in maintaining the target gene and protein expression in OCs.
Fig. 4.

RANK and Ca2+ signaling during osteoclast differentiation. Activation of transcription factors (yellow rectangles) via RANK and Ca2+ signaling was detected during osteoclast formation. Based on the expression levels of mRNA and proteins in the IOs and OCs relative to the OPs, it is possible that RANK signaling is responsible for initial osteoclast formation and Ca2+ signaling is responsible for osteoclast maturation. Blue = down-regulation; red = up-regulation; gray = unchanged (i.e. absolute value of log2-transformed ratio < 0.4).
Cytoskeletal reorganization is necessary for OC function, and this reorganization is initiated by integrin αVβ3 activation. We found that protein expression of integrin αV was up-regulated only in OCs, whereas integrin α5 was elevated in both IOs and OCs, with the changes in mRNA levels of these integrins correlating well with the alterations in their protein levels. Integrin β3 protein was not identified, and mRNA encoding integrin β3 was found to be unchanged during differentiation. Integrin α5β1 is involved in recognizing fibronectin, a bone matrix protein (56), and although the expression of integrin α5 mRNA and protein increased in the IOs and OCs, protein expression of integrin β1 was down-regulated, and mRNA of β1 was unchanged in these cells. In general, the expression of integrin α chain showed good correlation between mRNA and protein, but that of integrin β chain did not. Galectin-3 is an inhibitor of osteoclastogenesis (57), and its expression was increased only in OCs and was down-regulated in IOs in the proteome dataset. However, another function of galectin-3 is to activate integrin αVβ3 (58). Up-regulation of galectin-3 might be involved in the cellular remodeling that is critical for OC function. Another membrane protein, talin, is known to bind and activate β integrin. There are two highly homologous genes for talins (74% identity): talin 1 was reported to be the only form expressed in platelets (59), and talin 2 is predominantly expressed in the brain. Talins have two domains (a head domain and a rod domain), and the domain bridge is cleaved by calpain. Although it has been shown that cleavage of talin is not required for integrin activation (60), Yan et al. showed that the cleaved form of talin promotes binding to the β3 integrin (61). We identified talin 1 in our study; up-regulation of cleaved talin 1 protein and talin mRNA was detected only in the OCs. Interestingly, mRNA and protein expression level of calpain subunit 1 was up-regulated in OCs, supporting the notion that talin is cleaved by calpain in these cells. Furthermore, calpain is known to be activated when intracellular calcium levels increase (62).
Once integrins are activated, the formation of a sealing zone and actin rings takes place (63). The sealing zone is essential to facilitate bone resorption, and it consists of podosomes (which have a dense actin core surrounded by integrin), focal contact proteins (e.g. vinculin and paxillin), actin-associated proteins (e.g. gelsolin, α-actinin, tyrosine kinases, RhoGTPases), and proteins involved in actin polymerization (e.g. Was). Proteins involved in podosome formation (e.g. actin, vinculin, gelsolin, actinin, tyrosine kinase 2-β, protein tyrosine kinase Lyn, Rac1, Rac2, and Was) were up-regulated in OCs, and transcripts for these proteins were generally increased as well in these cells (supplemental Fig. S11).
An example of a protein involved in podosome formation whose mRNA level very clearly did not correlate with protein level is gelsolin, whose transcript level was decreased in the OCs, whereas the protein level was increased. The transcript for gelsolin was, however, up-regulated in IOs (supplemental Fig. S11 and supplemental Table S3), and the protein half-life of gelsolin is very long (more than 200 h according to Schwanhausser et al. (45)). Perhaps the down-regulation of transcript but up-regulation of translated gelsolin in OCs is due to the long half-life of the translated protein. Also, paxillin, which was identified in only one replicate, was found to be down-regulated, but the mRNA of paxillin was unchanged, unlike other podosome proteins (supplemental Table S3).
Regulated Mitochondrial Proteins Are Critical for Osteoclast Formation
Mitochondria contain the respiratory assembly and oxidative enzymes and are responsible for the cellular metabolism, converting energy and oxygen into energy-storing molecules such as ATP. Recently, they have begun to gain recognition as the organelle pivotal for OC function, as they provide a balance between the bone-resorbing activity and OC survival by balancing the intracellular ATP level and use. Mature OCs, rich in mitochondrial DNA, release ATP from intracellular stores into the cytoplasm, and the subsequent ATP depletion causes increased bone resorption and increased OC apoptosis. Because of the importance of mitochondria in OC function, we looked closely at mitochondria-related changes during OC differentiation.
In addition to finding changes in mean mitochondrial protein expression (Fig. 3B) and an enriched cluster of up-regulated mitochondrial proteins in OCs (Fig. 3D), we also found that the correlation coefficient increased in mitochondria when we checked the correlation of transcript–protein expressions stratified by their cellular location (supplemental Table S4). Surprisingly, the transcript-versus-protein correlation of mitochondrial proteins (Fig. 5) was almost double that of all proteins (Fig. 5, supplemental Table S4).
Fig. 5.
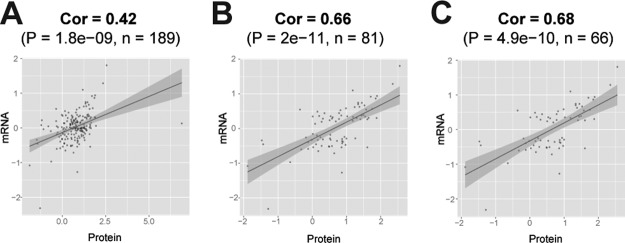
Correlation between genes and mitochondrial proteins was higher than for other cellular components. The log2 values of the OC/OP ratios are plotted on both axes for mitochondrial genes/proteins without filtering (A), and with filtering to retain only gene transcripts differentially expressed at p-value 0.1 (B) or 0.05 ©.
In contrast to the up-regulation of mitochondrial proteins in OCs and the high correlation between transcripts and proteins, pathway analysis revealed that proteins involved in basic cell functions, such as cell cycle control, DNA replication, gene expression (supplemental Fig. S12A), RNA trafficking (supplemental Fig. S12B), and protein synthesis (supplemental Fig. S12C), were down-regulated in the OCs. These data suggest that OCs limit the energy used for essential cellular functions in which ATP is the energy donor. As ATP is produced during oxidative phosphorylation, which takes place in the mitochondria (64), we turned our attention to the mitochondrial proteins involved in oxidative phosphorylation. Complexes I through IV are involved in generating an H+ gradient in mitochondria, and ATP synthase then uses this H+ gradient to produce ATP. The average expression levels of these mitochondrial proteins were slightly higher in the IOs and significantly higher in the OCs than in OPs (Fig. 6A). In addition to up-regulation of the mean of mitochondrial protein expression in the OCs (more than 1.7-fold higher than in the OPs and IOs), the expression level of the oxidative phosphorylation proteins was higher than the expression level of the mitochondrial proteins in general (supplemental Table S5), suggesting both that there might be more mitochondria per unit cell volume and that each mitochondrion might have an increased average number of the oxidative phosphorylation proteins.
Fig. 6.

Elevated energy production in multinucleated osteoclasts. A, multinucleated osteoclasts had higher expression of proteins involved in ATP synthesis than OPs and IOs (mean ± S.E.; two-way ANOVA; *p < 0.001). The level in OPs was set at 1. We used live cell imaging with MitoTracker Green (B, top) and Red (B, bottom) to image increased mitochondria mass per unit cell volume and voltage potential, respectively, in the OCs relative to the OPs and IOs. Quantitative analyses of live cell imaging are shown (scale bar = 20 μm). C, both mitochondrial mass (top) and potential (bottom) of the OCs were higher than those of the OPs (mean ± S.E.; one-way ANOVA; **p < 0.0001 at 99% confidence level). D, intensity for both mitochondrial mass and potential in OCs was shown to be dependent on the number of nuclei. E, proteins involved in catabolism were found to be up-regulated in OCs. The first bar (left) indicates IO relative protein abundances, and the second bar (right) is the same, but for the OC data. In general, more up-regulated proteins (red) were observed in the OCs (green = down-regulated; gray = no change). The total length of the bars represents all the proteins known to be involved in a given pathway, and the white part of the bar represents the proteins we did not observe in our quantitative dataset. OP = osteoclast precursor, IO = intermediate osteoclast, OC = multinuclear osteoclast.
We measured the mitochondrial mass and total voltage potential using MitoTracker Green and MitoTracker Red, respectively. Signal intensities for both MitoTracker Green (Fig. 6B, top) and MitoTracker Red (Fig. 6B, bottom) were higher in the IOs and OCs than in the OPs. Statistical analysis of the MitoTracker Green–labeled cells confirmed that the OCs had significantly more mitochondrial mass per unit cell volume than the OPs (Fig. 6C, top); live cell imaging using MitoTracker Red demonstrated that the total voltage potential of mitochondria in OCs was greater than that in OPs (Fig. 6C, bottom), suggesting that the mitochondria were functional and that the OCs generated more ATP. The mean intensity for mitochondrial mass (18) and potential (bottom) in OCs was dependent on the number of nuclei (Fig. 6D).
Proteins in catabolic pathways were up-regulated in OCs (Fig. 6E), and complex II, involved in the TCA cycle, displayed a greater increase during maturation than other complexes (Fig. 6A), suggesting that OCs up-regulate the TCA cycle to increase ATP production. Mitochondrial proteins VDAC1 and VDAC2, voltage-dependent anion channels that are involved in regulating energy metabolism (65, 66), were both at least 2-fold up-regulated in the OCs, but their mRNA levels were unchanged. This might be because VDAC proteins have a relatively long half-life. Schwanhausser et al. reported that proteins are on average 5-fold more stable than mRNA, whereas the half-lives of VDAC proteins are up to 23-fold longer than the half-lives of VDAC transcripts in the fibroblast cell line (45).
To test whether VDAC expression plays a critical role in OC development, VDAC1 and VDAC2 were knocked down using siRNA (Fig. 7A, inset), and ATP production was evaluated. RAW 264.7 cells treated with VDAC siRNA contained lower ATP levels than the control cells (Fig. 7A). Fewer OCs were formed from RAW 264.7 cells in which VDACs were knocked down than from control cells (Figs. 7B and 7C), demonstrating that VDACs have an important function in OC formation or viability.
Fig. 7.
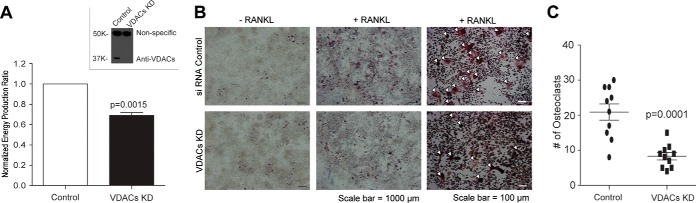
VDACs are involved in osteoclast formation. A, VDAC knockdown reduced OP ATP production by 30% relative to OPs transfected with control siRNA (mean ± S.E.; Student's t test (paired, two-tailed); p value = 0.0015). High VDAC knockdown efficiency was confirmed using an immunoblot with an antibody against both VDACs (inset). B, fewer osteoclasts were formed when VDACs were knocked down using siRNA than in control cells. The scale bar for images in the two left-hand columns is 1000 μm, and the scale bar for images in the right-hand column is 100 μm. C, statistical analysis using 10 images (1.4 mm2 per image) from control and VDAC KD confirmed that fewer osteoclasts were formed when VDACs were knocked down (mean ± S.E.; t test, unpaired, two-tailed; p value = 0.00001).
Mitochondria play a key role in apoptosis (64). The mitochondrial permeability transition pore contains VDACs up-regulated in mature OCs. Generally, mitochondrial proteins involved in cell death were found to be mainly up-regulated in OCs (supplemental Fig. S13, supplemental Table S6), favoring cell death. These data indicate that when OCs get above a certain size and acquire too many nuclei, they also have too many copies of mitochondria (Fig. 6), all of which can lead to cell death. In our study, proteins involved in caspase-dependent apoptosis were up-regulated (caspase 8/10, HtrA2, cytochrome C, and lamin A), down-regulated (fodrin), or unchanged (tBid, Bak, Bax, and caspase 3). However, caspase-independent apoptosis might be up-regulated in OCs. Ribosomal protein S6 kinases (Rps6ka2), including ribosomal protein S6 kinase α-1 and -3, were found to be down-regulated, and the kinases upstream of S6 kinases, such as Map2k, Mapk1, or Plcg1, were down-regulated or unchanged. Rps6ka2 inhibits Bad, which suppresses the function of Bcl2 and Bcl2l1, and these proteins inhibit Aifm (e.g. Rps6ka2 antagonizes Aifm). Although these proteins (Bad, Bcl2, and Bcl2l1) were not identified in all three cell types and their mRNAs were not significantly changed in this study, the corroborated results suggest that down-regulated Rps6ka2 might be responsible for the up-regulation of Aifm, which is involved in caspase-independent apoptosis. The link between increased number of nuclei and programmed cell death might be a general phenomenon not limited only to OCs, as multinucleation causes significant alterations to the cellular proteome and transcriptome.
The System Is Rewired from the Immune Cells to the Specialized Bone-resorption Cells
Transcripts and proteins involved in innate immunity, such as Tlr2, Lyz1, Lyz2, prothymosin α, and Cd14, were found to be down-regulated in OCs. Also, αMβ2, a receptor for complement component 3, was found to be down-regulated at the protein level in both IOs and OCs, suggesting that OPs (cells of macrophage-monocyte lineage) undergo rewiring of their immune networks during maturation to support OC-specific functions (e.g. bone resorption) before entering the IO stage. Interestingly, Rab32, a protein involved in the synchronization of mitochondrial fission, was down-regulated during OC maturation, and mitochondrial changes during OC formation are described above. Also, mRNA of Trafd1, a negative-feedback regulator that controls excessive innate immune response, was found to be up-regulated. αM β2 integrin, the receptor for complement component 3, was found to be down-regulated, again confirming the general down-regulation of the immune response. Recently, Bordbar et al. identified immunomodulatory metabolites of macrophage activation after building a macrophage genome-scale metabolic network (67). They reported that lysine activates both M1 and M2 immune activation pathways, whereas tyrosine, phenylalanine, and tryptophan have a suppressive effect on both M1 and M2 pathways. Interestingly, proteins involved in lysine degradation and in phenylalanine, tyrosine, and tryptophan biosynthesis were found to be up-regulated in OCs, leading to a low level of lysine but high levels of tyrosine, phenylalanine, and tryptophan, causing, in turn, M1 and M2 immune suppression, supporting the notion that the immune cells (18) are rewired to take on non-immune functions when they are differentiated to specialized bone-resorption cells (OCs).
A core signature of 39 genes that is shared by different mouse tissue macrophage populations and which distinguishes macrophages from a similar cell type, dendritic cells, was systematically derived by the Immunological Genome Consortium from gene expression data. Thirty-seven of these genes were represented in our microarray, and a significantly large fraction of them were differentially regulated in IOs versus OPs (14 DE genes whose adjusted p value was <0.05, with the significance of DE fraction 14/37 given by hypergeometric overlap p = 0.00057) and in OCs versus OPs (21 DE genes, overlap p = 0.0062), supporting substantial reprogramming of core macrophage genes during OC development. An extended set of 361 core macrophage genes was available from the same study, and 312 of them represented in our microarray support the same conclusion as well (101 DE genes in IOs versus OPs with hypergeometric p = 5.5e-15, and 169 DE genes in OCs versus OPs with hypergeometric p = 5.0e-12).
Validation of Discordant mRNA–Protein Pairs
We chose mRNA–protein pairs that were not correlated at the expression level in OCs, along with two positive controls: TRAP and cathepsin K. Because we found that mitochondria play a key role in OC function and differentiation, we selected the mitochondrial mRNA–protein pairs (supplemental Table S7). First we performed qPCR and Western blotting with samples from different sources. As shown in Fig. 8, qPCR data indicated that most mRNA of interest did not change in expression level between OPs and OCs, with the exception of VDAC1, which increased almost 2-fold, although this change was not statistically significant. For protein expression, we examined four proteins using Western blotting (Fig. 8C) and confirmed that their expression levels were increased in OCs relative to OPs, as in our mass spectrometric proteome analysis.
Fig. 8.

Validation of discordant mRNA–protein pairs. Target mRNA levels were validated as non-regulated (A and B) using qPCR, whereas their protein expression levels were up-regulated according to Western blot (C) and semi-targeted mass spectrometry (D) approaches in samples from different sources (A and C) and from the same source (B and D). Statistical significance was determined using the Holm–Sidak method with α = 5% (mean ± S.E.; *significant). ACP5, tartrate-resistant acid phosphatase 5 (also commonly abbreviated as TRAP); VDAC1, voltage-dependent anion channel 1; MRPS22, mitochondrial ribosomal protein 22; GFM1, mitochondrial elongation factor G1; CTSK, cathepsin K; AIFM, mitochondrial apoptosis-inducing factor; ATP5F1, ATP synthase, H+ transporting, mitochondrial Fo complex, subunit B1; MTX2, metaxin 2.
Then we performed a direct comparison using mRNA and protein that were simultaneously harvested from the same samples in order to avoid sample variation. We used qPCR to validate the microarray data along with a scheduled semi-targeted mass spectrometry approach employing a global mass list (68) with retention time. In this analysis, mRNA expression of VDAC1 was slightly increased in OCs relative to OPs (p = 0.05), but their expression levels were below 2 (log 2 value = 1), which is usually used as a threshold (69, 70) in the qPCR field when validating microarray data (Fig. 8B). Semi-targeted proteome data showed that the expression of positive control and proteins of interest agreed with previous discovery-mode mass spectrometry data (Fig. 8D). These data validated the finding that some of the mitochondrial proteins were up-regulated while their mRNA levels were not changed in OCs.
DISCUSSION
Technological advancements in microarrays, mass-spectrometry-based proteomics, and bioinformatic analysis of the resulting large datasets now provide powerful ways to address biomedical questions using a systems biology approach. Here we applied these evolving methods to investigate at the transcriptome and proteome levels the progression from monocyte-macrophage to functional multinucleate osteoclast, with its accompanying changes in cellular function. Our results reveal how basic cellular functions are altered to support the specialized bone-resorbing activity of OCs, including the critical role of mitochondrial mass and activity increases in OC formation and differentiation. The findings show substantial changes in cellular organization that optimize the cells' function and demonstrate that several transcripts and proteins involved in immunity are down-regulated in the OC to shift the overall cellular function toward bone resorption, consistent with a previous report (67).
Both transcripts and their encoded proteins that correspond to genes considered markers of the osteoclast state, such as V-type ATPase, TRAP, and cathepsin K (9–11), were, as expected, up-regulated in OCs. Although V-type ATPase transcripts in the IOs were not altered relative to those in OPs, the expression levels of the transcripts for TRAP and cathepsin K within the IOs were found to be at the midpoint between OPs and OCs. Additionally, osteoclast stimulating factor 1, which has been demonstrated to induce osteoclast formation and bone resorption (71), was found to be up-regulated specifically in the OCs at both the mRNA and the protein level. In addition, we observed the up-regulation of αV integrin, which is involved in the formation of a sealing zone between osteoclasts and bone matrix, at both the mRNA and the protein level in the OCs. Therefore, our data confirm and are consistent with expectations from the literature, but they also allow us to go substantially further in providing new insight into the process of OC development.
A key aspect of the present analysis was the careful attention paid to the purity of the cells analyzed with respect to the cellular differentiation state. We were able to divide the cells into three distinct populations: precursor cells (18), TRAP+ mononucleated cells, and mature osteoclasts. Both transcriptome and proteome data indicated that the IOs were more similar to the OPs than to TRAP+ OCs, suggesting that the enrichment of OCs from IOs after RANKL treatment was critical for obtaining accurate information about OCs. Although OCs formed and covered more than 50% of the culture dish surface upon RANKL treatment (supplemental Fig. S1), the total RNA concentration and total protein concentration from the IOs were 15-fold higher than those from OC samples harvested from the same dish. Proteins and mRNA from the IOs thus masked the information of the OCs when the two populations as a mixture were compared with OPs, as has been done in nearly all other studies (14–17). In fact, an OC outlier in our last microarray dataset (supplemental Fig. S4) was four times higher in mRNA concentration than samples from other OCs, suggesting that perhaps even a small amount of contaminating IO mRNA can substantially skew the data. By separating IOs and OCs, we were able to generate a large dataset for assessing osteoclast development and function at a molecular level at three distinct developmental stages.
As mRNA measurement and data analysis are well established, we often get a higher statistical power to detect changes using transcriptome data than using proteome data. As expected, volcano plots from transcriptome data showed better p values (supplemental Figs. S14A and S14B show volcano plots of transcriptome data). However, global protein measurements and analysis of the resulting data are still being optimized to achieve greater statistical power. Among other techniques for protein quantification, relative quantification utilizing metabolic labeling is one of the most accurate methods. Often, the use of one biological replicate is still accepted in proteomic studies (72–75) without statistical analysis. In this study, we used two biological replicates for protein analysis, but the analysis nevertheless had much less statistical power than the microarray data with multiple replicates and without missing values (supplemental Figs. S14C and S14D show volcano plots from proteome data). Another study that used four SILAC replicates yielded statistical power (76) similar (p value) to that of our analysis.
Although a fold-change approach has some limitations for the identification of differentially regulated proteins and sometimes lacks statistical confidence (77), we were able to confirm (using Student's t test–based p values to call differentially expressed genes) that the same pathways were altered in IOs and OCs. For example, fold-change analysis revealed down-regulation of immunity and up-regulation of energy production in IOs and down-regulation of protein synthesis and up-regulation of TCA, integrin signaling, and actin cytoskeleton in OCs (supplemental Fig. S14), and the statistical analysis confirmed these findings.
The differentially expressed proteins in three different sets of samples (OP, IO, and OC) were used to examine the protein networks altered during the differentiation of OCs. We found that basic cellular functions, which require ATP, were down-regulated in OCs. Examination of the expression levels of ATP synthase, protein abundances in each organelle, and the mitochondrial mass and voltage potential per unit cell volume led to the conclusion that the OCs contained greater numbers of functional mitochondria per unit cell volume than the OPs and IOs, suggesting that ATP production is increased in OCs. Expression of most ATP-consuming proteins (e.g. ATP-dependent RNA helicases, ATP-dependent zinc metalloprotease, ATP-binding cassettes, sarcoplasmic/endoplasmic reticular calcium ATPases) was decreased, whereas many non-ATP-related proteins were unchanged. Moreover, proteins involved in catabolic processes such as glycolysis, TCA cycle, or oxidative phosphorylation were up-regulated in the OCs, consistent with the view that mitochondria are a major source of ATP production in OCs. This finding agrees with a previous study (78) in which the cells from brain-type creatine kinase knockout mice produced similar amounts of ATP as the cells from wild-type mice, even though creatine kinase had been initially suggested as an alternative ATP generator in osteoclasts. We presume that the saved energy is devoted to the osteoclast-specific function of bone resorption. The acidic environment within the resorption lacuna is essential for the dissolution of inorganic minerals (79), and P-type Na+/K+ ATPase (80) and V-type ATPase (11) are responsible for the acidification of the resorption lacuna environment (81).
RANKL, a master osteoclastogenic cytokine, activates NF-κB in both the classical and alternative pathways, resulting in osteoclast survival and differentiation (82). Even though p65 plays a role in the survival of OCs (83), OCs display a limited lifespan in vivo (84) and in vitro. The proteomic data from this investigation indicate that mitochondrial proteins involved in cell death are increased in OCs. These include ADP/ATP translocases (Slc25A4 and Slc25A6), HtrA serine peptidase 2 (Htra2), apoptosis inducing factor 1 (Aifm1), and the VDACs. VDAC1-silenced cells are known to be protected from apoptosis-inducing agents (27, 85), and VDAC-overexpressing cells are prone to cell death (22, 86–88). Overexpression of hVDAC1 causes depolarization of the inner mitochondrial membrane (89), leading to the opening of the permeability transition pore (90). This in turn results in the release of cytochrome C and AIF from mitochondria into the cytosol (91), leading to caspase-dependent and caspase-independent apoptosis, respectively, suggesting that VDAC1 is pro-apoptotic. Here we show that VDAC1 and VDAC2 knockdown in OPs resulted in reduced ATP production (Fig. 7A) and the formation of fewer osteoclasts. Abu Hamad et al. demonstrated that a VDAC1-silenced human embryonal kidney cell line produces less ATP, leading to the attenuation of cell proliferation (92). Cancer cells have been shown to express high levels of VDACs (93), suggesting VDACs are involved in cell survival through their connection with energy production. Although this study showed that proteins involved in energy metabolism were altered during osteoclast formation, and although it is known that VDACs have a role in energy metabolism (Fig. 7A), how VDACs affect osteoclast cell death is unknown. It is clear, however, that there is a delicate balance between the initiation of osteoclast formation and osteoclast growth: the multinucleation accelerates cell death. In addition, Oursler et al. suggested mitochondria-dependent apoptosis in osteoclasts (94), and elucidating whether osteoclasts undergo apoptosis via a caspase-dependent or -independent pathway is suggested for future study.
It is instructive to compare our results with those previously reported with respect to transcriptional changes in osteoclast precursors developing into osteoclasts after exposure to 50 ng/ml RANKL for 5 days (17). Using this study, we defined DE genes as having a p < 0.05 and an up-/down-regulation fold change of at least 1.2 as computed by the NextBio resource (36). Of the 132 DE genes induced during osteoclast differentiation in the study by Sharma et al., 113 were also identified in our analysis. Approximately 85% of these 113 genes had the same direction of change (up-/down-regulation) in the two studies, and 58 genes had both the same direction of change and significance criteria (p < 0.05, fold change ≥ 1.2) preserved between the two studies (supplemental Fig. S15A). Sharma et al.'s data were compared with our IO data, and about 64% of the genes had the same direction of change. All 13,521 genes in our microarray platform were ranked by DE p values, and the 113 genes from the previous study were significantly enriched toward the top of this ranked list (with geneset-test p value = 1.56e-15). These results demonstrate reasonably good concordance between the DE genes identified in both studies. However, the osteoclast mRNA data from day 4 in Sharma et al.'s study included common genes that are expressed in both IOs and OCs (genes in blue in supplemental Fig. S15), suggesting that their sample contained a mixture of IOs and OCs.
A recent study reported global quantification values of transcription, translation, and turnover rates for genes and proteins in mammalian cells (45). We used this resource to analyze the properties of the genes that had inversely correlated changes during differentiation at the mRNA versus the protein level in our study (and whose absolute value of the residual (difference between the actual and predicted values based on the linear model fit between mRNA and protein log fold changes shown in Fig. 3) was at least 0.5). Although most of these genes did not deviate much from the fit in Schwanhausser et al.'s data for proteins/transcripts (45), there were some genes, such as Hist1h1c, that had a disproportionately greater number of protein copies than mRNA copies. Hist1h1c has an unstable mRNA (average 3.85 h) and a semi-stable protein (at the border of the stable protein half-life range) in mouse fibroblasts (NIH3T3) (45). In our study, the Hist1h1c mRNA expression level started to increase (0.6-fold up-regulated) in the IOs and was more than 1.5-fold up-regulated in the OCs. In contrast, expression of the Hist1h1c protein started to decrease in the IOs and was down-regulated in the OCs. The down-regulation of the semi-stable Hist1h1c protein might drive up-regulation of the short-lived Hist1h1c mRNA to compensate for its protein expression level. Whereas most of the core histone proteins were found to be up-regulated in the OCs, histone 1 (H1) was found to be significantly down-regulated. Its transcripts were found to be either nonregulated (H1f0 and Hist1h1b) or up-regulated (Hist1h1c) in both IOs and OCs. Nevertheless, we found a Pearson's correlation of mRNA expression with protein expression of 0.5 in the OC data and of 0.43 in the IO data after appropriate filtering, which is comparable to the results obtained by Schwanhausser et al. (45). More important, our data revealed a high level of concordance in cellular functional change at the mRNA and protein expression levels (supplemental Fig. S5).
In summary, this study demonstrates how careful experimental design and the use of high-throughput technologies and appropriate analyses can yield information about how global transcript expression and protein expression are translated into function and differentiation. We provide systematic insights into alteration in signaling pathways during osteoclast development that accompany critical changes in the mitochondria and nuclear proteome and generate new hypotheses regarding the specialization of these cells for their bone-resorbing function.
Acknowledgments
We thank Tim Myers at the Genomic Technologies Section (NIAID/NIH) for processing the microarray experiments, Owen Schwartz and Steven Becker at the Biological Imaging Section (NIAID/NIH) for help with the imaging, Ning Li at LSB for help with the siRNA experiments, Zhao Yang at LSB for help with qPCR experiments, and Sung Kyu Park at the Scripps Institute for proteomic analysis help. We also thank Iain Fraser, Martin Meier-Schellersheim, Rajat Varma, Virginie Sjoelund, Tim Laemmermann, Bhaskar Dutta, and John Tsang for advice and discussions and Mark Knepper and Jack Bennink for helpful comments on the manuscript. We are also grateful to Ronald N. Germain for his support and advice during this study and for help with preparation of the manuscript.
Footnotes
Author contributions: E.A. and A.N. designed research; E.A. performed research; E.A., M.N., N.P.M., and A.N. analyzed data; E.A., M.N., and A.N. wrote the paper.
* This research was supported by the Intramural Research Program of NIAID, National Institutes of Health.
 This article contains supplemental material.
1 The abbreviations used are:
- RANKL
- receptor activator of nuclear factor κ B ligand
- IO
- intermediate osteoclast
- OC
- mature osteoclast
- OP
- osteoclast precursor
- TRAP
- tartrate-resistant acid phosphatase
- SILAC
- stable isotope labeling of amino acids in cell culture
- ANOVA
- analysis of variance
- TCA
- tricarboxylic acid
- DE
- differentially expressed
- qPCR
- quantitative polymerase chain reaction (quantitative PCR)
- VDAC
- voltage dependent ion channel.
REFERENCES
- 1. Mosser D. M., Edwards J. P. (2008) Exploring the full spectrum of macrophage activation. Nat. Rev. Immunol. 8, 958–969 [DOI] [PMC free article] [PubMed] [Google Scholar]
- 2. Nakagawa N., Kinosaki M., Yamaguchi K., Shima N., Yasuda H., Yano K., Morinaga T., Higashio K. (1998) RANK is the essential signaling receptor for osteoclast differentiation factor in osteoclastogenesis. Biochem. Biophys. Res. Commun. 253, 395–400 [DOI] [PubMed] [Google Scholar]
- 3. Yasuda H., Shima N., Nakagawa N., Yamaguchi K., Kinosaki M., Mochizuki S., Tomoyasu A., Yano K., Goto M., Murakami A., Tsuda E., Morinaga T., Higashio K., Udagawa N., Takahashi N., Suda T. (1998) Osteoclast differentiation factor is a ligand for osteoprotegerin/osteoclastogenesis-inhibitory factor and is identical to TRANCE/RANKL. Proc. Natl. Acad. Sci. U.S.A. 95, 3597–3602 [DOI] [PMC free article] [PubMed] [Google Scholar]
- 4. Bromley M., Woolley D. E. (1984) Chondroclasts and osteoclasts at subchondral sites of erosion in the rheumatoid joint. Arthritis Rheum. 27, 968–975 [DOI] [PubMed] [Google Scholar]
- 5. Hirayama T., Danks L., Sabokbar A., Athanasou N. A. (2002) Osteoclast formation and activity in the pathogenesis of osteoporosis in rheumatoid arthritis. Rheumatology 41, 1232–1239 [DOI] [PubMed] [Google Scholar]
- 6. Helfrich M. H., Hocking L. J. (2008) Genetics and aetiology of Pagetic disorders of bone. Arch. Biochem. Biophys. 473, 172–182 [DOI] [PubMed] [Google Scholar]
- 7. Roodman G. D. (2004) Mechanisms of bone metastasis. N. Engl. J. Med. 350, 1655–1664 [DOI] [PubMed] [Google Scholar]
- 8. Marx R. E. (2003) Pamidronate (Aredia) and zoledronate (Zometa) induced avascular necrosis of the jaws: a growing epidemic. J. Oral Maxillofac. Surg. 61, 1115–1117 [DOI] [PubMed] [Google Scholar]
- 9. Drake F. H., Dodds R. A., James I. E., Connor J. R., Debouck C., Richardson S., Lee-Rykaczewski E., Coleman L., Rieman D., Barthlow R., Hastings G., Gowen M. (1996) Cathepsin K, but not cathepsins B, L, or S, is abundantly expressed in human osteoclasts. J. Biol. Chem. 271, 12511–12516 [DOI] [PubMed] [Google Scholar]
- 10. Burstone M. S. (1959) Acid phosphatase activity of calcifying bone and dentin matrices. J. Histochem. Cytochem. 7, 147–148 [DOI] [PubMed] [Google Scholar]
- 11. Blair H. C., Teitelbaum S. L., Ghiselli R., Gluck S. (1989) Osteoclastic bone resorption by a polarized vacuolar proton pump. Science 245, 855–857 [DOI] [PubMed] [Google Scholar]
- 12. Hada N., Okayasu M., Ito J., Nakayachi M., Hayashida C., Kaneda T., Uchida N., Muramatsu T., Koike C., Masuhara M., Sato T., Hakeda Y. (2011) Receptor activator of NF-kappaB ligand-dependent expression of caveolin-1 in osteoclast precursors, and high dependency of osteoclastogenesis on exogenous lipoprotein. Bone 50, 226–236 [DOI] [PubMed] [Google Scholar]
- 13. Jang H. D., Shin J. H., Park D. R., Hong J. H., Yoon K., Ko R., Ko C. Y., Kim H. S., Jeong D., Kim N., Lee S. Y. (2011) Inactivation of glycogen synthase kinase-3beta is required for osteoclast differentiation. J. Biol. Chem. 286, 39043–39050 [DOI] [PMC free article] [PubMed] [Google Scholar]
- 14. Ha B. G., Hong J. M., Park J. Y., Ha M. H., Kim T. H., Cho J. Y., Ryoo H. M., Choi J. Y., Shin H. I., Chun S. Y., Kim S. Y., Park E. K. (2008) Proteomic profile of osteoclast membrane proteins: identification of Na+/H+ exchanger domain containing 2 and its role in osteoclast fusion. Proteomics 8, 2625–2639 [DOI] [PubMed] [Google Scholar]
- 15. Kubota K., Wakabayashi K., Matsuoka T. (2003) Proteome analysis of secreted proteins during osteoclast differentiation using two different methods: two-dimensional electrophoresis and isotope-coded affinity tags analysis with two-dimensional chromatography. Proteomics 3, 616–626 [DOI] [PubMed] [Google Scholar]
- 16. Ryu J., Kim H., Chang E. J., Kim H. J., Lee Y., Kim H. H. (2010) Proteomic analysis of osteoclast lipid rafts: the role of the integrity of lipid rafts on V-ATPase activity in osteoclasts. J. Bone Miner. Metab. 28, 410–417 [DOI] [PubMed] [Google Scholar]
- 17. Sharma P., Patntirapong S., Hann S., Hauschka P. V. (2010) RANKL-RANK signaling regulates expression of xenotropic and polytropic virus receptor (XPR1) in osteoclasts. Biochem. Biophys. Res. Commun. 399, 129–132 [DOI] [PMC free article] [PubMed] [Google Scholar]
- 18. Lee M. V., Topper S. E., Hubler S. L., Hose J., Wenger C. D., Coon J. J., Gasch A. P. (2011) A dynamic model of proteome changes reveals new roles for transcript alteration in yeast. Mol. Syst. Biol. 7, 514. [DOI] [PMC free article] [PubMed] [Google Scholar]
- 19. Eldar A., Elowitz M. B. (2010) Functional roles for noise in genetic circuits. Nature 467, 167–173 [DOI] [PMC free article] [PubMed] [Google Scholar]
- 20. Berthois Y., Katzenellenbogen J. A., Katzenellenbogen B. S. (1986) Phenol red in tissue culture media is a weak estrogen: implications concerning the study of estrogen-responsive cells in culture. Proc. Natl. Acad. Sci. U.S.A. 83, 2496–2500 [DOI] [PMC free article] [PubMed] [Google Scholar]
- 21. Shevde N. K., Bendixen A. C., Dienger K. M., Pike J. W. (2000) Estrogens suppress RANK ligand-induced osteoclast differentiation via a stromal cell independent mechanism involving c-Jun repression. Proc. Natl. Acad. Sci. U.S.A. 97, 7829–7834 [DOI] [PMC free article] [PubMed] [Google Scholar]
- 22. Godbole A., Varghese J., Sarin A., Mathew M. K. (2003) VDAC is a conserved element of death pathways in plant and animal systems. Biochim. Biophys. Acta 1642, 87–96 [DOI] [PubMed] [Google Scholar]
- 23. Collin-Osdoby P., Yu X., Zheng H., Osdoby P. (2003) RANKL-mediated osteoclast formation from murine RAW 264.7 cells. Methods Mol. Med. 80, 153–166 [DOI] [PubMed] [Google Scholar]
- 24. Lin C. Y., Loven J., Rahl P. B., Paranal R. M., Burge C. B., Bradner J. E., Lee T. I., Young R. A. (2012) Transcriptional amplification in tumor cells with elevated c-Myc. Cell 151, 56–67 [DOI] [PMC free article] [PubMed] [Google Scholar]
- 25. Loven J., Orlando D. A., Sigova A. A., Lin C. Y., Rahl P. B., Burge C. B., Levens D. L., Lee T. I., Young R. A. (2012) Revisiting global gene expression analysis. Cell 151, 476–482 [DOI] [PMC free article] [PubMed] [Google Scholar]
- 26. Nie Z., Hu G., Wei G., Cui K., Yamane A., Resch W., Wang R., Green D. R., Tessarollo L., Casellas R., Zhao K., Levens D. (2012) c-Myc is a universal amplifier of expressed genes in lymphocytes and embryonic stem cells. Cell 151, 68–79 [DOI] [PMC free article] [PubMed] [Google Scholar]
- 27. Tajeddine N., Galluzzi L., Kepp O., Hangen E., Morselli E., Senovilla L., Araujo N., Pinna G., Larochette N., Zamzami N., Modjtahedi N., Harel-Bellan A., Kroemer G. (2008) Hierarchical involvement of Bak, VDAC1 and Bax in cisplatin-induced cell death. Oncogene 27, 4221–4232 [DOI] [PubMed] [Google Scholar]
- 28. An E., Lu X., Flippin J., Devaney J. M., Halligan B., Hoffman E. P., Strunnikova N., Csaky K., Hathout Y. (2006) Secreted proteome profiling in human RPE cell cultures derived from donors with age related macular degeneration and age matched healthy donors. J. Proteome Res. 5, 2599–2610 [DOI] [PubMed] [Google Scholar]
- 29. Vizcaino J. A., Cote R. G., Csordas A., Dianes J. A., Fabregat A., Foster J. M., Griss J., Alpi E., Birim M., Contell J., O'Kelly G., Schoenegger A., Ovelleiro D., Perez-Riverol Y., Reisinger F., Rios D., Wang R., Hermjakob H. (2013) The PRoteomics IDEntifications (PRIDE) database and associated tools: status in 2013. Nucleic Acids Res. 41, D1063–D1069 [DOI] [PMC free article] [PubMed] [Google Scholar]
- 30. Venable J. D., Dong M. Q., Wohlschlegel J., Dillin A., Yates J. R. (2004) Automated approach for quantitative analysis of complex peptide mixtures from tandem mass spectra. Nat. Methods 1, 39–45 [DOI] [PubMed] [Google Scholar]
- 31. Eng J. K., McCormack A. L., Yates J. R., 3rd (1994) An approach to correlate tandem mass spectral data of peptides with amino acid sequences in a protein database. J. Am. Soc. Mass Spectrom. 5, 976–989 [DOI] [PubMed] [Google Scholar]
- 32. Xu T., Venable J. D., Park S. K., Cociorva D., Lu B., Liao L., Wohlschlegel J., Hewel J., Yates J. R. (2006) ProLuCID, a fast and sensitive tandem mass spectra-based protein identification program. Mol. Cell. Proteomics 5, S174 [Google Scholar]
- 33. Tabb D. L., McDonald W. H., Yates J. R., 3rd (2002) DTASelect and Contrast: tools for assembling and comparing protein identifications from shotgun proteomics. J. Proteome Res. 1, 21–26 [DOI] [PMC free article] [PubMed] [Google Scholar]
- 34. Park S. K., Venable J. D., Xu T., Yates J. R., 3rd (2008) A quantitative analysis software tool for mass spectrometry-based proteomics. Nat. Methods 5, 319–322 [DOI] [PMC free article] [PubMed] [Google Scholar]
- 35. Miller J. A., Cai C., Langfelder P., Geschwind D. H., Kurian S. M., Salomon D. R., Horvath S. (2011) Strategies for aggregating gene expression data: the collapseRows R function. BMC Bioinformatics 12, 322. [DOI] [PMC free article] [PubMed] [Google Scholar]
- 36. Kupershmidt I., Su Q. J., Grewal A., Sundaresh S., Halperin I., Flynn J., Shekar M., Wang H., Park J., Cui W., Wall G. D., Wisotzkey R., Alag S., Akhtari S., Ronaghi M. (2010) Ontology-based meta-analysis of global collections of high-throughput public data. PLoS One 5 [DOI] [PMC free article] [PubMed] [Google Scholar]
- 37. Livak K. J., Schmittgen T. D. (2001) Analysis of relative gene expression data using real-time quantitative PCR and the 2(-Delta Delta C(T)) Method. Methods 25, 402–408 [DOI] [PubMed] [Google Scholar]
- 38. An E., Gordish-Dressman H., Hathout Y. (2008) Effect of TNF-alpha on human ARPE-19-secreted proteins. Mol. Vis. 14, 2292–2303 [PMC free article] [PubMed] [Google Scholar]
- 39. An E., Sen S., Park S. K., Gordish-Dressman H., Hathout Y. (2010) Identification of novel substrates for the serine protease HTRA1 in the human RPE secretome. Invest. Ophthalmol. Vis. Sci. 51, 3379–3386 [DOI] [PMC free article] [PubMed] [Google Scholar]
- 40. Wisniewski J. R., Ostasiewicz P., Dus K., Zielinska D. F., Gnad F., Mann M. (2012) Extensive quantitative remodeling of the proteome between normal colon tissue and adenocarcinoma. Mol. Syst. Biol. 8, 611. [DOI] [PMC free article] [PubMed] [Google Scholar]
- 41. Nagaraj N., Wisniewski J. R., Geiger T., Cox J., Kircher M., Kelso J., Paabo S., Mann M. (2011) Deep proteome and transcriptome mapping of a human cancer cell line. Mol. Syst. Biol. 7, 548. [DOI] [PMC free article] [PubMed] [Google Scholar]
- 42. Fournier M. L., Paulson A., Pavelka N., Mosley A. L., Gaudenz K., Bradford W. D., Glynn E., Li H., Sardiu M. E., Fleharty B., Seidel C., Florens L., Washburn M. P. (2009) Delayed correlation of mRNA and protein expression in rapamycin-treated cells and a role for Ggc1 in cellular sensitivity to rapamycin. Mol. Cell. Proteomics 9, 271–284 [DOI] [PMC free article] [PubMed] [Google Scholar]
- 43. Lu P., Vogel C., Wang R., Yao X., Marcotte E. M. (2007) Absolute protein expression profiling estimates the relative contributions of transcriptional and translational regulation. Nat. Biotechnol. 25, 117–124 [DOI] [PubMed] [Google Scholar]
- 44. Maier T., Schmidt A., Guell M., Kuhner S., Gavin A. C., Aebersold R., Serrano L. (2011) Quantification of mRNA and protein and integration with protein turnover in a bacterium. Mol. Syst. Biol. 7, 511. [DOI] [PMC free article] [PubMed] [Google Scholar]
- 45. Schwanhausser B., Busse D., Li N., Dittmar G., Schuchhardt J., Wolf J., Chen W., Selbach M. (2011) Global quantification of mammalian gene expression control. Nature 473, 337–342 [DOI] [PubMed] [Google Scholar]
- 46. Rigbolt K. T., Vanselow J. T., Blagoev B. (2011) GProX, a user-friendly platform for bioinformatics analysis and visualization of quantitative proteomics data. Mol. Cell. Proteomics 10, O110.007450. [DOI] [PMC free article] [PubMed] [Google Scholar]
- 47. Boyle W. J., Simonet W. S., Lacey D. L. (2003) Osteoclast differentiation and activation. Nature 423, 337–342 [DOI] [PubMed] [Google Scholar]
- 48. Teitelbaum S. L., Ross F. P. (2003) Genetic regulation of osteoclast development and function. Nat. Rev. Genet. 4, 638–649 [DOI] [PubMed] [Google Scholar]
- 49. Ikeda F., Nishimura R., Matsubara T., Tanaka S., Inoue J., Reddy S. V., Hata K., Yamashita K., Hiraga T., Watanabe T., Kukita T., Yoshioka K., Rao A., Yoneda T. (2004) Critical roles of c-Jun signaling in regulation of NFAT family and RANKL-regulated osteoclast differentiation. J. Clin. Invest. 114, 475–484 [DOI] [PMC free article] [PubMed] [Google Scholar]
- 50. Lietman S. A., Yin L., Levine M. A. (2008) SH3BP2 is an activator of NFAT activity and osteoclastogenesis. Biochem. Biophys. Res. Commun. 371, 644–648 [DOI] [PMC free article] [PubMed] [Google Scholar]
- 51. Sharma S. M., Bronisz A., Hu R., Patel K., Mansky K. C., Sif S., Ostrowski M. C. (2007) MITF and PU. 1 recruit p38 MAPK and NFATc1 to target genes during osteoclast differentiation. J. Biol. Chem. 282, 15921–15929 [DOI] [PubMed] [Google Scholar]
- 52. Hogan P. G., Chen L., Nardone J., Rao A. (2003) Transcriptional regulation by calcium, calcineurin, and NFAT. Genes Dev. 17, 2205–2232 [DOI] [PubMed] [Google Scholar]
- 53. Teitelbaum S. L. (2004) RANKing c-Jun in osteoclast development. J. Clin. Invest. 114, 463–465 [DOI] [PMC free article] [PubMed] [Google Scholar]
- 54. Komarova S. V., Pilkington M. F., Weidema A. F., Dixon S. J., Sims S. M. (2003) RANK ligand-induced elevation of cytosolic Ca2+ accelerates nuclear translocation of nuclear factor kappa B in osteoclasts. J. Biol. Chem. 278, 8286–8293 [DOI] [PubMed] [Google Scholar]
- 55. Klee C. B., Ren H., Wang X. (1998) Regulation of the calmodulin-stimulated protein phosphatase, calcineurin. J. Biol. Chem. 273, 13367–13370 [DOI] [PubMed] [Google Scholar]
- 56. Gramoun A., Azizi N., Sodek J., Heersche J. N., Nakchbandi I., Manolson M. F. (2010) Fibronectin inhibits osteoclastogenesis while enhancing osteoclast activity via nitric oxide and interleukin-1beta-mediated signaling pathways. J. Cell. Biochem. 111, 1020–1034 [DOI] [PubMed] [Google Scholar]
- 57. Li Y. J., Kukita A., Teramachi J., Nagata K., Wu Z., Akamine A., Kukita T. (2009) A possible suppressive role of galectin-3 in upregulated osteoclastogenesis accompanying adjuvant-induced arthritis in rats. Lab. Invest. 89, 26–37 [DOI] [PubMed] [Google Scholar]
- 58. Markowska A. I., Liu F. T., Panjwani N. (2010) Galectin-3 is an important mediator of VEGF- and bFGF-mediated angiogenic response. J. Exp. Med. 207, 1981–1993 [DOI] [PMC free article] [PubMed] [Google Scholar]
- 59. Senetar M. A., Moncman C. L., McCann R. O. (2007) Talin2 is induced during striated muscle differentiation and is targeted to stable adhesion complexes in mature muscle. Cell Motil. Cytoskeleton 64, 157–173 [DOI] [PubMed] [Google Scholar]
- 60. Franco S. J., Rodgers M. A., Perrin B. J., Han J., Bennin D. A., Critchley D. R., Huttenlocher A. (2004) Calpain-mediated proteolysis of talin regulates adhesion dynamics. Nat. Cell Biol. 6, 977–983 [DOI] [PubMed] [Google Scholar]
- 61. Yan B., Calderwood D. A., Yaspan B., Ginsberg M. H. (2001) Calpain cleavage promotes talin binding to the beta 3 integrin cytoplasmic domain. J. Biol. Chem. 276, 28164–28170 [DOI] [PubMed] [Google Scholar]
- 62. Khorchid A., Ikura M. (2002) How calpain is activated by calcium. Nat. Struct. Biol. 9, 239–241 [DOI] [PubMed] [Google Scholar]
- 63. Teitelbaum S. L. (2011) The osteoclast and its unique cytoskeleton. Ann. N. Y. Acad. Sci. 1240, 14–17 [DOI] [PubMed] [Google Scholar]
- 64. Berg J. M., Tymoczko J. L., Stryer L. (2007) Biochemistry, 6th ed., W.H. Freeman and Company, New York [Google Scholar]
- 65. Shoshan-Barmatz V., Gincel D. (2003) The voltage-dependent anion channel: characterization, modulation, and role in mitochondrial function in cell life and death. Cell Biochem. Biophys. 39, 279–292 [DOI] [PubMed] [Google Scholar]
- 66. Shoshan-Barmatz V., Israelson A., Brdiczka D., Sheu S. S. (2006) The voltage-dependent anion channel (VDAC): function in intracellular signalling, cell life and cell death. Curr. Pharm. Des. 12, 2249–2270 [DOI] [PubMed] [Google Scholar]
- 67. Bordbar A., Mo M. L., Nakayasu E. S., Schrimpe-Rutledge A. C., Kim Y. M., Metz T. O., Jones M. B., Frank B. C., Smith R. D., Peterson S. N., Hyduke D. R., Adkins J. N., Palsson B. O. (2012) Model-driven multi-omic data analysis elucidates metabolic immunomodulators of macrophage activation. Mol. Syst. Biol. 8, 558. [DOI] [PMC free article] [PubMed] [Google Scholar]
- 68. Jaffe J. D., Keshishian H., Chang B., Addona T. A., Gillette M. A., Carr S. A. (2008) Accurate inclusion mass screening: a bridge from unbiased discovery to targeted assay development for biomarker verification. Mol. Cell. Proteomics 7, 1952–1962 [DOI] [PMC free article] [PubMed] [Google Scholar]
- 69. LeBlanc F., Arseneau J. R., Leadbeater S., Glebe B., Laflamme M., Gagne N. (2012) Transcriptional response of Atlantic salmon (Salmo salar) after primary versus secondary exposure to infectious salmon anemia virus (ISAV). Mol. Immunol. 51, 197–209 [DOI] [PubMed] [Google Scholar]
- 70. Moral R., Santucci-Pereira J., Wang R., Russo I. H., Lamartiniere C. A., Russo J. (2011) In utero exposure to butyl benzyl phthalate induces modifications in the morphology and the gene expression profile of the mammary gland: an experimental study in rats. Environ. Health 10, 5. [DOI] [PMC free article] [PubMed] [Google Scholar]
- 71. Reddy S., Devlin R., Menaa C., Nishimura R., Choi S. J., Dallas M., Yoneda T., Roodman G. D. (1998) Isolation and characterization of a cDNA clone encoding a novel peptide (OSF) that enhances osteoclast formation and bone resorption. J. Cell. Physiol. 177, 636–645 [DOI] [PubMed] [Google Scholar]
- 72. Khositseth S., Pisitkun T., Slentz D. H., Wang G., Hoffert J. D., Knepper M. A., Yu M. J. (2011) Quantitative protein and mRNA profiling shows selective post-transcriptional control of protein expression by vasopressin in kidney cells. Mol. Cell. Proteomics 10, M110.004036. [DOI] [PMC free article] [PubMed] [Google Scholar]
- 73. Liu H., Ong S. E., Badu-Nkansah K., Schindler J., White F. M., Hynes R. O. (2011) CUB-domain-containing protein 1 (CDCP1) activates Src to promote melanoma metastasis. Proc. Natl. Acad. Sci. U.S.A. 108, 1379–1384 [DOI] [PMC free article] [PubMed] [Google Scholar]
- 74. Tian R., Wang S., Elisma F., Li L., Zhou H., Wang L., Figeys D. (2011) Rare cell proteomic reactor applied to stable isotope labeling by amino acids in cell culture (SILAC)-based quantitative proteomics study of human embryonic stem cell differentiation. Mol. Cell. Proteomics 10, M110.000679. [DOI] [PMC free article] [PubMed] [Google Scholar]
- 75. Wilde I. B., Brack M., Winget J. M., Mayor T. (2011) Proteomic characterization of aggregating proteins after the inhibition of the ubiquitin proteasome system. J. Proteome Res. 10, 1062–1072 [DOI] [PubMed] [Google Scholar]
- 76. Hilger M., Mann M. (2012) Triple SILAC to determine stimulus specific interactions in the Wnt pathway. J. Proteome Res. 11, 982–994 [DOI] [PMC free article] [PubMed] [Google Scholar]
- 77. Ting L., Cowley M. J., Hoon S. L., Guilhaus M., Raftery M. J., Cavicchioli R. (2009) Normalization and statistical analysis of quantitative proteomics data generated by metabolic labeling. Mol. Cell. Proteomics 8, 2227–2242 [DOI] [PMC free article] [PubMed] [Google Scholar]
- 78. Chang E. J., Ha J., Oerlemans F., Lee Y. J., Lee S. W., Ryu J., Kim H. J., Lee Y., Kim H. M., Choi J. Y., Kim J. Y., Shin C. S., Pak Y. K., Tanaka S., Wieringa B., Lee Z. H., Kim H. H. (2008) Brain-type creatine kinase has a crucial role in osteoclast-mediated bone resorption. Nat. Med. 14, 966–972 [DOI] [PubMed] [Google Scholar]
- 79. Baron R., Neff L., Louvard D., Courtoy P. J. (1985) Cell-mediated extracellular acidification and bone resorption: evidence for a low pH in resorbing lacunae and localization of a 100-kD lysosomal membrane protein at the osteoclast ruffled border. J. Cell Biol. 101, 2210–2222 [DOI] [PMC free article] [PubMed] [Google Scholar]
- 80. Baron R., Neff L., Roy C., Boisvert A., Caplan M. (1986) Evidence for a high and specific concentration of (Na+,K+)ATPase in the plasma membrane of the osteoclast. Cell 46, 311–320 [DOI] [PubMed] [Google Scholar]
- 81. Vaananen H. K., Karhukorpi E. K., Sundquist K., Wallmark B., Roininen I., Hentunen T., Tuukkanen J., Lakkakorpi P. (1990) Evidence for the presence of a proton pump of the vacuolar H(+)-ATPase type in the ruffled borders of osteoclasts. J. Cell Biol. 111, 1305–1311 [DOI] [PMC free article] [PubMed] [Google Scholar]
- 82. Novack D. V. (2010) Role of NF-kappaB in the skeleton. Cell Res. 21, 169–182 [DOI] [PMC free article] [PubMed] [Google Scholar]
- 83. Vaira S., Alhawagri M., Anwisye I., Kitaura H., Faccio R., Novack D. V. (2008) RelA/p65 promotes osteoclast differentiation by blocking a RANKL-induced apoptotic JNK pathway in mice. J. Clin. Invest. 118, 2088–2097 [DOI] [PMC free article] [PubMed] [Google Scholar]
- 84. Marks S. C., Jr., Seifert M. F. (1985) The lifespan of osteoclasts: experimental studies using the giant granule cytoplasmic marker characteristic of beige mice. Bone 6, 451–455 [DOI] [PubMed] [Google Scholar]
- 85. Yuan S., Fu Y., Wang X., Shi H., Huang Y., Song X., Li L., Song N., Luo Y. (2008) Voltage-dependent anion channel 1 is involved in endostatin-induced endothelial cell apoptosis. FASEB J. 22, 2809–2820 [DOI] [PubMed] [Google Scholar]
- 86. Ghosh T., Pandey N., Maitra A., Brahmachari S. K., Pillai B. (2007) A role for voltage-dependent anion channel Vdac1 in polyglutamine-mediated neuronal cell death. PLoS One 2, e1170. [DOI] [PMC free article] [PubMed] [Google Scholar]
- 87. Lu A. J., Dong C. W., Du C. S., Zhang Q. Y. (2007) Characterization and expression analysis of Paralichthys olivaceus voltage-dependent anion channel (VDAC) gene in response to virus infection. Fish Shellfish Immunol. 23, 601–613 [DOI] [PubMed] [Google Scholar]
- 88. Zaid H., Abu-Hamad S., Israelson A., Nathan I., Shoshan-Barmatz V. (2005) The voltage-dependent anion channel-1 modulates apoptotic cell death. Cell Death Differ. 12, 751–760 [DOI] [PubMed] [Google Scholar]
- 89. De Pinto V., Tomasello F., Messina A., Guarino F., Benz R., La Mendola D., Magri A., Milardi D., Pappalardo G. (2007) Determination of the conformation of the human VDAC1 N-terminal peptide, a protein moiety essential for the functional properties of the pore. Chembiochem 8, 744–756 [DOI] [PubMed] [Google Scholar]
- 90. Tomasello F., Messina A., Lartigue L., Schembri L., Medina C., Reina S., Thoraval D., Crouzet M., Ichas F., De Pinto V., De Giorgi F. (2009) Outer membrane VDAC1 controls permeability transition of the inner mitochondrial membrane in cellulo during stress-induced apoptosis. Cell Res. 19, 1363–1376 [DOI] [PubMed] [Google Scholar]
- 91. Cande C., Cecconi F., Dessen P., Kroemer G. (2002) Apoptosis-inducing factor (AIF): key to the conserved caspase-independent pathways of cell death? J. Cell Sci. 115, 4727–4734 [DOI] [PubMed] [Google Scholar]
- 92. Abu-Hamad S., Sivan S., Shoshan-Barmatz V. (2006) The expression level of the voltage-dependent anion channel controls life and death of the cell. Proc. Natl. Acad. Sci. U.S.A. 103, 5787–5792 [DOI] [PMC free article] [PubMed] [Google Scholar]
- 93. Simamura E., Shimada H., Hatta T., Hirai K. (2008) Mitochondrial voltage-dependent anion channels (VDACs) as novel pharmacological targets for anti-cancer agents. J. Bioenerg. Biomembr. 40, 213–217 [DOI] [PubMed] [Google Scholar]
- 94. Oursler M. J., Bradley E. W., Elfering S. L., Giulivi C. (2005) Native, not nitrated, cytochrome c and mitochondria-derived hydrogen peroxide drive osteoclast apoptosis. Am. J. Physiol. Cell Physiol. 288, C156–C168 [DOI] [PubMed] [Google Scholar]