Abstract
Fluid shear stress (FSS) plays a critical role in regulating endothelium function and maintaining vascular homeostasis. Current microfluidic devices for studying FSS effects on cells either separate high shear stress zone and low shear stress zone into different culturing chambers, or arranging the zones serially along the flow direction, which complicates subsequent data interpretation. In this paper, we report a diamond shaped microfluidic shear device where the high shear stress zone and the low shear stress zone are arranged in parallel within one culturing chamber. Since the zones with different shear stress magnitudes are aligned normal to the flow direction, the cells in one stress group are not substantially affected by the flow-induced cytokine/chemokine releases by cells in the other group. Cell loading experiments using human umbilical vein endothelial cells show that the device is able to reveal stress magnitude-dependent and loading duration-dependent cell responses. The co-existence of shear stress zones with varied magnitudes within the same culturing chamber not only ensures that all the cells are subject to the identical culturing conditions, but also allows the resemblance of the differential shear stress pattern in natural arterial conditions. The device is expected to provide a new solution for studying the effects of heterogeneous hemodynamic patterns in the onset and progression of various vascular diseases.
I. INTRODUCTION
Endothelial cells (ECs) that line the surface of blood vessel are constantly exposed to fluidic shear stress (FSS) of various magnitudes. Such stress, along with normal stress and circumferential loop stress, plays an important role in regulating endothelium function and maintaining vascular homeostasis.1,2 The effects of FSS on ECs have been extensively studied in the past three decades, including the influences on cell shape and orientation changes,3,4 cytoskeleton remodelling,5,6 cytosolic calcium mobilization,7,8 ion channel activation,9,10 gene expression,11,12 and cell proliferation.13 Because of the complicated extracellular microenvironment and the difficulty of precisely controlling shear stresses in natural vessels, and the limited number of donors, engineered fluidic devices are often used to investigate the FSS effects on ECs, where the cells are subject to certain levels of FSS when fluid flows through these fluidic devices. In early studies, cone-plate viscometers and parallel-plate flow chambers are most commonly employed due to their simple configurations. With rapid development of microfluidics, microfabricated channels become an increasingly popular tool to generate shear stress due to the greatly reduced consumption of cells and reagents.14 In microfluidic devices, multishear design is often used to improve the throughput, where a number of parallel channels with different cross-sectional dimensions are connected to a single inlet.15–18 The FSS generated within individual channels varies due to different fluidic resistances of these channels. Such devices are especially useful for studying the magnitude-dependent cell response upon FSS. However, since the microchannels are isolated, the extracellular environment and the unexpected disturbance in a channel may differ from another. In particular, the control group where the cells are subject to zero or very low FSS is often maintained in a separate device, which complicates subsequent data analysis and interpretation. In addition, the multishear devices inherently block the interaction between different cell groups, which may result in significant deviation of cell responses from the in vivo cells in many instances. Alternatively, gradient shear devices that employ Usami's design based on Hele-Shaw flow theory19 have been used to study FSS effects on cells,20–22 where a fluidic channel with lengthwise varying dimensions is used to generate an inhomogeneous shear stress field along the flow direction. This design allows the co-existence of the zones with varied shear stress magnitudes within the same culturing chamber. Nonetheless, since the cells experiencing varied magnitudes of shear stress are arranged in serial along the flow direction, the transport of cell secretions along the channel by the flowing medium may lead to problematic results. In particular, shear stress is known to influence the secretion of cytokines and chemokines23 and nitric oxide.24 These cytokines/chemokines or soluble gases released by the cells in the upstream may affect the cells in the downstream when delivered by the flowing medium. This may complicate the interpretation of shear effects on cells in the downstream.
The above considerations altogether articulate the need for devices that can host high shear stress zone and low shear stress zone within a single culturing chamber where the cells under one stress group are not substantially affected by the stress-regulated releases of cytokines (or chemokines) by cells in other stress groups. In this study, we present a diamond shaped microfluidic chamber that incorporates the structural characteristics of multishear devices and gradient shear devices by arranging parallel culturing compartments that can generate shear stresses of varied magnitudes. The parallel arrangement ensures that the cells in different compartments are exposed to varied shear stresses simultaneously. The influence of stress-induced cell secretion by cells in other shear stress groups is thus substantially reduced.
II. MATERIALS AND METHODS
A. Design and fabrication
For a Poiseuille flow in a rectangular microchannel, the fluidic resistance is given by25
| (1) |
where μ is the fluid viscosity, l is the channel length, w is the channel width, and h is the channel height. If the height-to-width ratio is very low (h ≪ w), the fluidic resistance can be reduced to
| (2) |
In this case, the shear stress at the channel wall can be estimated using the parallel-plate model as
| (3) |
where Q = ΔP/R is the volumetric flow rate.
The relationship between the wall shear stress (τw) and the shear stress experienced by the cells adhering to the inner wall of the channel (τcell) was estimated by Gaver and Kute.26 In their model, the adherent cell was considered as a semi-spherical bulge on the microchannel wall. The shear stress on a cell in high channels (r/h < 0.1, r is the cell height) was expressed as τcell ≈ 3τw. In our case r/h ≪ 0.1, the FSS was therefore estimated as
| (4) |
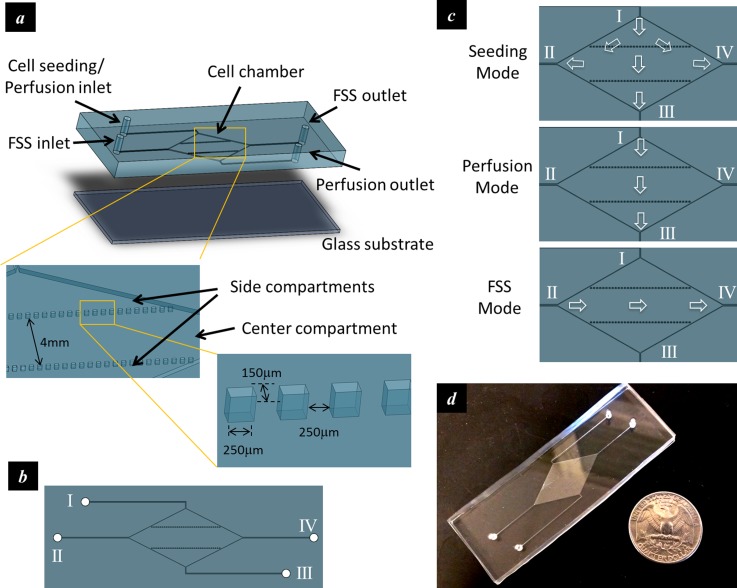
In order to accommodate high shear stress zone and low shear stress zone within one culturing chamber, a diamond shaped culturing chamber was employed (Figure 1(a)). Each corner of the culturing chamber was connected to a microfluidic port. The four microfluidic ports were numbered counter-clockwise as I, II, III, and IV, as shown in Figure 1(b). Two parallel arrays of single spaced discrete microstructures were positioned along the longitudinal axis of the culturing chamber and divided the chamber into three compartments, namely, one center compartment and two triangular-shaped side compartments. The operation was illustrated in Figure 1(c). First, the cells were fed into the culturing chamber through port I while all the other ports were open (Seeding Mode). The cells were allowed to adhere to the substrate. The culturing medium was then perfused into the culturing chamber at a fairly low volumetric flow rate through the port I and discharged through the port III to keep the cells variable (Perfusion Mode). During shear stress application, the culturing medium was pumped into the culturing chamber at a relatively high volumetric flow rate through port II and discharged through port IV (FSS Mode). Because of the diamond shaped chamber and the two lines of single spaced microstructures, the side compartments had a higher hydraulic resistance than that of the center compartment in the FSS mode. This led to different flow velocities in the compartments and therefore shear stresses with varied magnitudes. A fabricated device was shown in Figure 1(d).
FIG. 1.
Design of the microfluidic device that accommodates parallel high and low stress zones within the same chamber. (a) Schematic of the device; (b) the top view of the device showing four microfluidic ports connected to the culturing chamber; (c) schematics showing flow directions during different operation modes; and (d) a fabricated device.
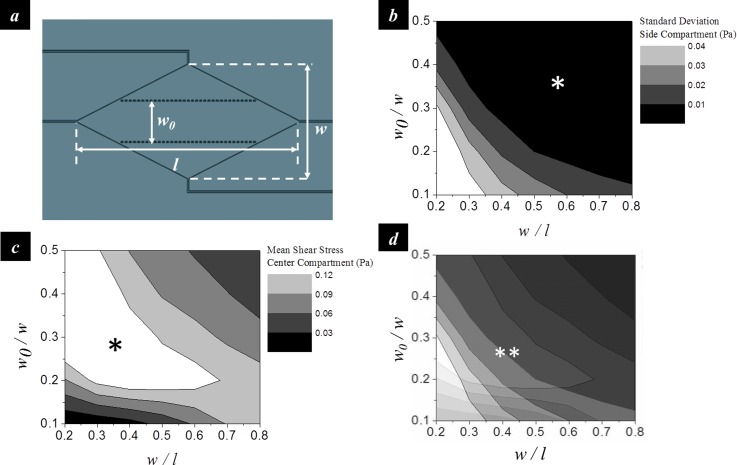
The chamber geometries that can generate the differential shear stress profile were determined using finite element analysis (COMSOL Multiphysics 4.4). The width-to-length ratio of the diamond shaped chamber (w/l) and the ratio between the width of the center compartment and the width of the entire chamber (w0/w) were used to represent the geometric layout (Figure 2(a)). The design was to maximize the mean shear stress in the center compartment and minimize the shear stress variation in the side compartments in order to achieve a high stress contrast between the center and side compartments as well as a uniform stress profile in the side compartment. The analysis showed that the standard deviation of the shear stress in the side compartments decreases with increasing w/l and w0/w (Figure 2(b)). The mean shear stress in the center compartment increases with increasing w0/w at low w/l (<0.5), but decreases with increasing w0/w at high w/l (>0.5) (Figure 2(c)). An optimal condition was therefore determined as w/l = 0.5 and w0/w = 0.28 (Figure 2(d)).
FIG. 2.
Geometric design of the microfluidic chamber. (a) The width-to-length ratio of the diamond shaped chamber (w/l) and the ratio between the width of the center compartment and the chamber width (w0/w) were used to represent the geometric layout. (b) Contour map showing the standard deviation of the shear stress in the side compartments as a function of w/l and w0/w. (c) Contour map showing the mean shear stress in the center compartment as a function of w/l and w0/w. (d) Overlapping of (b) and (c) to determine the optimal geometric parameters. Asterisk (*) and double asterisk (**) denote the zone of desired magnitudes. All data were obtained from finite element analysis. The inlet flow rate was 10 ml/hr.
The microfluidic device was fabricated by molding polydimethylsiloxane (PDMS) polymer against a pre-patterned photoresist template. Briefly, the negative photoresist SU-8 was first spin-coated on a 4-in. silicon wafer and patterned by photolithography. The silicon wafer with patterned photoresist structures was then used as the master template for replica molding. PDMS prepolymer was poured onto the photoresist mold and cured at 65 °C for 4 h. Finally, the PDMS polymer with the transferred pattern was peeled off and attached to a glass slide (75 mm × 25 mm). The diamond shaped chamber was 28 mm in length, 14 mm in width, and 250 μm in height. Each microstructure was 250 μm in length, 150 μm in width, 250 μm in height, and single spaced. The width of the center compartment was 4 mm.
B. Cell culture and perfusion
Human umbilical vein endothelial cells (HUVECs) were incubated at 37 °C under 5% CO2 atmosphere. The culture medium was Endothelial Cell Basal Medium-2 (EBM-2, Lonza) supplemented with EGM-2 SingleQuots® (contains 0.02% v/v FBS, 0.0004% Hydrocortisone, 0.004% hEGF-B, 0.001% VEGF, 0.001% R3-IGF-1, 0.001% Ascorbic acid, 0.001% hEGF, 0.001% GA-1000, and 0.001% Heparin). Upon 80% confluence, the cells were rinsed with phosphate buffer solution (PBS, pH = 7.4) and treated with 0.05% trypsin-EDTA (Life Technologies) for 5 min to be detached from the wall of the culturing flask. After neutralizing trypsin with Trypsin Neutralizing Solution (TNS, Lonza), the cells were centrifuged and resuspended in the culture medium.
The culturing chamber were sterilized by autoclaving and cooled down in a laminar flow cabinet. Prior to cell seeding, the device was perfused with the culture medium for 1 h. A cell suspension of 1 × 10⁶ cells/ml was then introduced into the cell chamber and incubated for 6 h to allow attachment.
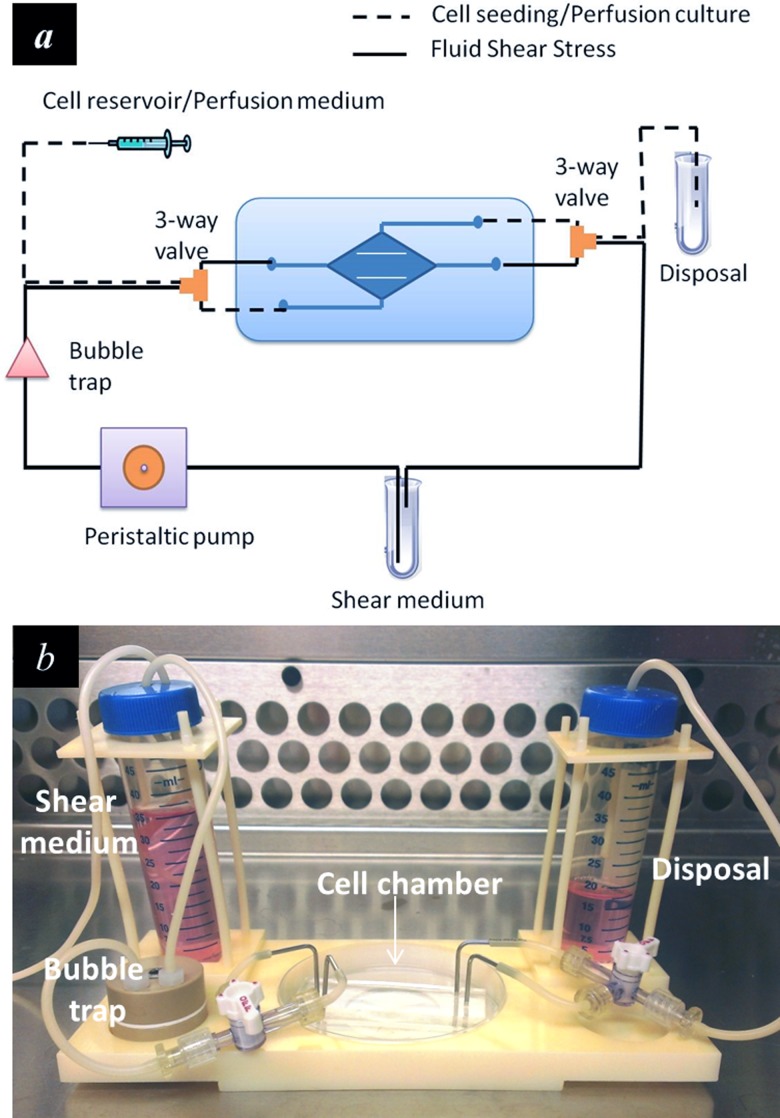
Afterwards, the device was connected to a variable-flow peristaltic pump (Fisher Scientific) via C-Flex® tubing (1/16 in. ID, 1/8 in. OD, Cole-Parmer). A bubble trap (Omnifit) was used to remove gas bubble from the flow circuit. 3-way valves were used to switch the flow circuit between the Perfusion Mode and the FSS Mode (Figure 3(a)). The entire microfluidic system was mounted on an inverted microscope stage using a custom-built microscope adapter fitting (Figure 3(b)). Cells were fed into the chamber at the inlet flow rate of 10-15 ml/h and allowed to attach. They were then subject to perfusion culture at the perfusion rate of 2.5 ml/h for 24 h to allow cell confluence in both the center compartment and the side compartments. The perfusion rate was determined through a trial-and-error experiment to ensure adequate mass transport with limited shear effects on the cells. According to previous reports, the upper limit of media residence time (MRT, defined as the time needed for a complete change of culture media in the culture chamber) for culturing endothelial cell is on the order of 1 min.27 In this study, a perfusion rate of 2.5 ml/h yielded to a MRT of 1.15 min. In addition, the shear stress generated by 2.5 ml/h perfusion flow (<0.4 dyn/cm2) was well below the threshold (1–3 dyn/cm2) that can cause significant cellular responses. 24 h were sufficient for the formation of a cell monolayer in majority of the center and the side compartments.
FIG. 3.
Experimental setup. (a) Schematic illustration of the microfluidic device for perfusion based cell culture and FSS loading. 3-way valves were used to switch the flow circuit between the perfusion mode and the FSS mode. (b) The microfluidic device was mounted on a custom-designed microscope stage adapter to facilitate operation and observation.
C. Shear stress application
After perfusion, the device was switched to the FSS Mode by circulating the culture medium at the flow rates of 10 ml/h (mean shear stress in the center compartment: 1.8 dyn/cm2) for low shear stress application or 50 ml/h (mean shear stress in the center compartment: 8.8 dyn/cm2) for high shear stress application. The shear loading experiment was performed for 12 h in a 5% CO2 incubator at 37 °C.
D. Immunofluorescence staining and image analysis
After the shear stress application, cells were rinsed twice with PBS and fixed in 4% (w/v) paraformaldehyde (diluted in PBS) for 30 min; permeabilized with 0.5% (v/v) Triton X-100 for 30 min; and stained with rhodamine-phalloidin (Life Technologies) for 10 min at 25 °C to label the actin cytoskeleton (F-actin).
Bright field images were acquired with a CCD camera (QIClick, Qimaging) connected to an inverted microscope (Eclipse TS100, Nikon). The cell orientation, defined as the angle between cells' principal axis and the direction of fluid flow, was measured from the bright field images using ImageJ software (National Institutes of Health). Visualization of fluorescence signals was performed using a fluorescence microscope (Eclipse 80i, Nikon) equipped with a CCD camera (DS-Qi1MC, Nikon). Rhodamine-phalloidin was excited at 540 nm and the emission wavelength was at 625 nm. The mean fluorescence intensity (MFI), obtained by averaging the fluorescence intensity of single cells over the entire image using NIS-Elements AR software, was used to quantify the expression of actin filaments.
E. Statistical analysis
The data were presented as mean ± standard deviation of 300–500 cell samples from 6 measurements. The differences between groups were examined by Student's t-test. Statistical significance was established at *p < 0.05 and at **p < 0.01. All experimental analyses were performed blind.
III. RESULTS AND DISCUSSION
A. Numerical analysis of shear stress distribution
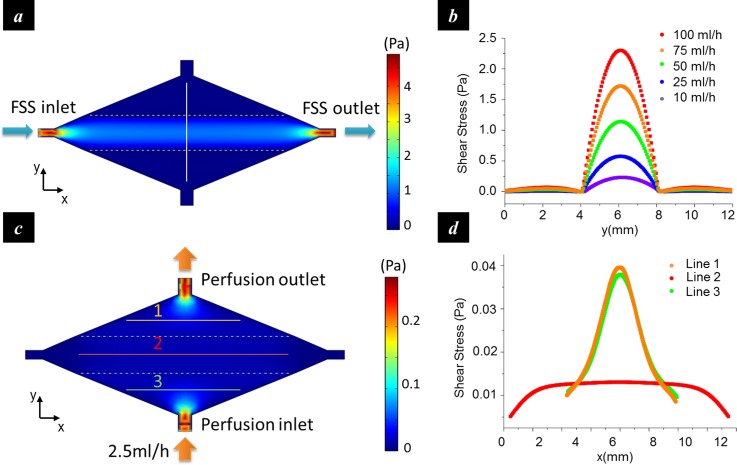
The distribution of the shear stress in the culturing chamber was estimated by finite element analysis. The flow in the chamber was modelled as a Poiseuille flow, and the simulation was performed by solving the steady-state Navier-Stokes equation over the entire flow chamber with the non-slip boundary condition. The result showed that in FSS Mode, the shear stress in the center compartment exhibited a parabolic profile (Figures 4(a) and 4(b)). As the flow rate at the fluidic inlet increased from 10 ml/h to 100 ml/h, the maximum shear stress increased from 2.3 dyn/cm2 (0.23 Pa) to 23 dyn/cm2 (2.3 Pa). In contrast, shear stress in the side compartments did not change significantly with the flow rate but remained at a low level (<0.7 dyn/cm2). Therefore, an approximate 30-fold shear stress contrast can be obtained between the center and the side compartments. In the Perfusion Mode (Figures 4(c) and 4(d)), a uniform shear stress distribution was generated in the central compartment (line 2). The side compartments exhibited considerable shear stress variation around the inlet and the outlet (line 1 and line 3), but the stress magnitude during perfusion (<0.4 dyn/cm2 in the majority area at the perfusion rate of 2.5 ml/h) was an order of magnitude lower than that in the FSS mode and was not expected to affect cell functions.
FIG. 4.
Numerical analysis of the shear stress distribution. (a) Shear stress distribution in the FSS mode; (b) shear stress profiles along the vertical line in (a) at different inlet flow rates. The shear stress in the center compartment was much greater than those in the side compartments, especially at high flow rates; (c) shear stress distribution in the perfusion mode; and (d) shear stress profiles along the marked lines in (c).
B. Shear stress regulated cell reorientation
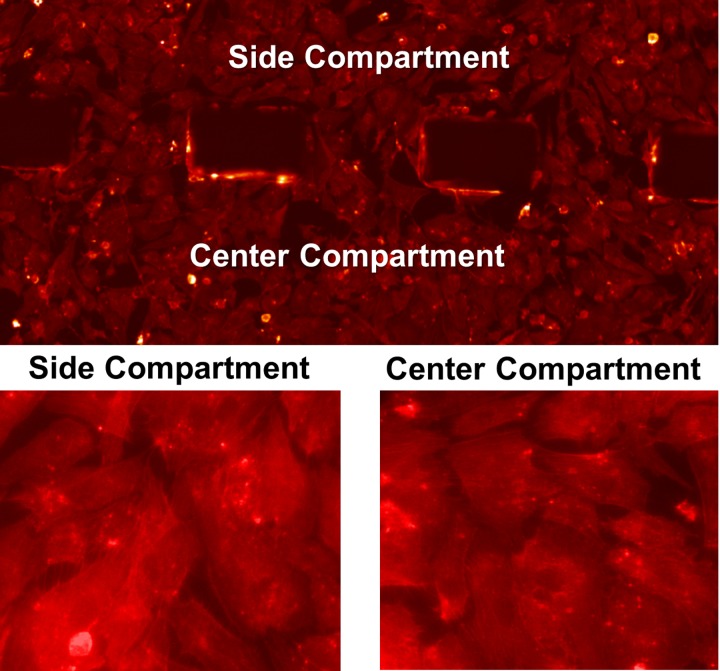
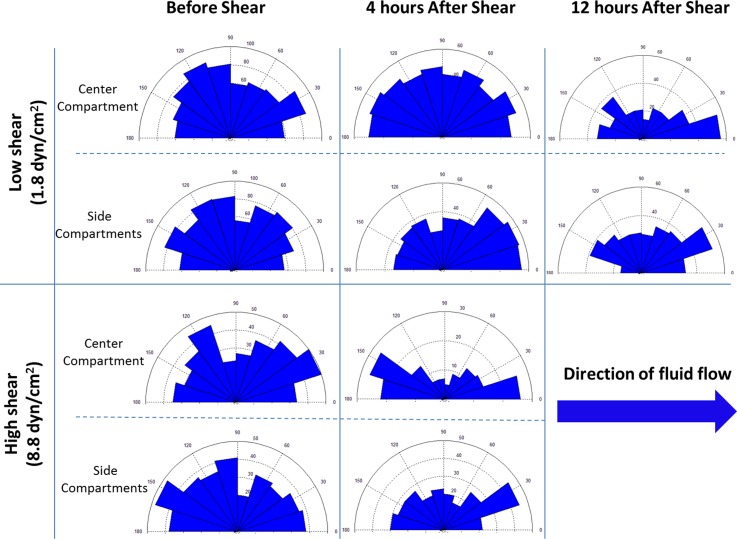
Before the shear loading started, the cells formed a monolayer with >90% confluence in both the center and the side compartments (Figure 5). After shear loading, cell orientation was represented by the intersection angle of the cells with respect to the shear flow direction (0° or 180°) (Figure 6). In the high shear stress group (8.8 dyn/cm2), the cells in the center compartment exhibited significant reorientation after 4 h loading. In the low shear stress group (1.8 dyn/cm2), however, 4 h loading did not induce significant cell reorientation in the center compartment, suggesting that the shear stress induced cell orientation is magnitude-dependent. The result also showed that continuous loading up to 12 h with the low shear stress was able to reorient cells along the flow direction (0° or 180°), which suggested that the shear stress induced cell orientation is also dependent on the loading duration. In all the groups, the cells in the side compartments did not exhibit substantial reorientation.
FIG. 5.
Fluorescence micrographs of HUVECs after perfusion (F-actin staining).
FIG. 6.
Rose diagrams showing the changes in cell orientation before and after exposing to shear stress of different magnitudes. In the low shear group, 12 h FSS stimulation led to a significant contrast in the distribution of cell orientations between the center compartment and the side compartment. In the high shear group, the contrast became evident after 4 h FSS loading. The number in parentheses represents the magnitude of mean shear stress in the center compartment.
It has been well documented that the endothelial cells elongate and align parallel to the flow direction when exposed to FSS.3,4 However, the effective FSS range reported by in vitro studies varies from case to case, depending on the origin of endothelial cells. For endothelial cells on the arteries (e.g., bovine aortic endothelial cells), FSS of 10–80 dyn/cm2 is capable of inducing cytoskeleton remodelling and cell alignment.3,28,29 This result is consistent with the shear stress magnitude within arteries (10–70 dyn/cm2). For vein endothelial cells (e.g., HUVECs), the physiological shear stress is an order of magnitude lower (1–6 dyn/cm2). Accordingly, the threshold magnitude reported by in vitro studies is normally around 1–3 dyn/cm.2,17,30 In this study, HUVECs in the center compartment were subjected to shear stresses with the mean values of 1.8 dyn/cm2 (low shear) and 8.8 dyn/cm2 (high shear). The result showed that FSS of both levels induced cell alignment, although the time needed for cell reorientation varied with the shear stress magnitude. In particular, 8.8 dyn/cm2 FSS resulted in cell reorientation within 4 h, while it took 12 h for the cells to reorient to the direction of fluidic flow with 1.8 dyn/cm2 FSS. These findings were in agreement with previous studies that showed time- and magnitude-dependent changes of FSS-induced cell alignment.3,31 Moreover, the cells in the side compartments remained random orientation in both low shear stress and high shear stress groups. This agreed with the numerical analysis showing low shear stress magnitude in the side compartments (0.06 dyn/cm2 for the low shear stress group and 0.27 dyn/cm2 for the high shear stress group).
C. Shear stress regulated cytoskeleton expression
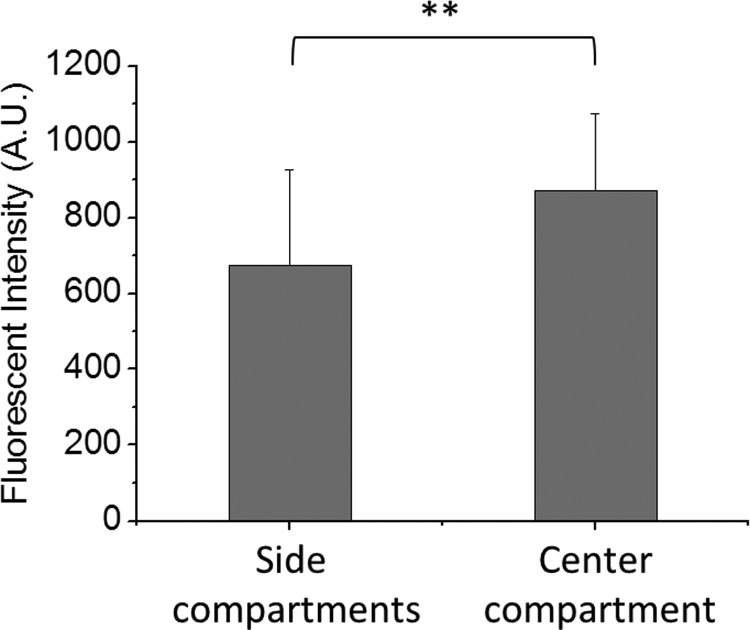
Actin filaments expression measurement showed that although 4 h loading with the low shear stress group did not induce significant cell reorientation, the MFI in the center compartment was significantly higher than those in the side compartments (Figure 7). This agreed with previous findings that showed the changes in cytoskeleton expression and organization upon FSS (1–8 h) may occur prior to the cell realignment (>8 h).32
FIG. 7.
Shear stress-induced changes in actin filament content of HUVECs. Statistic diagrams showing the F-actin content of cells in the center and the side compartments after 4 h FSS stimulation at a flow rate of 10 ml/h. Exposure to the shear stress led to a significantly higher F-actin content of cells in the center compartment as compared to those in the side compartments. **p < 0.01 for center compartment vs. side compartments.
D. Quantification of flow-induced concentration change of cytokines/chemokines or soluble gases in cell culture supernatant
Endothelial cells are responsive to shear flow and may release cytokines/chemokines or soluble gases (such as nitric oxide) into cell culture supernatant. Such release is often magnitude dependent. In conventional shear devices where different shear stress zones are arranged in serial, the released chemicals by the cells in the upstream shear stress zone flow with the medium towards the downstream shear stress zone and may affect the cells therein. For example, HUVECs produce interleukin-8 (IL-8) and the production is regulated by shear stress.33 IL-8 in turn enhances the survival and the proliferation of endothelial cells and regulates matrix metalloproteinases (MMPs) production.34 Therefore, one must justify the correlation between the shear stress regulated MMPs production in the downstream by considering the flow-induced IL-8 concentration change along the flow.
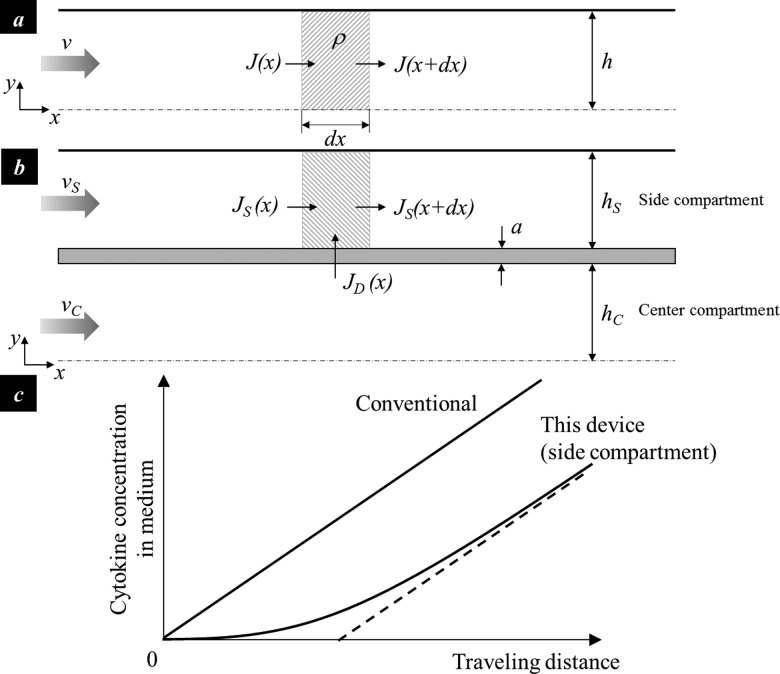
An analytical model was developed to quantify the flow-induced concentration change of cytokines/chemokines or soluble gases. The cytokine concentration in a linear channel with a solid wall and a constant cross-section can be determined by solving the mass conservation equation of a control volume in a half center compartment (Figure 8(a)),
| (5) |
where J denotes the cytokine flux; ρ is the cytokine secretion rate per unit area; c is the cytokine concentration in the cell culture supernatant, h is the half width of the channel, and v is the flow velocity along x direction. Given that the initial cytokine concentration at the inlet is zero, the steady-state cytokine concentration is determined to increase linearly with the traveling distance
| (6) |
This indicates that the cells in the downstream are subject to a greater level of cytokine than those in the upstream. Here, the cytokine section rate ρ is a function of the local shear stress.
FIG. 8.
Analysis of cytokine concentration in cell culture supernatant. (a) the 2D illustration of a conventional shear chamber with a constant cross-section (half chamber); (b) the simplified 2D illustration of the reported shear chamber with parallel compartments (half chamber); and (c) the cytokine concentration change in the conventional chamber where different shear zones are arranged in serial and in the side compartment of the reported chamber with parallel shear zones arrangement.
COMSOL simulation shows that the medium enters the side compartment in the region close to the inlet and returns to the center compartment in the region close to the outlet; and the flow rate in the side compartment is much lower than that in the center compartment. The center compartment and side compartment was thus simplified as two parallel compartments separated by a diffusion barrier. It is further assumed that the cytokine diffusing through the barrier does not significantly change the cytokine concentration in the center compartment. Equation (6) is thus applicable to the center compartment. The steady-state cytokine concentration in the side compartment can thus be determined from the mass conservation of a control volume in a side compartment (Figure 8(b)),
| (7) |
where denotes the cytokine flux across the diffusion barrier, D is the diffusion coefficient, a is the diffusion distance, h is the width of the compartment, and the subscript S and C denotes the side and center compartments, respectively. By inserting Eq. (6) into (7) and assuming that the initial velocity of the side compartment is zero, the cytokine concentration is determined as
| (8) |
Comparison of Eqs. (6) and (8) shows the cytokine concentration in the side compartment of the reported diamond culturing chamber is lower than that in the conventional serial shear chamber design, especially with a short traveling distance (Figure 8(c)).
It is seen from the analysis that when different shear stress zones are arranged in serial, the cells in the downstream are not only regulated by the local shear flow, but also by the flow pattern in the upper stream. The data interpretation and analysis are thus complicated. In our shear device, the cells in the high shear stress zone and low shear stress zones are exposed to the shear flow at the same time. The influence of cytokines/chemokines or soluble gases production by cells in one shear stress zone on the cells in another zone is thus minimal.
E. Corresponding in vivo conditions of conventional serial shear devices and the parallel shear device
Shear devices resemble the mechanical conditions of certain vascular diseases. Conventional shear devices where different shear stress zones are arranged in serial20–22 can serve as an in vitro model of lumen-protruding atherosclerotic plaque, where high shear stress occurs at the throat of the plaque, low shear stress occurs in the upstream, and directionally oscillatory shear stress occurs in the downstream shoulder of the plaque. The shear device with the high shear stress zone and low shear stress zone arranged in parallel serves as an in vitro model of some other atherosclerotic conditions with curvatures and bifurcations.35,36 For instance, in the carotid circulation, atherosclerosis preferentially occurs at the outer wall of the internal carotid artery,37 which is subject to a much lower magnitude of FSS comparing to the apex of the bifurcation. The endothelial cells at the internal carotid artery and at the bifurcation are in parallel arrangements. Therefore, one must select appropriate engineering shear devices as the in vitro model for resembling mechanical conditions of specific vascular diseases.
IV. CONCLUSIONS
This paper describes a diamond shaped microfluidic shear device that hosts high shear stress zone and low shear stress zone within the same culturing chamber, where the zones with different stress magnitude profiles are aligned normal to the flow direction. In particular, the cells in the center compartment experience high shear stress, while those in the side compartments experience low shear stress. Shear loading tests on HUVECs showed that the device can quantify the stress magnitude-dependent and the loading duration-dependent cell reorientation, as well as the shear stress-regulated cytoskeleton expression. This work provides a tool to study the effects of hemodynamic shear stress on endothelial cell behaviour and is expected to enhance the understanding of shear stress-regulated pathophysiologic processes in vascular diseases, especially those where different shear stress zones are arranged in parallel to each other.
ACKNOWLEDGMENTS
This work was partially funded by National Science Foundation under Grant No. 0954013 (Y.Z.). The authors also acknowledge Howard Hughes Medical Institute Med-into-Grad Program for the student fellowship support (X.Z.), and funds from The Heart Center at Nationwide Children's Hospital (J.L.).
References
- 1.Nerem R. M., J. Biomech. Eng. 115(4B), 510–514 (1993). 10.1115/1.2895532 [DOI] [PubMed] [Google Scholar]
- 2.Nerem R. M., “ Shear force and its effect on cell structure and function,” ASGSB Bull. 4(2), 87–94 (1991). [PubMed] [Google Scholar]
- 3.Levesque M. J. and Nerem R. M., J. Biomech. Eng. 107(4), 341–347 (1985). 10.1115/1.3138567 [DOI] [PubMed] [Google Scholar]
- 4.Malek A. M. and Izumo S., “Mechanism of endothelial cell shape change and cytoskeletal remodeling in response to fluid shear stress,” J. Cell Sci. 109(Pt 4), 713–726 (1996). [DOI] [PubMed] [Google Scholar]
- 5.Herman I. M., Brant A. M., Warty V. S., Bonaccorso J., Klein E. C., Kormos R. L., and Borovetz H. S., J. Cell Biol. 105(1), 291–302 (1987). 10.1083/jcb.105.1.291 [DOI] [PMC free article] [PubMed] [Google Scholar]
- 6.Kim D. W., Gotlieb A. I., and Langille B. L., Arteriosclerosis 9(4), 439–445 (1989). 10.1161/01.ATV.9.4.439 [DOI] [PubMed] [Google Scholar]
- 7.Shen J., Luscinskas F. W., Connolly A., C. F. Dewey, Jr. , and M. A. Gimbrone, Jr. , “ Fluid shear stress modulates cytosolic free calcium in vascular endothelial cells,” Am. J. Physiol. 262(2 Pt 1), C384–C390 (1992). [DOI] [PubMed] [Google Scholar]
- 8.Ando J., Komatsuda T., and Kamiya A., In Vitro Cell Dev. Biol. 24(9), 871–877 (1988). 10.1007/BF02623896 [DOI] [PubMed] [Google Scholar]
- 9.Olesen S. P., Clapham D. E., and Davies P. F., Nature 331(6152), 168–170 (1988). 10.1038/331168a0 [DOI] [PubMed] [Google Scholar]
- 10.Hoger J. H., Ilyin V. I., Forsyth S., and Hoger A., Proc. Natl. Acad. Sci. U.S.A. 99(11), 7780–7785 (2002). 10.1073/pnas.102184999 [DOI] [PMC free article] [PubMed] [Google Scholar]
- 11.Hsieh H. J., Li N. Q., and Frangos J. A., J. Cell. Physiol. 150(3), 552–558 (1992). 10.1002/jcp.1041500316 [DOI] [PubMed] [Google Scholar]
- 12.Malek A. M., Gibbons G. H., Dzau V. J., and Izumo S., J. Clin. Invest. 92(4), 2013–2021 (1993). 10.1172/JCI116796 [DOI] [PMC free article] [PubMed] [Google Scholar]
- 13.Ando J., Nomura H., and Kamiya A., Microvasc. Res. 33(1), 62–70 (1987). 10.1016/0026-2862(87)90007-0 [DOI] [PubMed] [Google Scholar]
- 14.Khademhosseini A., Langer R., Borenstein J., and Vacanti J. P., Proc. Natl. Acad. Sci. U.S.A. 103(8), 2480–2487 (2006). 10.1073/pnas.0507681102 [DOI] [PMC free article] [PubMed] [Google Scholar]
- 15.Kim L., Vahey M. D., Lee H. Y., and Voldman J., Lab Chip 6(3), 394–406 (2006). 10.1039/b511718f [DOI] [PubMed] [Google Scholar]
- 16.Rosenblum M. G., Pikovsky A. S., and Kurths J., Fluctuation Noise Lett. 4(1), L53–L62 (2004). 10.1142/S0219477504001653 [DOI] [Google Scholar]
- 17.Chau L., Doran M., and Cooper-White J., Lab Chip 9(13), 1897–1902 (2009). 10.1039/b823180j [DOI] [PubMed] [Google Scholar]
- 18.Gutierrez E., Petrich B. G., Shattil S. J., Ginsberg M. H., Groisman A., and Kasirer-Friede A., Lab Chip 8(9), 1486–1495 (2008). 10.1039/b804795b [DOI] [PMC free article] [PubMed] [Google Scholar]
- 19.Usami S., Chen H. H., Zhao Y., Chien S., and Skalak R., Ann. Biomed. Eng. 21(1), 77–83 (1993). 10.1007/BF02368167 [DOI] [PubMed] [Google Scholar]
- 20.Tsou J. K., Gower R. M., Ting H. J., Schaff U. Y., Insana M. F., Passerini A. G., and Simon S. I., Microcirculation 15(4), 311–323 (2008). 10.1080/10739680701724359 [DOI] [PMC free article] [PubMed] [Google Scholar]
- 21.Rossi M., Lindken R., Hierck B. P., and Westerweel J., Lab Chip 9(10), 1403–1411 (2009). 10.1039/b822270n [DOI] [PubMed] [Google Scholar]
- 22.Metaxa E., Meng H., Kaluvala S. R., Szymanski M. P., Paluch R. A., and Kolega J., Am. J. Physiol. Heart Circ. Physiol. 295(2), H736–H742 (2008). 10.1152/ajpheart.01156.2007 [DOI] [PMC free article] [PubMed] [Google Scholar]
- 23.Urschel K., Cicha I., Daniel W. G., and Garlichs C. D., Clin. Hemorheol. Microcirc. 50(1–2), 143–152 (2012). 10.3233/CH-2011-1450 [DOI] [PubMed] [Google Scholar]
- 24.Noris M., Morigi M., Donadelli R., Aiello S., Foppolo M., Todeschini M., Orisio S., Remuzzi G., and Remuzzi A., Circ. Res. 76(4), 536–543 (1995). 10.1161/01.RES.76.4.536 [DOI] [PubMed] [Google Scholar]
- 25.Beebe D. J., Mensing G. A., and Walker G. M., Annu. Rev. Biomed. Eng. 4, 261–286 (2002). 10.1146/annurev.bioeng.4.112601.125916 [DOI] [PubMed] [Google Scholar]
- 26.Gaver D. P. III and Kute S. M., Biophys. J. 75(2), 721–733 (1998). 10.1016/S0006-3495(98)77562-9 [DOI] [PMC free article] [PubMed] [Google Scholar]
- 27.Kim L., Toh Y. C., Voldman J., and Yu H., Lab Chip 7(6), 681–694 (2007). 10.1039/b704602b [DOI] [PubMed] [Google Scholar]
- 28.Osborn E. A., Rabodzey A., C. F. Dewey, Jr. , and Hartwig J. H., Am. J. Physiol. Cell Physiol. 290(2), C444–C452 (2006) 10.1152/ajpcell.00218.2005 [DOI] [PubMed] [Google Scholar]
- 29.Azuma N., Akasaka N., Kito H., Ikeda M., Gahtan V., Sasajima T., and Sumpio B. E., “ Role of p38 MAP kinase in endothelial cell alignment induced by fluid shear stress,” Am. J. Physiol. Heart Circ. Physiol. 280(1), H189–H197 (2001). [DOI] [PubMed] [Google Scholar]
- 30.Wojciak-Stothard B. and Ridley A. J., J. Cell Biol. 161(2), 429–439 (2003). 10.1083/jcb.200210135 [DOI] [PMC free article] [PubMed] [Google Scholar]
- 31. C. F. Dewey, Jr. , Bussolari S. R., M. A. Gimbrone, Jr. , and Davies P. F., J. Biomech. Eng. 103(3), 177–185 (1981). 10.1115/1.3138276 [DOI] [PubMed] [Google Scholar]
- 32.Braddock M., Schwachtgen J. L., Houston P., Dickson M. C., Lee M. J., and Campbell C. J., “ Fluid shear stress modulation of gene expression in endothelial cells,” News Physiol. Sci. 13, 241–246 (1998). [DOI] [PubMed] [Google Scholar]
- 33.Kato H., Uchimura I., Nawa C., Kawakami A., and Numano F., “ Fluid shear stress suppresses interleukin 8 production by vascular endothelial cells,” Biorheology 38(4), 347–353 (2001). [PubMed] [Google Scholar]
- 34.Li A., Dubey S., Varney M. L., Dave B. J., and Singh R. K., J. Immunol. 170(6), 3369–3376 (2003). 10.4049/jimmunol.170.6.3369 [DOI] [PubMed] [Google Scholar]
- 35.Malek A. M., Alper S. L., and Izumo S., JAMA 282(21), 2035–2042 (1999). 10.1001/jama.282.21.2035 [DOI] [PubMed] [Google Scholar]
- 36.Chatzizisis Y. S., Coskun A. U., Jonas M., Edelman E. R., Feldman C. L., and Stone P. H., J. Am. Coll. Cardiol. 49(25), 2379–2393 (2007). 10.1016/j.jacc.2007.02.059 [DOI] [PubMed] [Google Scholar]
- 37.Zarins C. K., Giddens D. P., Bharadvaj B. K., Sottiurai V. S., Mabon R. F., and Glagov S., Circ. Res. 53(4), 502–514 (1983). 10.1161/01.RES.53.4.502 [DOI] [PubMed] [Google Scholar]


