

Abstract
The conformational diffusion coefficient for intrachain motions in biopolymers, D, sets the timescale for structural dynamics. Recently, force spectroscopy has been applied to determine D both for unfolded proteins and for the folding transitions in proteins and nucleic acids. However, interpretation of the results remains unsettled. We investigated how instrumental effects arising from the force probes used in the measurement can affect the value of D recovered via force spectroscopy. We compared estimates of D for the folding of DNA hairpins found from measurements of rates and energy landscapes made using optical tweezers with estimates obtained from the same single-molecule trajectories via the transition path time. The apparent D obtained from the rates was much lower than the result found from the same data using transition time analysis, reflecting the effects of the mechanical properties of the force probe. Deconvolution of the finite compliance effects on the measurement allowed the intrinsic value to be recovered. These results were supported by Brownian dynamics simulations of the effects of force-probe compliance and bead size.
Introduction
The structural dynamics of biopolymers such as proteins and nucleic acids are usually described in the context of energy landscape theory (1) in terms of diffusive motion over the hyper-surface representing the free energy of the polymer chain as a function of all its conformational degrees of freedom (2). In this picture, the coefficient of diffusion in the conformational space of the polymer plays a critical role, as it defines the timescale for structural dynamics. The diffusion coefficient, D, thus helps determine all the kinetic properties of the system, from the reconfiguration time for the polymer chain (3) to the rates for contact formation and folding (4) and the time needed to traverse the transitions paths across energy barriers in the landscape (5,6).
Many experimental studies of D have used fluorescence techniques to monitor the proximity of different parts of the polymer chain, for example, via Förster resonant energy transfer (FRET) between two dye labels or fluorophore-quencher interactions. Such methods allow the polymer reconfiguration time or the time for contact formation to be measured, and hence the diffusion coefficient deduced (7). Measurements on small polypeptide chains, disordered proteins, and proteins unfolded in chemical denaturant have often found values for D in the range 107 to 108 nm2/s (8–13), although for some unfolded proteins slower values have been seen, as for protein L, which had D ∼ 105 nm2/s (14).
The interpretation of these studies, however, is complicated by the assumption that the dynamics on the full multidimensional energy landscape is well captured by a projection onto a single dimension, the so-called “reaction coordinate.” As a result, a constant diffusion coefficient on the hyper-surface is transformed into a coefficient that varies with position along the reaction coordinate. Although the details of the position-dependence vary for different projections, it is generally expected that the diffusion will be fastest for unfolded configurations, slower as a polymer nears the transition state for folding (owing to the formation of substantial structure-generating interactions that restrict the conformational flexibility), and slowest in the folded state (15). FRET studies of unfolded-protein dynamics as the denaturant is titrated away support this picture, finding that D decreases as the transition state is approached (16). Despite the many successes of such fluorescence methods, however, it has proven challenging to measure D over the barrier(s) between unfolded and folded states, which is the critical region for determining rates and transition times.
Recently, another approach has been applied to study intrachain diffusion, namely single-molecule force spectroscopy (SMFS). Here, a mechanical load is applied to a single molecule using a force probe such as an atomic force microscope (AFM) or optical tweezers (Fig. 1 A), and the extension of the molecule is measured as its conformation changes as a result of the applied load (17,18). The reconfiguration time of an unfolded chain can be determined by measuring the response to an abrupt change in the force (19), or the diffusion coefficient over the folding barrier can be found from reconstructing the energy landscape profile along the reaction coordinate (20–23). SMFS thus in principle allows D to be explored over a wider range of the reaction coordinate, including the crucial barrier region.
Figure 1.
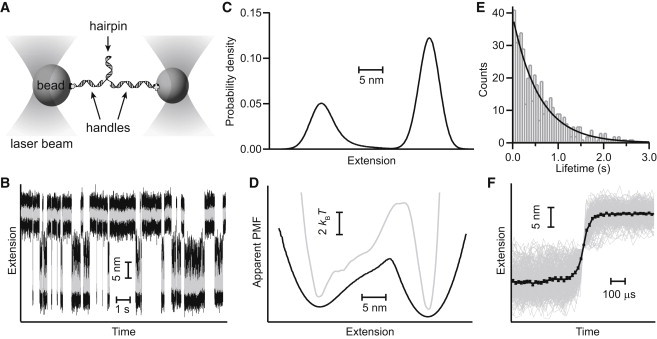
Landscape and kinetic analysis of DNA hairpin folding. (A) Schematic of measurement: a single hairpin connected to DNA handles is attached to beads held in optical traps, which apply tension to the hairpin. (B) Representative trajectory of the extension of a hairpin molecule (hairpin 30R50/T4) held at a constant force with a passive force clamp such that it fluctuates between folded (low extension) and unfolded (high extension) states. Gray data have been filtered to illustrate the two states more clearly. (C) Distribution of the extensions in the hairpin trajectory. (D) Apparent PMF found from an inverse Boltzmann transform of the extension distribution (black), and the landscape after deconvolution to remove the effects of the compliant handles and probes (gray). Curves offset for clarity. (E) Lifetimes of each state (here, the unfolded state) are distributed exponentially, yielding the folding rate. (F). Unfolding transitions aligned on the transition midpoint (gray) and averaged (black) yield an upper-bound estimate for the average transition time of 64 μs.
The interpretation of SMFS measurements of D remains unsettled, however. Recent work has suggested that tethering a molecule to a large object such as a force probe (tip and cantilever in AFM or microsphere in optical tweezers) changes the value of the diffusion coefficient governing the microscopic dynamics of the molecule on its energy landscape. By making rapid jumps in the force applied by an AFM to unfolded poly-ubiquitin molecules, Fernandez and colleagues measured the reconfiguration time for the unfolded protein, hence estimating an apparent diffusion coefficient, Dapp ∼ 103 nm2/s, many orders of magnitude lower than that typically found using fluorescence assays (19). Comparisons to simulations of molecules untethered to force probes suggested that the effect arose from the drag from the tethered force probe that, it was claimed, obscured the intrinsic intrachain D such that it could not be recovered from the SMFS measurements.
This hypothesis has a number of implications for SMFS measurements: rates should be very sensitive to the size of the tethered probe, Dapp should depend strongly on the position of the barrier along the reaction coordinate, and extrapolations to compare to untethered molecules should be invalid (19). The notion that mechanical connection to a large force probe results in a much slower diffusion coefficient was also apparently supported by the results of Brujic and colleagues, who reconstructed the folding landscape for poly-ubiquitin from force-jump measurements where the protein was allowed to refold, using the nonequilibrium statistics of the refolding trajectories (24): they found an even lower value, Dapp ∼ 102 nm2/s (22). In contrast, however, the temperature-dependence of the unfolding of poly-ubiquitin indicated an unfolding attempt frequency that was many orders of magnitude too high to be consistent with such slow diffusion (25). Moreover, other SMFS measurements reconstructing the folding landscape of the protein PrP from unfolding curves found a value of 106 nm2/s (21), much closer to the range seen in fluorescence measurements.
We explored further the question of how to determine D in the context of SMFS through measurements and simulations of force spectroscopy of the folding of DNA hairpins as a model system, using optical tweezers. We found that, although the mechanical connection to the force probe does indeed change the apparent diffusion coefficient, the very same data can yield different values of Dapp depending on how the data are analyzed. These effects were seen to result in a predictable way from the physical properties of the force probe. Contrary to previous claims, the effects of the force probe can thus be separated from the properties of the molecule to recover the intrinsic diffusion coefficient of the molecule over its folding landscape.
Methods
SMFS measurements and analysis
DNA hairpin constructs for force spectroscopy were made and measured as described previously (26,27). Briefly, hairpin constructs consisting of a single hairpin connected at each end to double-stranded DNA handles of length ∼ 600 and 1000 bp were attached to polystyrene beads of diameter 600 and 820 nm held in a dual trap system. Measurements of the extension of the hairpins as they unfolded and refolded at equilibrium were made using a passive force clamp (28) with one trap at a stiffness of 0.3 pN/nm and the other at 0 pN/nm, or in passive mode whereby the trap separation was kept constant and the stiffness of one trap was held constant at 0.3 pN/nm whereas the stiffness of the other was varied from 0 to 0.3 pN/nm. Data were sampled at 20 to 50 kHz. The apparent potential of mean force (PMF) was calculated from the measured distribution of extensions (27), and the stiffnesses of the wells and barrier found from parabolic fits to the PMF. Folding and unfolding rates were obtained from the distribution of dwell times in the two states, identified using threshold analysis after applying a median filter with a 1 to 2 ms window (26). Transition time estimates were obtained from unfiltered data by identifying all transitions in the trajectory, fitting each one to a logistic function, aligning all transitions of a given type (folding or unfolding) on their midpoints, and averaging, as described previously (20). τtp was estimated as the time required to transit the middle half of the total extension change between folded and unfolded states.
Simulations
The simulations modeled the experiments by assuming diffusive motion of a molecule over a one-dimensional (1D) potential profile, with the molecule tethered at one end to a bead of radius r via a spring with stiffness k; a constant force F was applied to the bead. Stochastic forces on the molecule and bead were drawn from Gaussian distributions of width (2γkBTΔt)1/2, where γ = kBT/D for the molecule (with diffusion constant D = 3 × 10⁵ nm2/s) and γ = 6πηr (with viscosity η = 10−3 Pa·s) for the bead, the time step Δt was 10−4 μs, and the thermal energy kBT was 4.1 pN·nm. The nonstochastic forces on the molecule and bead were, respectively, –V′(x1) + k(x2 – x1) and k(x1 – x2) – Fx2, where x1 is the extension of the molecule, x2 the position of the bead, and V(x1) the potential landscape for the folding. The landscape was chosen to mimic that of the hairpin in Fig. 1, with two potential wells separated by a barrier.
A mixed simulation scheme was used, treating x1 in pure Brownian fashion but evolving x2 according to Langevin dynamics with explicit inertial terms; the latter was done using a modified Verlet-style algorithm (29). The system was initially thermalized in a harmonic well matching the folded or unfolded well, and tested for correct energy equipartition and velocity autocorrelation decay. Trajectories from the production stage were down-sampled in most cases to 25 kHz, similar to typical experimental sampling rates, reporting a running positional average weighted by an exponentially decaying envelope with a time constant of 16 μs (tuned to replicate simulated and experimental position autocorrelation functions). Simulations for r = 20 and 100 nm were down-sampled to 200 kHz, to capture the faster motions of the smaller beads, with a proportionately faster averaging time constant of 2 μs. Simulation data were analyzed in the same way as the experimental data.
Results and Discussion
Simple DNA hairpins held under tension typically fold as two-state systems: when held at equilibrium under constant force near F1/2, the force at which the folded and unfolded states are equally likely, they exhibit “hopping” between the folded and unfolded states (26). A representative extension trajectory measured under constant force using a passive force clamp (28) is illustrated in Fig. 1 B for the hairpin 30R50/T4 (26). The distribution of extensions in the trajectory, P(x) (Fig. 1 C), can be used to determine the apparent PMF experienced by the molecule, A(x), by inverting the Boltzmann relation: A(x) = −kBT ln[P(x)] (Fig. 1 D, black). This PMF represents the apparent 1D projection of the energy hypersurface onto the reaction coordinate.
According to Kramers’ theory, the rate k for diffusive barrier crossing along a 1D potential surface is given by the following (30):
| (1) |
where κw is the stiffness of the potential well, κb the stiffness of the barrier, kBT the thermal energy, and ΔG‡ the height of the energy barrier. The curvatures of the potential wells and barrier for the hairpin folding landscape were found by parabolic fits of the apparent PMF derived from the extension trajectory, whereas the folding and unfolding rates in the trajectory were determined by fitting the distribution of observed lifetimes for the unfolded and folded states, respectively, to single exponential functions (Fig. 1 E). Measuring the height of the barrier directly from A(x), the apparent diffusion coefficient implied by Eq. 1 was then calculated independently for both folding and unfolding. The values agreed well with each other; for this hairpin, the average value was Dapp = 9 ± 1×10³ nm2/s (uncertainty represents standard error on the mean). For comparison, this value is ∼ 10 to 100 times smaller than the range of values, 105 to 106 nm2/s, implied by fluorescence studies of untethered hairpins and single-stranded DNA (31,32) and simulations of RNA folding (33).
This result appears to agree with the picture advanced by Fernandez and colleagues, that SMFS yields anomalously low Dapp values owing to the force probe tethered to the molecule. However, one of the challenges with determining D from Kramers’ theory (Eq. 1) is that the result is exponentially sensitive to the height of the barrier. Errors in determining ΔG‡ thus dominate the uncertainty in D. Instead of using the dependence of the rates on D in Eq. 1, an alternate approach is to consider the transition path time, τtp, the average time required for actual traversal of the barrier during the structural transition. Whereas rates depend exponentially more strongly on ΔG‡ than they do on D, for τtp the situation is reversed: in the large-barrier limit,
| (2) |
where γ is Euler’s constant (5,6). Thus τtp is relatively insensitive to the barrier height, and provides a potentially more reliable way of determining D. We measured the apparent τtp from extension trajectories by aligning each transition on its midpoint and averaging the transitions (Fig. 1 F), as described previously (20). We note that such an analysis actually only provides an upper bound for τtp, because τtp may be smaller than the time resolution of the instrument (20). For hairpin 30R50/T4, the apparent transition time was 64 ± 4 μs. Using Eq. 2 and the properties of the apparent PMF (Fig. 1 D), this implies Dapp = 9 ± 1×10⁴ nm2/s; because τtp is an upper bound, this value represents a lower bound for Dapp.
The lower bound for D from Eq. 2 apparently contradicts the result from Eq. 1, being 10 times higher despite coming from the same data. In contrast, it is at the low end of the range of values found by other methods (e.g., fluorescence, simulations). The same analysis applied to measurements of four other DNA hairpins (20R50/T4 from (26), and 20TS06/T4, 20TS10/T4, and 20TS18/T4 from (27)) produced similar results (Table 1). Averaging over all the hairpins, the apparent diffusion coefficient found from the rates via Eq. 1 was 5 ± 1×10³ nm2/s, whereas the lower bound obtained via Eq. 2 from the apparent transition time was 1 ± 0.1×10⁵ nm2/s, 20-fold faster. Note that these hairpins were chosen to have barriers with positions varying from 5 to 20 nm from the folded state (27). In contrast to predictions (19), however, the value of Dapp did not vary significantly with the position of the barrier.
Table 1.
Apparent diffusion coefficient from trajectories of DNA hairpins under tension.
| Molecule name | Diffusion coefficient (nm2/s) |
|
|---|---|---|
| from Kramers | from τtp | |
| 30R50/T4 (6) | 9 ± 1×10³ | 9 ± 1×10⁴ |
| 20R50/T4 (4) | 3.0 ± 0.6×10³ | 1.3 ± 0.3×10⁵ |
| 20TS06/T4 (5) | 6.3 ± 0.5×10³ | 5.1 ± 0.5×10⁴ |
| 20TS10/T4 (1) | 1.4 ± 0.3×10³ | 1.0 ± 0.3×10⁵ |
| 20TS18/T4 (4) | 6 ± 1×10³ | 1.2 ± 0.2×10⁵ |
The apparent value of D found from Kramers’ theory (Eq. 1) and from the apparent transition time (Eq. 2), for different hairpins. Uncertainties represent standard error from number of molecules listed in parentheses.
The discrepancy between the two values for D obtained from the same force spectroscopy data, differing only in the analytical method used—and indeed the differences from the values found by other experimental approaches—can be understood by examining how the properties of the assay and measurement apparatus affect the results of the measurement. First, the apparent PMF of the full system (as in Fig. 1 D, black) does not properly represent the energy landscape being explored by the molecule of interest: it includes also the effects of motions of the compliant handles and beads in harmonic traps (27,34). Changing the compliance of the dumbbells, whether by changing the stiffness of the traps or the stiffness of the handles, will change the widths and overlap of the peaks in the extension distribution, and hence also the well widths and barrier height in the apparent PMF. Such an effect was demonstrated by comparing measurements of a hairpin using compliant double-stranded DNA handles with those using rigid DNA origami beams (35). Increasing the compliance decreases the apparent barrier height, such that an exponentially slower Dapp is needed to achieve a given rate in Eq. 1. More generally, the system compliance affects any analytical approach that depends on the distribution of the molecular extension, because it invariably broadens the apparent distribution.
Fortunately, the effects of the compliance can be determined sufficiently well that they may be removed by deconvolution, either empirically by measuring the point-spread function (27), or theoretically by modeling the mechanical properties of the measurement (34). Applying an empirical deconvolution to the trajectory for the hairpin in Fig. 1 B produced the landscape shown in Fig. 1 D (gray). Using the deconvolved landscape in Eq. 1 results in a diffusion coefficient that is considerably larger, ∼ 5 × 10⁵ nm2/s (20). A similar deconvolution for all the hairpin data resulted in an average 70-fold increase in D, to D ∼ 3 × 10⁵ nm2/s. This value is just above the lower bound of 1 × 10⁵ nm2/s obtained from the apparent τtp, indicating that the latter gave a reasonable estimate. Notably, it also agrees well with the results from experiments and simulations of hairpin folding in the absence of tethers (31,33).
To explore the effect of the instrumental compliance further, we used Brownian dynamics simulations of a hairpin diffusing over a given landscape. The hairpin was connected to a bead of radius r via a handle of stiffness k, through which a constant force was applied. Simulations were run with r = 400 nm for stiffnesses from 0.2 to 10 pN/nm, generating trajectories (Fig. 2 A) of 80 to 85 s in duration for each condition, containing 2600 to 6300 unfolding/refolding transitions for each simulation. The simulation results were analyzed as for the experimental data. As expected, the extension distributions P(x) generally broadened with increasing probe compliance (Fig. 2 B), leading to lower apparent barrier heights (Fig. 2 C) and hence lower Dapp from Eq. 1 (Fig. 3 A, black). Only when the probe stiffness was comparable to the stiffness of the features in the energy landscape (∼5 pN/nm) was P(x) largely unaffected, allowing the value for D imposed in the simulation (3 × 10⁵ nm2/s) to be recovered (Fig. 3 A, dashed line). The apparent τtp, however, was affected much less by changes in k, leading to estimates of Dapp that were fairly close to the imposed D for all k values (Fig. 3 A, gray); the average over all simulations was 1.3 ± 0.2 × 10⁵ nm2/s, with Dapp increasing slightly as the stiffness was lowered because the overlap between the extension distributions for the two states increased, which decreased the curvature of the apparent barrier. The estimate of D from the apparent τtp was therefore better than that from the rates under low-stiffness conditions—as observed experimentally—but worse when the stiffness was high.
Figure 2.
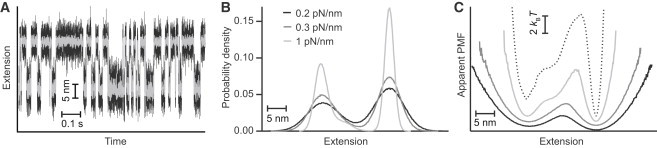
Simulations of folding trajectories. (A) Simulated trajectory for a bead radius of 400 nm and stiffness of 0.3 pN/nm. Gray data have been filtered to illustrate the two states more clearly. (B) Distributions of the bead position for different stiffness values, illustrating the broadening because of increased compliance. (C) Apparent PMFs recovered by inverse Boltzmann transform from the position distributions, for different stiffness values (black: 0.2 pN/nm; dark gray: 0.3 pN/nm; light gray: 1 pN/nm), illustrating convergence toward the actual landscape (dotted line) at high stiffness. Curves offset for clarity.
Figure 3.
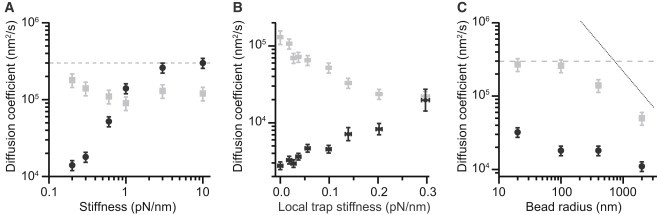
Effects of stiffness and bead radius on apparent diffusion coefficient. (A) The diffusion coefficient recovered from simulations using Eq. 1 (black) approaches at high stiffness the actual value used in the simulations (dashed line). Using Eq. 2 (gray) yields values that provide a better estimate at low stiffness. (B) Experiments on hairpin 20R50/T4 varying the local stiffness of one of the traps reveal similar trends in the diffusion coefficient as a function of stiffness, with estimates from Eq. 1 (black) improving as the stiffness increases, whereas estimates from Eq. 2 (gray) are best at low stiffness. (C) The diffusion coefficient as a function of bead size recovered from simulations using Eq. 2 (gray) approaches the actual value in the simulation (dashed line) for small bead sizes, but is reduced as the bead size increases, being bounded above by the coefficient for diffusion of a free bead (dotted line). The estimate from Eq. 1 (black) is much lower than that from Eq. 2, owing to the low stiffness used in the simulation.
The same qualitative trends seen in the simulations were also observed experimentally when the system stiffness was varied. Measurements of hairpin 20R50/T4 folding near F1/2 using the passive force clamp, wherein the local stiffness of one of the two traps was effectively set to zero by performing the measurement at the maximum point on that trap’s force-displacement curve (28), were compared with measurements of the same molecule made at different displacements from the trap center, such that the local stiffness increased from 0 to 0.3 pN/nm even though the applied load was kept the same (i.e., near F1/2). Recovering Dapp from Eq. 1, after correcting for changes to the rates induced by the finite local stiffness (28), we found that Dapp increased progressively with the stiffness (Fig. 3 B, black). At low stiffness, the value of Dapp recovered from Eq. 2 (Fig. 3 B, gray) provided a better estimate, but increases in the apparent barrier curvature with increasing stiffness caused Dapp found from Eq. 2 to decrease; continued stiffness increases would lead to the estimate from Eq. 1 eventually being better, as in Fig. 3 A.
Of course, the properties of the instrument and assay do not just affect the extension distributions, they also affect the dynamics that are observed, by imposing a characteristic timescale on which changes in the signal can be measured. The instrument effectively acts as a filter in the time domain, smoothing out rapid changes in the signal. The apparent transition paths measured with the tweezers therefore represent the true paths convolved with the transfer function of the trapped tethers. The time response for our tweezers has been measured at roughly 50 μs (20). The apparent transition time of 64 ± 4 μs for hairpin 30R50/T4, for example, thus represents a convolution of the actual transition time, 31 ± 5 μs (as found from landscape analysis after deconvolution of instrumental effects (20)), and the instrument response time. In principle, the dynamics of the probe-tether-molecule complex can be deconvolved to recover the dynamics of the molecule alone (36), however this approach has proven challenging to apply in practice. Instead, we explored this effect with simulations. Because the key variable setting the timescale for the instrumental filtering—for a given solvent viscosity and system stiffness—is the size of the beads, we simulated the dynamics for fixed k = 0.3 pN/nm but r ranging from 20 to 2000 nm.
Analyzing the data as above, τtp was found to decrease with r; the resulting estimates of Dapp from Eq. 2 (Fig. 3 C, gray) became very close to the value for D used in the simulation (Fig. 3 C, dashed line) at the smallest bead sizes. In contrast, Dapp estimated from Eq. 1 remained too low for all bead sizes (Fig. 3 C, black), consistent with expectations for a very compliant probe. The recovery of the intrinsic D for molecular motions using Eq. 2, even when the high system compliance leads to a significant underestimate of the barrier height (as here), results from the insensitivity of τtp to the barrier height. We note that at large bead sizes, as Dapp decreased it always remains below the value expected for free diffusion of a sphere from the Stokes law (Fig. 3 C, dotted line). The free-bead diffusion Dbead and the molecular diffusion D thus provide dual upper bounds for Dapp, as would be expected because the combined bead-molecule system should not diffuse faster than the slowest individual component.
This work thus shows that SMFS measurements of D are best done by applying force with small (hence fast-response) and/or stiff probes. It is worth noting, however, that both the probe size and stiffness may have second-order effects that alter the apparent value of D. For example, it has been shown that increasing the stiffness of the handles will decrease the observed rates for folding/unfolding (37,38), via stronger coupling to the slow-moving beads, thereby changing Dapp estimated from Eq. 1. Such effects are relatively small for the typical handles used in optical trapping experiments (e.g., of order unity for duplex DNA handles of length 500 to 2000 bp) (38), but could become significant for very stiff handles such as extremely short duplex DNA (39) or DNA origami beams (35). A similar effect on the rates has been seen from changes in the bead size (38). Modest changes in the rates (factors or 2 or less) were indeed seen in both sets of simulations, displaying the expected trends of decreasing rate with increasing stiffness and bead size, and contributing to observations such as the apparent bead-radius dependence of Dapp recovered from Eq. 1 (Fig. 3 C, black). Estimates of Dapp can also be affected by instrumental effects other than those discussed above. For example, the use of an active feedback loop to maintain a constant force on the molecule is known to alter the observed folding and unfolding rates (40,41). Feedback loops may also alter the distribution of extensions, especially when the extension (and hence force, too) is changing rapidly as the molecule moves between states, thereby complicating any deconvolution analysis. In this context, therefore, passive modes of measurement lacking any active feedback controls (whether the force is constant or not (28)) offer the best approach.
Conclusion
These results show that, contrary to assertions made previously (19), the intrinsic diffusion constant for motions of the molecule can indeed be recovered from SMFS measurements if care is taken to account for the effects of the instrumentation. For measurements where D is determined from the distribution of molecular extensions, it is essential to deconvolve the effects of the probe and tether compliance, whereas for measurements where D is found from the dynamical response of the molecule, the effects of the finite probe time response tend to be most important. Analyses that ignore these considerations are likely to produce incorrect and inconsistent values of D, but taking the instrumental effects into account should allow meaningful comparisons to be made with the results obtained via different methods.
Acknowledgments
This work was supported by the Natural Sciences and Engineering Research Council Canada and Alberta Innovates Technology Futures.
References
- 1.Bryngelson J.D., Wolynes P.G. Spin glasses and the statistical mechanics of protein folding. Proc. Natl. Acad. Sci. USA. 1987;84:7524–7528. doi: 10.1073/pnas.84.21.7524. [DOI] [PMC free article] [PubMed] [Google Scholar]
- 2.Dill K.A., MacCallum J.L. The protein-folding problem, 50 years on. Science. 2012;338:1042–1046. doi: 10.1126/science.1219021. [DOI] [PubMed] [Google Scholar]
- 3.Gopich I.V., Nettels D., Szabo A. Protein dynamics from single-molecule fluorescence intensity correlation functions. J. Chem. Phys. 2009;131:095102. doi: 10.1063/1.3212597. [DOI] [PMC free article] [PubMed] [Google Scholar]
- 4.Kramers H.A. Brownian motion in a field of force and the diffusion model of chemical reactions. Physica. 1940;7:284–304. [Google Scholar]
- 5.Chung H.S., Louis J.M., Eaton W.A. Experimental determination of upper bound for transition path times in protein folding from single-molecule photon-by-photon trajectories. Proc. Natl. Acad. Sci. USA. 2009;106:11837–11844. doi: 10.1073/pnas.0901178106. [DOI] [PMC free article] [PubMed] [Google Scholar]
- 6.Chaudhury S., Makarov D.E. A harmonic transition state approximation for the duration of reactive events in complex molecular rearrangements. J. Chem. Phys. 2010;133:034118. doi: 10.1063/1.3459058. [DOI] [PubMed] [Google Scholar]
- 7.Szabo A., Schulten K., Schulten Z. First passage time approach to diffusion controlled reactions. J. Chem. Phys. 1980;72:4350–4357. [Google Scholar]
- 8.Hagen S.J., Hofrichter J., Eaton W.A. Diffusion-limited contact formation in unfolded cytochrome c: estimating the maximum rate of protein folding. Proc. Natl. Acad. Sci. USA. 1996;93:11615–11617. doi: 10.1073/pnas.93.21.11615. [DOI] [PMC free article] [PubMed] [Google Scholar]
- 9.Buckler D.R., Haas E., Scheraga H.A. Analysis of the structure of ribonuclease A in native and partially denatured states by time-resolved nonradiative dynamic excitation energy transfer between site-specific extrinsic probes. Biochemistry. 1995;34:15965–15978. doi: 10.1021/bi00049a011. [DOI] [PubMed] [Google Scholar]
- 10.Lapidus L.J., Eaton W.A., Hofrichter J. Measuring the rate of intramolecular contact formation in polypeptides. Proc. Natl. Acad. Sci. USA. 2000;97:7220–7225. doi: 10.1073/pnas.97.13.7220. [DOI] [PMC free article] [PubMed] [Google Scholar]
- 11.Möglich A., Joder K., Kiefhaber T. End-to-end distance distributions and intrachain diffusion constants in unfolded polypeptide chains indicate intramolecular hydrogen bond formation. Proc. Natl. Acad. Sci. USA. 2006;103:12394–12399. doi: 10.1073/pnas.0604748103. [DOI] [PMC free article] [PubMed] [Google Scholar]
- 12.Nettels D., Gopich I.V., Schuler B. Ultrafast dynamics of protein collapse from single-molecule photon statistics. Proc. Natl. Acad. Sci. USA. 2007;104:2655–2660. doi: 10.1073/pnas.0611093104. [DOI] [PMC free article] [PubMed] [Google Scholar]
- 13.Ahmad B., Chen Y., Lapidus L.J. Aggregation of α-synuclein is kinetically controlled by intramolecular diffusion. Proc. Natl. Acad. Sci. USA. 2012;109:2336–2341. doi: 10.1073/pnas.1109526109. [DOI] [PMC free article] [PubMed] [Google Scholar]
- 14.Waldauer S.A., Bakajin O., Lapidus L.J. Extremely slow intramolecular diffusion in unfolded protein L. Proc. Natl. Acad. Sci. USA. 2010;107:13713–13717. doi: 10.1073/pnas.1005415107. [DOI] [PMC free article] [PubMed] [Google Scholar]
- 15.Best R.B., Hummer G. Coordinate-dependent diffusion in protein folding. Proc. Natl. Acad. Sci. USA. 2010;107:1088–1093. doi: 10.1073/pnas.0910390107. [DOI] [PMC free article] [PubMed] [Google Scholar]
- 16.Borgia A., Wensley B.G., Schuler B. Localizing internal friction along the reaction coordinate of protein folding by combining ensemble and single-molecule fluorescence spectroscopy. Nat. Commun. 2012;3:1195. doi: 10.1038/ncomms2204. [DOI] [PMC free article] [PubMed] [Google Scholar]
- 17.Woodside M.T., García-García C., Block S.M. Folding and unfolding single RNA molecules under tension. Curr. Opin. Chem. Biol. 2008;12:640–646. doi: 10.1016/j.cbpa.2008.08.011. [DOI] [PMC free article] [PubMed] [Google Scholar]
- 18.Zoldák G., Rief M. Force as a single molecule probe of multidimensional protein energy landscapes. Curr. Opin. Struct. Biol. 2013;23:48–57. doi: 10.1016/j.sbi.2012.11.007. [DOI] [PubMed] [Google Scholar]
- 19.Berkovich R., Hermans R.I., Fernandez J.M. Rate limit of protein elastic response is tether dependent. Proc. Natl. Acad. Sci. USA. 2012;109:14416–14421. doi: 10.1073/pnas.1212167109. [DOI] [PMC free article] [PubMed] [Google Scholar]
- 20.Neupane K., Ritchie D.B., Woodside M.T. Transition path times for nucleic acid folding determined from energy-landscape analysis of single-molecule trajectories. Phys. Rev. Lett. 2012;109:068102. doi: 10.1103/PhysRevLett.109.068102. [DOI] [PubMed] [Google Scholar]
- 21.Yu H., Gupta A.N., Woodside M.T. Energy landscape analysis of native folding of the prion protein yields the diffusion constant, transition path time, and rates. Proc. Natl. Acad. Sci. USA. 2012;109:14452–14457. doi: 10.1073/pnas.1206190109. [DOI] [PMC free article] [PubMed] [Google Scholar]
- 22.Lannon H., Haghpanah J.S., Brujic J. Force-clamp experiments reveal the free-energy profile and diffusion coefficient of the collapse of protein molecules. Phys. Rev. Lett. 2013;110:128301. doi: 10.1103/PhysRevLett.110.128301. [DOI] [PubMed] [Google Scholar]
- 23.Woodside M.T., Block S.M. Reconstructing folding energy landscapes by single-molecule force spectroscopy. Annu Rev Biophys. 2014;43:19–39. doi: 10.1146/annurev-biophys-051013-022754. [DOI] [PMC free article] [PubMed] [Google Scholar]
- 24.Zhang Q., Brujic J., Vanden-Eijnden E. Reconstructing free energy profiles from nonequilibrium relaxation trajectories. J. Stat. Phys. 2011;144:344–366. [Google Scholar]
- 25.Popa I., Fernández J.M., Garcia-Manyes S. Direct quantification of the attempt frequency determining the mechanical unfolding of ubiquitin protein. J. Biol. Chem. 2011;286:31072–31079. doi: 10.1074/jbc.M111.264093. [DOI] [PMC free article] [PubMed] [Google Scholar]
- 26.Woodside M.T., Behnke-Parks W.M., Block S.M. Nanomechanical measurements of the sequence-dependent folding landscapes of single nucleic acid hairpins. Proc. Natl. Acad. Sci. USA. 2006;103:6190–6195. doi: 10.1073/pnas.0511048103. [DOI] [PMC free article] [PubMed] [Google Scholar]
- 27.Woodside M.T., Anthony P.C., Block S.M. Direct measurement of the full, sequence-dependent folding landscape of a nucleic acid. Science. 2006;314:1001–1004. doi: 10.1126/science.1133601. [DOI] [PMC free article] [PubMed] [Google Scholar]
- 28.Greenleaf W.J., Woodside M.T., Block S.M. Passive all-optical force clamp for high-resolution laser trapping. Phys. Rev. Lett. 2005;95:208102. doi: 10.1103/PhysRevLett.95.208102. [DOI] [PMC free article] [PubMed] [Google Scholar]
- 29.Gronbech-Jensen N., Farago O. A simple and effective Verlet-type algorithm for simulating Langevin dynamics. Mol. Phys. 2013;111:983–991. [Google Scholar]
- 30.Hanggi P., Talkner P., Borkovec M. Reaction-rate theory—50 years after Kramers. Rev. Mod. Phys. 1990;62:251–341. [Google Scholar]
- 31.Ansari A., Kuznetsov S.V., Shen Y. Configurational diffusion down a folding funnel describes the dynamics of DNA hairpins. Proc. Natl. Acad. Sci. USA. 2001;98:7771–7776. doi: 10.1073/pnas.131477798. [DOI] [PMC free article] [PubMed] [Google Scholar]
- 32.Wang X., Nau W.M. Kinetics of end-to-end collision in short single-stranded nucleic acids. J. Am. Chem. Soc. 2004;126:808–813. doi: 10.1021/ja038263r. [DOI] [PubMed] [Google Scholar]
- 33.Lin J.-C., Thirumalai D. Relative stability of helices determines the folding landscape of adenine riboswitch aptamers. J. Am. Chem. Soc. 2008;130:14080–14081. doi: 10.1021/ja8063638. [DOI] [PubMed] [Google Scholar]
- 34.Hinczewski M., Gebhardt J.C.M., Thirumalai D. From mechanical folding trajectories to intrinsic energy landscapes of biopolymers. Proc. Natl. Acad. Sci. USA. 2013;110:4500–4505. doi: 10.1073/pnas.1214051110. [DOI] [PMC free article] [PubMed] [Google Scholar]
- 35.Pfitzner E., Wachauf C., Dietz H. Rigid DNA beams for high-resolution single-molecule mechanics. Angew. Chem. Int. Ed. Engl. 2013;52:7766–7771. doi: 10.1002/anie.201302727. [DOI] [PMC free article] [PubMed] [Google Scholar]
- 36.Hinczewski M., von Hansen Y., Netz R.R. Deconvolution of dynamic mechanical networks. Proc. Natl. Acad. Sci. USA. 2010;107:21493–21498. doi: 10.1073/pnas.1010476107. [DOI] [PMC free article] [PubMed] [Google Scholar]
- 37.Wen J.-D., Manosas M., Tinoco I., Jr. Force unfolding kinetics of RNA using optical tweezers. I. Effects of experimental variables on measured results. Biophys. J. 2007;92:2996–3009. doi: 10.1529/biophysj.106.094052. [DOI] [PMC free article] [PubMed] [Google Scholar]
- 38.Chang J.-C., de Messieres M., La Porta A. Effect of handle length and microsphere size on transition kinetics in single-molecule experiments. Phys. Rev. E Stat. Nonlin. Soft Matter Phys. 2013;87:012721. doi: 10.1103/PhysRevE.87.012721. [DOI] [PubMed] [Google Scholar]
- 39.Forns N., de Lorenzo S., Ritort F. Improving signal/noise resolution in single-molecule experiments using molecular constructs with short handles. Biophys. J. 2011;100:1765–1774. doi: 10.1016/j.bpj.2011.01.071. [DOI] [PMC free article] [PubMed] [Google Scholar]
- 40.Manosas M., Wen J.-D., Ritort F. Force unfolding kinetics of RNA using optical tweezers. II. Modeling experiments. Biophys. J. 2007;92:3010–3021. doi: 10.1529/biophysj.106.094243. [DOI] [PMC free article] [PubMed] [Google Scholar]
- 41.Elms P.J., Chodera J.D., Marqusee S. Limitations of constant-force-feedback experiments. Biophys. J. 2012;103:1490–1499. doi: 10.1016/j.bpj.2012.06.051. [DOI] [PMC free article] [PubMed] [Google Scholar]