Abstract
It is very important to understand the onset and growth pattern of breast primary tumours as well as their metastatic dissemination. In most cases, it is the metastatic disease that ultimately kills the patient. There is increasing evidence that cancer stem cells are closely linked to the progression of the metastatic tumour. Here, we investigate stem cell seeding to an avascular tumour site using an agent-based stochastic model of breast cancer metastatic seeding. The model includes several important cellular features such as stem cell symmetric and asymmetric division, migration, cellular quiescence, senescence, apoptosis and cell division cycles. It also includes external features such as stem cell seeding frequency and location. Using this model, we find that cell seeding rate and location are important features for tumour growth. We also define conditions in which the tumour growth exhibits decremented and exponential growth patterns. Overall, we find that seeding, senescence and division limit affect not only the number of stem cells, but also their spatial and temporal distribution.
Keywords: computational modelling, progenitor cells, metastatic niche
1. Introduction
The stem cell hypothesis that tumours progress owing to a small population of cells within the tumour that exhibit specific properties such as unlimited self-renewal, ability to develop tumour spheroids and ability to differentiate is gaining support [1–4]. Specifically, there is increasing evidence that this is the case in breast [5,6], colorectal [7–9] and skin cancer [9–11], to name a few. There is increasing support for the importance of cancer stem cells (CSC) in the process of metastatic dissemination and colonization [12–14]. It is generally accepted that different primary cancers have organ-specific sites for metastasis [15]. The lung is the second most common site for metastasis, partially because it is highly vascularized [16]. Organ-specific metastasis may be mediated by cytokines, such as CXCR4, which attract certain types of cancer cells to specific metastatic sites [17]. Thus, we investigate different locations of seeding sites and their influence on tumour progression.
Norton and Massague proposed the self-seeding hypothesis, which states that metastasis is a multidirectional process in which cancer cells leave the primary site, metastasize and that metastatic cells may not only seed the metastatic sites, but also the primary site, the process termed ‘self-seeding’ [18]. Norton proposed self-seeding of the primary tumour would result in increased growth rate and mass size when compared with stem cell self-renewal owing to the increased ratio of stem cells on the periphery of the tumour [19]. It is also proposed that seeds may be CSC and contribute to the Gompertzian growth patterns seen in cancer [20]. In support of this hypothesis, breast, colorectal and melanoma cancer cells were able to seed primary sites in mouse xenograft models [21], and this effect seems to be mediated by chemoattractants [22]. Although stem cell seeding has been investigated in regards to primary tumour growth, it is unclear what effect it has on the escape from metastatic dormancy.
Several computational models have been used to study stem cell growth dynamics, reviewed in [23]. Agur's laboratory used a system of ordinary differential equations (ODE) [24] and a cellular automata model [25] that examines CSC in tumour growth. Another mathematical model suggested that therapies encouraging CSC differentiation would be effective [26]. Several studies focused on the acquisition of mutations in the tumour population using an ODE model [27], a cellular Potts model [28] and a stochastic model [29]. Cancer stem cell dynamics have also been the focus of several models of multicellular aggregates [30]. A mathematical model coupled with tumour spheroids data was used to determine symmetric division rates for neural and breast cancer cells [31]. Gerlee and co-workers [32] used mathematical modelling to investigate primary versus secondary seeding in a breast primary tumour. Sottoriva and co-workers have used modelling to study stem cell niche dynamics [33], tumour heterogeneity and invasion [34]. In several studies, Enderling and co-workers have modelled stem cell originated tumour growth [35–38]. The models focus on the conditions for dormancy [36] as a function of rate of migration [35], directed migration tumour immune response [37] and hierarchical growth dynamics [39]. There are many types of computational models and each has its own strengths and weaknesses [40]. Because the locations of cells are important, but we are also investigating thousands of cells, we chose the lattice agent-based modelling to incorporate the most features while still being computationally feasible.
Multiscale in silico systems biology approaches have been applied previously in studies of cancer [41,42] and angiogenesis [40,43–45] (see [46–48] for reviews), but there has been a limited number of computational models investigating metastasis. The goal of this study is to examine the effect of stem cell seeding and location from the primary tumour or metastatic growth in a three-dimensional environment using a previously developed agent-based model [35,36,38,49].
2. Methods
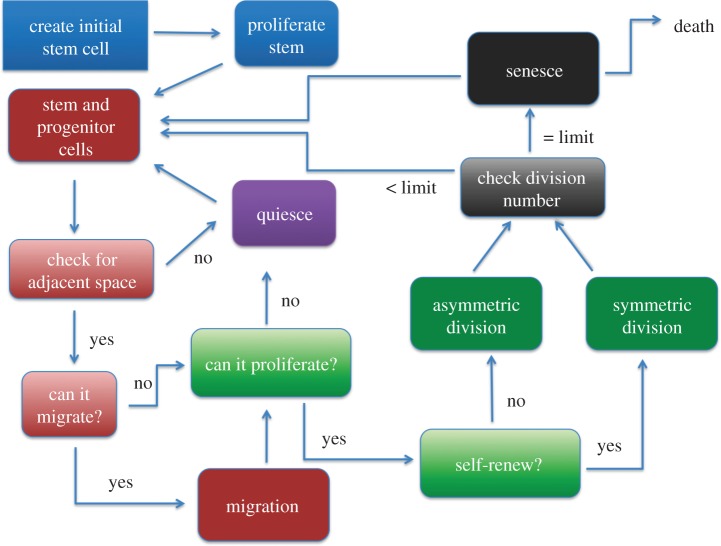
We used a spatial lattice agent-based stochastic model of breast cancer metastasis based on the work of Enderling et al. [35,36,38,49] to examine the effects of seeding location on tumour progression and morphology, see the electronic supplementary material data for more information. The simulation starts with one stem cell metastatic seeding event represented by a cell ‘agent’. The simulation takes place on a 2000 × 2000 × 2000 μm grid where each voxel is 10 × 10 × 10 μm3 and roughly fits one spherical cancer cell. Human triple-negative breast cancer MDA-MB-231 cells have diameters of approximately 10 μm [50], and the cell size assumption can easily be relaxed for other cancer cells. Each cell is confined to occupy a space in a lattice. The flowchart of the model is illustrated in figure 1: first the grid is set up, and an initial stem cell is placed on the grid; the stem cell proliferates to create a progenitor cell. Next, each cell is checked whether it has adjacent space. Each of its 26 adjacent neighbours is checked for vacancy; if it does not have space, it becomes quiescent. Once there is free space in one of its adjacent neighbours on the grid, it becomes proliferative and can divide. If the cell can proliferate and is a stem cell, it determines whether it will divide symmetrically or asymmetrically; if it is a progenitor cell, it must divide symmetrically. Then, the number of divisions the cell has completed is checked and if it has reached the division limit, it undergoes senescence or apoptosis and is removed from the simulation. Afterwards, the cycle repeats. Because we are modelling the avascular tumour growth, we stop the simulation at 500 000 cells.
Figure 1.
Flowchart of the spatial agent-based lattice model. (Online version in colour.)
2.1. Set-up
During the set-up phase of the simulation, an initial stem cell is placed at position (1 100 1) on the grid, representing a stem cell being placed on, for instance, the surface of a breast tumour, mammary duct or lung. Each cell follows a set of probabilistic rules (figure 2).
Figure 2.
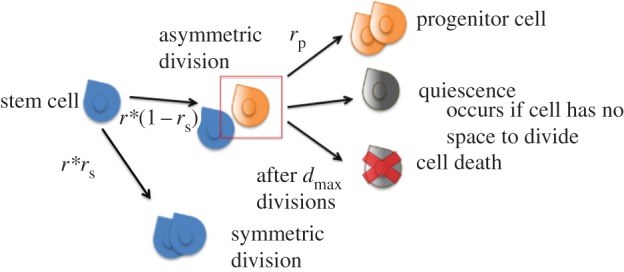
Cell states in the spatial agent-based lattice model. A stem cell mitoses with a probability r. Once it is slated to mitose, it divides symmetrically with a rate of rs and asymmetrically with a rate 1 − rs. Progenitor cells mitose with a rate of rp and they always reproduce symmetrically. A progenitor cell senesces or dies after it has divided dmax times. A cell becomes quiescent if it has no space to divide. (Online version in colour.)
2.2. Cell proliferation
The cells in the model follow a specific set of proliferative rules based on whether it is a stem cell or a progenitor cell. Stem cells are immortal, have unlimited proliferative potential and can proliferate into differentiated progenitor cells. Progenitor cells can proliferate only into progenitor cells and have a limited number of cell divisions. Each stem cell proliferates at a rate r. If proliferation occurs, it reproduces symmetrically to produce two stem daughters (one of which replaces itself) at a rate rs or asymmetrically to produce a stem cell daughter (replacing itself) and a progenitor cell daughter at a rate 1 − rs. Stem cells could have different symmetric division rates, as a result of specific growth factors and cytokines in the microenvironment, such as TGF-β, IL-8, CXCL7 [6,51,52]. Each progenitor cell can only reproduce symmetrically to produce two progenitor daughter cells at a rate rp. As the tumour growth is avascular, we assume each cell has enough nutrients to proliferate.
2.3. Apoptosis
Apoptosis, programmed cell death, is also dependent on cell type. Stem cells are assumed to be immortal and they do not die in the model. Stem cells have been estimated to live from a range of 10–60 months [53,54] and because our simulations run for 36 months, the assumption that they do not die during the simulation is justified. This is also supported by the fact that stem cells are considered to be resistant to differentiation signals, resistant to apoptosis and have an unlimited proliferative potential [55]. Progenitor cell death occurs either probabilistically after senescence or after they have exhausted their number of replication cycles dmax, which is limited owing to telomere shortening. Once a cell apoptoses, it is removed from the simulation.
2.4. Seeding
Two types of stem cell seeding are included in the model, figure 3, such that each day with probability ps a stem cell is seeded at a specific location in the metastatic niche, see the electronic supplementary material data for more information. Case 1: when a specific place in the vasculature has been breached to make it possible for successive seeds to extravasate from this location, and case 2: when seeding occurs anywhere on the organ of interest. In the first scenario, termed ‘site seeding’, the seed is assumed to come from one direction where there is a break in the vasculature. Once a ‘seed’ has extravasated through the vasculature, the local vasculature is remodelled [56] and this can lead to a facilitated extravasation of other cancer cells. Circulating breast tumour cells have been shown to colonize already established tumours, mediated by tumour-derived cytokines, e.g. IL-6 and IL-8, and these seeds were shown to be 5–30% of the tumour mass [21]. A random voxel occupied by the tumour is chosen, and the new seed is placed in the outermost position on the z-axis at the edge of the tumour.
Figure 3.
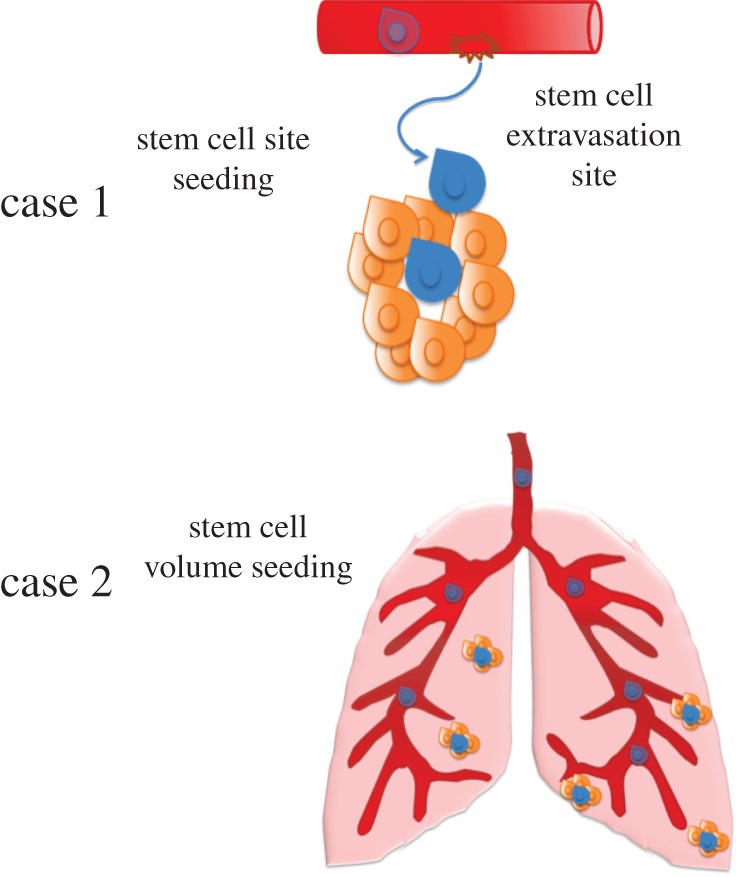
Representation of stem cell seeding. Case 1: site seeding, where the seed comes from one site. Case 2: volume seeding, where the stem cell seeds any site within the whole organ. (Online version in colour.)
The second type of seeding, termed ‘volume seeding’, is when the seeding occurs randomly at any place in the metastatic site, which in the model is any grid point unoccupied by a cell. This type of seeding might occur when the vasculature is more permissive to cancer cell penetration; e.g. metastases to the lung, which are known to have vascular destabilization and be distributed throughout the entire lung [57]. Currently, the model examines growth before the angiogenic switch and does not take into account the growth of the tumour vasculature as well as the presence of other stromal cells, which will be investigated in further models.
2.5. Progenitor cell senescence
Cellular senescence is a terminal progression into a non-proliferative state, compared with quiescence in which cells become non-proliferative, but can become proliferative when conditions change. One cause of senescence is when telomeres shorten to the point where subsequent proliferation would cause chromosomal instability [58]. In the model, this would occur when a cell's cycle reaches the division limit. To investigate how this would influence the cancer dynamics, we included progenitor cell senescence. Once a cell reaches its division limit, it becomes senescent. Each iteration the senescent cells have a probability of death that is varied in the model.
The model is available in .m file format at http://www.jhu.edu/apopel/software.html.
Parameters: the parameters chosen in the model are based on values reported in the literature, see the electronic supplementary material data for more details.
3. Results
3.1. Inhibition of stem cell proliferation leads to inhibited tumour growth
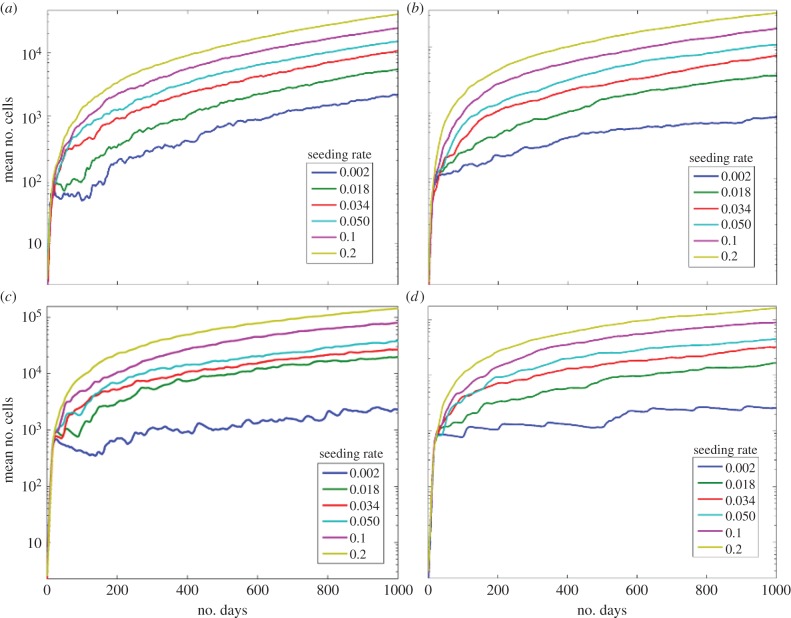
We find that when progenitor cells have a larger number of divisions, resulting in higher numbers of them, they surround the stem cells leading to spatial inhibition of proliferation. When the division limit is low, dmax = 6, figure 4a, site seeding had a small effect on the average total number of cells. When the division limit is high, dmax = 12, figure 4b, the maximum average number of cells without seeding was about 500 compared with 2000 when dmax = 6. Thus, when there is no site seeding the number of cells increases with decreasing division limit (and increasing apoptosis) consistent with Enderling's results [36].
Figure 4.
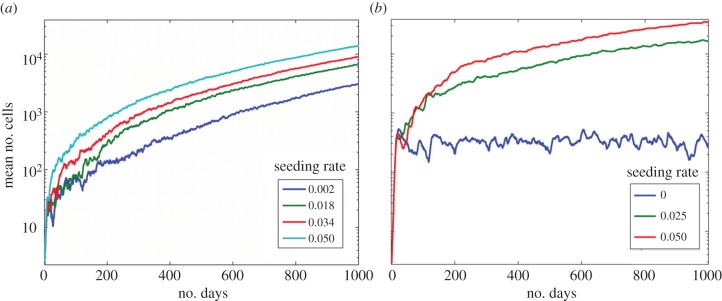
Effects of division limit. (a) The effects of seeding rate ps with dmax = 6. (b) The effects of seeding rate ps with dmax = 12. The symmetric division rate is 0.05. (Online version in colour.)
We find that progenitor cell senescence also leads to inhibition of stem cell proliferation. For both senescent death rates, figure 5, the total number of cells is lower than the case without senescence (figure 4). With a death rate of 0.1, during the first 200 days, there is a decremented exponential growth with plateauing in the number of cells. This is due to space inhibition of growth from the senescent cells and cell death (figure 5a). When the death rate is lower, the growth inhibition continues for all 1080 days (figure 5b). When dmax = 12 with senescence, figure 5c, the numbers of cells increases to 100 000 with a site seeding rate of 0.2. Similar to dmax = 6 with a senescent death of 0.1, at low seeding rates, the numbers of cells decreases before iteration 200 owing to cell death and then slowly increases (figure 5a). In both cases of senescent death rate, the overall trends are similar (figure 5d).
Figure 5.
Effects of senescence. The mean number of cells under stem cell seeding rates ps with different death rates. The symmetric division rate is 0.05. (a) The death rate of senescent cells is 0.1 and dmax = 6. (b) The death rate of senescent cells is 0.01 and dmax = 6. (c) The death rate of senescent cells is 0.1 and dmax = 12. (d) The death rate of senescent cells is 0.01 and dmax = 12. (Online version in colour.)
3.2. Exponential tumour growth
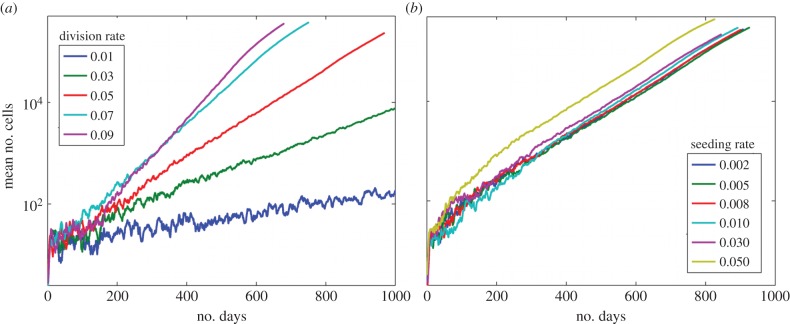
While most of the simulations lead to a decremented exponential growth, where the tumour grew but then the growth slowed, a few simulations lead to non-decremented growth, which was close to exponential. This occurred when cells were allowed to migrate one cell length each iteration. With migration allowed, the effects of stem cell symmetric division are more pronounced, figure 6a, compared with when there is no migration, electronic supplementary material, figure S1. The mean total number of cells when migration is allowed was greater than 350 000 cells by 600 days. The slope of the mean number of cells (on log scale) stays linear for a longer time before decreasing when the cells are able to migrate.
Figure 6.
Effects of migration. (a) The mean numbers of cells under varying symmetric division rates when cells migrate. (b) The mean numbers of cells under varying stem cell seeding rates when cells migrate. The symmetric division rate is 0.05. (Online version in colour.)
Next, the effects of changes in the site seeding rate when cells are allowed to randomly migrate are determined (figure 6b). Without migration, the mean number of cells maximally reached 6000 after 1000 days, whereas with migration the mean number of cells exceed 400 000 by 1000 iterations, over a 100-fold difference. Thus, migration has a large effect on the growth of the metastasis under different symmetric division rates and stem cell seeding rates. Compared with the case of site seeding, symmetric division rate has an even more pronounced effect on the growth of the metastasis. It is clear that migration decreases the restrictions on growth owing to space limitations. Thus, the cellular movement releases the cells from the restrictions of quiescence and they are able to proliferate more frequently.
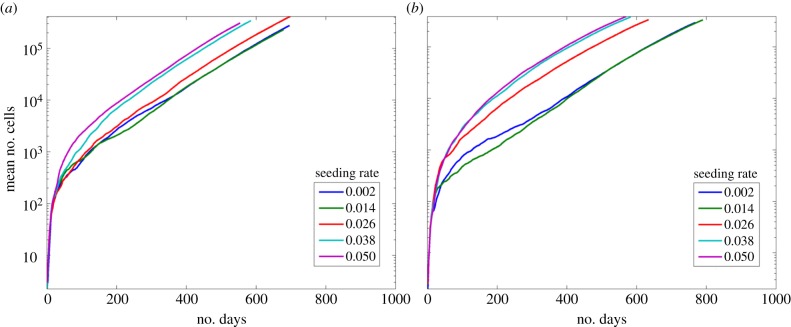
To determine whether senescence could inhibit the growth of the tumour when migration is allowed, we examined two scenarios: (i) where all cells could migrate and (ii) where the senescent cells migrated four times slower than other cells. When all cells are allowed to migrate, at all seeding rates, the numbers of cells reaches 500 000 cells before 700 iterations (figure 7a). When the senescent cells move slower than the other cells, the rate of growth is slightly slower, but otherwise the trends are similar (figure 7b). With all site seeding rates, the number of cells reaches 500 000 by iteration 800, thus growth is still uninhibited. When the division rate is raised to 12 however, the growth of the tumour slows and when the site seeding rate is 0.002 the tumour does not reach 500 000 cells, data not shown.
Figure 7.
Senescence with migration. The mean number of cells under stem cell seeding rates ps with different migration rates and dmax = 6. (a) All cells have the same migration rate. (b) The senescent cells migrate four times slower. (Online version in colour.)
3.3. Stem cell seeding is important for tumour growth
While we have already addressed the cases where the tumour grows in an uninhibited fashion, there are also cases in which stem cell seeding is critical for tumour growth. For instance, when the division rate is high, site seeding becomes very important for tumour growth. When dmax = 12 and there is no site seeding, the growth of the tumour completely plateaus, figure 4b. By contrast, when there is seeding (ps = 0.05), the average number of cells increases 70-fold. The total number of cells is even greater than when dmax = 6. Thus, site seeding has a larger effect on tumour growth when the division limit is increased.
When CSC were randomly seeded anywhere in the empty grid space, a process termed ‘volume seeding’, the tumour growth is closer to exponential, figure 8a. When dmax = 6, ‘volume seeding’ has a greater number of cells than ‘site seeding’ for the whole range of seeding rates. This is a result of growth inhibition owing to seeds being placed on the surface of the existing tumour and thus its growth is limited in direction. The surrounding tumour cells restrict both progenitor and stem proliferation leading to lower numbers of cells in the case of ‘surface seeding’. When dmax is 12, figure 8b, ‘volume seeding’ results in more cells over time. This is due to the fact that initially each seed is inhibited only by itself and not by the cells from the previously growing tumour. In addition, compared with a division rate of 6, there are fewer tumour cells in the long-term growth of the metastasis. Once again, this is because the greater number of progenitor cells created from each stem cell inhibits the stem cell's proliferation. As the volume seeding rate increases, the rate of growth actually decreases, because, eventually, the newly seeded stem cells occur close to other growing seeded metastases, and thus their growth is inhibited.
Figure 8.
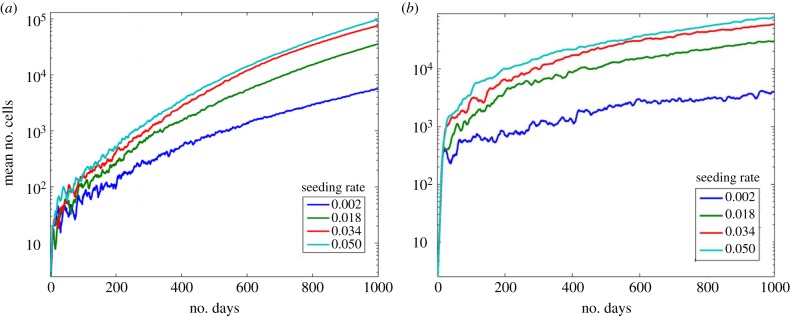
Effects of seeding location. The mean number of cells under stem cell seeding rates ps with seeding occurring randomly anywhere on the grid. (a) Here dmax = 6. (b) Here dmax = 12. (Online version in colour.)
3.4. Three-dimensional tumours exhibit three different architectural types
3.4.1. A spherical-like mass in which the stem cells are distributed throughout
A growing tumour with dmax = 6 and no migration or senescence results in an architecture where the stem cells occupy the centre of the tumour and are connected in a mass. Figure 9 shows the resulting tumour after 1080 days with stem cells in cyan, figure 9a, and the entire tumour in blue, figure 9b. When there are site seeding events without migration, it creates bulges of progenitor cells. As shown in figure 9c, stem cells are distributed throughout the metastasis. A few stem cells can create large numbers of progenitor cells when unimpeded by space restrictions. Comparing the distribution of stem cells when there is migration, figure 9a, we see that the distribution of stem cells is more spherical with isolated stem cells that have migrated from the edge of the tumour mass, figure 9c. The resulting tumour looks spherical with a peppering of progenitor cells near the isolated stem cells, figure 9d. Near the edges of the tumour, the cells are much more spread out, and the total numbers of stem cells is quite large (around 40 000).
Figure 9.
Three-dimensional tumour images with cancer stem cells distributed throughout the tumour. The rates of symmetric division, seeding are 0.05 and dmax = 6. (a) The stem cells (cyan) after 1080 days. (b) The entire tumour (blue). (c) The stem cells after 1080 days when migration is allowed. (d) The entire tumour when migration is allowed. (Online version in colour.)
3.4.2. A tumour with condensed bulges with stem cells at the centre
The condensed bulges seen in many of the tumours are a result of stem cells populating small ‘self-metastases’, which are spatially inhibited. One reason the stem cells become spatially inhibited is that they produce a large number of progenitor cells with high division limits. In tumours with a dmax = 12, the distribution of stem cells is not uniform, and the numbers of stem cells are quite small (around 200). In figure 10a, the site seeding events can be seen from the disconnected stem cell populations. Here, it is clear that there are small separated clusters of stem cells that could only have been formed from stem cell seeding events, which were then growth inhibited. These separated stem cells cause progenitor cell clumps to form around them leading to bulges projecting from the central mass of cells as shown in figure 10b.
Figure 10.

Three-dimensional tumour images with a division limit of 12. (a) The stem cells after 1080 days. (b) The entire tumour. The rates of symmetric division and seeding are 0.05. (Online version in colour.)
When senescence is included in the model, the three-dimensional morphologies of the tumour are quite different than without senescence. When dmax = 6 and there is no migration, the stem cells are disconnected, similar to the case with dmax = 12 without senescence (figure 11a). In this case, the progenitor cells are less tightly packed, figure 11b. When dmax = 12 and there is senescence, the distribution of stem cells looks very similar to when dmax = 6, figure 11c, but the progenitor cells are more tightly packed and show the representative ‘self-metastases’ morphology, figure 11d. This case looks very similar morphologically to the case of no senescence with dmax = 12.
Figure 11.
Three-dimensional tumour images with senescence. The seeding rate is 0.05. (a) The stem cells after 1080 days with dmax = 6. (b) The entire tumour with dmax = 6. (c) The stem cells after 1080 days with dmax = 12. (d) The entire tumour with dmax = 12. The rates of symmetric division and seeding are 0.05. (Online version in colour.)
3.4.3. A metastatic tumour with cells dispersed over the entire region
Here, seeded stem cells are placed randomly in the grid, also called ‘volume seeding’ and mimicking a situation, such as in the lung, where the ‘niche’ vasculature is destabilized and metastases are known to form over the entire region. This phenomenon can be seen in figure 12 showing the three-dimensional image for volume seeding rate of ps = 0.05 with dmax = 12. The stem cells are dispersed throughout the space, figure 12a, but some of the progenitor cell clusters grow into one another inhibiting each others' growth, figure 12b. When dmax = 12, the tumour clusters are actually much smaller than when dmax = 6, and the bulk of the clusters are made of progenitor cells. This is once again owing to the space inhibition of stem cell proliferation owing to the increase in the number of progenitor cells surrounding each stem cell.
Figure 12.
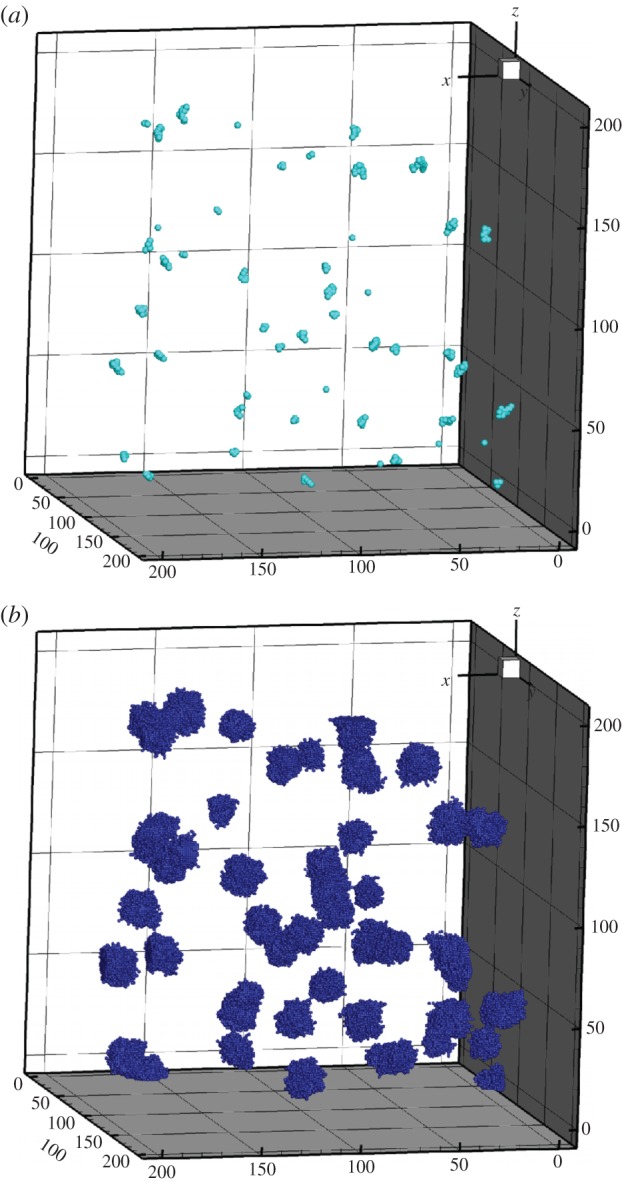
Three-dimensional tumour images of volume seeding. The seeding rate is 0.05. (a) The stem cells after 1080 days. (b) The entire tumour. The rates of symmetric division and seeding are 0.05 and dmax = 12. (Online version in colour.)
3.5. Stem cell percentages
In addition to the variation in three-dimensional stem cell distributions, the percentages of stem cells within the tumour bulk are different when different initial conditions are applied. In the condition where the dmax = 6 and no migration is allowed, the percentages remain relatively stable after the first 400 iterations, figure 13a. Depending on the stem cell seeding rate, the percentage of stem cells in the tumour bulk ranges from 7% to 13%. If dmax = 6 but migration is allowed, figure 13b, we see that independent of the rate of stem cell site seeding, the stem cell percentages remains around 5%. When the division limit is raised to 12, figure 13c, the percentage of stem cells changes drastically. Here, independent of the site seeding rate, the percentage of stem cells in the tumour bulk remains about 0.5%. This is logical, because each progenitor cell can now generate more progenitor cells, which inhibit stem cell proliferation, so the fraction of stem cells is substantially reduced.
Figure 13.
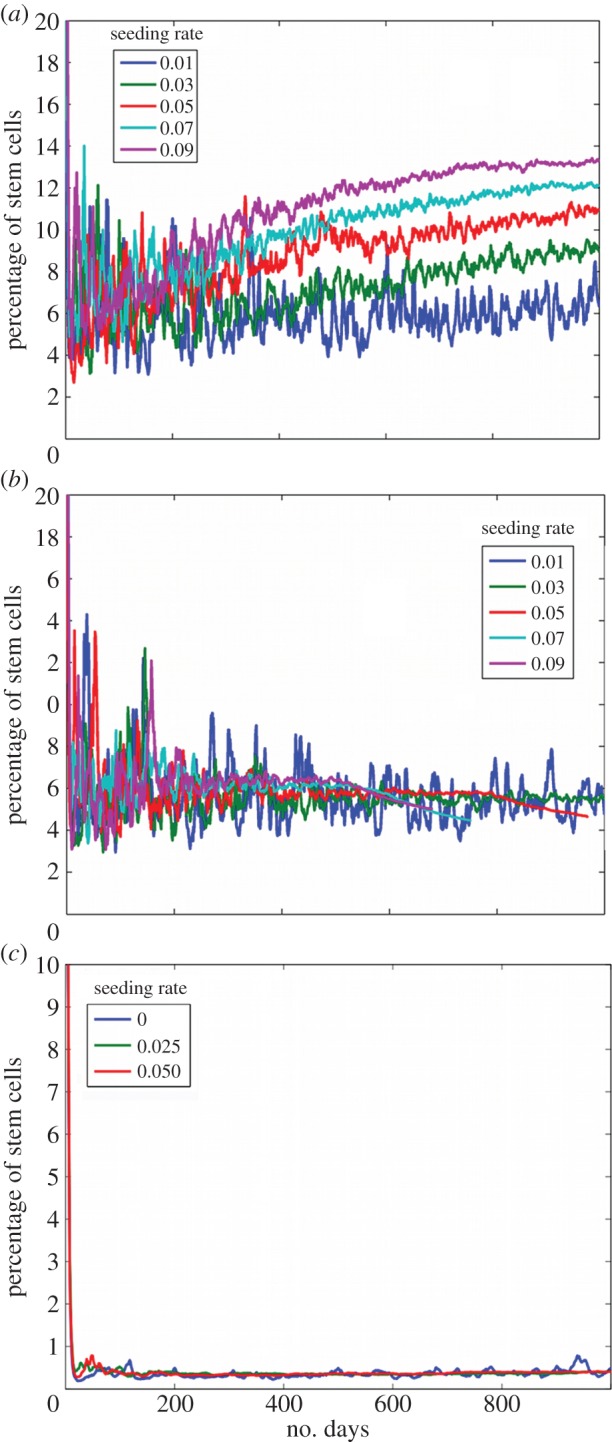
The percentage of stem cells over time. (a) Simulation with dmax = 6 and no migration. (b) Simulation with dmax = 6 with migration. (c) Simulation with dmax = 12 and no migration. (Online version in colour.)
3.6. Comparison with experimental data
We find that the ratio of stem cells to total cells has a wide range in the model, in qualitative agreement with experimental data. Lagadec found using a method they developed and aldehyde dehydrogenase (ALDH+), the fraction of stem cells in breast luminal cell lines ranged from 0.1% to 0.9% stem cells, whereas in malignant cell lines, it ranged from 0.98% to 11.1% [59]. Other studies have found pancreatic cancer stem cell fractions range from 0.2% to 0.8% [60], and colon CSC vary from 2% all the way to 75% in some cases [61,62]. In our computational model, we found stem cell percentages to be between 0.2% and 15% depending on the simulation parameters in agreement with the literature.
Table 1 compares different doubling times in days for different cancers, primary tumours or metastases, in different locations (breast or lung). There is a large range of doubling times, ranging from 27 to 270 days in primary tumours and from 3 to 360 days in metastases [63–66]. The doubling times of the model fit within the ranges reported in previous studies. Examining metastases that stayed below 500 000 cells within the 1000 days, their doubling times ranged from 120 to 192 days. Tumours that grew past 500 000 cells had doubling times mostly ranging from 41 to 83 days. There were also a few cases in which the tumour size essentially did not change within 200 days and these were excluded from consideration. In conclusion, the simulation stem cell ratios and doubling times are consistent with values reported in previous studies.
Table 1.
Doubling rates (in days) for different cancers.
| cancer type | doubling time (in days) | reference |
|---|---|---|
| atypical non-malignant | 1.25–11 | [63] |
| primary | 27–270 | [63–66] |
| primary breast | 105–270 | [64] |
| primary lung | 39–269 | [64] |
| metastasis | 3–360 | [64,65] |
| lung metastasis | 3–360 | [64,65] |
| lung metastasis from breast | 82–199 | [64] |
| model: micrometastasis | 120–192 | |
| model: macrometastasis | 41–83, 303 |
4. Discussion
This model investigates the important relationship between stem cell seeding frequency, seeding location and cell division in a primary tumour or a metastatic environment. It uses a previously developed model by Enderling and co-workers [35,36,38,49] to specifically investigate stem cell seeding frequency and location in a three-dimensional environment. The essential conclusions of the model are the following:
(1) Having a lower division limit reduces the number of times a cell can proliferate before dying, and thus increases the frequency of apoptosis. Because cells are dying off faster, one might expect that this would lead to decreased cell growth. We find that with site seeding having a lower division limit actually increases tumour growth. This is due to the fact that having higher apoptosis creates space for cells to proliferate, in particular, the stem cells, and decreases the amount of quiescence, which in turn allows for an increase in the number of stem cells at the metastatic site. Faster tumour growth results are in agreement with previous models [35,36].
(2) Our simulations indicate that seeding becomes very important in the cases where the division limit of the cells is high. The higher division limit results in space-limited quiescence, so the cells (including the stem cells) do not proliferate as often. Here, cell quiescence becomes a limiting factor to growth and decreases the number of stem cells created through symmetric division. Under these conditions, the growth of the tumour becomes more dependent on stem cell seeding. Because site seeding occurs either at the surface of the tumour or randomly in the niche space, these stem cells are not restricted, so tumour growth occurs. When there is no site seeding a large division limit results in a reduction in the number of total cells, whereas with seeding, an increased division limit will result in an increased number of cells (table 2).
(3) Our simulations indicate that migration increases tumour growth under all circumstances. Because cells are allowed to migrate, they are less restricted by their environment and thus are less likely to quiesce. Because they remain in a proliferative state, the metastasis expands more rapidly leading to an increased number of stem cells and progenitor cells. This is supported by several experimental studies that relate stemness to the migratory epithelial–mesenchymal transition [67–71]. Because migration limits the effects of quiescence, in all cases having a larger division limit increases the number of cells (table 2).
(4) Migration also influences the morphology of the resulting tumour. When cells are migratory, this leads to a more spherical overall shape of the tumour, with a peppering of cells near the ‘surface’. Site seeding contributes to the bulges in the overall shape, because the seeded stem cells grow as separate ‘self-metastases’ [72]. This is exasperated by having a high division limit, because each stem cell generates more progenitors and have inhibited symmetric divisions owing to space restriction. This will cause fewer and more isolated stem cells surrounded by progenitors creating bulges in the tumour.
(5) We find that in the cases where there is a low division limit, the growth is decremented exponential growth such that the growth of the tumour slows down after a period of time (figure 4a). When the division limit is high and there is no seeding, the growth of the metastasis is Gompertzian growth [73,74], with exponential growth followed by a complete plateauing effect where the numbers of cells fluctuate around 350 cells (figure 4b). This is similar to other models of stem cell control with feedback inhibition, where the cell growth is oscillatory but with plateauing [75]. With site seeding, the growth is decremented exponential growth, but the complete plateauing effect is not seen. This may eventually become Gompertzian, but the simulation was not run long enough to be sure. When the division limit is larger, the decrement is larger and closer to a plateau than when the division limit is smaller. If stem cells have enough space to proliferate, then the growth of the metastatic tumour will be less inhibited. Having a higher division limit also slows down the rate of growth once the initial cascade of progenitors have been created. This is once again owing to the effects of having limited space for proliferation.
(6) In general, site seeding with a low division rate leads to a tumour that is filled with stem cells, whereas with dmax = 12 leads to tumours with dispersed stem cells surrounded by progenitor cells. We find a ‘fingering’ morphology at the edge of the tumour occurs when there is migration and dmax = 6. The sphere-like morphology of the tumour is due to random migration, which leads to a diffusion of the cells, with ‘fingers’ occurring at the edges from cells migrating away from tumour bulk. A less pronounced ‘fingering’ occurs when dmax = 6, whereas when dmax = 12, the tumour has bulges instead of ‘fingers’. This ‘fingering’ morphology has been seen in experimental breast cancer models [76–78] and in computational models [34,35,79]. In corroboration with our three-dimensional tumour morphologies, Tanei et al. have identified using immunohistochemistry, human breast tumours with stem cells located throughout the tissue, such as in figure 9, and tumours with isolated stem cells, such as in figure 11 [80].
(7) ‘Volume seeding’ leads to an increase in tumour growth. Initially, this outcome is large but it gradually slows owing to space limitations. Thus, the higher the frequency of seeding the larger the growth, but the difference between the curves becomes smaller. Essentially, when seeding is less frequent the seeds tend to be spatially separate from each other and thus there is no inhibition of one ‘self-metastasis’ to another. As the number of seeds increases owing to the increased frequency of seeding, the grid becomes more saturated with seeds and the stem cell clusters start to inhibit one another's growth. This may be one explanation as to why surgery in the primary site can increase recurrence and metastases [81]. Once the tumour has been removed, the space restrictions are decreased, and any stem cells left at the site will have space to symmetrically divide leading to an increase in stem cells and increase in growth of the tumour leading to recurrence. There is also evidence that primary tumour removal might accelerate pre-existing metastases owing to the suppression of cell-mediated immunity [81,82]. Because quiescent stem cells have a mesenchymal-like phenotype [83], these newly exposed stem cells may also be more likely to migrate to a metastatic site.
(8) When senescence is included in the model, the distribution of stem cells becomes much closer to the example when the division limit is large. This is due to the fact that the senescent cells surrounding the stem cells lead to space-inhibited growth. Therefore, the stem cells are less proliferative and tumour growth is reduced. This is in agreement with other models showing that initially senescence yields larger tumours, but over time, senescence tumours have greatly reduced growth rates [84]. According to the model, increasing cell senescence might be an effective strategy to limit tumour growth.
Table 2.
Comparison of the number of cells for each division limit.
| division limit 6 | division limit 12 | |
|---|---|---|
| no migration and no seeding | increase in cell number | decrease in cell number |
| no migration and seeding | decrease | increase |
| migration and no seeding | decrease | increase |
| migration and seeding | decrease | increase |
Summarizing our results, we can make some predictions of the best targets for metastatic treatment. Based on our simulation results, we predict that therapies inducing cell apoptosis will be beneficial only in certain circumstances. Our results also suggest that reducing the amount of stem cell seeding will be beneficial especially in cases where the cells have limited migratory abilities. Therapies specifically targeting stem cell symmetric division should be very effective at reducing metastatic tumour growth, which is supported by literature [9,85]. If seeding at a metastatic site is limited and there is no migration, the metastasis will likely remain dormant. Increasing cell senescence should also be an effective way to inhibit stem cell proliferation.
In conclusion, we have investigated the role of stem cell seeding using an agent-based spatial model of cancer metastasis. Our analysis predicts that stem cell seeding is an important factor for metastatic growth when progenitor cells do not have a short number of replicative cycles. Telomere length is a major factor responsible for the replicative cycle of a cell [86]. Thus, we predict that stem cell seeding will greatly accelerate metastatic growth when they can extend their telomeres, in part, owing to regulation of telomerase expression by cMyc [3,87]. Inhibitors of CSC have been investigated which have been shown to reduce the number of stem cells such as salinomycin and dendritic-cell vaccinations [11,88]. Our results also indicate that inhibiting cell migration would be effective for inhibiting metastatic growth.
This model has several simplifications. First, we limit the model to a pre-angiogenic stage of growth. Angiogenesis is an important stage in tumour growth in which the tumour releases growth factors to recruit vasculature to the tumour site and allows for the expansion of tumour; it is beyond the scope of this manuscript, but will be included in further research. Another simplification is that we do not include clonal evolution of stem and progenitor cells as has been done in other works [27,28,89,90]. While this is an important aspect of cancer, it is not the focus of the manuscript. While we examine the three-dimensional architecture of tumour, we currently do not take into account the specific architecture of the site. We merely assume that this is a solid tumour growing within a tissue. This simplification is made, so that the model could be generalized for many tumour types. We intend to adapt it for a specific tissue type, breast cancer, and then we will take into account the tissue morphology.
Supplementary Material
Supplementary Material
Supplementary Material
Supplementary Material
Acknowledgements
The authors acknowledge Lindsey Fernholz for her contributions to data collection and Dr Niranjan Pandey and Dr Esak Lee for reading the manuscript and making critical comments. We acknowledge that simulations were partially run on the IBM zBX x-blades purchased by Marist College through funding provided by the National Science Foundation.
Funding statement
This work was supported by the National Institutes of Health grant nos. R01 CA138264 (ASP), T32CA130840 Postdoctoral Training Programme in Nanotechnology for Cancer Medicine (K-A.N.), and an American Cancer Society postdoctoral fellowship PF-13–174-01-CSM (K-A.N.).
References
- 1.Li Y, Laterra J. 2012. Cancer stem cells: distinct entities or dynamically regulated phenotypes? Cancer Res. 72, 576–580. ( 10.1158/0008-5472.CAN-11-3070) [DOI] [PMC free article] [PubMed] [Google Scholar]
- 2.Visvader JE, Lindeman GJ. 2012. Cancer stem cells: current status and evolving complexities. Cell Stem Cell 10, 717–728. ( 10.1016/j.stem.2012.05.007) [DOI] [PubMed] [Google Scholar]
- 3.Wicha MS, Liu S, Dontu G. 2006. Cancer stem cells: an old idea: a paradigm shift. Cancer Res. 66, 1883–1890; discussion 1895–1896 ( 10.1158/0008-5472.CAN-05-3153) [DOI] [PubMed] [Google Scholar]
- 4.Zhao Y, et al. 2011. Cancer stem cells and angiogenesis. Int. J. Dev. Biol. 55, 477–482. ( 10.1387/ijdb.103225yz) [DOI] [PubMed] [Google Scholar]
- 5.Alkatout I, Wiedermann M, Bauer M, Wenners A, Jonat W, Klapper W. 2013. Transcription factors associated with epithelial–mesenchymal transition and cancer stem cells in the tumor centre and margin of invasive breast cancer. Exp. Mol. Pathol. 94, 168–173. ( 10.1016/j.yexmp.2012.09.003) [DOI] [PubMed] [Google Scholar]
- 6.Liu S, et al. 2011. Breast cancer stem cells are regulated by mesenchymal stem cells through cytokine networks. Cancer Res. 71, 614–624. ( 10.1158/0008-5472.CAN-10-0538) [DOI] [PMC free article] [PubMed] [Google Scholar]
- 7.Potten CS, Booth C, Hargreaves D. 2003. The small intestine as a model for evaluating adult tissue stem cell drug targets. Cell Prolif. 36, 115–129. ( 10.1046/j.1365-2184.2003.00264.x) [DOI] [PMC free article] [PubMed] [Google Scholar]
- 8.Schepers AG, Snippert HJ, Stange DE, van den Born M, van Es JH, van de Wetering M, Clevers H. 2012. Lineage tracing reveals Lgr5+ stem cell activity in mouse intestinal adenomas. Science 337, 730–735. ( 10.1126/science.1224676) [DOI] [PubMed] [Google Scholar]
- 9.Takahashi-Yanaga F, Kahn M. 2010. Targeting Wnt signaling: can we safely eradicate cancer stem cells? Clin. Cancer Res. 16, 3153–3162. ( 10.1158/1078-0432.CCR-09-2943) [DOI] [PubMed] [Google Scholar]
- 10.Driessens G, Beck B, Caauwe A, Simons BD, Blanpain C. 2012. Defining the mode of tumour growth by clonal analysis. Nature 488, 527–530. ( 10.1038/nature11344) [DOI] [PMC free article] [PubMed] [Google Scholar]
- 11.Teitz-Tennenbaum S, Wicha MS, Chang AE, Li Q. 2012. Targeting cancer stem cells via dendritic-cell vaccination. Oncoimmunology 1, 1401–1403. ( 10.4161/onci.21026) [DOI] [PMC free article] [PubMed] [Google Scholar]
- 12.Korkaya H, Liu S, Wicha MS. 2011. Breast cancer stem cells, cytokine networks, and the tumor microenvironment. J. Clin. Invest. 121, 3804–3809. ( 10.1172/JCI57099) [DOI] [PMC free article] [PubMed] [Google Scholar]
- 13.Malanchi I, Santamaria-Martinez A, Susanto E, Peng H, Lehr H-A, Delaloye J-F, Huelsken J. 2012. Interactions between cancer stem cells and their niche govern metastatic colonization. Nature 481, 85–89. ( 10.1038/nature10694) [DOI] [PubMed] [Google Scholar]
- 14.Velasco-Velazquez MA, Popov VM, Lisanti MP, Pestell RG. 2011. The role of breast cancer stem cells in metastasis and therapeutic implications. Am. J. Pathol. 179, 2–11. ( 10.1016/j.ajpath.2011.03.005) [DOI] [PMC free article] [PubMed] [Google Scholar]
- 15.Nguyen DX, Bos PD, Massague J. 2009. Metastasis: from dissemination to organ-specific colonization. Nat. Rev. Cancer 9, 274–284. ( 10.1038/nrc2622) [DOI] [PubMed] [Google Scholar]
- 16.Langley RR, Fidler IJ. 2011. The seed and soil hypothesis revisited: the role of tumor–stroma interactions in metastasis to different organs. Int. J. Cancer 128, 2527–2535. ( 10.1002/ijc.26031) [DOI] [PMC free article] [PubMed] [Google Scholar]
- 17.Joyce JA, Pollard JW. 2009. Microenvironmental regulation of metastasis. Nat. Rev. Cancer 9, 239–252. ( 10.1038/nrc2618) [DOI] [PMC free article] [PubMed] [Google Scholar]
- 18.Norton L, Massague J. 2006. Is cancer a disease of self-seeding? Nat. Med. 12, 875–878. ( 10.1038/nm0806-875) [DOI] [PubMed] [Google Scholar]
- 19.Norton L. 2008. Cancer stem cells, self-seeding, and decremented exponential growth: theoretical and clinical implications. Breast Dis. 29, 27–36. [DOI] [PubMed] [Google Scholar]
- 20.Comen E, Norton L, Massague J. 2011. Clinical implications of cancer self-seeding. Nat. Rev. Clin. Oncol. 8, 369–377. [DOI] [PubMed] [Google Scholar]
- 21.Kim MY, Oskarsson T, Acharyya S, Nguyen DX, Zhang XH-F, Norton L, Massagué J. 2009. Tumor self-seeding by circulating cancer cells. Cell 139, 1315–1326. ( 10.1016/j.cell.2009.11.025) [DOI] [PMC free article] [PubMed] [Google Scholar]
- 22.Leung CT, Brugge JS. 2009. Tumor self-seeding: bidirectional flow of tumor cells. Cell 139, 1226–1228. ( 10.1016/j.cell.2009.12.013) [DOI] [PubMed] [Google Scholar]
- 23.Michor F. 2008. Mathematical models of cancer stem cells. J. Clin. Oncol. 26, 2854–2861. ( 10.1200/JCO.2007.15.2421) [DOI] [PubMed] [Google Scholar]
- 24.Agur Z, Kirnasovsky OU, Vasserman G, Tencer-Hershkowicz L, Kogan Y, Harrison H, Lamb R, Clarke RB, Gottardi C. 2011. Dickkopf1 regulates fate decision and drives breast cancer stem cells to differentiation: an experimentally supported mathematical model. PLoS ONE 6, e24225 ( 10.1371/journal.pone.0024225) [DOI] [PMC free article] [PubMed] [Google Scholar]
- 25.Vainstein V, Kirnasovsky OU, Kogan Y, Agur Z. 2011. Strategies for cancer stem cell elimination: insights from mathematical modeling. J. Theor. Biol. 298C, 32–41. [DOI] [PubMed] [Google Scholar]
- 26.Molina-Pena R, Alvarez MM. 2012. A simple mathematical model based on the cancer stem cell hypothesis suggests kinetic commonalities in solid tumor growth. PLoS ONE 7, e26233 ( 10.1371/journal.pone.0026233) [DOI] [PMC free article] [PubMed] [Google Scholar]
- 27.Ashkenazi R, Gentry SN, Jackson TL. 2008. Pathways to tumorigenesis: modeling mutation acquisition in stem cells and their progeny. Neoplasia 10, 1170–1182. [DOI] [PMC free article] [PubMed] [Google Scholar]
- 28.Sottoriva A, Vermeulen L, Tavare S. 2011. Modeling evolutionary dynamics of epigenetic mutations in hierarchically organized tumors. PLoS Comput. Biol. 7, e1001132 ( 10.1371/journal.pcbi.1001132) [DOI] [PMC free article] [PubMed] [Google Scholar]
- 29.Foo J, Leder K, Michor F. 2011. Stochastic dynamics of cancer initiation. Phys. Biol. 8, 015002 ( 10.1088/1478-3975/8/1/015002) [DOI] [PMC free article] [PubMed] [Google Scholar]
- 30.White DE, Kinney MA, McDevitt TC, Kemp ML. 2013. Spatial pattern dynamics of 3D stem cell loss of pluripotency via rules-based computational modeling. PLoS Comput. Biol. 9, e1002952 ( 10.1371/journal.pcbi.1002952) [DOI] [PMC free article] [PubMed] [Google Scholar]
- 31.Deleyrolle LP, et al. 2011. Determination of somatic and cancer stem cell self-renewing symmetric division rate using sphere assays. PLoS ONE 6, e15844 ( 10.1371/journal.pone.0015844) [DOI] [PMC free article] [PubMed] [Google Scholar]
- 32.Scott JG, Basanta D, Anderson AR, Gerlee P. 2013. A mathematical model of tumour self-seeding reveals secondary metastatic deposits as drivers of primary tumour growth. J. R. Soc. Interface 10, 20130011 ( 10.1098/rsif.2013.0011) [DOI] [PMC free article] [PubMed] [Google Scholar]
- 33.Sottoriva A, Sloot PM, Medema JP, Vermeulen L. 2010. Exploring cancer stem cell niche directed tumor growth. Cell Cycle 9, 1472–1479. ( 10.4161/cc.9.8.11198) [DOI] [PubMed] [Google Scholar]
- 34.Sottoriva A, Verhoeff JJ, Borovski T, McWeeney SK, Naumov L, Medema JP, Sloot PMA, Vermeulen L. 2010. Cancer stem cell tumor model reveals invasive morphology and increased phenotypical heterogeneity. Cancer Res. 70, 46–56. ( 10.1158/0008-5472.CAN-09-3663) [DOI] [PubMed] [Google Scholar]
- 35.Enderling H, Hlatky L, Hahnfeldt P. 2009. Migration rules: tumours are conglomerates of self-metastases. Br. J. Cancer 100, 1917–1925. ( 10.1038/sj.bjc.6605071) [DOI] [PMC free article] [PubMed] [Google Scholar]
- 36.Enderling H, Anderson AR, Chaplain MA, Beheshti A, Hlatky L, Hahnfeldt P. 2009. Paradoxical dependencies of tumor dormancy and progression on basic cell kinetics. Cancer Res. 69, 8814–8821. ( 10.1158/0008-5472.CAN-09-2115) [DOI] [PubMed] [Google Scholar]
- 37.Hillen T, Enderling H, Hahnfeldt P. 2012. The tumor growth paradox and immune system-mediated selection for cancer stem cells. Bull. Math. Biol. 75, 161–184. ( 10.1007/s11538-012-9798-x) [DOI] [PubMed] [Google Scholar]
- 38.Enderling H, Hlatky L, Hahnfeldt P. 2010. Tumor morphological evolution: directed migration and gain and loss of the self-metastatic phenotype. Biol. Direct. 5, 23 ( 10.1186/1745-6150-5-23) [DOI] [PMC free article] [PubMed] [Google Scholar]
- 39.Weekes SL, Barker B, Bober S, Cisneros K, Cline J, Thompson A, Hlatky L, Hahnfeidt P, Enderling H. 2014. A multicompartment mathematical model of cancer stem cell-driven tumor growth dynamics. Bull. Math. Biol. ( 10.1007/s11538-014-9976-0) [DOI] [PMC free article] [PubMed] [Google Scholar]
- 40.Qutub AA, Mac Gabhann F, Karagiannis ED, Vempati P, Popel AS. 2009. Multiscale models of angiogenesis. IEEE Eng. Med. Biol. Mag. 28, 14–31. ( 10.1109/MEMB.2009.931791) [DOI] [PMC free article] [PubMed] [Google Scholar]
- 41.Chakrabarti A, Verbridge S, Stroock AD, Fischbach C, Varner JD. 2012. Multiscale models of breast cancer progression. Ann. Biomed. Eng. 40, 2488–2500. ( 10.1007/s10439-012-0655-8) [DOI] [PMC free article] [PubMed] [Google Scholar]
- 42.Norton KA, Wininger M, Bhanot G, Ganesan S, Barnard N, Shinbrot T. 2010. A 2D mechanistic model of breast ductal carcinoma in situ (DCIS) morphology and progression. J. Theor. Biol. 263, 393–406. ( 10.1016/j.jtbi.2009.11.024) [DOI] [PMC free article] [PubMed] [Google Scholar]
- 43.Mac Gabhann F, Stefanini MO, Popel AS. 2012. Simulating therapeutics using multiscale models of the VEGF receptor system in cancer. In Modeling tumor vasculature: molecular, cellular, and tissue level aspects and implications (ed. Jackson TL.), pp. 37–53. New York, NY: Springer. [Google Scholar]
- 44.Qutub AA, Liu G, Vempati P, Popel AS. 2009. Integration of angiogenesis modules at multiple scales: from molecular to tissue. Pac. Symp. Biocomput. 2009, 316–327. [PMC free article] [PubMed] [Google Scholar]
- 45.Qutub AA, Popel AS. 2009. Elongation, proliferation and migration differentiate endothelial cell phenotypes and determine capillary sprouting. BMC Syst. Biol. 3, 13 ( 10.1186/1752-0509-3-13) [DOI] [PMC free article] [PubMed] [Google Scholar]
- 46.Hatzikirou H, Chauviere A, Bauer AL, Leier A, Lewis MT, Macklin P, Marquez-Lago TT, Bearer EL, Cristini V. 2012. Integrative physical oncology. Wiley Interdiscip. Rev. Syst. Biol. Med. 4, 1–14. ( 10.1002/wsbm.158) [DOI] [PMC free article] [PubMed] [Google Scholar]
- 47.Rejniak KA, Anderson ARA. 2010. Hybrid models of tumor growth. Wiley Interdiscip. Rev. Syst. Biol. Med. 3, 115–125. ( 10.1002/wsbm.102) [DOI] [PMC free article] [PubMed] [Google Scholar]
- 48.Sanga S, Frieboes HB, Zheng X, Gatenby R, Bearer EL, Cristini V. 2007. Predictive oncology: a review of multidisciplinary, multiscale in silico modeling linking phenotype, morphology and growth. Neuroimage 37(Suppl. 1), S120–S134. ( 10.1016/j.neuroimage.2007.05.043) [DOI] [PMC free article] [PubMed] [Google Scholar]
- 49.Enderling H, Chaplain MA, Anderson AR, Vaidya JS. 2007. A mathematical model of breast cancer development, local treatment and recurrence. J. Theor Biol. 246, 245–259. ( 10.1016/j.jtbi.2006.12.010) [DOI] [PubMed] [Google Scholar]
- 50.Kim U, Shu CW, Dane KY, Daugherty PS, Wang JY, Soh HT. 2007. Selection of mammalian cells based on their cell-cycle phase using dielectrophoresis. Proc. Natl Acad. Sci. USA 104, 20 708–20 712. ( 10.1073/pnas.0708760104) [DOI] [PMC free article] [PubMed] [Google Scholar]
- 51.Korkaya H, Wicha MS. 2013. Breast cancer stem cells: we've got them surrounded. Clin. Cancer Res. 19, 511–513. ( 10.1158/1078-0432.CCR-12-3450) [DOI] [PMC free article] [PubMed] [Google Scholar]
- 52.Wicha MS. 2012. Migratory gene expression signature predicts poor patient outcome: are cancer stem cells to blame? Breast Cancer Res. 14, 114 ( 10.1186/bcr3338) [DOI] [PMC free article] [PubMed] [Google Scholar]
- 53.Gudjonsson T, Villadsen R, Nielsen HL, Ronnov-Jessen L, Bissell MJ, Petersen OW. 2002. Isolation, immortalization, and characterization of a human breast epithelial cell line with stem cell properties. Genes Dev. 16, 693–706. ( 10.1101/gad.952602) [DOI] [PMC free article] [PubMed] [Google Scholar]
- 54.Sieburg HB, Rezner BD, Muller-Sieburg CE. 2011. Predicting clonal self-renewal and extinction of hematopoietic stem cells. Proc. Natl Acad. Sci. USA 108, 4370–4375. ( 10.1073/pnas.1011414108) [DOI] [PMC free article] [PubMed] [Google Scholar]
- 55.Harmes DC, DiRenzo J. 2009. Cellular quiescence in mammary stem cells and breast tumor stem cells: got testable hypotheses? J. Mamm. Gland Biol. Neoplasia 14, 19–27. ( 10.1007/s10911-009-9111-2) [DOI] [PMC free article] [PubMed] [Google Scholar]
- 56.Stoletov K, Kato H, Zardouzian E, Kelber J, Yang J, Shattil S, Klemke R. 2010. Visualizing extravasation dynamics of metastatic tumor cells. J. Cell Sci. 123, 2332–2341. ( 10.1242/jcs.069443) [DOI] [PMC free article] [PubMed] [Google Scholar]
- 57.Huang Y, Song N, Ding Y, Yuan S, Li X, Cai H, Shi H, Luo Y. 2009. Pulmonary vascular destabilization in the premetastatic phase facilitates lung metastasis. Cancer Res. 69, 7529–7537. ( 10.1158/0008-5472.CAN-08-4382) [DOI] [PubMed] [Google Scholar]
- 58.Kuilman T, Michaloglou C, Mooi WJ, Peeper DS. 2010. The essence of senescence. Genes Dev. 24, 2463–2479. ( 10.1101/gad.1971610) [DOI] [PMC free article] [PubMed] [Google Scholar]
- 59.Lagadec C, Dekmezian C, Bauche L, Pajonk F. 2012. Oxygen levels do not determine radiation survival of breast cancer stem cells. PLoS ONE 7, e34545 ( 10.1371/journal.pone.0034545) [DOI] [PMC free article] [PubMed] [Google Scholar]
- 60.Li C, Heidt DG, Dalerba P, Burant CF, Zhang L, Adsay V, Wicha M, Clarke MF, Simeone DM. 2007. Identification of pancreatic cancer stem cells. Cancer Res. 67, 1030–1037. ( 10.1158/0008-5472.CAN-06-2030) [DOI] [PubMed] [Google Scholar]
- 61.Hsu CS, Tung CY, Yang CY, Lin CH. 2013. Response to stress in early tumor colonization modulates switching of CD133-positive and CD133-negative subpopulations in a human metastatic colon cancer cell line, SW620. PLoS ONE 8, e61133 ( 10.1371/journal.pone.0061133) [DOI] [PMC free article] [PubMed] [Google Scholar]
- 62.Todaro M, et al. 2007. Colon cancer stem cells dictate tumor growth and resist cell death by production of interleukin-4. Cell Stem Cell 1, 389–402. ( 10.1016/j.stem.2007.08.001) [DOI] [PubMed] [Google Scholar]
- 63.Buehring GC, Williams RR. 1976. Growth rates of normal and abnormal human mammary epithelia in cell culture. Cancer Res. 36, 3742–3747. [PubMed] [Google Scholar]
- 64.Friberg S, Mattson S. 1997. On the growth rates of human malignant tumors: implications for medical decision making. J. Surg. Oncol. 65, 284–297. () [DOI] [PubMed] [Google Scholar]
- 65.Skipper HE. 1971. Kinetics of mammary tumor cell growth and implications for therapy. Cancer 28, 1479–1499. () [DOI] [PubMed] [Google Scholar]
- 66.Tubiana M. 1989. Tumor cell proliferation kinetics and tumor growth rate. Acta Oncol. 28, 113–121. ( 10.3109/02841868909111193) [DOI] [PubMed] [Google Scholar]
- 67.Aktas B, Tewes M, Fehm T, Hauch S, Kimmig R, Kasimir-Bauer S. 2009. Stem cell and epithelial–mesenchymal transition markers are frequently overexpressed in circulating tumor cells of metastatic breast cancer patients. Breast Cancer Res. 11, R46 ( 10.1186/bcr2333) [DOI] [PMC free article] [PubMed] [Google Scholar]
- 68.Mani SA, et al. 2008. The epithelial–mesenchymal transition generates cells with properties of stem cells. Cell 133, 704–715. ( 10.1016/j.cell.2008.03.027) [DOI] [PMC free article] [PubMed] [Google Scholar]
- 69.Monteiro J, Fodde R. 2010. Cancer stemness and metastasis: therapeutic consequences and perspectives. Eur. J. Cancer 46, 1198–1203. ( 10.1016/j.ejca.2010.02.030) [DOI] [PubMed] [Google Scholar]
- 70.Morel AP, Lievre M, Thomas C, Hinkal G, Ansieau S, Puisieux A. 2008. Generation of breast cancer stem cells through epithelial–mesenchymal transition. PLoS ONE 3, e2888 ( 10.1371/journal.pone.0002888) [DOI] [PMC free article] [PubMed] [Google Scholar]
- 71.Turner C, Kohandel M. 2010. Investigating the link between epithelial–mesenchymal transition and the cancer stem cell phenotype: a mathematical approach. J. Theor. Biol. 265, 329–335. ( 10.1016/j.jtbi.2010.05.024) [DOI] [PubMed] [Google Scholar]
- 72.Norton L. 2005. Conceptual and practical implications of breast tissue geometry: toward a more effective, less toxic therapy. Oncologist 10, 370–381. ( 10.1634/theoncologist.10-6-370) [DOI] [PubMed] [Google Scholar]
- 73.Norton L, Simon R, Brereton HD, Bogden AE. 1976. Predicting the course of Gompertzian growth. Nature 264, 542–545. ( 10.1038/264542a0) [DOI] [PubMed] [Google Scholar]
- 74.Norton L. 1988. A Gompertzian model of human breast cancer growth. Cancer Res. 48, 7067–7071. [PubMed] [Google Scholar]
- 75.Rodriguez-Brenes IA, Wodarz D, Komarova NL. 2013. Stem cell control, oscillations, and tissue regeneration in spatial and non-spatial models. Front. Oncol. 3, 82 ( 10.3389/fonc.2013.00082) [DOI] [PMC free article] [PubMed] [Google Scholar]
- 76.Cheung KJ, Gabrielson E, Werb Z, Ewald AJ. 2013. Collective invasion in breast cancer requires a conserved basal epithelial program. Cell 155, 1639–1651. ( 10.1016/j.cell.2013.11.029) [DOI] [PMC free article] [PubMed] [Google Scholar]
- 77.Debnath J, Brugge JS. 2005. Modelling glandular epithelial cancers in three-dimensional cultures. Nat. Rev. Cancer 5, 675–688. ( 10.1038/nrc1695) [DOI] [PubMed] [Google Scholar]
- 78.Jaffer S, Bleiweiss IJ. 2002. Histologic classification of ductal carcinoma in situ. Microsc. Res. Tech. 59, 92–101. ( 10.1002/jemt.10180) [DOI] [PubMed] [Google Scholar]
- 79.Anderson AR, Quaranta V. 2008. Integrative mathematical oncology. Nat. Rev. Cancer 8, 227–234. ( 10.1038/nrc2329) [DOI] [PubMed] [Google Scholar]
- 80.Tanei T, Morimoto K, Shimazu K, Kim SJ, Tanji Y, Taguchi T, Tamaki Y, Noguchi S. 2009. Association of breast cancer stem cells identified by aldehyde dehydrogenase 1 expression with resistance to sequential paclitaxel and epirubicin-based chemotherapy for breast cancers. Clin. Cancer Res. 15, 4234–4241. ( 10.1158/1078-0432.CCR-08-1479) [DOI] [PubMed] [Google Scholar]
- 81.Gottschalk A, Sharma S, Ford J, Durieux ME, Tiouririne M. 2010. Review article: the role of the perioperative period in recurrence after cancer surgery. Anesth. Analg. 110, 1636–1643. ( 10.1213/ANE.0b013e3181de0ab6) [DOI] [PubMed] [Google Scholar]
- 82.Bhise NS, Shmueli RB, Sunshine JC, Tzeng SY, Green JJ. 2011. Drug delivery strategies for therapeutic angiogenesis and antiangiogenesis. Expert Opin. Drug Deliv. 8, 485–504. ( 10.1517/17425247.2011.558082) [DOI] [PMC free article] [PubMed] [Google Scholar]
- 83.Liu S, Korkaya H, Wicha MS. 2012. Are cancer stem cells ready for prime time? The Scientist 26, 33–37. [Google Scholar]
- 84.Poleszczuk J, Hahnfeldt P, Enderling H. 2014. Biphasic modulation of cancer stem cell-driven solid tumour dynamics in response to reactivated replicative senescence. Cell Prolif. 47, 267–276. ( 10.1111/cpr.12101) [DOI] [PMC free article] [PubMed] [Google Scholar]
- 85.Tang Y, Wang Y, Chen L, Pan Y, Weintraub N. 2012. Cross talk between the Notch signaling and noncoding RNA on the fate of stem cells. Prog. Mol. Biol. Transl. Sci. 111, 175–193. ( 10.1016/B978-0-12-398459-3.00008-3) [DOI] [PubMed] [Google Scholar]
- 86.Hanahan D, Weinberg RA. 2011. Hallmarks of cancer: the next generation. Cell 144, 646–674. ( 10.1016/j.cell.2011.02.013) [DOI] [PubMed] [Google Scholar]
- 87.Greenberg RA, et al. 1999. Telomerase reverse transcriptase gene is a direct target of c-Myc but is not functionally equivalent in cellular transformation. Oncogene 18, 1219–1226. ( 10.1038/sj.onc.1202669) [DOI] [PubMed] [Google Scholar]
- 88.Gupta PB, Onder TT, Jiang G, Tao K, Kuperwasser C, Weinberg RA, Lander ES. 2009. Identification of selective inhibitors of cancer stem cells by high-throughput screening. Cell 138, 645–659. ( 10.1016/j.cell.2009.06.034) [DOI] [PMC free article] [PubMed] [Google Scholar]
- 89.Enderling H, Hlatky L, Hahnfeldt P. 2013. Cancer stem cells: a minor cancer subpopulation that redefines global cancer features. Front. Oncol. 3, 76 ( 10.3389/fonc.2013.00076) [DOI] [PMC free article] [PubMed] [Google Scholar]
- 90.Rodriguez-Brenes IA, Komarova NL, Wodarz D. 2011. Evolutionary dynamics of feedback escape and the development of stem-cell-driven cancers. Proc. Natl Acad. Sci. USA 108, 18 983–18 988. ( 10.1073/pnas.1107621108) [DOI] [PMC free article] [PubMed] [Google Scholar]
Associated Data
This section collects any data citations, data availability statements, or supplementary materials included in this article.


