

Abstract
Identification of three-dimensional (3D) interactions between regulatory elements across the genome is crucial to unravel the complex regulatory machinery that orchestrates proliferation and differentiation of cells. ChIA-PET is a novel method to identify such interactions, where physical contacts between regions bound by a specific protein are quantified using next-generation sequencing. However, determining the significance of the observed interaction frequencies in such datasets is challenging, and few methods have been proposed. Despite the fact that regions that are close in linear genomic distance have a much higher tendency to interact by chance, no methods to date are capable of taking such dependency into account. Here, we propose a statistical model taking into account the genomic distance relationship, as well as the general propensity of anchors to be involved in contacts overall. Using both real and simulated data, we show that the previously proposed statistical test, based on Fisher's exact test, leads to invalid results when data are dependent on genomic distance. We also evaluate our method on previously validated cell-line specific and constitutive 3D interactions, and show that relevant interactions are significant, while avoiding over-estimating the significance of short nearby interactions.
INTRODUCTION
Physical three-dimensional (3D) interactions between genomic elements are vital for the functioning of the regulatory machinery in living cells (1). For example, interactions between distal regulatory elements and their targets are known to be responsible for regulating a range of genes with cell-type specific functions (2–7). With large consortia such as ENCODE (8) and Roadmap epigenomics (9), regulatory elements in a range of different cell types and tissues are being mapped. Linking these elements together by identification of their 3D interactions is vital for obtaining a deeper understanding of the regulatory mechanisms underlying the different cell types.
Identification of genome-wide 3D interactions has recently become feasible, due to the coupling of chromatin conformation capture (3C) techniques to next-generation sequencing (10). One such technique, called chromatin interaction analysis with paired-end tag sequencing (ChIA-PET), is especially suited for identifying high-resolution interactions between regulatory elements, since it allows for identification of genome-wide interactions between elements bound by a protein of choice (5). In ChIA-PET, chromatin interactions are captured by cross-linking with formaldehyde prior to ChIP-enrichment. Proximity-ligation is then used to connect interacting DNA fragments, and paired-end sequencing is used for quantification (11,12). The method gives rise to both self-ligation and inter-ligation events. The self-ligation events, which are caused by non-specific interactions within the same fragment, can be used to identify the regions that are involved in the interactions (called ‘anchors’). The inter-ligation events are subsequently used to quantify the interaction frequencies between the anchors (13,14).
Since such analyses are based on detection of 3D interactions in a population of cells, and due to the probabilistic nature of the quantification using paired-end sequencing, detecting the significant interactions between the anchors in a given ChIA-PET dataset can be challenging, and few models have been proposed. In a recent article, Li et al. (13) proposed to use Fisher's exact test to identify interactions. This test is based on a model where interactions are assumed to follow a hypergeometric distribution. More precisely, the following model is assumed for the interactions:
 |
(1) |
Here, nij refers to the number of interactions between anchors i and j, and ni = ∑j nij is the number of interactions involved for anchor i (and similar for nj). With this formulation, the number of interactions are conditioned on the marginal sums (ni and nj) and the total number of interactions (n). This conditioning is used in order to take into account the fact that highly interacting anchors (with high marginal sums) have a higher probability of obtaining interactions. Note the 2n factor which is introduced because the n contacts have a total of 2n end-points. The underlying assumption is therefore that contacts can be defined by any pair of end-points, including the same end-point selected twice. Note that the latter assumption is typically not valid for ChIA-PET data, since interactions within anchors are only used to define anchors, and not for identification of interactions themselves. This, however, will not be crucial if ni and nj ≪ n, which will be the case in most real datasets.
Another fundamentally different approach to interaction identification has also been proposed, representing inter-ligations in a 2D space (genome × genome), and using clustering detection to find interactions (15). In that paper, the authors used a density-based clustering algorithm, called DBSCAN (Density-based spatial clustering of applications with noise), to infer true interactions above the noise level. This method is non-statistical in nature, as it does not assume a model for the interaction frequencies.
Anchors that are closer in the linear genomic sequence have a much higher probability of forming interactions (10). This fundamental property is not incorporated into any of the proposed methods, even though it has been shown to be important to do so for other 3C-based technologies (16,17). For example, in Hi-C (18), a technique related to ChIA-PET, where interactions are mapped between restriction fragments covering the entire genome, a slightly different strategy for inference of significant interactions is taken. In Hi-C analysis, the number of interactions between restriction fragments is modeled based on the binomial distribution, and the genomic distance dependency is incorporated by using a binning approach where tests for significance are performed separately for different bins of genomic distance (19). Such a model does not incorporate the propensity of the fragments to be involved in contacts overall. However, it has recently been noted that technical biases in the Hi-C method can cause a varying degree of ‘visibility’ for the involved restriction fragments (20,21). In a recent study by Ay et al. (22), the authors therefore suggested to incorporate such biases into the binomial model, in addition to genomic distance. To do so, they replaced the binning approach by using a smoothing spline of contact probabilities, and incorporated the biases for the involved regions into a joint model of contact probability. This was then used to perform a binomial test, similar to the previous methods.
Here, we propose a new statistical model for ChIA-PET interaction frequency data, taking into account genomic distance-dependent relationships, as well as the marginal sums. Our model is based on the non-central hypergeometric (NCHG) distribution, and can be seen as a generalization of the model proposed in Li et al. (13), but where the genomic distances between anchors are included.
MATERIALS AND METHODS
Statistical model
We start off with the same model as presented in Li et al. (13), and consider the number of ChIA-PET interactions nij between anchor regions i and j. Each interaction is between two end-points, where ni = ∑j nij is the number of interaction end-points in anchor region i. The total number of interaction end-points is 2n = ∑i ni, where n = ∑i < j nij is the number of interactions. The aim of the model is to determine the probability of having nij interactions between anchor regions i and j given the number of interaction end-points, ni and nj, in each anchor, and the total number of interactions.
When interactions are equally likely between any pair of end-points from two different anchor regions, Li et al. (13) argues that Fisher's exact test, which uses the hypergeometric distribution, gives a good statistical model for the number of interactions nij. However, when some anchor regions are more likely to form interactions than others, the model by Li et al. (13) must be modified. If interactions between interaction end-points in anchor regions i and j are more likely by a factor ωij to interact with each other than to form interactions with other anchor regions, the hypergeometric distribution is replaced by the NCHG distribution:
 |
(2) |
The probabilities for each outcome nij gets multiplied by  , and the normalization constant in the denominator is changed accordingly.
Taking genomic distance into account
We know that regions close together along the genomic sequence have a higher chance of forming random contacts (10,18), therefore it is necessary to incorporate the expected interaction frequency of various sequence-based distances into the model as well. We let λij be the expected interaction frequency between anchor regions i and j, which we estimate based on the genomic distance between i and j.
We did this by dividing genomic distances between all pairs of anchors (also those with no interactions) into 1000 quantiles and computed the mean interaction frequency in each quantile. We then smoothed the resulting distribution using a cubic smoothing spline. This function was then used to compute the expected number of interactions, λij, for all pairs of anchors.
When λij is the expected number of interactions between i and j, the expected number of interaction end-points in anchor region i becomes λi = ∑j λij, while the expected number of interactions is λ = ∑i < j λij. The non-centering coefficients, ωij, can then be estimated using the odds ratio of the expectations (23):
 |
(3) |
Note that the final NCHG distribution will still be conditional on the number of interactions, n, as well as on the marginal sums ni and nj, and so it is only this odds ratio between these expected values that influence the distribution, not the size of the individual values.
Hypothesis testing
In order to test if the number nij of contacts between anchor regions i and j were higher than expected by chance, we assumed it would follow a NCHG distribution P(nij|n, ni, nj, ωij) with ωij as given by Equation (3) if genomic distance is taken into account, or Fisher's exact test using ωij = 1 if we assume interaction frequencies are independent of genomic distance. One-sided P-values were then computed as
 |
(4) |
Since the pairs of anchors used to estimate the expected number of interactions (λij) consist of a subset of interactions that is not part of the null-model, estimation of significance based on λij would be too conservative. Similar to the method proposed by Ay et al. (22), we performed an initial round of hypothesis testing on all interactions using a strict selection criterion at 1% false discovery rate (FDR) and requiring at least three observed interactions. We then masked out all the significant interactions, and performed a second round of estimation of λij, leaving the masked values out. This ‘refined’ model of the genomic distance relationship was then subsequently used for all downstream analyses.
We then calculated the final P-values for all pairs of anchors, and considered significant interactions selected at 5% FDR with at least three observed interactions, as in Li et al. (12).
We estimated the FDR using the discrete FDR procedure (24). In this, for each threshold α, we computed the expected number of false positives under the null models, i.e. the expected number of pairs of anchors with at least three interactions and P ≤ α. This was then divided by the actual number of positive findings under the same criterion to provide an estimate of the FDR.
Simulation analysis and validity
In order to explore the validity of our model, and compare it to Fisher's exact test, we simulated datasets consisting of randomly sampled interaction frequencies between 200 ‘anchors’, according to a Poisson model. More precisely, we simulate nij ∼ Pois(λij) with expectation λij = a/(1 + δ), where δ = |i − j|, for various choices of a, between all pairs of the 200 ‘anchors’. This gave 19 900 interaction frequencies (excluding the diagonal) with strong dependency on the genomic distance, approximately proportional to 1/δ as is expected from chromatin interaction data (18).
Similarly, we sampled data with other types of genomic distance relationships, including data proportional to δ−3/2, linearly proportional, and data sampled with a relationship as observed in the K562 cell line. For comparison purposes, we additionally generated data without dependency of genomic distance, by sampling with expectation fixed at λij = 50. Note, however, that the exact shape of the expression for λij is not important for the analysis presented here, only the strength of the dependency on genomic distance.
In order to evaluate both methods, we computed P-values using both Fisher's exact test and the NCHG test, and examined the distribution of P-values for the 19 900 samples. For presentation purposes, to avoid clustering of P-values caused by the discrete number of possible values for nij (see Supplementary Figure S1), and ensure P-values that are uniform on [0, 1] under the null-hypothesis, we selected random  (in Figure 1) (25). The resulting 19 900 P-values were then plotted in a histogram.
Figure 1.
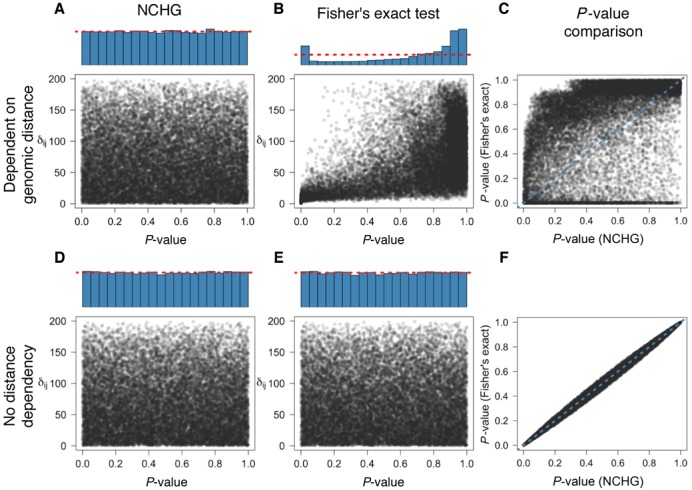
Comparison of Fisher's exact test and the NCHG test using simulated data. P-values are plotted against the genomic distance (δij), defined as the number of anchors between i and j. Blue histograms indicate the distribution of P-values, calculated as explained in the ‘Materials and Methods’ section. (A) P-values obtained using the NCHG test on data sampled with strong dependency on genomic distance. (B) P-values obtained using Fisher's exact test with strong dependency on genomic distance. (C) Comparison between P-values from the NCHG test and Fisher's exact test, for data sampled with strong dependency on genomic distance (Pearson's r ∼ 0.49). (D) P-values obtained using the NCHG test on data sampled without any dependency on genomic distance. (E) P-values obtained using Fisher's exact test on data sampled without any dependency on genomic distance. (F) Comparison between P-values from the NCHG test and Fisher's exact test, for data sampled without any dependency on genomic distance (Pearson's r ∼ 0.99). Red dashed lines indicate the expected fraction for a uniform distribution of P-values.
Practical implementation
We obtained ChIA-PET data for the K562 and Mcf7 cell lines from Li et al. (12) (GEO accession number: GSE33664). We considered self-ligations as all pairs of mapped loci with genomic distance <8 kb, as suggested in Zhang et al. (26). Based on the self-ligations, we identified anchors using MACS (27). To avoid small anchors with very short distance between them, all pairs of anchors closer than 1 kb were combined, and individual anchors with a size <1 kb were expanded 1 kb in each direction. We then counted and aggregated all inter-ligation paired-end tags between all anchors within the same chromosome. The implemented method is available at http://folk.uio.no/jonaspau/chiasig/.
RESULTS
Results on simulated data
We simulated data both from a Poisson model dependent on the genomic distance, and from a model with no such dependency. In order to evaluate the validity of both the NCHG test and Fisher's exact test, we plotted the P-values against the genomic distance, and computed a histogram of the P-values (see Figure 1). For valid hypothesis tests, a uniform distribution of P-values is expected regardless of the dependency on the genomic distance, as long as the data are sampled from the null-distribution. As Figure 1 shows, both Fisher's exact test and the NCHG test produce uniformly distributed P-values when interactions do not depend on genomic distance. However, when interactions are sampled such that they are dependent on genomic distance, only the NCHG test produces uniformly distributed P-values which are independent of the genomic distance. The Fisher's exact test on the other hand shows a skewed distribution, with extremal P-values. As the figure shows, the skewness is caused by the points with low and high genomic distances, which is easily understood by considering the fact that the data with low and high genomic distances will have unexpectedly high (and low respectively) counts. It is therefore not sufficient to condition on only the marginal sums when the data are dependent on the genomic distance, as is the case for chromatin capture-data, such as ChIA-PET. It is also interesting to compare the individual P-values from the two models. As Figure 1C shows, the two models give very different P-values for the case where data are dependent on genomic distance. In the non-dependent case, however, the P-values are identical, except for the uniformly added smoothing to avoid P-value clustering (see the ‘Materials and Methods’ section).
We also wanted to investigate whether the choice of the genomic distance relationship could affect the results as shown in Figure 1. We therefore sampled data from distributions with several different genomic distance dependencies, and investigated the distribution of P-values. Again, the results show that the NCHG test gives uniformly distributed P-values, while Fisher's exact test shows a skewed distribution with an enrichment of low and high P-values (see Supplementary Figure S2). In Supplementary Figure S3, we show examples of sampled data for the different choices of genomic distance dependencies.
Results on publicly available data
Next, we evaluated the method on ChIA-PET data from two cell lines, K562 and Mcf7 from Li et al. (12) (GEO accession number: GSE33664). We started by estimating the expected interaction frequencies given the genomic distance (λij) and observed the strong negative relationship which is expected from having a higher occurrence of random interactions between anchors at shorter lengths (see Figure 2). As the figure shows, the negative relationship remains also after refinement of the data by masking out interacting anchor pairs that are not part of the null-model. To investigate the effect of the refinement, we plotted the relative frequency of significant interactions for various groups of genomic distances, before and after refinement. As is shown in Supplementary Figure S4, refinement increases the number of significant interactions for short genomic distances (typically below ∼100 kb), and decreases the number of significant interactions for long genomic distances. This is expected, since many of the highly significant (non-null) interactions that are masked out during refinement, are of short genomic distance.
Figure 2.
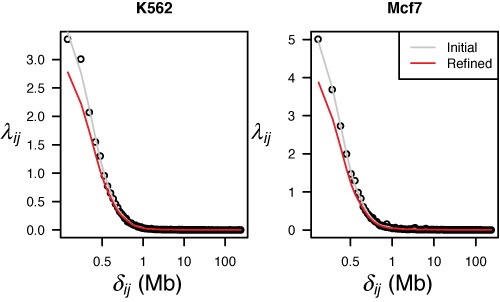
Dependency on genomic distance for the initial (gray) and the refined (red) interactions. Genomic distance (δij), defined as the distance between pairs of anchors, plotted against the observed average number of interactions. The gray line shows the result after cubic spline smoothing on the original, non-refined dataset. The red line shows the smoothed dependency for the refined dataset, which gives the expected interaction frequencies (λij), as explained in the ‘Materials and Methods’ section. Results for K562 (left) and Mcf7 (right) are shown.
We also investigated the effect of using a different number of quantiles during the estimation of the λij parameter, and found that the smoothed estimate is very robust to this choice (see Supplementary Figures S5 and S6).
We next compared the significant interactions for Fisher's exact test and the NCHG test. As Figure 3 shows, a large fraction of the significant interactions found using Fisher's exact test are not significant when using the NCHG test. Specifically, as many as 20 248 and 23 459 significant interactions are unique for Fisher's exact test, for K562 and Mcf7, respectively. As Figure 3 also shows, a large fraction of the significant interactions found using the NCHG test is also found using Fisher's exact test, but the total number of significant interactions is much lower for the NCHG test. This shows that the model based on the NCHG distribution, that also takes into account the genomic distance, is much more conservative than Fisher's exact test.
Figure 3.
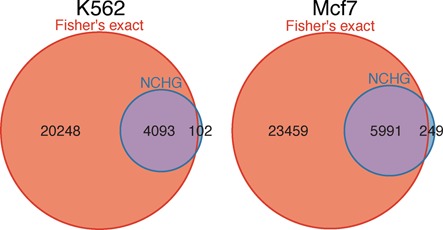
Venn-diagram comparisons of significant interactions from the NCHG test and Fisher's exact test. Blue circles indicate the significant interactions using the NCHG test, while red circles indicate significant interactions using Fisher's exact test. Numbers indicate the number of significant interactions within each subset. Results for K562 (left) and Mcf7 (right) are shown.
In order to gain further insight into what causes the large difference in significant interactions between Fisher's exact test and the NCHG test, we plotted the relative frequencies of the genomic distances for the significant interactions resulting from both models (see Figure 4). As the figure shows, a larger proportion of significant interactions are found for the lowest genomic distances for Fisher's exact test, compared to the NCHG test. This is as expected when considering the results from Figure 1B, where the shortest genomic distances have too low P-values. The reason for this is most likely the much higher expected interaction frequencies for contacts of these genomic distances, as seen in Figure 2. In addition, for the largest genomic distances (≥800 kb), Fisher's exact test has a lower fraction of significant interactions compared to the NCHG test. Again, the reason for this is most likely that the expected low number of interactions for the larger genomic distances are not taken into account for Fisher's exact test. For both methods, a large fraction of the significant interactions are found for the shortest genomic distances (<200 kb). This is expected, considering that most regulatory and functional interactions are found within this range (28).
Figure 4.
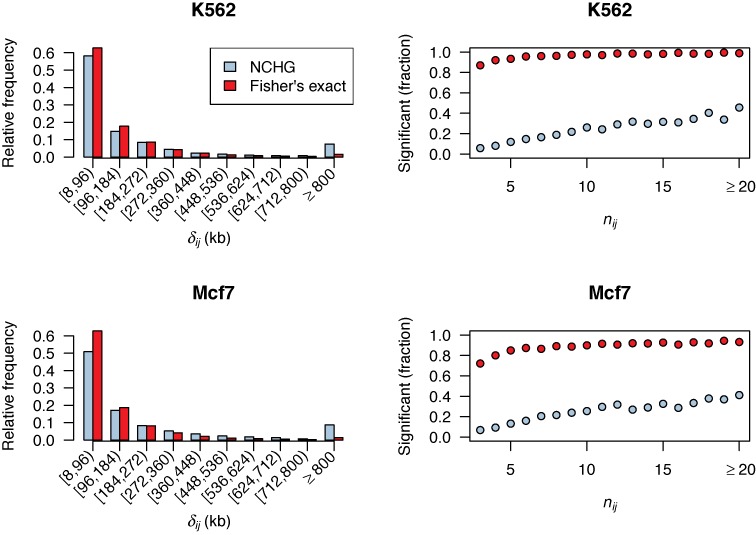
Left: bar-plots showing the relative frequencies of genomic distances (δij) for the significant interactions using Fisher's exact test (red bars) and the NCHG test (blue bars), divided into 10 groups of genomic distances. Right: fraction of significant interactions, relative to all possible interactions, plotted against the number of observed interactions nij. Red circles indicate results using Fisher's exact test, while blue circles indicate results using the NCHG test. Results for K562 (top panels) and Mcf7 (bottom panels) are shown.
We investigated the interactions that are found to be significant using the NCHG test, but not significant using Fisher's exact test (102 for K562 and 249 for Mcf7, as shown in Figure 3). As is expected, these interactions are typically occurring at very long genomic distances, with median genomic distance ∼9 and ∼10 Mb, for K562 and Mcf7, respectively.
We also plotted the fraction of significant interactions compared to all possible interactions, as a function of the number of observed interactions (Figure 4). As the figure shows, Fisher's exact test assigns statistical significance to almost all interactions above the cutoff of at least three interactions. Consequently, for Fisher's exact test, this cutoff seems to be the major factor for determining significance of interactions. This can be explained by considering that it is much more likely that pairs of anchors with three or more interactions are of short genomic distance. Therefore, Fisher's exact test is expected to not be conservative enough, since genomic distance is not taken into account. This explains why so many significant interactions are unique for Fisher's exact test (as seen in Figure 3). The NCHG test, on the other hand, shows a fraction of significant interactions which gradually increases for increasing number of interactions, as is expected, since a higher number of interactions typically gives more significant results. Again, since a large fraction of the anchor pairs with three or more interactions will have a short genomic distance, we expect that the NCHG test will be more conservative.
We were interested in investigating the effect of not using a cutoff on the number of interactions, typically selected at nij ≥ 3. We therefore applied both Fisher's exact test and the NCHG test without using this cutoff, and re-estimated the FDR under this criterion. As shown in Supplementary Figure S7, this resulted in an increased number of significant interactions for Fisher's exact test, while the NCHG test got fewer significant interactions. The reason for the reduced number of significant interactions for the NCHG test is the fact that the large number of interactions with long genomic distances and small nij cause the FDR method to be very conservative. To investigate this, we repeated the calculations on interactions with genomic distances ≤1 Mb, a more realistic size-range where interactions are expected to be more functionally relevant. In this analysis, we found that the NCHG test identified a similar number of significant interactions as found using the original cutoff of nij ≥ 3. Fisher's exact test, on the other hand, identifies more than 60 000 significant interactions, in both cell lines, when a cutoff is not used (see Supplementary Figure S8).
As Supplementary Table S1 shows, few of the significant interactions are actually found to have nij < 3. For the NCHG test, we also find that the significant interactions with low number of observed interactions (nij < 3) have high genomic distances. In other words, a low number of observed interactions is only significant (using the NCHG test) if the interactions have very high genomic distances, since such interactions are less likely to occur by chance. Naturally, no such trend is seen when using Fisher's exact test. However, for the tests focusing on interactions ≤1 Mb, the trend is different. Here, Fisher's exact test actually identifies a large fraction of interactions as significant, even for nij < 3. The NCHG test, on the other hand, identifies few significant interactions with nij < 3, and as Supplementary Table S2 shows, these interactions tend to have long genomic distance.
Comparison with ENCODE 5C data
We also compared the significant interactions from the NCHG test and Fisher's exact test with 3C-Carbon Copy (5C) data mapped as part of the ENCODE project across 1% of the genome (16). We focused on region ENm008 on the p13.3 arm of chromosome 16, containing the α-globin genes, known to be highly expressed in K562 and which serves as a model system for regulatory interactions in this cell line. Interestingly, the cell-type specific expression of the α-globin genes in this region has been shown to be regulated by physical interactions with distal DNase I-hypersensitive sites (HSs) found inside the NPRL3 gene upstream of the α-globin locus (29). In particular, the HS40 site is widely recognized as a major regulatory element in the regulation of α-globin expression (30), and binds many erythroid transcription factors. As shown in Figure 5, this site is indeed found to be interacting with the α-globin gene locus, and is clearly significant using the NCHG test (P-value: 9.03E−5). Interestingly, an interaction with an even more upstream site called HS55 is also found (P-value: 1.0E−3), which is reported in the ENCODE dataset also, but has not been specifically discussed before. This site is a constitutive DNase I-HS, which also binds CTCF (31) which is often involved in long-range interactions (32).
Figure 5.
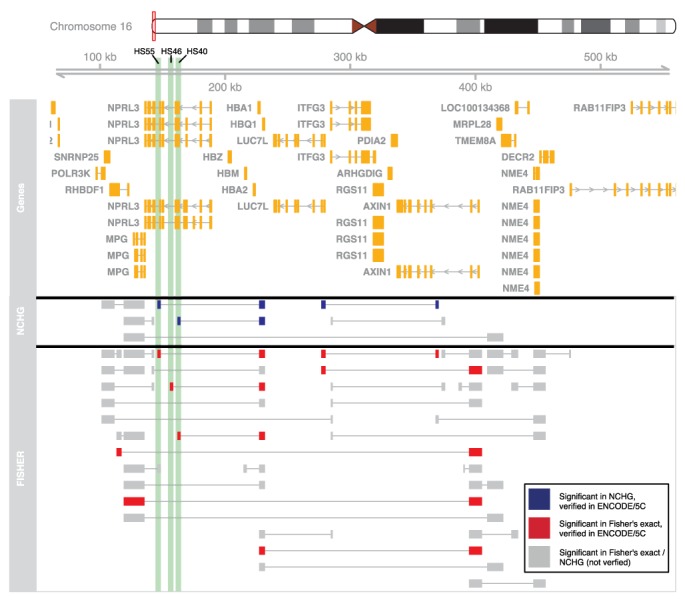
Significant interactions involving the α-globin cluster for the K562 cell line. Chromosomal position is indicated on the top, with annotated genes shown in orange. Significant interactions from the NCHG test and Fisher's exact test are shown as connected segments. Significant interactions colored blue and red, for the NCHG test and Fisher's exact test, respectively, are verified using 5C data from Sanyal et al. (16). Gray segments indicate interactions that were not found in the 5C dataset. The position of three hypersensitivity sites (HS55, HS46 and HS40) found inside the NPRL3 gene are indicated using green shading.
While Fisher's exact test also finds the HS interactions validated by the 5C method in this region (P-values: 9.94E−14 and 1.71E−10, for HS40 and HS55, respectively), a large number of other interactions are also found (see Figure 5). As the figure shows, a total of 36 interactions are found in this region using Fisher's exact test, only 8 of which (∼22%) are validated by the 5C data. As the figure also shows, several of these non-confirmed interactions are short-range, as expected when genomic distance is not taken into account. The NCHG test on the other hand, finds seven significant interactions, three of which (∼43%) are confirmed by the 5C data. This again indicates that Fisher's exact test is not conservative enough, since it will report many short-range genomic interactions as significant only due to their close genomic proximity.
In addition, an interaction between the LUC7L and AXIN1 genes is identified as significant, both for Fisher's exact test (P-value: 3.64E−8) and the NCHG test (P-value: 5.1E−4). This interaction has also been previously identified (29). As expected, α-globin is not found to form interactions with the HSs in the Mcf7 cell line.
The same results are found when the analysis is performed without a cutoff of at least three observed interactions. However, in this analysis, Fisher's exact test actually identifies an even larger number of non-confirmed significant interactions (see Supplementary Figure S9).
We observed that two of the 5C-confirmed interactions involving the promoter region of the AXIN1 gene, that are found to be significant using Fisher's exact test, also have low P-values using the NCHG test (8.36E−3 and 8.16E−3). However, after multiple testing correction at 5% FDR these are no longer significant. Allowing for an FDR of 10%, however, these two interactions become significant. Using an FDR of 10% for Fisher's exact test on the other hand, still only identifies the eight confirmed interactions previously discussed (see Supplementary Figure S10).
Interactions involving the β-globin region on the p15.4 region of chromosome 11 have also been studied extensively (33). In this region, several HS regions upstream of the HBE1 gene make up a locus control region (LCR), where the different HS regions control different developmental stages of the expression of the globin genes (34). Using the NCHG test, we find in total seven interactions in this region, one of which has been previously reported in the ENCODE dataset (16) (P-values: 3.57E−6 and 3.04E−21, for NCHG and Fisher's exact test, respectively). For Fisher's exact test, we find 11 interactions, with 2 previously reported interactions in the same dataset (see Supplementary Figure S11). The identified interactions are with the γ-globin genes, which are known to be expressed in the K562 cell line.
Comparison with 3C data
In Li et al. (12), where the ChIA-PET data for the K562 and Mcf7 cell lines are derived from, interactions for several regions have been validated using 3C. In this section, we use some of these validated regions to compare Fisher's exact test and the NCHG test.
The GREB1 gene has been shown to be highly expressed in Mcf7 cells, and is regulated by estrogen levels (35). This regulation is controlled by a large upstream enhancer element where estrogen receptor alpha binds and makes physical interactions with the GREB1 promoter (36). Interestingly, we also observe the presence of a significant interaction between this upstream enhancer and the GREB1-gene, using the NCHG test (P-value: 6.93E−30) and Fisher's exact test (P-value: <1.0E-50), as shown in Figure 6. However, Fisher's exact test identifies 20 other interactions involving this region, none of which has previously been reported and verified. As can be seen from the plot, the identified interactions all have a genomic distance in the range (∼10–160 kb), which is within the size range where Fisher's exact test seems to be not conservative enough.
Figure 6.
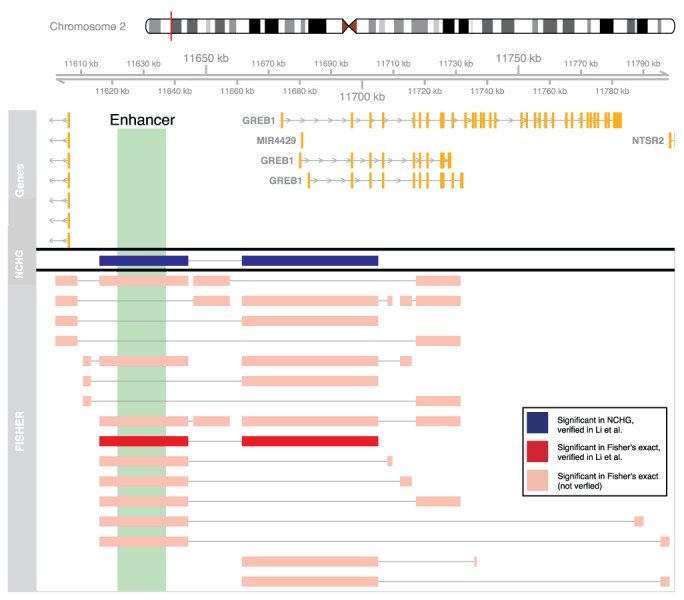
Significant interactions involving the GREB1 gene for the Mcf7 cell line. Significant interactions are shown as connected segments. Segments colored dark red and dark blue are verified (using 3C) in Li et al. (12). Interactions between pink segments indicate interactions found using Fisher's exact test that have not been verified previously.
Interactions between the SYNCRIP gene and an upstream snoRNA locus, active in multiple cell lines, have also previously been noted (12). We again identified a single interaction between these two regions in both K562 and Mcf7 using the NCHG test (P-values: 1.39E−34 and 4.59E−17, respectively). While this interaction is also identified using Fisher's exact test (P-value: <1.0E-50 in both cell lines), a range of other unconfirmed nearby interactions are identified as well (see Supplementary Figures S12 and S13).
Regulation of RUNX1 via cell-type specific looping
We were interested in exploring the significance of interactions around the RUNX1 gene, known to be of major importance for regulation of hematopoiesis (37). RUNX1 is known to be tightly regulated via looping interactions of nearby enhancer elements (38). For example, looping interactions involving two promoter and two enhancer sites have been characterized in K562 using 3C (39). We inspected the significant interactions in this region, and found several of the interactions reported in Markova et al. (39) (see Supplementary Figure S14). The NCHG test identifies 6 interactions, 2 of which were reported in that paper, while Fisher's exact test identifies 21 interactions, 3 of which were reported in the paper. Interestingly, by inspecting the same region in the Mcf7 cell line, we observed a very different interaction pattern. Particularly, instead of interactions between the promoter regions and downstream enhancers as seen in K562, interactions seem to form at upstream enhancer elements (see Supplementary Figure S15). Interestingly, one of these enhancer elements are found inside the LINC00160 long non-coding RNA (lncRNA) (P-value: 8.1E−4). Similarly, the Fisher's exact test also identifies this interaction (P-value: 3.68E−13). By inspecting chromatin states within this lncRNA mapped in Ernst et al. (40), cell-type specific enhancer activity is found for the cell lines HMEC, HSMM and NHEK (see Supplementary Figure S16). The chromatin state activity of the HMEC cell line is likely to closely resemble the Mcf7 cell line, as both are derived from mammary epithelium. Cell-type specific activity of lncRNA enhancer elements have been speculated to mediate their function via long-range looping (41). Our findings for the cell-type specific regulation of RUNX1 indeed provide evidence for this model.
DISCUSSION
We have developed a statistical test for detection of significant interactions between genomic elements in ChIA-PET datasets, applying the NCHG distribution. Unlike previous methods, our statistical model incorporates genomic distance in addition to marginal sums, in order to avoid over-estimating the significance of short interactions. Using data simulated from Poisson models that depend on genomic distance, we show that the Fisher's exact test commonly used for these types of analyses gives drastically skewed P-value distributions, indicating that not taking genomic distance into account can lead to invalid results. Using two publicly available ChIA-PET datasets, we show that the NCHG test assigns statistical significance to interactions that have been independently validated using 3C and 5C, without over-estimating the significance of other, nearby interactions. Fisher's exact test on the other hand is found to assign statistical significance to a large number of interactions, especially with short genomic distances. This is explained by the fact that Fisher's exact test does not incorporate genomic distance into the model.
The need for taking genomic distance into account is clearly demonstrated in Figure 2. The strongest dependency of genomic distance on interaction frequency is seen below 1 Mb, which is within the size range where most regulatory interactions are formed (28). Consequentially, the interactions with low genomic distances almost always come out as significant, using Fisher's exact test. Additionally, the fact that genomic distance is always considered when analyzing 5C and Hi-C data (16,17), indicates the strong necessity to do so for ChIA-PET data as well.
In this paper, we used a cutoff of at least three observed interactions between anchor pairs in addition to a FDR ≤5%. These settings were selected based on the settings in previous papers using Fisher's exact test (13,12), to be able to compare the two methods appropriately. We have shown here that the cutoff of at least three interactions is the major factor determining significance when using Fisher's exact test (see Figure 4). Because most interactions above this threshold will be interactions between anchors separated by short genomic distances, Fisher's exact test is expected to over-estimate the confidence of such interactions. Using the NCHG test on the other hand, genomic distance is handled appropriately. For this reason, the cutoff on the number of interactions can possibly be removed when using the NCHG test, since very few interactions with nij < 3 actually become significant. However, it is important to note that considering both the number of observed interactions and the statistical significance can be important for determining biologically relevant interactions.
We also note that while we focused on intrachromosomal interactions in this study, the method can also be used for interchromosomal interactions. In that case, the λij parameter needs to be estimated for interchromosomal contacts separately.
Due to the lack of large datasets with validated regulatory 3D interactions, evaluating and comparing statistical models of such data, is challenging. It is also important to note that many of the validated interactions, such as the ENCODE 5C interactions, have themselves been identified using statistical methods. Also, the fundamental nature of 3C-based methods is the identification of interacting restriction fragments, while ChIA-PET detects interactions between DNA binding sites. It is therefore not always expected that comparing these two datasets is reasonable.
In addition to the ever-increasing mapping of regulatory elements across tissues and cell lines, inference of 3D interactions between regulatory regions in the genome is necessary to shed light on the mechanisms underlying cell-type specific gene regulation. The statistical model of ChIA-PET data presented here, based on the NCHG distribution, provides a solid framework for such analyses by taking into account important properties underlying the data.
Supplementary Material
SUPPLEMENTARY DATA
Supplementary Data are available at NAR Online.
FUNDING
Funding for open access charge: Oslo University Hospital.
Conflict of interest statement. None declared.
REFERENCES
- 1.Cavalli G., Misteli T. Functional implications of genome topology. Nat. Struct. Mol. Biol. 2013;20:290–299. doi: 10.1038/nsmb.2474. [DOI] [PMC free article] [PubMed] [Google Scholar]
- 2.Cullen K.E., Kladde M.P., Seyfred M.A. Interaction between transcription regulatory regions of prolactin chromatin. Science. 1993;261:203–206. doi: 10.1126/science.8327891. [DOI] [PubMed] [Google Scholar]
- 3.Tolhuis B., Palstra R.J., Splinter E., Grosveld F., de Laat W. Looping and interaction between hypersensitive sites in the active β-globin locus. Mol. Cell. 2002;10:1453–1465. doi: 10.1016/s1097-2765(02)00781-5. [DOI] [PubMed] [Google Scholar]
- 4.Vernimmen D., De Gobbi M., Sloane-Stanley J., Wood W.G., Higgs D.R. Long-range chromosomal interactions regulate the timing of the transition between poised and active gene expression. EMBO J. 2007;26:2041–2051. doi: 10.1038/sj.emboj.7601654. [DOI] [PMC free article] [PubMed] [Google Scholar]
- 5.Fullwood M.J., Liu M.H., Pan Y., Liu J., Xu H., Mohamed Y.B., Orlov Y.L., Velkov S., Ho A., Mei P.H., et al. An oestrogen-receptor-α-bound human chromatin interactome. Nature. 2009;462:58–64. doi: 10.1038/nature08497. [DOI] [PMC free article] [PubMed] [Google Scholar]
- 6.Kagey M.H., Newman J.J., Bilodeau S., Zhan Y., Orlando D.A., van Berkum N.L., Ebmeier C.C., Goossens J., Rahl P.B., Levine S.S., et al. Mediator and cohesin connect gene expression and chromatin architecture. Nature. 2010;467:430–435. doi: 10.1038/nature09380. [DOI] [PMC free article] [PubMed] [Google Scholar]
- 7.Ren X., Siegel R., Kim U., Roeder R.G. Direct interactions of OCA-B and TFII-I regulate immunoglobulin heavy-chain gene transcription by facilitating enhancer-promoter communication. Mol. Cell. 2011;42:342–355. doi: 10.1016/j.molcel.2011.04.011. [DOI] [PMC free article] [PubMed] [Google Scholar]
- 8.Dunham I., Kundaje A., Aldred S.F., Collins P.J., Davis C.A., Doyle F., Epstein C.B., Frietze S., Harrow J., Kaul R., et al. An integrated encyclopedia of DNA elements in the human genome. Nature. 2012;489:57–74. doi: 10.1038/nature11247. [DOI] [PMC free article] [PubMed] [Google Scholar]
- 9.Bernstein B.E., Stamatoyannopoulos J.A., Costello J.F., Ren B., Milosavljevic A., Meissner A., Kellis M., Marra M., Beaudet A.L., Ecker J.R., et al. The NIH roadmap epigenomics mapping consortium. Nat. Biotechnol. 2010;28:1045–1048. doi: 10.1038/nbt1010-1045. [DOI] [PMC free article] [PubMed] [Google Scholar]
- 10.Dekker J., Rippe K., Dekker M., Kleckner N. Capturing chromosome conformation. Science. 2002;295:1306–1311. doi: 10.1126/science.1067799. [DOI] [PubMed] [Google Scholar]
- 11.Handoko L., Xu H., Li G., Ngan C.Y., Chew E., Schnapp M., Lee C.W.H., Ye C., Ping J.L.H., Mulawadi F., et al. CTCF-mediated functional chromatin interactome in pluripotent cells. Nat. Genet. 2011;43:630–638. doi: 10.1038/ng.857. [DOI] [PMC free article] [PubMed] [Google Scholar]
- 12.Li G., Ruan X., Auerbach R.K., Sandhu K.S., Zheng M., Wang P., Poh H.M., Goh Y., Lim J., Zhang J., et al. Extensive promoter-centered chromatin interactions provide a topological basis for transcription regulation. Cell. 2012;148:84–98. doi: 10.1016/j.cell.2011.12.014. [DOI] [PMC free article] [PubMed] [Google Scholar]
- 13.Li G., Fullwood M.J., Xu H., Mulawadi F.H., Velkov S., Vega V., Ariyaratne P.N., Mohamed Y.B., Ooi H.S., Tennakoon C., et al. ChIA-PET tool for comprehensive chromatin interaction analysis with paired-end tag sequencing. Genome Biol. 2010;11:R22. doi: 10.1186/gb-2010-11-2-r22. [DOI] [PMC free article] [PubMed] [Google Scholar]
- 14.Zhang J., Poh H.M., Peh S.Q., Sia Y.Y., Li G., Mulawadi F.H., Goh Y., Fullwood M.J., Sung W.K., Ruan X., et al. ChIA-PET analysis of transcriptional chromatin interactions. Methods. 2012;58:289–299. doi: 10.1016/j.ymeth.2012.08.009. [DOI] [PubMed] [Google Scholar]
- 15.Chepelev I., Wei G., Wangsa D., Tang Q., Zhao K. Characterization of genome-wide enhancer-promoter interactions reveals co-expression of interacting genes and modes of higher order chromatin organization. Cell Res. 2012;22:490–503. doi: 10.1038/cr.2012.15. [DOI] [PMC free article] [PubMed] [Google Scholar]
- 16.Sanyal A., Lajoie B.R., Jain G., Dekker J. The long-range interaction landscape of gene promoters. Nature. 2012;489:109–113. doi: 10.1038/nature11279. [DOI] [PMC free article] [PubMed] [Google Scholar]
- 17.Paulsen J., Lien T.G., Sandve G.K., Holden L., Borgan Ø., Glad I., Hovig E. Handling realistic assumptions in hypothesis testing of 3D co-localization of genomic elements. Nucleic Acids Res. 2013;41:5164–5174. doi: 10.1093/nar/gkt227. [DOI] [PMC free article] [PubMed] [Google Scholar]
- 18.Lieberman-Aiden E., van Berkum N.L., Williams L., Imakaev M., Ragoczy T., Telling A., Amit I., Lajoie B.R., Sabo P.J., Dorschner M.O., et al. Comprehensive mapping of long-range interactions reveals folding principles of the human genome. Science. 2009;326:289–293. doi: 10.1126/science.1181369. [DOI] [PMC free article] [PubMed] [Google Scholar]
- 19.Duan Z., Andronescu M., Schutz K., McIlwain S., Kim Y.J., Lee C., Shendure J., Fields S., Blau C.A., Noble W.S. A three-dimensional model of the yeast genome. Nature. 2009;465:363–367. doi: 10.1038/nature08973. [DOI] [PMC free article] [PubMed] [Google Scholar]
- 20.Yaffe E., Tanay A. Probabilistic modeling of Hi-C contact maps eliminates systematic biases to characterize global chromosomal architecture. Nat. Genet. 2011;43:1059–1065. doi: 10.1038/ng.947. [DOI] [PubMed] [Google Scholar]
- 21.Imakaev M., Fudenberg G., McCord R.P., Naumova N., Goloborodko A., Lajoie B.R., Dekker J., Mirny L.A. Iterative correction of Hi-C data reveals hallmarks of chromosome organization. Nat. Methods. 2012;9:999–1003. doi: 10.1038/nmeth.2148. [DOI] [PMC free article] [PubMed] [Google Scholar]
- 22.Ay F., Bailey T.L., Noble W.S. Statistical confidence estimation for Hi-C data reveals regulatory chromatin contacts. Genome Res. 2014. doi:10.1101/gr.160374.113. [DOI] [PMC free article] [PubMed]
- 23.Harkness W.L. Properties of the extended hypergeometric distribution. Ann. Math. Stat. 1965;36:938–945. [Google Scholar]
- 24.Heyse J. A false discovery rate procedure for categorical data. Recent Adv. Biostat.: False Discov. Rates Surviv. Anal. Relat. Top. 2011;4:43–58. [Google Scholar]
- 25.Cox D.R., Hinkley D.V. Theoretical Statistics. London: Chapman and Hall; 1979. [Google Scholar]
- 26.Zhang Y., Wong C.H., Birnbaum R.Y., Li G., Favaro R., Ngan C.Y., Lim J., Tai E., Poh H.M., Wong E., et al. Chromatin connectivity maps reveal dynamic promoter-enhancer long-range associations. Nature. 2013;504:306–310. doi: 10.1038/nature12716. [DOI] [PMC free article] [PubMed] [Google Scholar]
- 27.Zhang Y., Liu T., Meyer C.A., Eeckhoute J., Johnson D.S., Bernstein B.E., Nusbaum C., Myers R.M., Brown M., Li W., et al. Model-based analysis of ChIP-Seq (MACS) Genome Biol. 2008;9:R137. doi: 10.1186/gb-2008-9-9-r137. [DOI] [PMC free article] [PubMed] [Google Scholar]
- 28.Dean A. In the loop: long range chromatin interactions and gene regulation. Brief. Funct. Genomics. 2011;10:3–10. doi: 10.1093/bfgp/elq033. [DOI] [PMC free article] [PubMed] [Google Scholar]
- 29.Baù D., Sanyal A., Lajoie B.R., Capriotti E., Byron M., Lawrence J.B., Dekker J., Marti-Renom M. The three-dimensional folding of the α-globin gene domain reveals formation of chromatin globules. Nat. Struct. Mol. Biol. 2010;18:107–114. doi: 10.1038/nsmb.1936. [DOI] [PMC free article] [PubMed] [Google Scholar]
- 30.Jarman A.P., Wood W.G., Sharpe J.A., Gourdon G., Ayyub H., Higgs D.R. Characterization of the major regulatory element upstream of the human alpha-globin gene cluster. Mol. Cell. Biol. 1991;11:4679–4689. doi: 10.1128/mcb.11.9.4679. [DOI] [PMC free article] [PubMed] [Google Scholar]
- 31.Mahajan M.C., Karmakar S., Newburger P.E., Krause D.S., Weissman S.M. Dynamics of α-globin locus chromatin structure and gene expression during erythroid differentiation of human CD34+ cells in culture. Exp. Hematol. 2009;37:1143–1156. doi: 10.1016/j.exphem.2009.07.001. [DOI] [PMC free article] [PubMed] [Google Scholar]
- 32.Splinter E., Heath H., Kooren J., Palstra R.J., Klous P., Grosveld F., Galjart N., de Laat W. CTCF mediates long-range chromatin looping and local histone modification in the β-globin locus. Genes Dev. 2006;20:2349–2354. doi: 10.1101/gad.399506. [DOI] [PMC free article] [PubMed] [Google Scholar]
- 33.Dostie J., Richmond T.A., Arnaout R.A., Selzer R.R., Lee W.L., Honan T.A., Rubio E.D., Krumm A., Lamb J., Nusbaum C., et al. Chromosome Conformation Capture Carbon Copy (5C): a massively parallel solution for mapping interactions between genomic elements. Genome Res. 2006;16:1299–1309. doi: 10.1101/gr.5571506. [DOI] [PMC free article] [PubMed] [Google Scholar]
- 34.Fraser P., Pruzina S., Antoniou M., Grosveld F. Each hypersensitive site of the human beta-globin locus control region confers a different developmental pattern of expression on the globin genes. Genes Dev. 1993;7:106–113. doi: 10.1101/gad.7.1.106. [DOI] [PubMed] [Google Scholar]
- 35.Rae J., Johnson M.D., Scheys J.O., Cordero K.E., Larios J.M., Lippman M.E. GREB1 is a critical regulator of hormone dependent breast cancer growth. Breast Cancer Res. Treat. 2005;92:141–149. doi: 10.1007/s10549-005-1483-4. [DOI] [PubMed] [Google Scholar]
- 36.Deschênes J., Bourdeau V., White J.H., Mader S. Regulation of GREB1 transcription by estrogen receptor α through a multipartite enhancer spread over 20 kb of upstream flanking sequences. J. Biol. Chem. 2007;282:17335–17339. doi: 10.1074/jbc.C700030200. [DOI] [PubMed] [Google Scholar]
- 37.Otto F., Lübbert M., Stock M. Upstream and downstream targets of RUNX proteins. J. Cell. Biochem. 2003;89:9–18. doi: 10.1002/jcb.10491. [DOI] [PubMed] [Google Scholar]
- 38.Ghozi M.C., Bernstein Y., Negreanu V., Levanon D., Groner Y. Expression of the human acute myeloid leukemia gene AML1 is regulated by two promoter regions. Proc. Natl. Acad. Sci. U.S.A. 1996;93:1935–1940. doi: 10.1073/pnas.93.5.1935. [DOI] [PMC free article] [PubMed] [Google Scholar]
- 39.Markova E.N., Kantidze O.L., Razin S.V. Transcriptional regulation and spatial organisation of the human AML1/RUNX1 gene. J. Cell. Biochem. 2011;112:1997–2005. doi: 10.1002/jcb.23117. [DOI] [PubMed] [Google Scholar]
- 40.Ernst J., Kheradpour P., Mikkelsen T.S., Shoresh N., Ward L.D., Epstein C.B., Zhang X., Wang L., Issner R., Coyne M., et al. Mapping and analysis of chromatin state dynamics in nine human cell types. Nature. 2011;473:43–49. doi: 10.1038/nature09906. [DOI] [PMC free article] [PubMed] [Google Scholar]
- 41.Ørom U.A., Shiekhattar R. Long non-coding RNAs and enhancers. Curr. Opin. Genet. Dev. 2011;21:194–198. doi: 10.1016/j.gde.2011.01.020. [DOI] [PMC free article] [PubMed] [Google Scholar]
Associated Data
This section collects any data citations, data availability statements, or supplementary materials included in this article.