Abstract
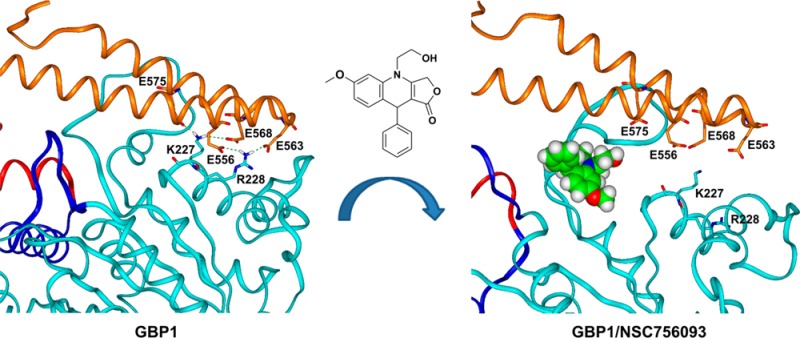
Class III β-tubulin plays a prominent role in the development of drug resistance to paclitaxel by allowing the incorporation of the GBP1 GTPase into microtubules. Once in the cytoskeleton, GBP1 binds to prosurvival kinases such as PIM1 and initiates a signaling pathway that induces resistance to paclitaxel. Therefore, the inhibition of the GBP1:PIM1 interaction could potentially revert resistance to paclitaxel. A panel of 44 4-azapodophyllotoxin derivatives was screened in the NCI-60 cell panel. The result is that 31 are active and the comparative analysis demonstrated specific activity in paclitaxel-resistant cells. Using surface plasmon resonance, we were able to prove that NSC756093 is a potent in vitro inhibitor of the GBP1:PIM1 interaction and that this property is maintained in vivo in ovarian cancer cells resistant to paclitaxel. Through bioinformatics, molecular modeling, and mutagenesis studies, we identified the putative NSC756093 binding site at the interface between the helical and the LG domain of GBP1. According to our results by binding to this site, the NSC756093 compound is able to stabilize a conformation of GBP1 not suitable for binding to PIM1.
Introduction
Drug resistance is the most relevant clinical problem in the management of solid malignancies. In many cases, after an initial response to treatment, cancer cells develop a resistant phenotype which is ultimately responsible for the fatal progression of the disease. Mechanisms that induce drug resistance are complex and rely on multiple functional pathways. Microtubule targeted agents (MTAs) are the chemotherapeutics most commonly used for the management of solid malignancies. Unfortunately, treatment with MTAs eventually induces drug resistance. Microtubules are formed by heterodimers of α/β tubulin isotypes.1 In mammals, multiple genes encode for at least seven α and six β tubulin genes. Microtubule composition of the different tubulin isotypes is tissue dependent and can be modified in response to microenvironmental stimuli.2,3 In fact, the microenvironment surrounding cancer cells can trigger the expression of specific tubulin subtypes, such as βIII-tubulin, able to induce the emergence of drug resistance. The overexpression of βIII-tubulin isotype3−5 is an example of this survival mechanism, which is not limited to this protein acting as a single driver of the resistant phenotype but it involves a multimolecular complex that is able to activate a cytoskeletal gateway for the incorporation into microtubules of pro-survival kinases such as PIM1 and NEK6.6,7 Crucial element of this gateway is the large-GTPase GBP1, whose incorporation into microtubules is facilitated by the presence of βIII-tubulin.6,7 For this reason, it would be desirable to control βIII-tubulin role by switching off such a gateway of drug resistance and possibly restores sensitivity to MTAs. The present study was aimed at identifying specific inhibitors of such functional gateway, that is, compounds able to interfere with the involved protein–protein interaction network.
Over the last two decades, there has been significant interest in developing therapeutics and chemical probes that inhibit specific protein:protein interactions. Although developing small molecules that are capable of occluding the large, often relatively featureless protein:protein interaction interface has been challenging, there are increasing numbers of examples of small molecules that function in this manner with reasonable potency.8−10 Natural products and their derivatives have historically been invaluable as a source of therapeutic agents. Among these podophyllotoxins are the first and perhaps the best known example of the use of a lignan as a lead compound, a cytotoxic aryltetralin lactone originally obtained from Podophyllum peltatum L. and related species.11,12 Although the semisynthetic derivatives etoposide, etoposide phosphate, and teniposide are currently used in clinic for the treatment of a variety of malignancies, there are side effects associated with the use of these agents in clinic (including myelosuppression, neutropenia, and nausea).13 To overcome these limitations, we modified the original structure and prepared a small set of azapodophyllotoxins (APTs) which showed reduced toxicity and high cancer inhibitory activity.14,15 Motivated by these results, we have now prepared a larger set of APTs and tested for their potential to inhibit the activity of GBP1 function.
The data presented herein demonstrate that some APTs are selectively more active in the cell lines most resistant to MTAs like paclitaxel. The ability of the identified analogues in preventing the formation of the GBP1:PIM1 complex was tested, and compound NSC756093 was found active. The molecular bases of this inhibition were investigated using bioinformatics, molecular modeling, and mutagenesis studies, and a putative binding site and mechanism of action was hypothesized. Results obtained could potentially allow the development of a new generation of compounds active on MTA-resistant tumors.
Results and Discussion
Chemistry
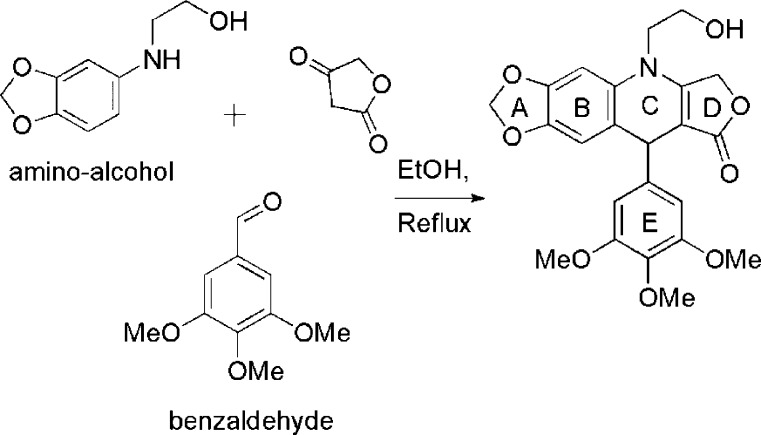
The OH-functionalized derivatives of 4-aza-2,3-didehydropodophyllotoxin at the N atom in ring “‘C’”, i.e., the N-(2-hydroxy-ethyl)-2,3-didehydroazapodophyllotoxins, were synthesized in one step by simple refluxing in ethanol as reported previously (Scheme 1).16
Scheme 1. Representative Example of the Synthesis of Azapodophyllotoxin Derivatives.
Hydroxy-functionalized 2,3-didehydroazapodophyllotoxin derivatives were prepared, in two simple steps, by reacting commercially available substituted anilines with 2-chloroethylchloroformate in dry dichloromethane in the presence of pyridine followed by reacting with KOH in ethanol. These arylamino alcohols are not stable for long periods of time at room temperature and, therefore, they were synthesized freshly before use. The overall yields of products through our protocol were in the 50–70% range. Structures were corroborated with the help of 1H, COSY, 13C, NMR, as well as 1H NMR coupled with deuterium exchange experiments, FTIR spectroscopy, and HRMS.14
Cell Based Assays
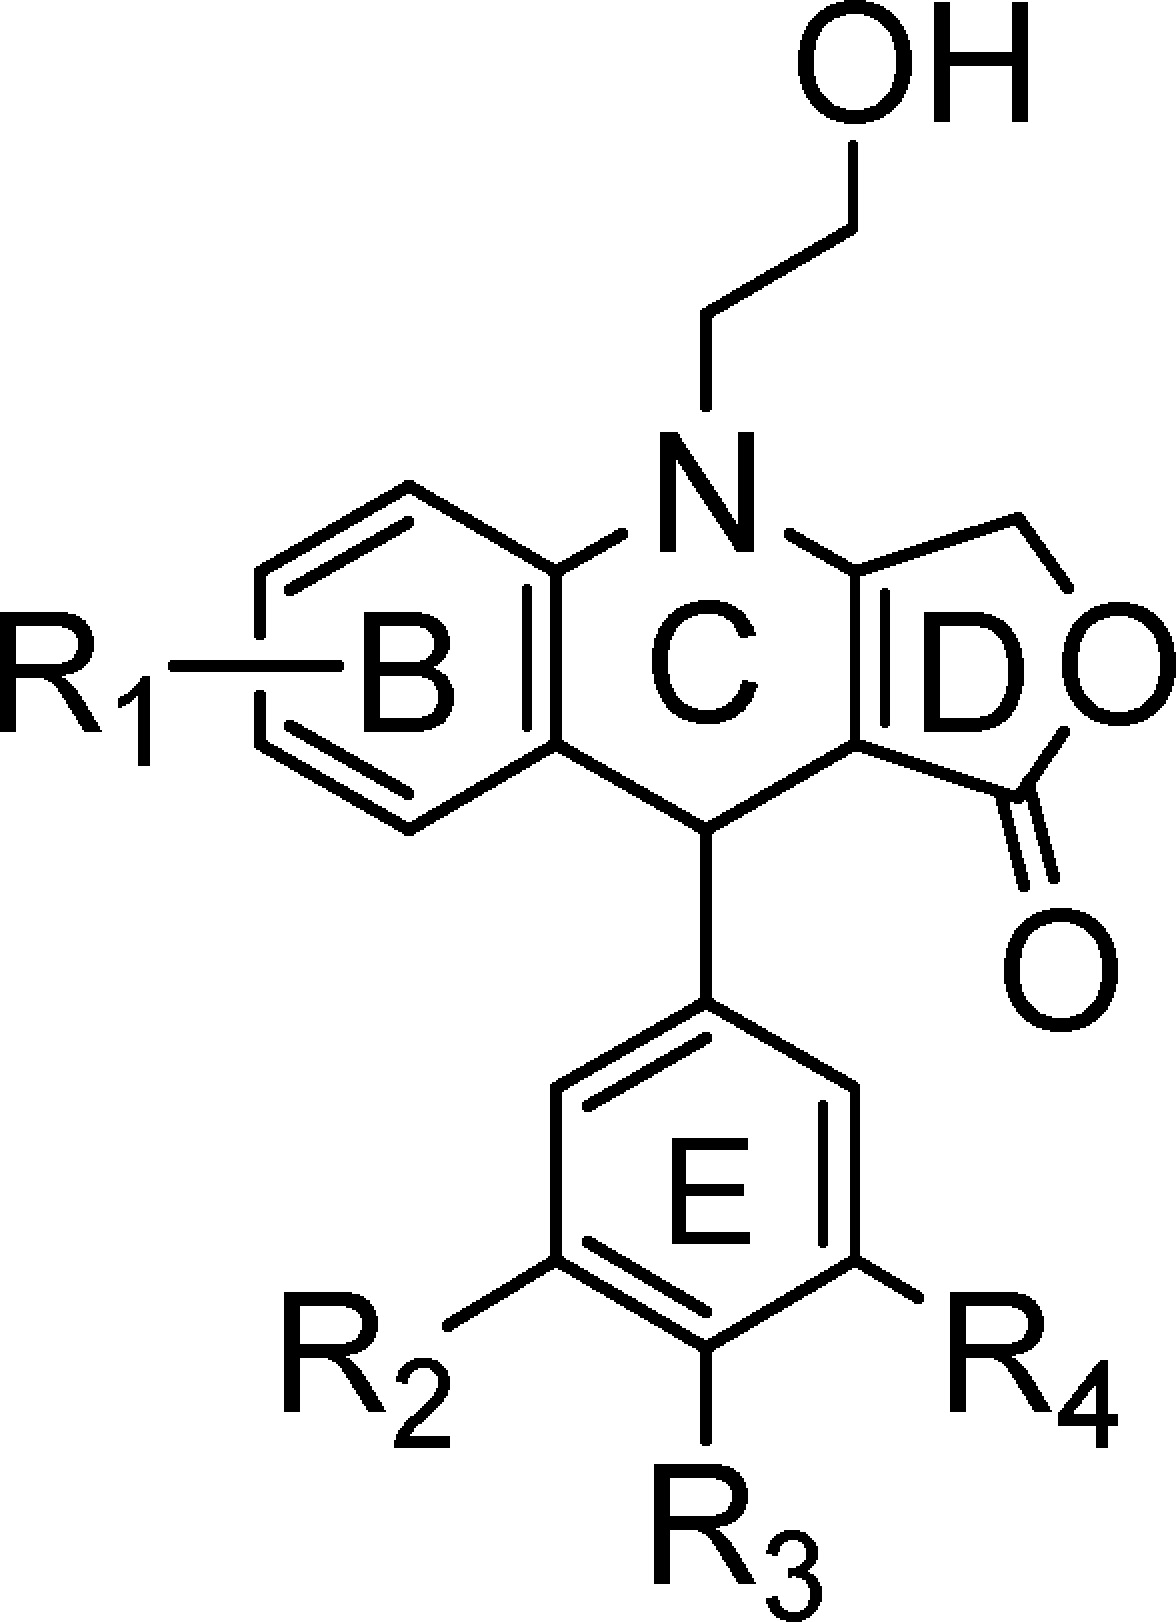
A panel of 44 4-azapodophyllotoxins (4-APTs) whose structure is reported in Table 1 was screened in the NCI-60 panel of cell lines15 (see Experimental Section for details; the methodology for NCI-60 cell line screening is also described at http://dtp.nci.nih.gov/branches/btb/ivclsp.html).
Table 1. Structures of 4-Azapodophyllotoxins (4-APTs).
| compd | R1 | R2 | R3 | R4 |
|---|---|---|---|---|
| NSC750210 | 6,7-OCH2O | OCH3 | OCH3 | OCH3 |
| NSC750716 | 6,7-OCH2O | OCH3 | OCH3 | H |
| NSC750717 | 6,7-OCH2O | OCH3 | H | H |
| NSC750211 | 6,7-OCH2O | H | H | H |
| NSC750718 | 6,7-OCH2O | OCH3 | OH | OCH3 |
| NSC751499 | 6,7-OCH2O | H | OCH3 | H |
| NSC756083 | 6,7-OCH2O | Cl | H | H |
| NSC750212 | 6,7-(CH2)3 | OCH3 | OCH3 | OCH3 |
| NSC751500 | 6,7-(CH2)3 | OCH3 | OCH3 | H |
| NSC750719 | 6,7-(CH2)3 | OCH3 | H | H |
| NSC750213 | 6,7-(CH2)3 | H | H | H |
| NSC751501 | 6,7-(CH2)3 | OCH3 | OH | OCH3 |
| NSC751502 | 6,7-(CH2)3 | H | OCH3 | H |
| NSC756084 | 6,7-(CH2)3 | Br | H | H |
| NSC756085 | 6,7-(CH2)3 | Cl | H | H |
| NSC756086 | 6,7-(CH2)3 | Cl | Cl | H |
| NSC750720 | 6,7-O(CH2)2O | OCH3 | OCH3 | OCH3 |
| NSC750721 | 6,7-O(CH2)2O | OCH3 | OCH3 | H |
| NSC750722 | 6,7-O(CH2)2O | OCH3 | H | H |
| NSC750723 | 6,7-O(CH2)2O | H | H | H |
| NSC751503 | 6,7-O(CH2)2O | OCH3 | OH | OCH3 |
| NSC751504 | 6,7-O(CH2)2O | H | OCH3 | H |
| NSC756087 | 6,7-O(CH2)2O | Br | H | H |
| NSC756088 | 6,7-O(CH2)2O | Cl | H | H |
| NSC756089 | 6,7-O(CH2)2O | Cl | Cl | H |
| NSC756090 | 6-OCH3 | OCH3 | OCH3 | OCH3 |
| NSC756091 | 6-OCH3 | OCH3 | OCH3 | H |
| NSC756092 | 6-OCH3 | OCH3 | H | H |
| NSC756093 | 6-OCH3 | H | H | H |
| NSC756094 | 6-OCH3 | H | OCH3 | H |
| NSC756095 | 6-OCH3 | Br | H | H |
| NSC756097 | 6,7-OCH3 | OCH3 | OCH3 | OCH3 |
| NSC756098 | 6,7-OCH3 | OCH3 | OCH3 | H |
| NSC756099 | 6,7-OCH3 | OCH3 | H | H |
| NSC756100 | 6,7-OCH3 | H | H | H |
| NSC756102 | 6,7-OCH3 | H | OCH3 | H |
| NSC756103 | 6,7-OCH3 | Br | H | H |
| NSC756104 | 6,7-OCH3 | Cl | H | H |
| NSC756105 | 6,7-OCH3 | Cl | Cl | H |
| NSC756106 | 6-CH2CH3 | OCH3 | OCH3 | OCH3 |
| NSC756108 | 6-CH2CH3 | H | H | H |
| NSC756110 | 6-CH2CH3 | Br | H | H |
| NSC756111 | 6-CH2CH3 | Cl | H | H |
| NSC756112 | 6-CH2CH3 | Cl | Cl | H |
Briefly, the panel is organized into nine subpanels representing diverse histologies: leukemia, melanoma, lung, colon, kidney, ovary, breast, prostate, and central nervous system. The results of the reference drugs carboplatin (NSC241240), cisplatin (NSC119875), and paclitaxel (NSC125793) are publicly available at http://dtp.nci.nih.gov. Sensitivity of NCI-60 cells to paclitaxel is summarized in Supporting Information, Figure 1SI. The screening was a two-stage process, beginning with the evaluation of all compounds against the 60 cell lines at a single dose of 10 μM. There were 31 compounds that exhibited significant growth inhibition and they were evaluated against the NCI-60 at five concentration levels to a final concentration of 0.1 nM (for more active compounds, see Supporting Information, Figures 2SI–5SI).
The results were then analyzed according to the principles of the COMPARE analysis.17 Activity of each compound measured as GI50 is ranked with a Z-score within the cell lines of the NCI-60 panel. Each Z-score is calculated with the formula z = (x – μ/σ), where x is the GI50 in a given cell line for a drug, μ is the average of the GI50 of the same drug within the NCI-60 panel, and σ is the standard deviation. To perform the COMPARE analysis, all these values were correlated with a Spearman test with the Z-scores of another reference drug, resulting in a ρ coefficient. A positive ρ value indicates an overlapping mechanism of action with significant cross-resistance/sensitivity as compared with the reference drug. On the contrary, a negative ρ value signifies an increased activity in the cells which are resistant to the reference drug.
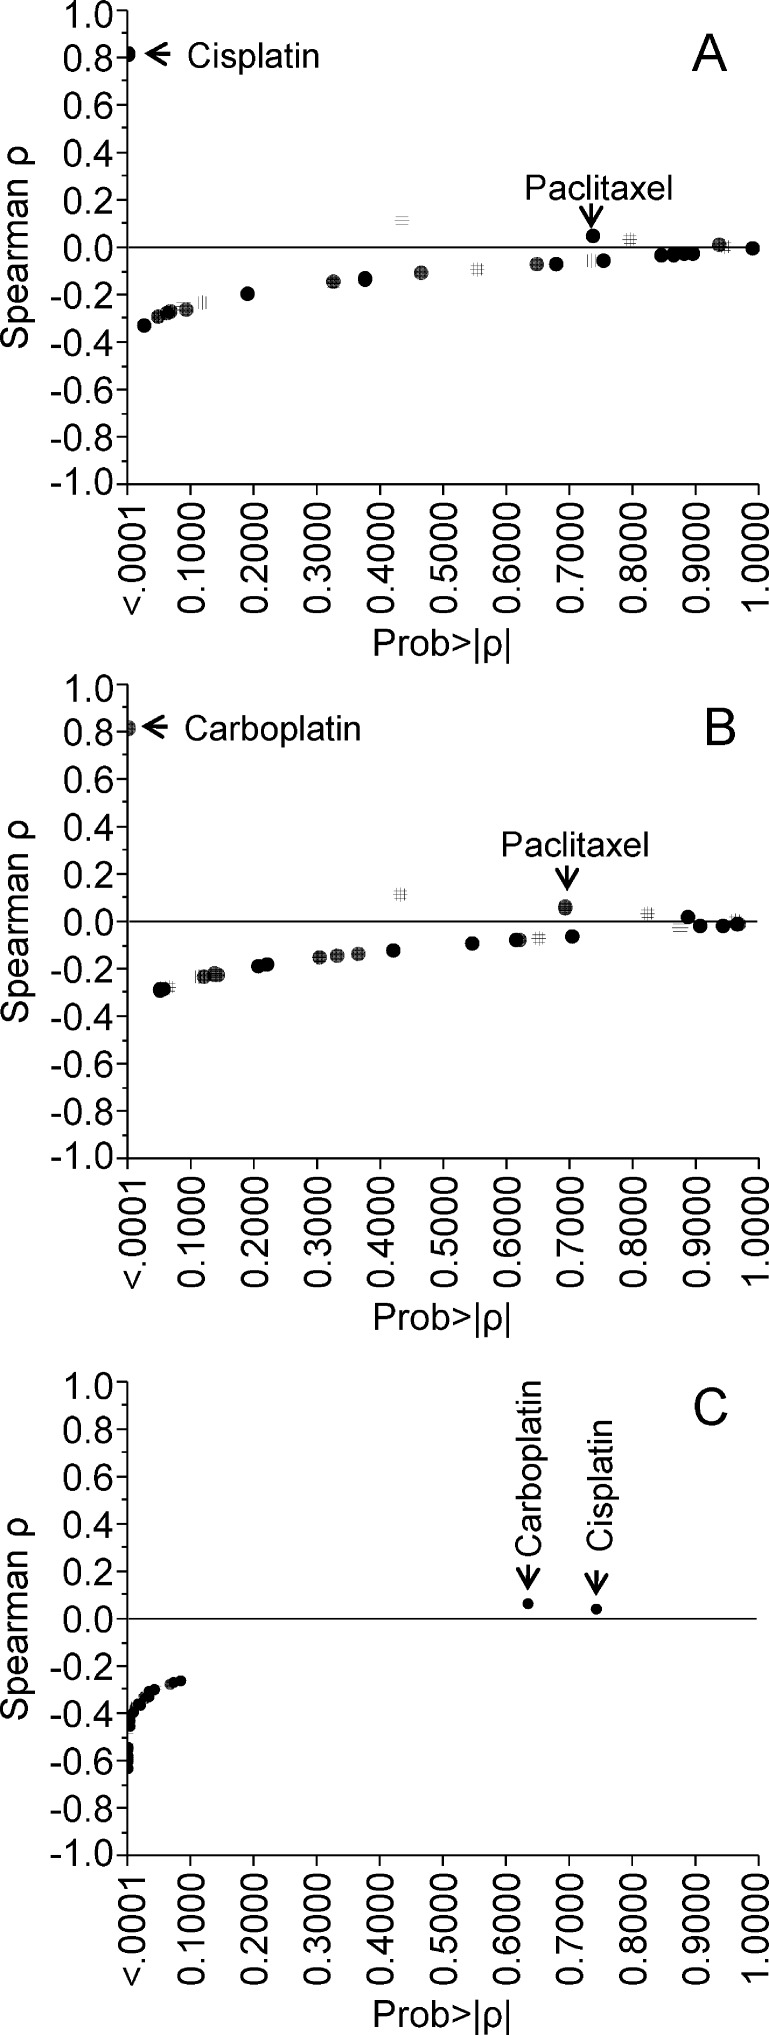
As a first analysis, we analyzed the 31 active 4-APTs using as references cisplatin (NSC119875) (Figure 1A), carboplatin (NSC241240) (Figure 1B), and paclitaxel (NSC125973) (Figure 1C). As expected, there was a strong correlation (ρ > 0.8) in the NCI-60 panel for carboplatin and cisplatin (Figure 1A,B) because the two drugs have a similar mechanism of action.
Figure 1.
Plot chart showing the results of Spearman correlation test between the Z-score of the tested active 4-APTs with carboplatin (A), cisplatin (B), and paclitaxel (C) in the NCI-60 cell lines. In x- and y- axis, the p value of the Spearman correlation and ρ values are plotted, respectively. Positive and negative ρ values indicate cross-sensitivity and cross-resistance, respectively.
On the contrary, the 31 active 4-APT compounds exhibited a significant negative correlation as compared with paclitaxel (Figure 1C) but not with either cisplatin or carboplatin (Figure 1A,B). This finding suggests that 4-APTs are more active in paclitaxel-resistant cells.
To better characterize these compounds we also ran a COMPARE analysis for the 21 most active 4-APTs using the mechanistic set of NCI-reference compounds18 (Supporting Information, Figure 6SI). All the compounds capable of yielding a ρ value higher than 0.55 were selected to identify drugs sharing similar mechanisms of action. Either the parent podophyllotoxin (NSC24818) or etoposide (NSC141540) did not have a ρ value higher than 0.55. Cluster analysis was applied to identify groups of 4-APT compounds sharing most similar mechanisms of action (Supporting Information, Figure 6SI). Within the mechanistic set, the most represented drugs are known MTAs such as quinazolinone,19 maytansine,20 colchicines, and its analogue benzoyl-deacetyl-colchicine,21 vinblastine,22 and baccatin III.23 In synthesis, although there was no a single agent in the mechanistic set which exhibited significant homology with all the 4-APTs, this analysis provided evidence that at least some of the 4-APTs could interact with cytoskeleton, with the compounds NSC756093 and NSC756090 as representative of two clusters with the most divergent activity (Supporting Information, Figure 6SI).
For the activities in paclitaxel-resistant cells we reported above (Figure 1C), we chose to test 4-APTs for their ability to inhibit the cytoskeletal gateway of drug resistance mediated by GBP1.
We are aware that drug resistance in general, and paclitaxel-resistance in particular, may be driven by multiple mechanisms. In this study, we focused on a specific single mechanism of resistance linked to the cytoskeletal gateway of drug-resistance and GBP1 expression without assessing directly the antitubulin activity of the whole set of compounds. Also no metabolic analysis were conducted and we do not know if some of these compounds may act in vivo as pro-drugs of other members of the same family. According to these limits, we cannot conclude that the increased effect we noticed in paclitaxel-resistant cells for 4-APT is driven by a single mechanism of action.
GBP1:PIM1 Interaction
One of the mechanisms of paclitaxel resistance with strong support in clinical studies is represented by class III β-tubulin overexpression.5 βIII-Tubulin is not suitable for in vitro screening because its active conformation require posttranscriptional changes not obtainable with the current technology of production of recombinant protein. Recently, we discovered that βIII-tubulin is capable enhancing incorporation of the GBP1 GTPase into the cytoskeleton in stressing conditions.6 GBP1 then is capable to bind a panel of prosurvival kinases like PIM1, thus recruiting them into cytoskeleton and prolonging their activity.6 At variance of βIII-tubulin, GBP1 and PIM1 can be expressed in vitro and used to screen compounds capable of disrupting such a protein:protein interaction. To develop a quantitative system of screening, the kinetics of the GBP1:PIM1 interaction was monitored with surface plasmon resonance technology (SPR). PIM1 was immobilized on the biochip as ligand (50 μg/mL). In a parallel flow path, carbonic anhydrase (CA) was immobilized on the chip as negative control. The binding of GBP1 was tested on both targets, flowing the protein on the chip surface at different concentrations (8.25–140 nM). CA was also used as analyte control in the same range of [GBP1], thereby demonstrating that GBP1:PIM1 interaction is not dependent on any aspecific binding of PIM1 (Supporting Information, Figure 7SI). We repeated the experiment in duplicate, and we tested the interaction also in the presence of GDP and the GTP nonhydrolyzable analogue GppNHp (1 μM in PBST). The signal generated from the protein:protein interaction was dose-dependent in the range 8.25–140 nM, and the kinetic analysis revealed a KD value of 38 ± 14 nM. No binding was detectable using CA as ligand or analyte. These findings show that SPR technology is able to detect the specific GBP1:PIM1 interaction. We used the SPR method to test a potential inhibition of the GBP1:PIM1 interaction. All the 44 4-APTs were screened in PBST and dimethyl sulfoxide (DMSO) 0.2% v/v with GBP1 280 nM in PBST solution in duplicate experiments. The negative control of each experiment was represented by CA that was flowed on the chip surface in parallel with the test compounds. All the analyses were performed in two independent channels of the biochip. There were 32 compounds that were completely inactive as inhibitor of the GBP1:PIM1 interaction. There were 11 compounds that were capable of producing an inhibition of the binding around 10–20%, while only NSC756093 was able to inhibit 65% of the GBP1:PIM1 interaction (Figure 2A).
Figure 2.
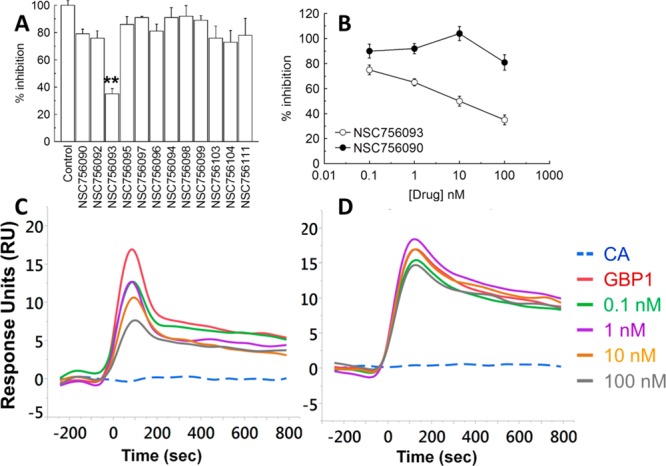
(A) Bar chart showing the % of inhibition of the 12 compounds capable of producing an inhibition of the GBP1:PIM1 interaction >10% at a drug concentration of 100 nM. The maximum signal (100%) was obtained in the absence of any compound. Bar and error bars refer to mean and SD of duplicated experiments. (B) Line chart reporting the dose dependent growth inhibition of NSC756093 and NSC756090. Each dot and bar refer to mean and SD of duplicated experiments. (C,D) Representative biosensograms for NSC756093 (C) and NSC756090 (D). CA (dotted line) represented the negative control while GBP1 (red line) the maximum signal without inhibitor.
The inhibition of the GBP1:PIM1 interaction by NSC756093 was dose-dependent (Figure 2B) and statistically significant as compared with the control without drug (p < 0.001, Anova). Representative biosensograms are shown in Figure 2C (NSC756093) and D (NSC756090). In all the experiments, CA was used as negative control and the maximum signal was calculated with GBP1 without inhibitors. This analysis demonstrated that NSC756093 is a specific inhibitor of the GBP1:PIM1 interaction in a pure in vitro system using recombinant proteins. Importantly, we can exclude that PIM1 is the target of the tested compounds because we did not notice any change of the baseline for any of the tested compound up to the maximum tested concentration in the absence of GBP1(Supporting Information, Figure 8SI).
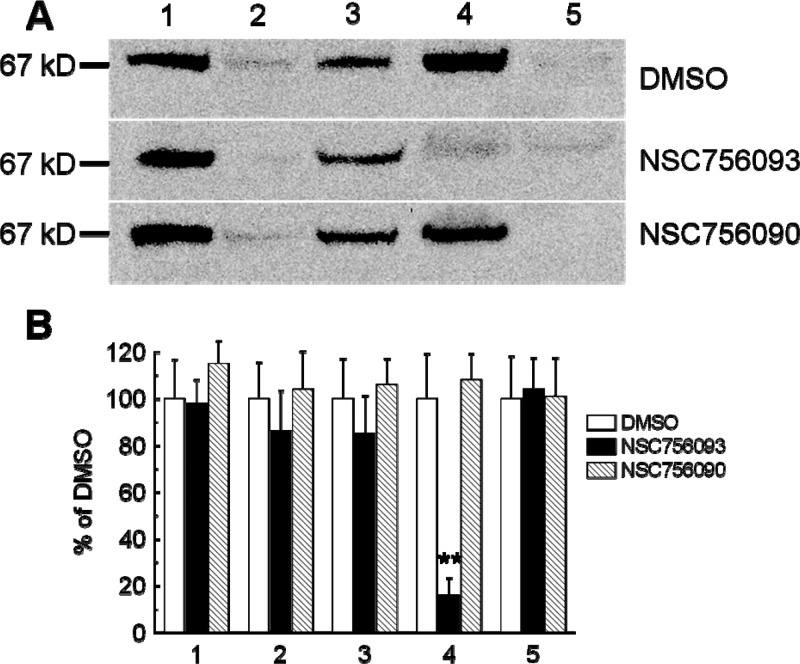
To confirm the activity of the drug in cell lines, we assessed the ability of NSC756093 to inhibit the GBP1:PIM1 interaction in SKOV3 cells. The cells were treated for 3 h using 100 nM of the drug, then the cells were scraped and the pellet was used for coimmunoprecipitation of PIM1 (bait) with GBP1. The results demonstrated that treatment with NSC756093 inhibits the interaction also in vitro, while treatment with the vehicle DMSO or the inactive compound (NSC756090) did not yield any modulation of the GBP1:PIM1 interaction (Figure 3).
Figure 3.
(A) Representative coimmunoprecipitation (IP) of PIM1 and GBP1 in SKOV3 cell line treated with NSC756093 (3 h at 100 nM). The signal was revealed using anti-GBP1 antibody detected as a specific band of 67 kD. Lane 1: input of SKOV3 lysate. Lane 2: flow through co-IP. Lane 3: flow through control. Lane 4: co-IP. PIM1:GBP1 (antibody anti-PIM1). Lane 5: co-IP. Negative control (antibody anti-IGg). The presence of the signal in lane 4 means no interference in the GBP1:PIM1 binding in DMSO and the inactive NSC756090; the absence of detectable signal in the presence of NSC756093 means that the compound is able of inhibiting the GBP1:PIM1 interaction. (B) Bar chart showing the densitometric analysis of the experiment shown in A, performed in two independent experiments. A significant (double asterisks = p < 0.001, Anova) suppression of the co-IP was noticed in both experiments only with the compound NSC756093.
To further substantiate the link between activity of NSC756093 and the expression of GBP1 and PIM1, we downloaded the gene expression data of the NCI-60 cells which are publicly available at http://dtp.nci.nih.gov. Therefore, we sorted the cell lines according to the GI50 value. The first and the third tertile were classified as NSC756093-sensitive and NSC756093-resistant cells. A significant difference was noticed between NSC756093-sensitive and NSC756093-resistant cells. In fact expression of GBP1 and PIM1 conferred increase sensitivity to NSC756093 (Figure 4).
Figure 4.
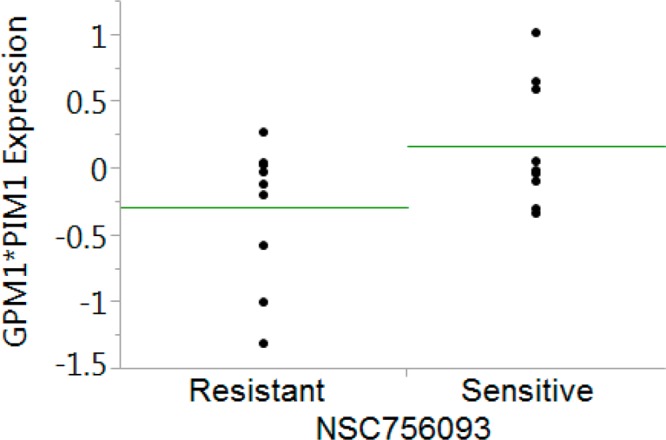
Analysis of PIM1/GBP1 gene expression and NSC756093 sensitivity. Median gene expression values (Z-score) for GBP1 and PIM1 were downloaded and combined in an index of expression. Green line corresponds to the average of each group. This index was significantly lower in the cells resistant to NSC756093, as compared with the NSC756093-sensitive cells (p = 0.01, t test).
Identification of NSC756093 Putative Binding Site
To identify a putative binding site for NSC756093, first, a structural and bioinformatic analysis was performed on the X-ray structures of: (i) etoposide in complex with topoisomerase II (TopoIIβ) and DNA (PDB ID: 3QX3) and (ii) podophyllotoxin in complex with tubulin (PDB ID: 1SA1). Indeed, podophyllotoxin (1), etoposide (2), and NSC756093 share a common structural skeleton, composed by the polycyclic system B–D and the phenyl ring E, but presenting different substituents (Table 2).
Table 2. Structures of Podophyllotoxin (1), Etoposide (2), and NSC756093.
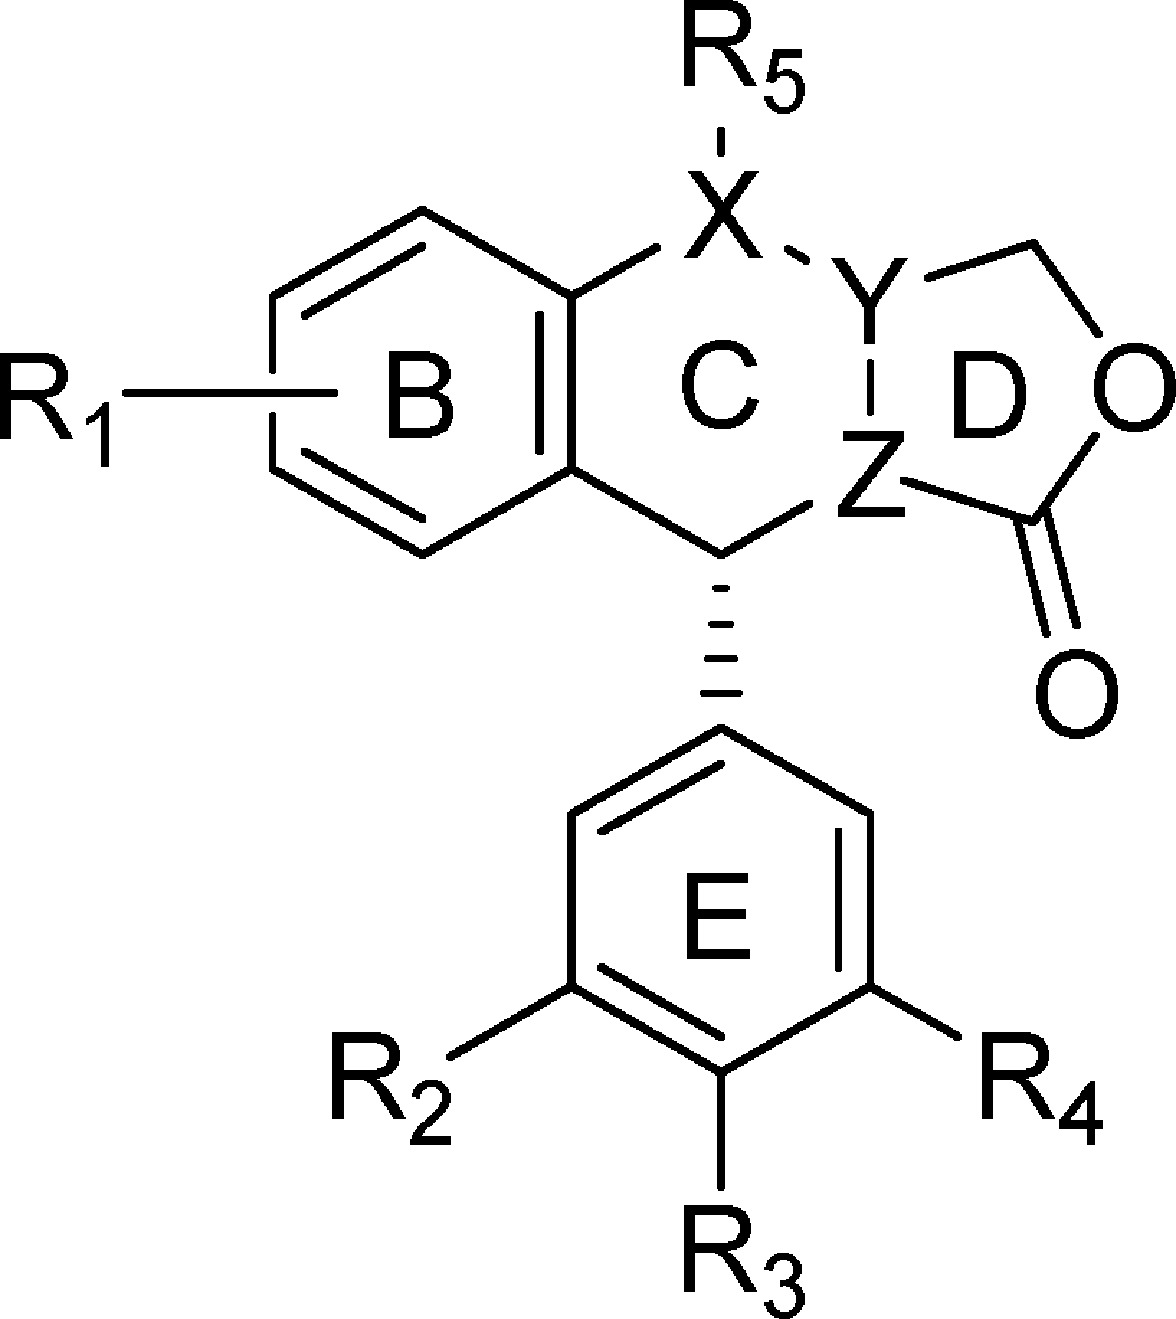

The rationale applied to our analysis is that similar ligand substructures recognize homologous structural elements of the protein target, thus, if two binding pockets of different proteins share a common motif, it is likely that ligands or ligand fragments that bind within one binding pocket will also be recognized in the respective part of the other binding pocket.24−27
Thus, we superimposed the two X-ray complexes by fitting the common polycyclic system of the ligands (Figure 5).
Figure 5.
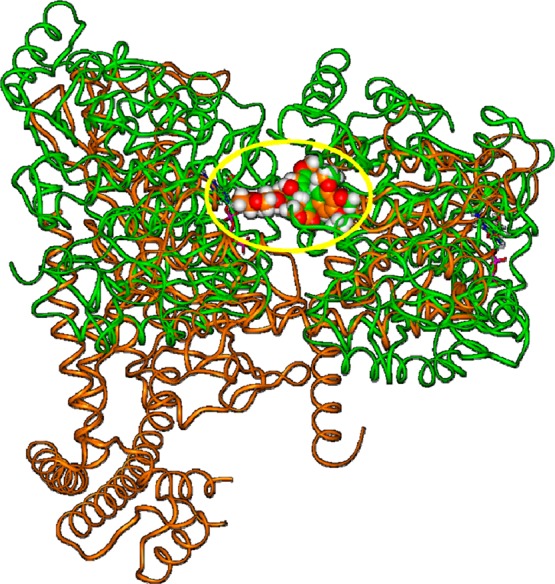
Superimposition of the X-ray structure of the etoposide/TopoIIβ complex (orange; PDB ID: 3QX3) on the X-ray structure of podophyllotoxin/tubulin complex (green; PDB ID: 1SA1) by fitting the A–D rings of the ligands. The yellow circle highlights the position of the fitted ligands. Proteins are displayed as ribbons, ligands are displayed as CPK. DNA is omitted, for clarity of presentation.
The first observation resulting from the overall structural comparison of 1 and 2 in complex with their molecular targets is that, in both cases, the small ligand is engaged in molecular interactions at the interface between two protein domains, such as the α and β monomers of tubulin for 1 and the winged helix domain (WHD) and the topoisomerase-primase domain (TOPRIM) of TopoIIβ for 2. In the case of 2, DNA is also involved (Figure 6A and Supporting Information, Figure 9SI).
Figure 6.
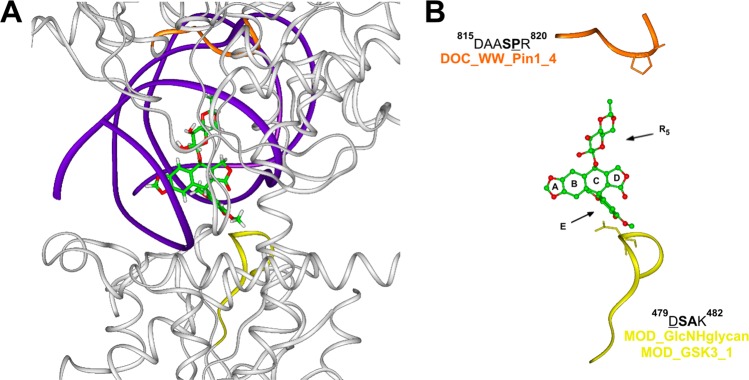
(A) Overview of the etoposide binding site in TopoIIβ/DNA complex (PDB ID: 3QX3). TopoIIβ (white) and DNA (violet) are displayed as ribbons. Etoposide is displayed in stick and colored by atom type (C = green, O = red, H = white). (B) Detailed view of protein motifs involved in etoposide binding site. Key interacting residues are displayed in stick and underlined in the sequence; key consensus sequence residues are in bold. Etoposide is displayed as ball and stick and colored by atom type. Protein motifs involved in the binding site are displayed as ribbons and colored: DOC_WW_Pin1_4 motif (orange); MOD_GlcNHglycan and MOD_GSK3_1 motifs (yellow). Hydrogens are omitted for sake of clarity.
On the other hand, the results obtained by the eukaryotic linear motifs resource for functional sites in proteins28 (http://elm.eu.org) showed that the binding sites of the two complexes include several consensus sequences of functional motifs (Figures 6B, 7B, and Supporting Information, Figures 9SI, and 10SI), and that the E ring of the two ligands interacts with the consensus sequence of the same protein motifs in both proteins (colored in yellow in Figures 6B and 7B).
Figure 7.
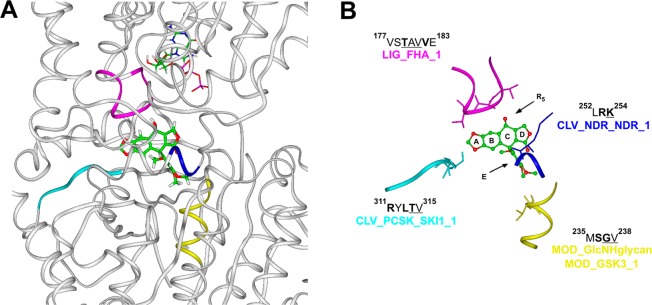
(A) Overview of podophyllotoxin binding site on α/β tubulin heterodimer (PDB ID 1SA1). Tubulin is displayed as ribbons and colored in white. Podophyllotoxin and α tubulin GTP nucleotide are displayed in stick and colored by atom type (C = green, O = red, N = blue, P = magenta, H = white). (B) Detailed view of protein motifs involved in podophyllotoxin binding site. Key interacting residues are displayed in stick and underlined in the sequence; key consensus sequence residues are in bold. Podophyllotoxin is displayed as ball and stick and colored by atom type. Protein motifs involved in this binding site are displayed as ribbons and colored: LIG_FHA_1 motif (magenta); CLV_NDR_NDR_1 motif (blue); CLV_PCSK_SKI1_1 motif (cyan); MOD_GlcNHglycan and MOD_GSK3_1 motifs (yellow). Hydrogens are omitted for sake of clarity.
The bioinformatics analysis applied on the structures of TopoIIβ and tubulin, was successively performed on PIM1 and GBP1 X-ray structures. In agreement with the results of the SPR experiments, it resulted that only GBP1 contained a three-dimensional combination of consensus sequence of functional motifs, similar to those found in the active sites of TopoIIβ and tubulin (Supporting Information, Figure 11SI). Importantly, the identified sequences located at the interface of the two main GBP1 structural domains (namely LG and helical). Thus, a putative binding site of NSC756093 on GBP1 has emerged from our analysis (Figure 8A).
Figure 8.
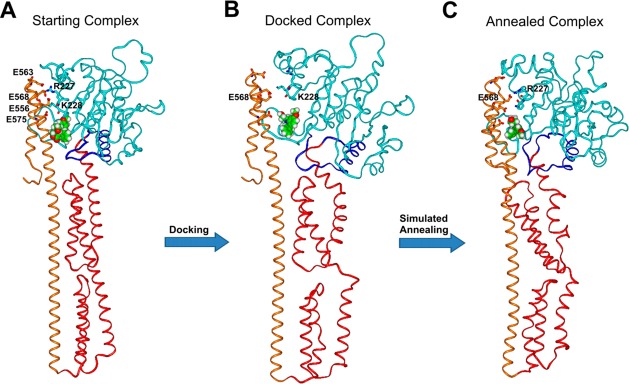
Overall view of NSC756093/GBP1 starting (A), docked (B), and annealed (C) complexes. GBP1 structure is displayed as ribbons, where the LG domain is in cyan, the connecting region in blue, the helical domain in red and α12/α13 in orange. NSC756093 is displayed as CPK and colored by atom type (C = green, O = red, N = blue, H = white). Key interacting residues between LG domain and α12/α13 are displayed in stick, colored by atom type and labeled.
Docking Studies
By using the identified putative binding site as the NSC756093 starting position, a dynamic docking study was performed on the NSC756093/GBP1 complex, defined as binding domain the whole GBP1 structure. To test the thermodynamic stability of the resulting docked complexes, these latter were also subjected to a molecular dynamics simulated annealing protocol (see Experimental Section for details). The resulting complexes were ranked by their conformational energy values, and the lowest energy complex was chosen as the more representative one (Supporting Information, Figure 11SI, Table 1SI). The quality of the obtained docked complex was assessed using Procheck (http://www.ebi.ac.uk/thornton-srv/software/PROCHECK/) and resulted comparable to that obtained for human GBP1 X-ray structure (PDB ID 1DG3; Ramachandran plots, Chi1–Chi2 plots, main chain parameters, side chain parameters are reported in the Supporting Information).
Docking results supported our binding hypothesis. In the calculated complex, NSC756093 is bound at the interface between the LG domain and the helical domain (Figure 8).
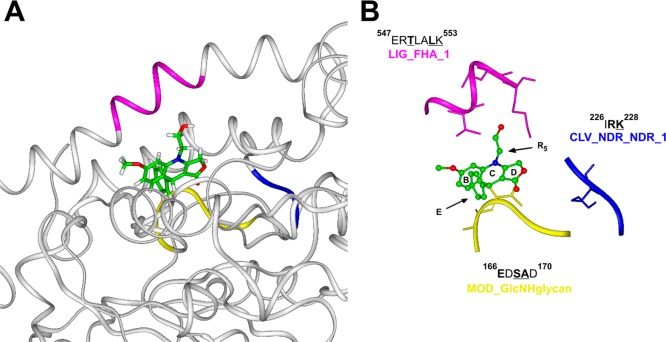
It is noteworthy that the subset constituted by all GBP1 residues within 5 Å from any given NSC756093 atom (namely the binding site) contained the consensus sequences of protein motifs also found in podophyllotoxin/tubulin binding site, one of which is also present in the etoposide/TopoIIβ binding site (Figure 9 vs Figures 6 and 7).
Figure 9.
(A) Overview of NSC756093 binding site in GBP1 (white) in the final annealed complex. GBP1 is displayed as ribbons. NSC756093 is displayed in stick and colored by atom type (C = green, O = red, N = blue, H = white). (B) Detailed view of protein motifs involved in NSC756093 binding site. Key interacting residues are displayed in stick and underlined in the sequence; key consensus sequence residues are in bold. NSC756093 is displayed as ball and stick and colored by atom type. Protein motifs involved in this binding site are displayed as ribbons and colored: LIG_FHA_1 motif (magenta); CLV_NDR_NDR_1 motif (blue); MOD_GlcNHglycan motif (yellow). Hydrogens are omitted for sake of clarity.
In particular, the E ring of the three ligands interacts with the consensus sequence of the same functional motif in all binding sites, colored in yellow in Figures 6, 7, and 9. Similar interactions are established by the polycyclic systems of 1 and NSC756093 with tubulin and GBP1, respectively; indeed, the conserved D ring targets the consensus sequence of same functional motif in both binding sites, colored in blue in Figures 7 and 9. In addition, also the smaller and quite similar R5s of 1 and NSC756093 (Table 2) target a consensus sequence motif present in both binding sites, colored in magenta in Figures 7 and 9. On the contrary specific ligand substructures such as the R5 substituent of 2 (Table 2), represented by a bulky glycosidic moiety, as well as, the A ring of 1, replaced by a 6-OCH3 group in NSC756093, target protein motifs which do not present shared consensus sequences with the other two complexes.
Taken together, these results indicate that the molecular skeleton composed by the fused rings B–D and the pendant phenyl ring E bind at the interface of two protein domains. This interface includes the consensus sequences of protein functional motifs, and the different selectivity toward a specific target depends on the introduced substituents. In this view, even minor modifications in the structure of the ligand may drive the binding to a different combination of protein motifs, i.e., to a different protein target. On the other hand, the same ligand could recognize a similar pattern of protein motifs at different protein targets. In this regard, it is noteworthy that etoposide is reported to be able to inhibit TopoIIβ also by binding at the ATPase domain of the protein.29 These observations are in agreement with the results of the biological investigation reported in the previous section. Indeed, although it resulted that some APTs could interact with cytoskeleton, only NSC756093 inhibited the GBP1:PIM1 interaction in vitro as well as in paclitaxel resistant cells. The structural features responsible for such a selectivity are discussed in the next paragraph.
Structure–Activity Relationships
NSC756093 is the sterically less hindered structure of the series, all other analogues presenting bulkier substituents at B and E rings (Table 1), and it is also the only tested 4-APT which resulted in being able to significantly inhibit GBP1:PIM1 interaction (Figure 2). This indicates that bulkier substituents at R1–R4 are not tolerated by the GBP1 binding pocket. Accordingly, in the calculated NSC756093/GBP1 complex, NSC756093 is almost completely embedded in a binding pocket within GBP1 structure, with only the D ring and the “northern” part of the structure, including the R5 substituent (Table 2), partially exposed to the solvent (Figure 10).
Figure 10.
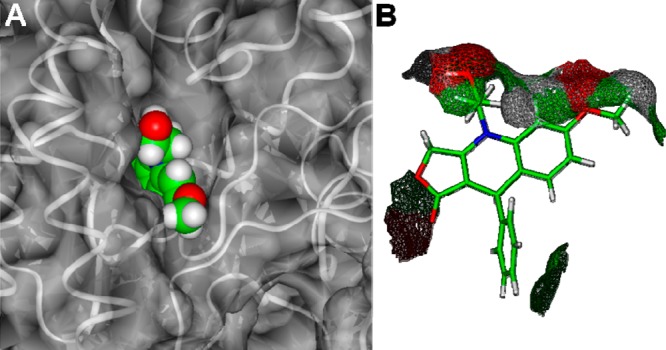
(A) NSC756093 bound to GBP1. The ligand is displayed as CPK and colored by atom type (C = green, O = red, N = blue, H = white), the solvent accessible surface of the protein is displayed as solid (transparency = 50%) and colored in white, protein backbone is displayed as white ribbon. (B) solvent accessible surface of NSC756093 in complex with GBP1.
To rationalize the inactivity of the other tested 4-APTs and at the same time validate our NSC756093/GBP1 interaction model, compounds bearing minimal extra-volume at R1–R4 as compared with NSC756093 (i.e., NSC756094, NSC756095, NSC756100, and NSC756108; Table 1) were subjected to an in-depth conformational analysis and the conformers within 5 kcal/mol from the global energy minimum (GM) were placed in the putative GBP1 binding site by superimposing their B–D rings on those of NSC756093 in the calculated complex with GBP1 (see Experimental Section for details). First, all possible orientations of the substituents were taken in to account and all possible steric clashes with the protein were analyzed (Supporting Information, Figure 12SI). It resulted that the substitution of the E ring at meta or para positions, (NSC756095 and NSC756094), or the introduction of an additional methoxy group at position 7 of the B ring (NSC756100), were not tolerated due to steric clashes with specific residues present in the corresponding GBP1 binding cleft (Supporting Information, Figure 12SIA,B). Also, the replacement of the methoxy group at position 6 with an ethyl chain, as in compound NSC756108, produced a steric clash with the protein (Supporting Information, Figure 12SIC). Indeed, even if at a first look the ethyl chain and the methoxy group could occupy a similar molecular volume, nevertheless, they are differently oriented with respect to the polycyclic system plane. The methoxy group, due to oxygen conjugation with the aromatic ring, lays on the same plane of the polycyclic system (sp2 like geometry). On the contrary, the ethyl chain projects out of the ring plane (sp3 geometry). In agreement with the observed steric clashes, the subsequent full energy minimization of all possible complexes of GBP1 with the conformers of NSC756094, NSC756095, NSC756100, and NSC756108, did not provide any solution with acceptable ligand conformation (i.e., ΔE from the global energy minimum <10 kcal/mol). These results account for the observed SARs, thus supporting the binding of NSC756093 to the hypothesized site of GBP1.
In conclusion, according to our molecular modeling studies, NSC756093 binds at the interface between the helical domain and the LG domain of GBP1 (Figure 8). This binding could affect all key protein domain interactions for the allosteric modulation of GBP1 conformations/functions. Indeed, the conformational equilibrium between the helical and the LG domain regulates GBP1 catalytic activity and oligomerization ability.30 In other GTPases (e.g., Ras, Rho) this regulation is performed by partner proteins (e.g., GAP and GEF).31 Analysis of the overall GBP1 conformational changes caused by the dynamic docking procedure (Figure 8), due to the disruption of key ionic interactions, showing a significant movement of the α4′ helix (LG domain) with respect to the α12 and α13 helices (helical domain), was observed. Thus, by affecting the interactions between the LG and the helical domains of GBP1, NSC756093 could drive the formation of GBP1 conformations not compatible with PIM1 binding. Although results obtained with the GBP1 mutants support our allosteric hypothesis (see next paragraph), a limitation of our study consists in the fact that the calculated GBP1 conformational change is not proved by any experimental data. Future studies will address this issue with the use of appropriate experimental techniques (e.g., circular dichroism).
GBP1Mutants
On the basis of the results obtained by our molecular modeling studies, to gain insights into the structure of the NSC756093 inhibition of GBP1:PIM1 interaction, a series of mutants was designed. A panel of mutants with single or double deletion of the coding sequence of human GBP1 was obtained. Eight mutants were prepared as described in Table 3. The spatial positioning of mutated residues within GBP1 structure is depicted in Supporting Information, Figure 13SI.
Table 3. Kinetic Analysis of a Panel of GBP1 Mutants for the GBP1:PIM1 Interaction Assessed with SPR Technology.
| protein/mutants | KD (nM) in PBST (1 μM GppNHpa) | KD (nM) in PBST (1 μM GDP) |
|---|---|---|
| GBP1 | 67 ± 20 | 30 ± 10 |
| R227E/K228E | >10000 | >10000 |
| R48A | 290 ± 21 | 21 ± 0.1 |
| K51A | 50 ± 10 | 26 ± 11 |
| D184A | 80 ± 5 | 77 ± 3 |
| Q72A | 62 ± 2 | 161 ± 17 |
| D103N | 21 ± 1 | 15 ± 0.1 |
| R227A/R228A | 137 ± 14 | 61 ± 4 |
Guanosine 5′-[β,γ-imido]triphosphate trisodium salt hydrate, nonhydrolyzable analogue of GTP.
The mutants were designed to mutate residues of the LG domain by playing a key role in the allosteric regulation of GBP1 structure/function, and binding experiments were performed using GDP and the GTP nonhydrolyzable analogue GppNHp (1 μM in PBST).
A complete absence of interaction was noticed only for the mutant R227E/K228E in both GTP and GDP conditions. R227 and K228 residues were reported to play a crucial role in GBP1 catalytic activity and homo-oligomerization ability.32 The positively charged side chains of R227 and K228 (α4′ helix, LG domain) are coupled with four negatively charged glutamate residues present on α12 and α13 helices (i.e., E556, E563, E568, and E575) (Figure 8A). As a consequence, when R227 and K228, are replaced with two negatively charged glutamate residues, as in the R227E/K228E GBP1 mutant, a complete decoupling of the LG and the helical domains is induced. A double mutation of the same residues (R227A/K228A), but with the hydrophobic residue alanine, is not able to generate the same disruptive effect on the protein:protein interaction.
Importantly, according to our docking results, NSC756093 also affected the ionic interactions involving K227 and R228 (Figure 8) and induced a dramatic change in the positioning of the α4′ helix (LG domain) and the α12 and α13 helices (helical domain) (Figure 8). Thus, these findings support the hypothesis that the cleft in which NSC756093 binds is an allosteric site capable of controlling the active conformation of GBP1 and its ability to interact with partners such as PIM1.
Conclusion
We have demonstrated that 4-APTs are more active in cancer cell lines less responsive to paclitaxel. In particular, compound NSC756093 is able to modulate the GBP1:PIM1 interaction, and this is the first study reporting the inhibition of such a system. The results of our investigation on the NSC756093 mechanism of action provide useful insights on the design of novel inhibitors of the GBP1:PIM1 interaction with higher specificity. After this additional step of optimization, it will be possible to move the experimentation to preclinical models of taxane resistance.
Experimental Section
Chemistry
Melting points were determined on a MEL-TEMP instrument and are uncorrected. IR spectra were recorded on a PerkinElmer Spectrum 100 FTIR spectrometer on ATS mode. 1H, COSY, 13C, DEPT45, DEPT90, DEPT135, and HETCOR NMR spectra were measured on a Bruker 400 Ultra Shield spectrometer using DMSO-d6 as solvent. All chemical shifts are reported in parts per million relative to tetramethylsilane. Coupling constants (J) are reported in Hz. The LC-MS data was taken on an Agilent 1200 series system with Agilent 6210 time-of-flight mass detector. Absorption spectra were obtained in DMSO, using DMSO as blank, with an Agilent 8453 absorption spectrometer. The purities of all of the tested compounds were >95% as estimated by HPLC.
General Synthesis of 4-Aza-2,3-didehydropodophyllotoxin Derivatives
These derivatives were synthesized by following previously reported method.13,14 An equimolar mixture of tetronic acid, substituted aniline, and aromatic aldehyde was dissolved in the minimum volume of ethanol. The reaction mixture was refluxed for 30–90 min. After cooling, the precipitate was filtered off, washed with minimal cold ethanol, and then recrystallized from ethanol to afford the desired compound. Characterization data (NMR, HRMS etc.) of compounds NSC750210–750213, 750716–750723, and 751499–751504 have been published earlier.13,14 We found that the synthesis of products where R1 is methoxy at the meta position produced regioisomeric products with some aromatic aldehydes as observed from NMR data, while all remaining aryl amino alcohols produced only one regioisomeric expected product.
5-(2-Hydroxyethyl)-9-(3-chlorophenyl)-6,9-dihydro-[1,3]dioxolo[4,5-g]furo[3,4-b]quinolin-8(5H)-one (NSC756083)
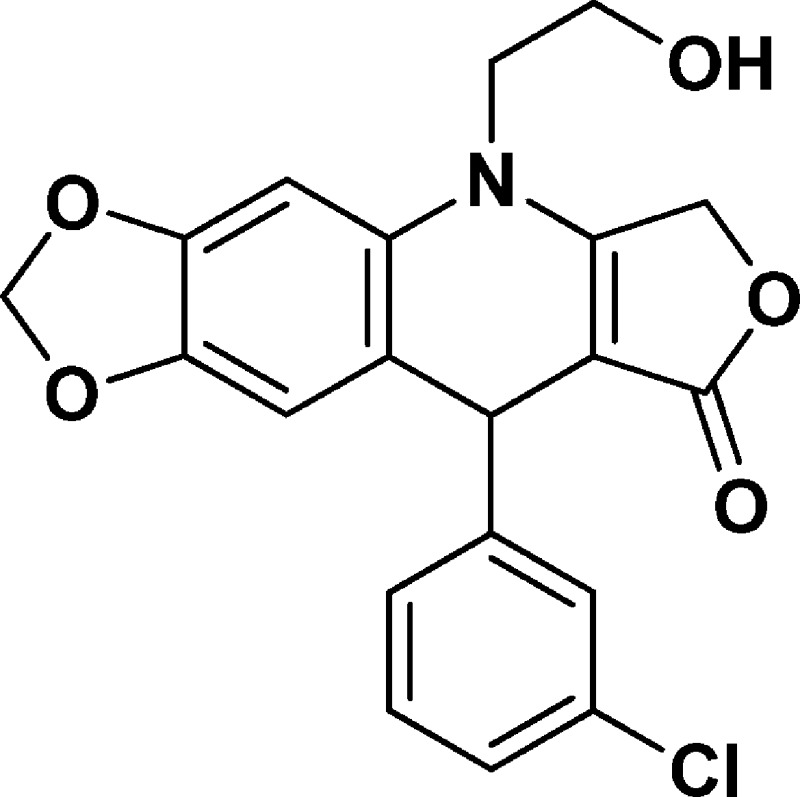
Yield: 78%. 1H NMR (DMSO-d6, 400 MHz): δ 3.56–3.86 (m, 4H), 4.96 (t, 1H), 5.03–5.05 (d, J = 8 Hz, 2H), 5.11 (s, 1H), 5.86–5.92 (m, 2H), 6.69 (s, 1H), 6.94 (s, 1H), 7.45–7.53 (m, 1H), 7.58–7.63 (m, 1H), 7.95–7.80 (m, 1H), 8.03–8.05 (m, 1H). 13C NMR (DMSO-d6, 100 MHz): δ 39.36, 48.22, 57.89, 65.95, 94.07, 96.51, 101.50, 110.12, 117.83, 121.48, 121.90, 129.93, 131.25, 134.52, 143.47, 147.27, 147.79, 148.84, 160.81, 172.07. LC-MS (ESI-TOF): m/z 386.0770 ([C20H16 Cl NO5 + H]+ calcd 386.0790).
4-(2-Hydroxyethyl)-10-(3-bromophenyl)-3,4,6,7,8,10-hexahydro-1H-cyclopenta[g]furo[3,4-b]quinolin-1-one (NSC756084)
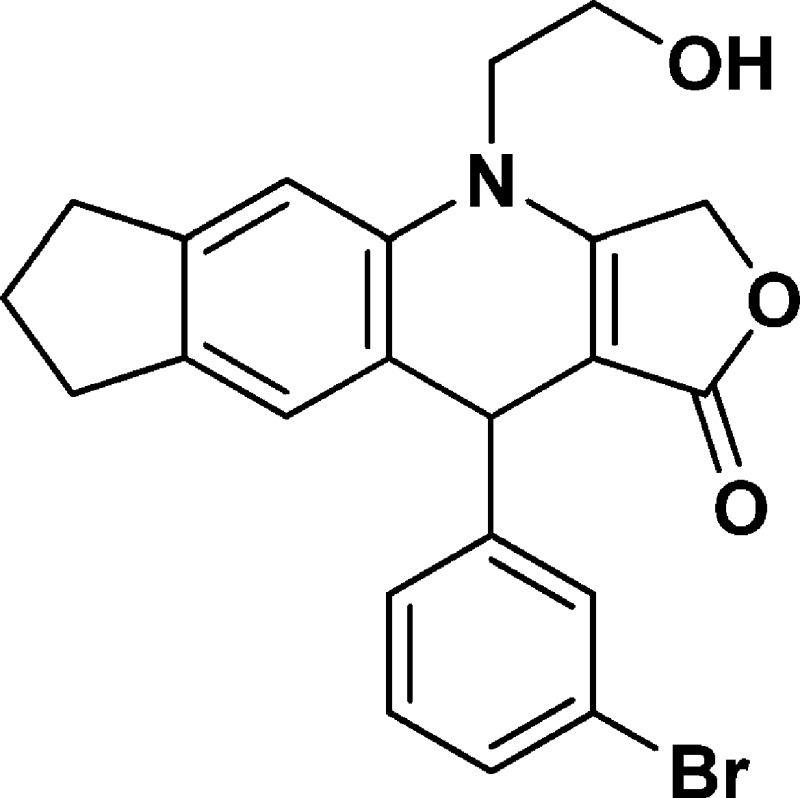
Yield: 70%. 1H NMR (DMSO-d6, 400 MHz): δ 1.90–2.00 (m, 2H), 2.61–2.77 (m, 2H), 2.80–2.84 (t, 2H), 3.65–3.78 (m, 3H), 3.80–3.92 (m, 1H), 4.98–5.06 (m, 2H), 5.10–5.17 (m, 2H), 6.92 (s, 1H), 7.11 (s, 1H), 7.17–7.25 (m, 2H), 7.30–7.38 (m, 1H), 7.42 (s, 1H). 13C NMR (DMSO-d6, 100 MHz): δ 25.13, 31.46, 32.33, 39.41, 48.23, 57.70, 65.84, 94.81, 110.17, 121.71, 123.84, 126.58, 126.87, 129.13, 130.19, 130.51, 134.81, 139.03, 143.73, 149.91, 160.82. LC-MS (ESI-TOF): m/z 426.0665 ([C22H20 Br NO3 + H]+ calcd 426.0699).
4-(2-Hydroxyethyl)-10-(3-chlorophenyl)-3,4,6,7,8,10-hexahydro-1H-cyclopenta[g]furo[3,4-b]quinolin-1-one (NSC756085)
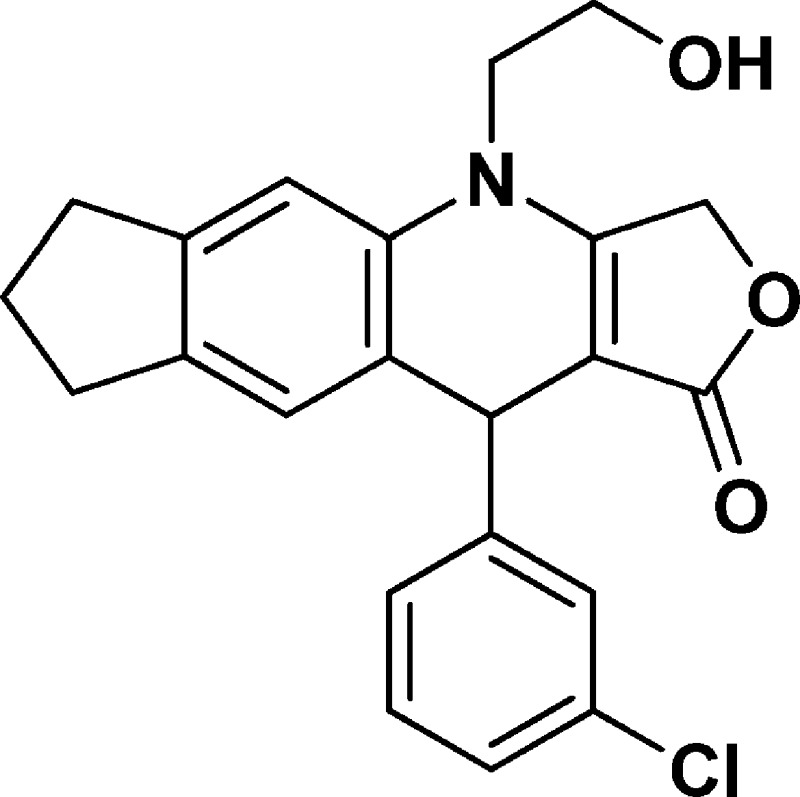
Yield: 79%. 1H NMR (DMSO-d6, 400 MHz): δ 1.90–2.00 (m, 2H), 2.61–2.77 (m, 2H), 2.80–2.84 (t, 2H), 3.65–3.80 (m, 3H), 3.82–3.92 (m, 1H), 4.98–5.08 (m, 2H), 5.09–5.19 (m, 2H), 6.93 (s, 1H), 7.11 (s, 1H), 7.17–7.23 (m, 2H), 7.25–7.31 (m, 2H). 13C NMR (DMSO-d6, 100 MHz): δ 25.13, 31.46, 32.33, 39.43, 47.89, 57.70, 65.85, 94.80, 110.16, 123.84, 126.23, 126.44, 126.57, 127.37, 130.16, 132.96, 134.81, 139.02, 143.72, 149.65, 160.82. LC-MS (ESI-TOF): m/z 382.1206 ([C22H20 Cl NO3 + H]+ calcd 382.1204).
4-(2-Hydroxyethyl)-10-(3,4-dichlorophenyl)-3,4,6,7,8,10-hexahydro-1H-cyclopenta[g]furo[3,4-b]quinolin-1-one (NSC756086)
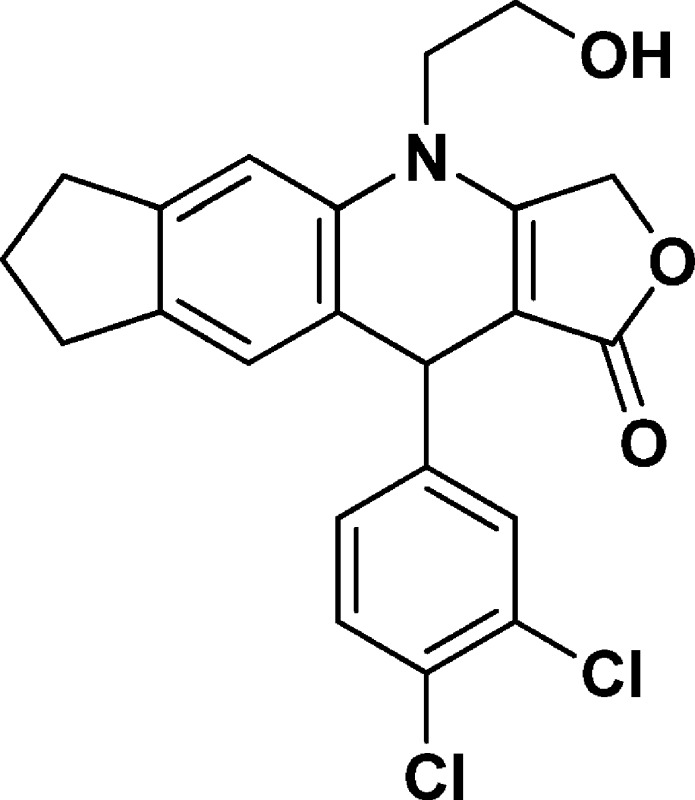
Yield: 58%. 1H NMR (DMSO-d6, 400 MHz): δ 1.90–2.01 (m, 2H), 2.65–2.75 (m, 2H), 2.80–2.84 (t, 2H), 3.65–3.78 (m, 3H), 3.85–3.90 (m, 1H), 5.00–5.06 (m, 2H), 5.10–5.16 (m, 2H), 6.92 (s, 1H), 7.12 (s, 1H), 7.19–7.22 (m, 1H), 7.49–7.51 (m, 2H). 13C NMR (DMSO-d6, 100 MHz): δ 25.13, 31.44, 32.33, 39.43, 47.91, 57.67, 65.92, 94.46, 110.27, 123.46, 126.57, 128.10, 128.91, 129.49, 130.51, 130.87, 134.77, 139.14, 143.89, 148.16, 160.95, 172.09. LC-MS (ESI-TOF): m/z 416.0803 ([C22H19 Cl2 NO3 + H]+ calcd 416.0815).
6-(2-Hydroxyethyl)-10-(bromophenyl)-2,3,7,10-tetrahydro-[1,4]dioxino[2,3-g]furo[3,4-b]quinolin-9(6H)-one (NSC756087)
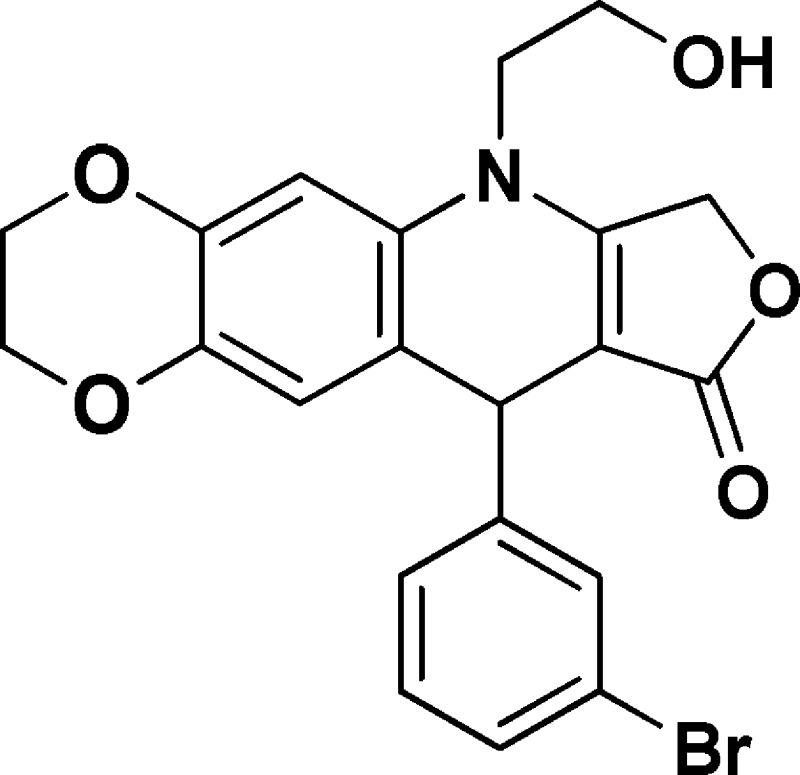
Yield: 70%. 1H NMR (DMSO-d6, 400 MHz): δ 3.62–3.75 (m, 3H), 3.76–3.85 (m, 1H), 4.13–4.18 (m, 2H), 4.18–4.26 (m, 2H), 4.94 (s, 1H), 5.02–5.18 (m, 3H), 6.57 (s, 1H), 6.76 (s, 1H), 7.18–7.25 (m, 2H), 7.31–7.38 (m, 1H), 7.43 (s, 1H). 13C NMR (DMSO-d6, 100 MHz): δ 39.11, 48.03, 57.70, 63.95, 64.24, 65.84, 94.15, 103.11, 118.80, 118.87, 121.72, 126.76, 129.17, 130.13, 130.32, 130.51, 139.48, 142.62, 149.60, 160.65, 172.15. LC-MS (ESI-TOF): m/z 444.0404 ([C21H18 Br NO5 + H]+ calcd. 444.0441).
6-(2-Hydroxyethyl)-10-(3-chlorophenyl)-2,3,7,10-tetrahydro-[1,4]dioxino[2,3-g]furo[3,4-b]quinolin-9(6H)-one (NSC756088)
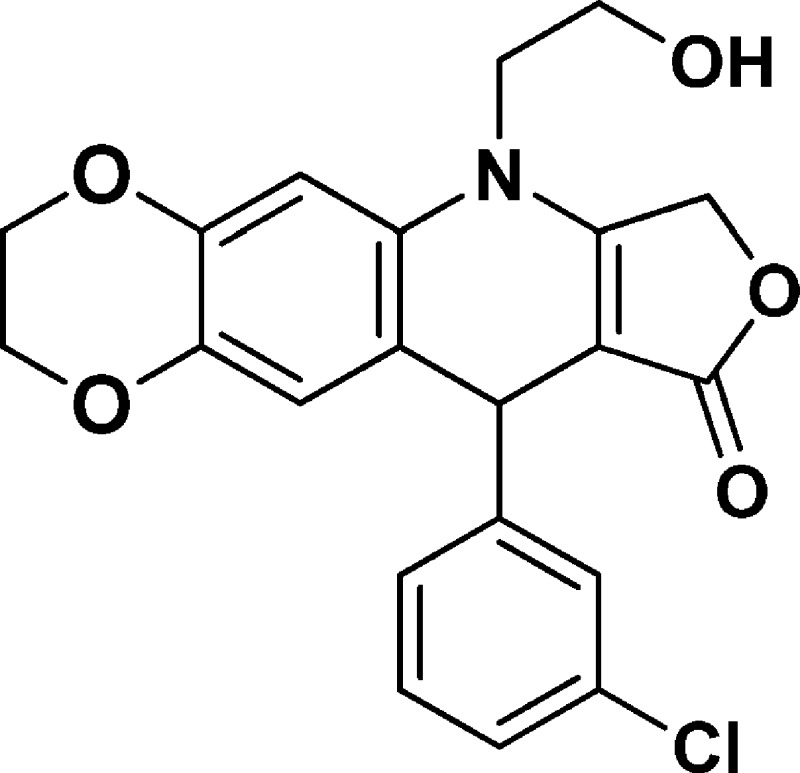
Yield: 61%. 1H NMR (DMSO-d6, 400 MHz): δ 3.62–3.75 (m, 3H), 3.76–3.85 (m, 1H), 4.13–4.18 (m, 2H), 4.18–4.26 (m, 2H), 4.95 (s, 1H), 5.00–5.17 (m, 3H), 6.57 (s, 1H), 6.76 (s, 1H), 7.16–7.24 (m, 2H), 7.25–7.32 (m, 2H). 13C NMR (DMSO-d6, 100 MHz): δ 39.14, 48.02, 57.70, 63.95, 64.24, 65.84, 94.14, 103.10, 118.79, 118.86, 126.26, 126.34, 127.29, 130.17, 130.33, 132.97, 139.48, 142.61, 149.34, 160.64, 172.14. LC-MS (ESI-TOF): m/z 400.0931 ([C21H18 Cl NO5 + H]+ calcd 400.0946).
6-(2-Hydroxyethyl)-10-(3,4-dichlorophenyl)-2,3,7,10-tetrahydro-[1,4]dioxino[2,3-g]furo[3,4-b]quinolin-9(6H)-one (NSC756089)
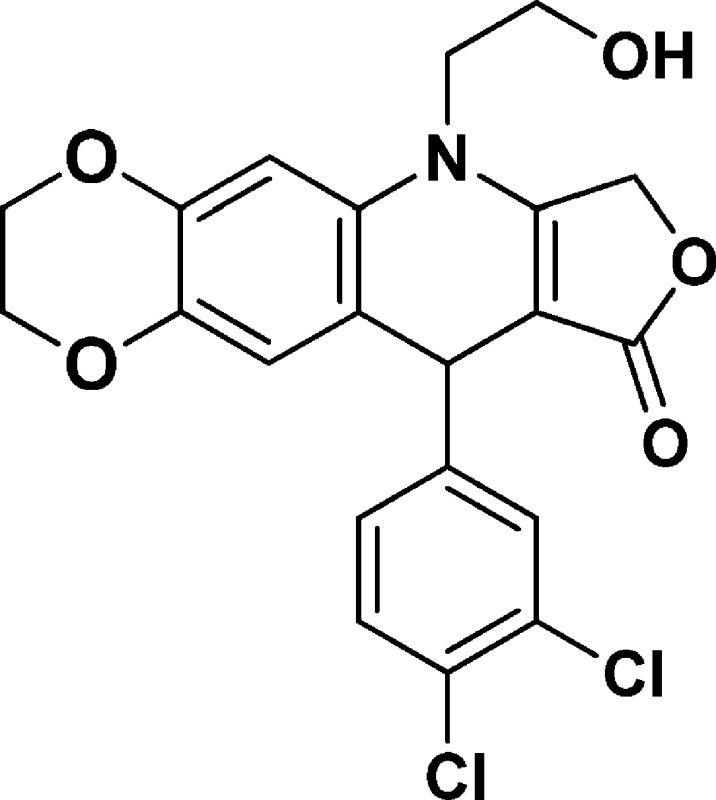
Yield: 70%. 1H NMR (DMSO-d6, 400 MHz): δ 3.62–3.83 (m, 4H), 4.08–4.30 (m, 4H), 4.93–5.20 (m, 4H), 6.58 (s, 1H), 6.78 (s, 1H), 7.19–7.21 (d, J = 8 Hz, 1H), 7.50 (s, 2H). 13C NMR (DMSO-d6, 100 MHz): δ 38.15, 48.05, 57.69, 63.95, 64.25, 65.91, 93.84, 103.21, 118.44, 118.78, 127.98, 128.96, 129.41, 130.31, 130.50, 130.90, 139.57, 142.73, 147.83, 160.75, 172.12. LC-MS (ESI-TOF): m/z 456.0373 ([C21H17 Cl2 NO5 + Na]+ calcd 456.0376).
4-(2-Hydroxyethyl)-6-methoxy-9-(3,4,5-trimethoxyphenyl)-4,9-dihydrofuro[3,4-b]quinolin-1(3H)-one (NSC756090)
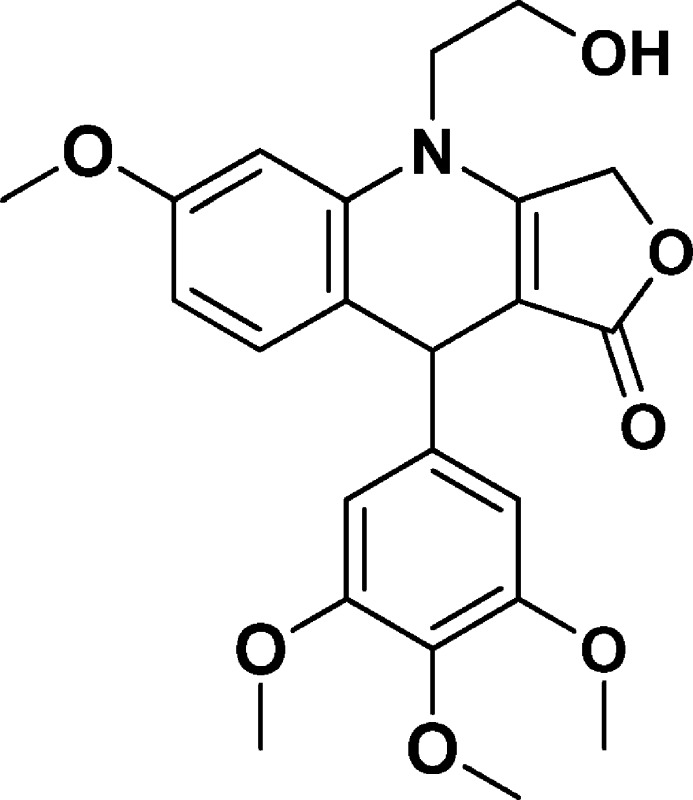
Yield: 54%. 1H NMR (DMSO-d6, 400 MHz): δ 3.58 (s, 3H), 3.65–3.72 (m, 10H), 3.74 (s, 3H), 4.85 (s, 1H), 4.98–4.52 (m, 1H), 5.06–5.19 (q, 2H), 6.51 (s, 2H), 6.59–6.62 (m, 1H), 6.71–6.72 (d, J = 4 Hz, 1H), 7.11–7.13 (d, J = 8 Hz, 1H). 13C NMR (DMSO-d6, 100 MHz): δ 38.86, 47.70, 55.23, 55.73, 57.85, 59.79, 65.83, 96.13, 100.35, 104.53, 108.64, 118.97, 131.82, 135.85, 137.07, 143.09, 152.72, 158.68, 160.83, 172.19. LC-MS (ESI-TOF): m/z 428.1699 ([C23H25 NO7 + H]+ calcd 428.1704).
9-(3,4-Dimethoxyphenyl)-4-(2-hydroxyethyl)-6-methoxy-4,9-dihydrofuro[3,4-b]quinolin-1(3H)-one (NSC756091)
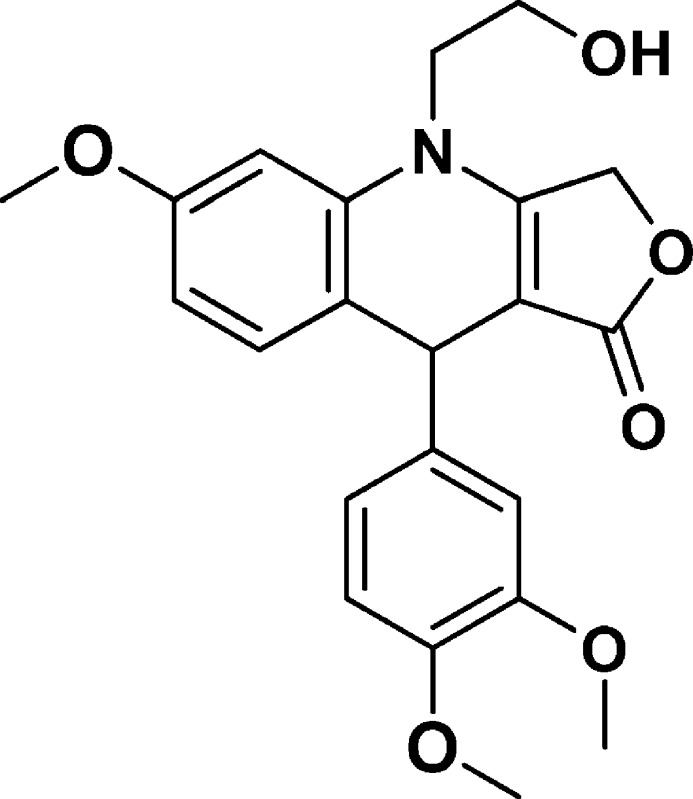
Yield: 48%. 1H NMR (DMSO-d6, 400 MHz): δ 3.67–3.72 (m, 9H), 3.73 (s, 3H), 3.83–3.92 (m, 1H), 4.57–5.16 (m, 4H), 6.57–6.60 (m, 1H), 6.64–6.67 (m, 1H), 6.69–6.70 (d, J =J = 4 Hz, 1H), 6.78–6.80 (d, J = 8 Hz, 1H), 6.83–6.84 (d, J = 4 Hz, 1H), 7.02–7.05 (m, 1H). 13C NMR (DMSO-d6, 100 MHz): δ 38.45, 47.76, 55.23, 55.38, 55.49, 57.81, 65.75, 96.41, 100.25, 108.57, 111.43, 111.81, 119.17, 119.28, 131.94, 137.20, 140.18, 147.21, 148.54, 158.60, 160.45, 172.18. LC-MS (ESI-TOF): m/z 398.1592 ([C22H23 NO6 + H]+ calcd 398.1598).
4-(2-Hydroxyethyl)-6-methoxy-9-(3-methoxyphenyl)-4,9-dihydrofuro[3,4-b]quinolin-1(3H)-one (NSC756092)
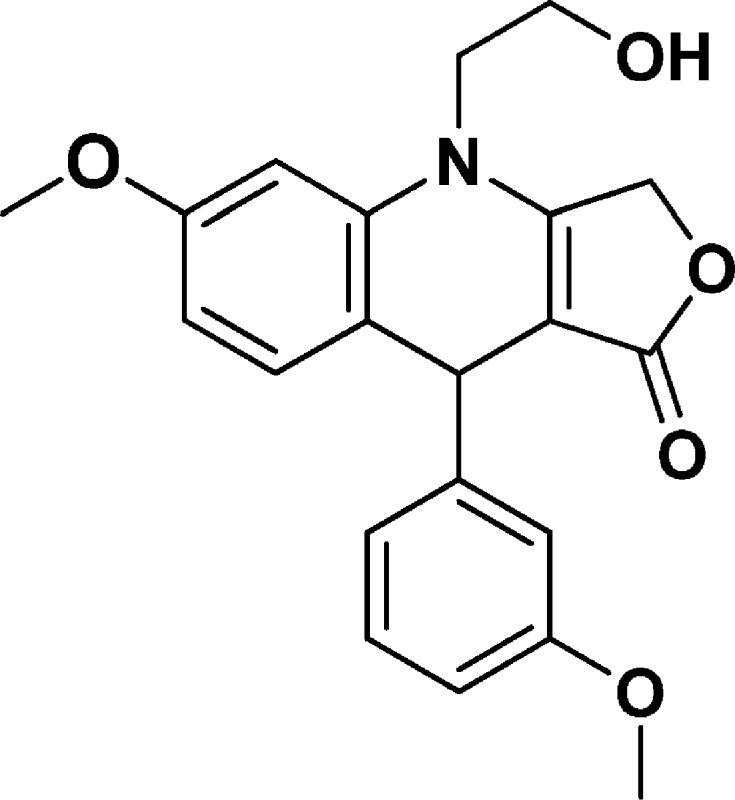
Yield: 52% [regio-isomeric mixture]. 1H NMR (400 MHz, acetonitrile-d3) δ 3.74–3.67 (m, 1H), 3.75 (s, 3H), 3.79 (s, 3H), 3.91–3.79 (m, 4H), 4.95 (s, 1H), 5.10–4.97 (m, 2H), 6.59 (dd, J = 8.5, 2.5 Hz, 1H), 6.65 (d, J = 2.5 Hz, 1H), 6.75 (ddd, J = 8.2, 2.6, 0.9 Hz, 1H), 6.81 (dd, J = 2.6, 1.7 Hz, 1H), 6.85 (dt, J = 7.6, 1.2 Hz, 1H), 7.04 (dd, J = 8.4, 0.8 Hz, 1H), 7.21 (t, J = 7.9 Hz, 1H). 13C NMR (101 MHz, CD3CN) δ 40.44, 48.86, 55.71, 56.03, 59.37, 67.08, 101.29, 109.46, 112.32, 114.58, 120.03, 120.91, 130.38, 133.01, 138.59, 150.00, 160.17, 160.77, 161.48, 173.56. LC-MS (ESI-TOF): m/z 368.1491 ([C21H21 NO5 + H]+ calcd 368.1492).
4-(2-Hydroxyethyl)-6-methoxy-9-phenyl-4,9-dihydrofuro[3,4-b]quinolin-1(3H)-one (NSC756093)
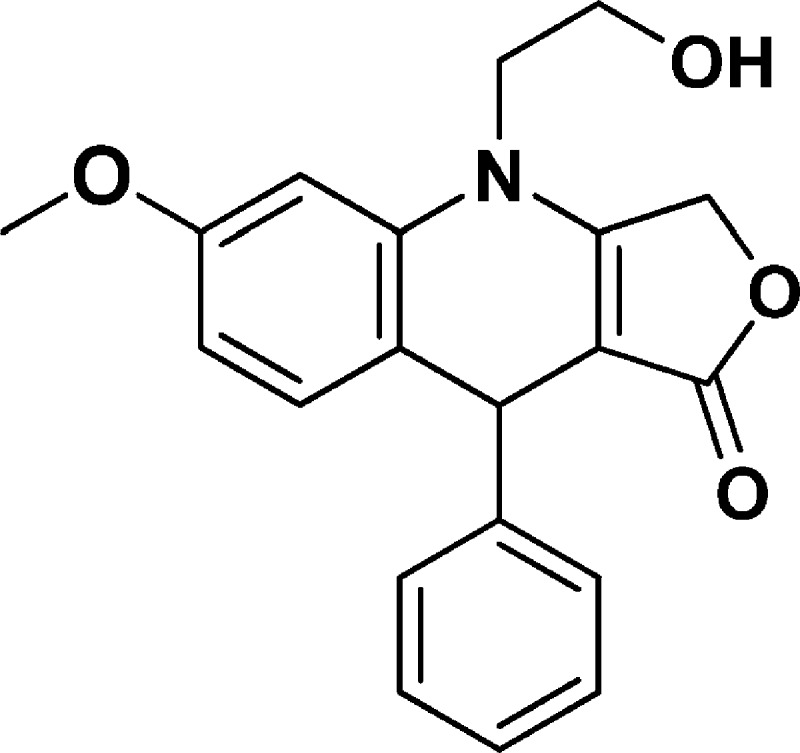
Yield: 50%. 1H NMR (DMSO-d6, 400 MHz): δ 3.67–3.71 (m, 3H), 3.73 (s, 3H), 3.81–3.92 (m, 1H), 4.93–5.16 (m, 4H), 6.56–6.59 (m, 1H), 6.70–6.71 (d, J = 4 Hz, 1H), 6.96–7.01 (m, 1H), 7.12–7.18 (m, 1H), 7.20–7.28 (m, 4H). 13C NMR (DMSO-d6, 100 MHz): δ 38.95, 47.85, 55.24, 57.77, 65.81, 96.27, 100.38, 108.62, 126.13, 127.54, 128.22, 132.05, 137.40, 158.68, 160.56, 172.0. LC-MS (ESI-TOF): m/z 338.1382 ([C20H19 NO4 + H]+ calcd 338.1387).
4-(2-Hydroxyethyl)-6-methoxy-9-(4-methoxyphenyl)-4,9-dihydrofuro[3,4-b]quinolin-1(3H)-one (NSC756094)
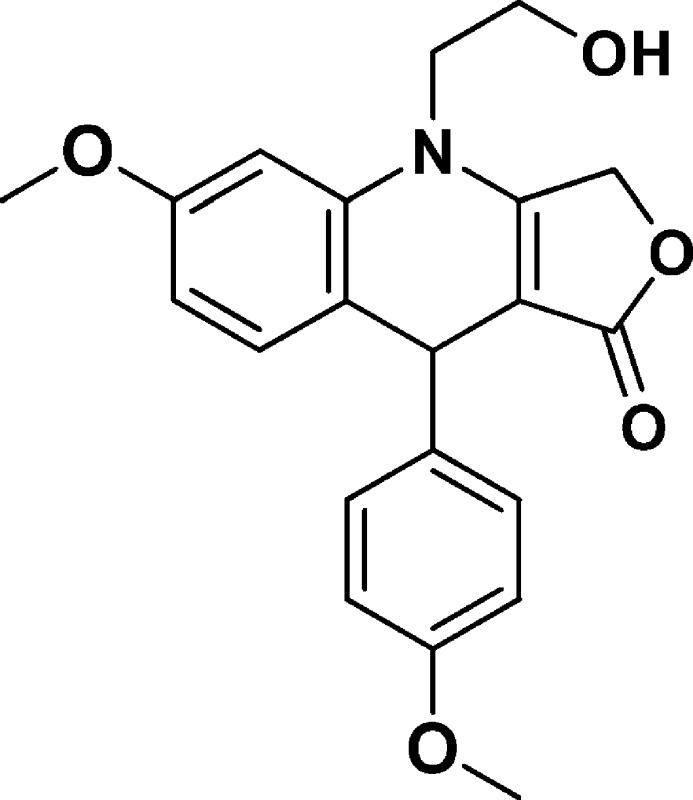
Yield: 52% [regio-isomeric mixture]. 1H NMR (400 MHz, acetonitrile-d3) δ 7.25–7.09 (m, 2H), 7.00 (dd, J = 8.5, 0.8 Hz, 1H), 6.90–6.77 (m, 2H), 6.64 (d, J = 2.4 Hz, 1H), 6.59 (dd, J = 8.5, 2.5 Hz, 1H), 5.11–4.95 (m, 2H), 4.93 (s, 1H), 3.88–3.80 (m, 3H), 3.78 (s, 3H), 3.76 (s, 3H), 3.75–3.62 (m, 2H). 13C NMR (101 MHz, CD3CN): δ 172.71, 160.28, 159.17, 158.31, 139.88, 137.72, 132.18, 128.72, 119.63, 113.66, 108.59, 100.28, 97.40, 66.09, 58.50, 55.11, 54.83, 47.93, 38.69. LC-MS (ESI-TOF): m/z 368.1485 ([C21H21 NO5 + H]+ calcd 368.1492).
9-(3-Bromophenyl)-4-(2-hydroxyethyl)-6-methoxy-4,9-dihydrofuro[3,4-b]quinolin-1(3H)-one (NSC756095)
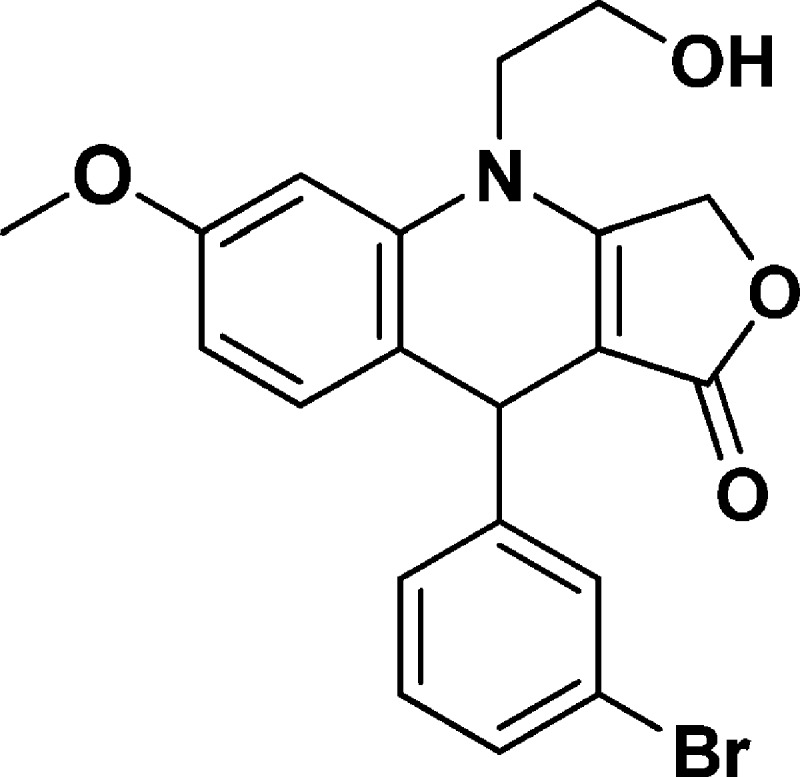
Yield: 51%. 1H NMR (CD3CN, 400 MHz): δ 3.79 (s, 3H), 3.80–3.82 (m, 4H), 4.82–5.03 (m, 4H), 6.59–6.62 (m, 1H), 6.55–6.66 (d, J = 4 Hz, 1H), 6.98–7.00 (d, J = 8 Hz, 1H), 7.22–7.27 (m, 2H), 7.34–7.38 (m, 1H), 7.42–7.43 (m, 1H). 13C NMR (CD3CN, 100 MHz): δ 38.95, 47.68, 54.83, 58.10, 65.93, 100.24, 108.46, 118.07, 121.74, 126.54, 129.14, 129.94, 130.02, 131.93, 137.50, 149.51, 159.13, 160.39, 172.23. LC-MS (ESI-TOF): m/z 438.0291 ([C20H18 Br NO4 + Na]+ calcd 438.0311).
4-(2-Hydroxyethyl)-6,7-dimethoxy-9-(3,4,5-trimethoxyphenyl)-4,9-dihydrofuro[3,4-b]quinolin-1(3H)-one (NSC756097)
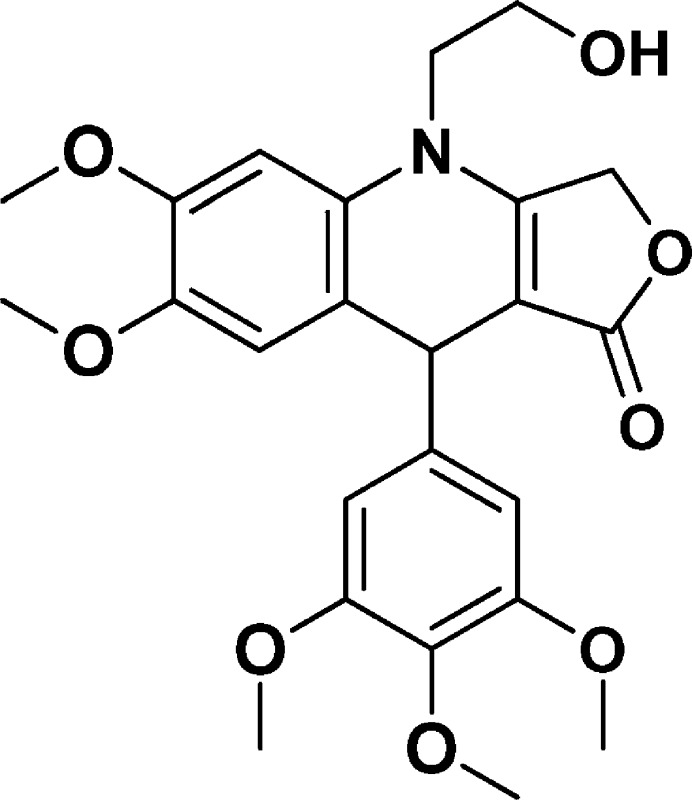
Yield: 45%. 1H NMR (DMSO-d6, 400 MHz): δ 3.59 (s, 3H), 3.62 (s, 4H), 3.70 (s, 8H), 3.78 (s, 3H), 4.85 (s, 1H), 4.96–4.98 (t, 1H), 5.04–5.19 (m, 2H), 6.55 (s, 2H), 6.76 (s, 1H), 6.82 (s, 1H). 13C NMR (DMSO-d6, 100 MHz): δ 39.54, 47.78, 55.75, 55.91, 55.96, 58.14, 59.80, 65.73, 94.70, 99.49, 104.49, 114.33, 118.15, 129.77, 135.84, 142.79, 145.12, 148.08, 152.72, 160.69, 172.39. LC-MS (ESI-TOF): m/z 458.1805 ([C24H27 NO8 + H]+ calcd 458.1809).
9-(3,4-Dimethoxyphenyl)-4-(2-hydroxyethyl)-6,7-dimethoxy-4,9-dihydrofuro[3,4-b]quinolin-1(3H)-one (NSC756098)
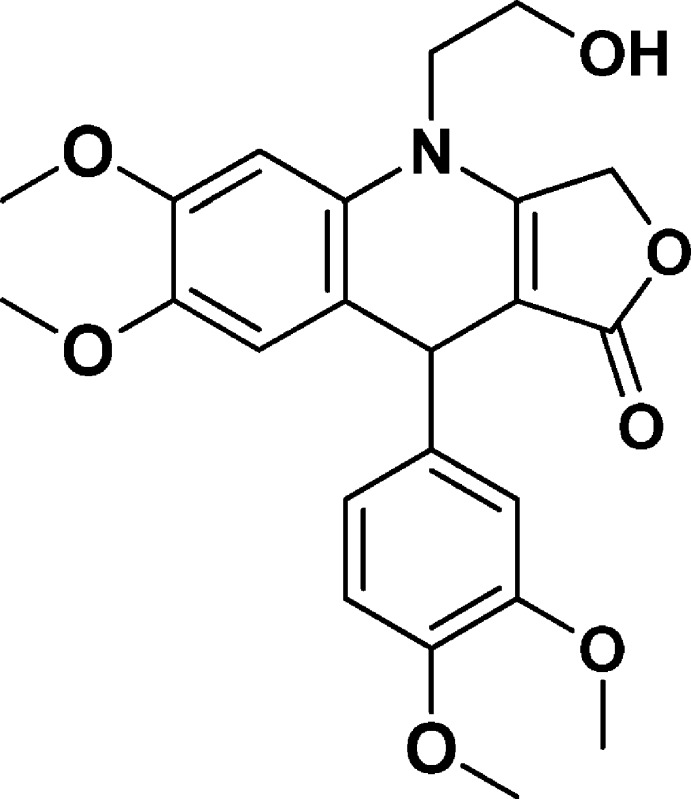
Yield: 64%. 1H NMR (DMSO-d6, 400 MHz): δ 3.61 (s, 3H), 3.68–3.69 (2s, 9H), 3.78 (s, 3H), 3.88–3.40 (m, 1H), 4.85 (s, 1H), 4.99–5.14 (m, 3H), 6.66–6.69 (m, 1H), 6.72 (s, 1H), 6.74 (s, 1H), 6.78–6.80 (d, J = 8 Hz, 1H), 6.87–6.88 (d, J = 4 Hz, 1H). 13C NMR (DMSO-d6, 100 MHz): δ 38.90, 47.87, 55.40, 55.43, 55.86, 55.95, 58.11, 65.66, 95.03, 99.44, 111.38, 111.68, 114.42, 118.34, 119.20, 129.33, 139.88, 145.08, 147.20, 148.00, 148.53, 160.29, 172.36. LC-MS (ESI-TOF): m/z 428.1704 ([C23H25 NO7 + H]+ calcd 428.1704).
4-(2-Hydroxyethyl)-6,7-dimethoxy-9-(3-methoxyphenyl)-4,9-dihydrofuro[3,4-b]quinolin-1(3H)-one (NSC756099)
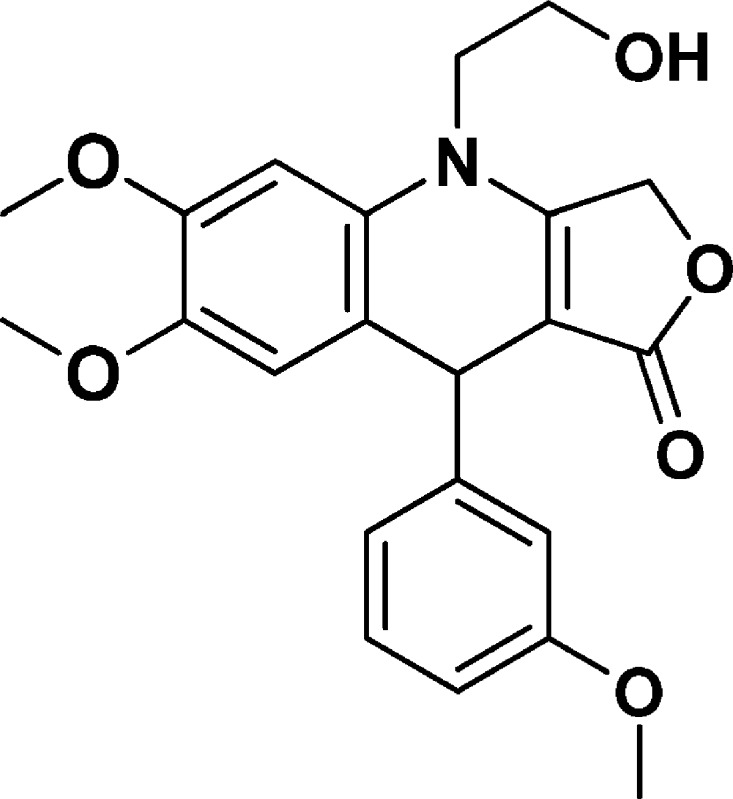
Yield: 68%. 1H NMR (DMSO-d6, 400 MHz): δ 3.60 (s, 3H), 3.69–3.73 (m, 5H), 3.79 (s, 3H), 3.87–3.98 (m, 1H), 4.90 (s, 1H), 5.00–5.15 (m, 3H), 6.68–6.73 (m, 2H), 6.76 (s, 1H), 6.78–6.81 (m, 2H), 7.13–7.17 (m, 1H). 13C NMR (DMSO-d6, 100 MHz): δ 39.38, 47.91, 54.84, 55.89, 55.95, 58.10, 59.72, 65.70, 94.84, 99.54, 111.19, 113.53, 114.48, 117.85, 119.77, 129.22, 130.11, 145.11, 148.12, 148.54, 159.20, 160.40, 172.28. LC-MS (ESI-TOF): m/z 398.1596 ([C22H23 NO6 + H]+ calcd 398.1598).
4-(2-Hydroxyethyl)-6,7-dimethoxy-9-phenyl-4,9-dihydrofuro[3,4-b]quinolin-1(3H)-one (NSC756100)
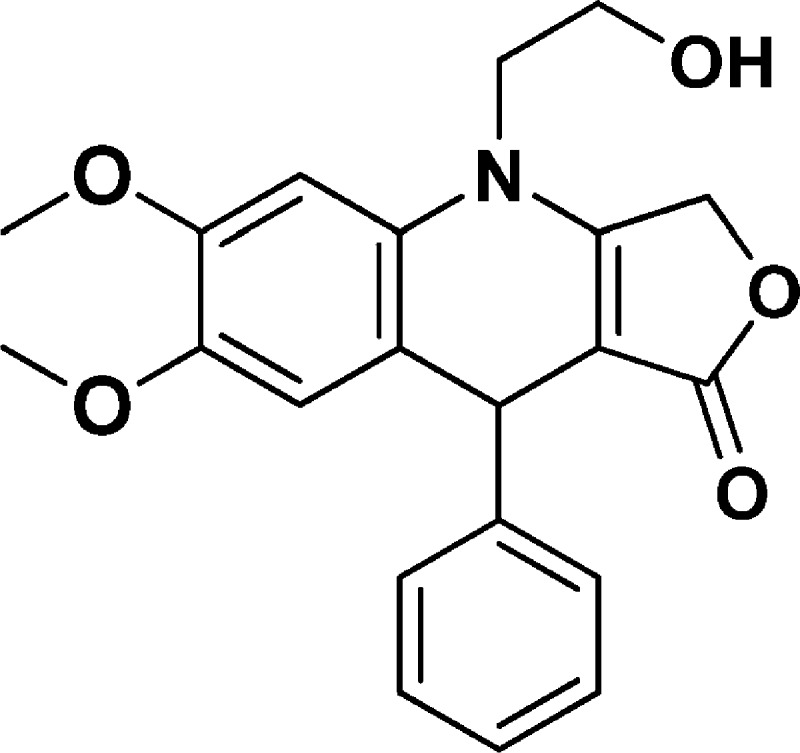
Yield: 60%. 1H NMR (DMSO-d6, 400 MHz): δ 3.51 (s, 3H), 3.60–3.73 (m, 6H), 3.78–3.90 (m, 1H), 4.85 (s, 1H), 4.95–5.06 (m, 3H), 6.57 (s, 1H), 6.68 (s, 1H), 7.03–7.10 (m, 1H), 7.13–7.20 (m, 4H). 13C NMR (DMSO-d6, 100 MHz): δ 39.38, 47.91, 55.87, 55.95, 58.08, 65.71, 94.94, 99.55, 114.53, 117.96, 126.16, 127.50, 128.20, 130.17, 145.12, 146.98, 148.09, 160.36, 172.28. LC-MS (ESI-TOF): m/z 368.1490 ([C21H21 NO5 + H]+ calcd 368.1492).
4-(2-Hydroxyethyl)-6,7-dimethoxy-9-(4-methoxyphenyl)-4,9-dihydrofuro[3,4-b]quinolin-1(3H)-one (NSC756102)
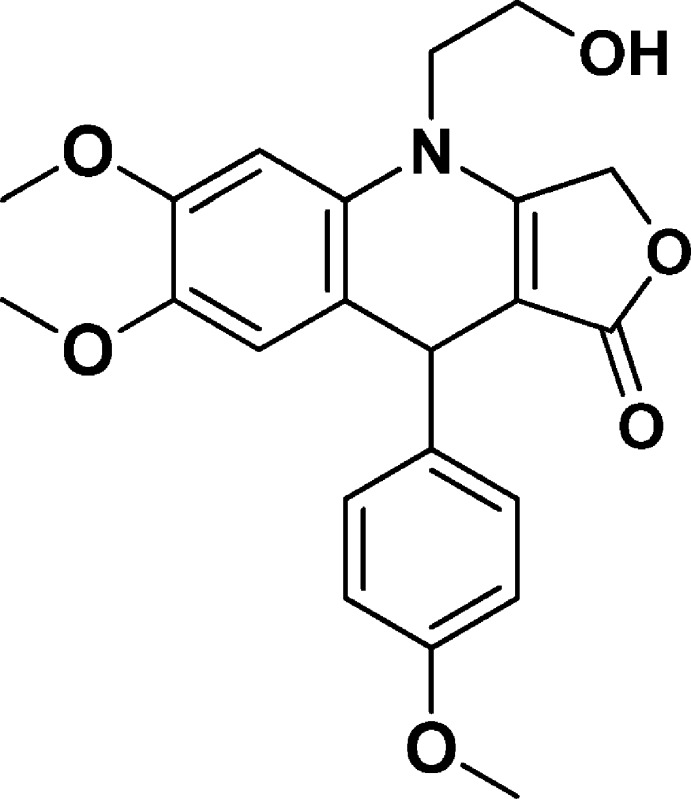
Yield: 74%. 1H NMR (DMSO-d6, 400 MHz): δ 3.59 (s, 3H), 3.67–3.83 (m, 9H), 3.84–3.95 (m, 1H), 4.87 (s, 1H), 5.02–5.15 (m, 3H), 6.63 (s, 1H), 6.74 (s, 1H), 6.77–6.83 (m, 2H), 7.11–7.15 (m, 2H). 13C NMR (DMSO-d6, 100 MHz): δ 38.60, 47.89, 54.91, 55.88, 55.96, 58.08, 65.64, 95.19, 99.50, 113.55, 114.56, 118.35, 128.45, 130.12, 139.41, 145.11, 148.03, 157.61, 160.10, 172.30. LC-MS (ESI-TOF): m/z 398.1597 ([C22H23 NO6 + H]+ calcd 398.1598).
9-(3-Bromophenyl)-4-(2-hydroxyethyl)-6,7-dimethoxy-4,9-dihydrofuro[3,4-b]quinolin-1(3H)-one (NSC756103)
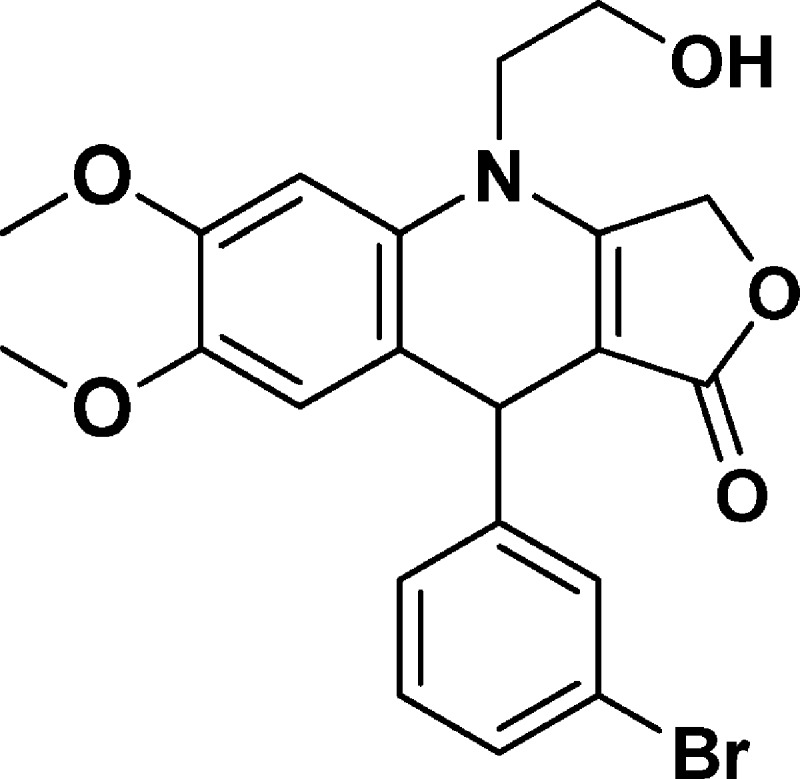
Yield: 70%. 1H NMR (DMSO-d6, 400 MHz): δ 3.60 (s, 3H), 3.68–3.78 (m, 2H), 3.79 (s, 4H), 3.85–3.95 (m, 1H), 4.98 (s, 1H), 5.02–5.16 (m, 3H), 6.67 (s, 1H), 6.77 (s, 1H), 7.18–7.25 (m, 2H), 7.32–7.38 (m, 1H), 7.41–7.45 (m, 1H). 13C NMR (DMSO-d6, 100 MHz): δ 39.26, 47.97, 55.93, 58.02, 65.82, 94.38, 99.64, 114.48, 117.12, 121.68, 126.76, 129.14, 130.14, 130.19, 130.45, 145.22, 148.29, 149.48, 160.61, 172.20. LC-MS (ESI-TOF): m/z 446.0528 ([C21H20 Br NO5 + H]+ calcd 446.0598).
9-(3-Chlorophenyl)-4-(2-hydroxyethyl)-6,7-dimethoxy-4,9-dihydrofuro[3,4-b]quinolin-1(3H)-one (NSC756104)
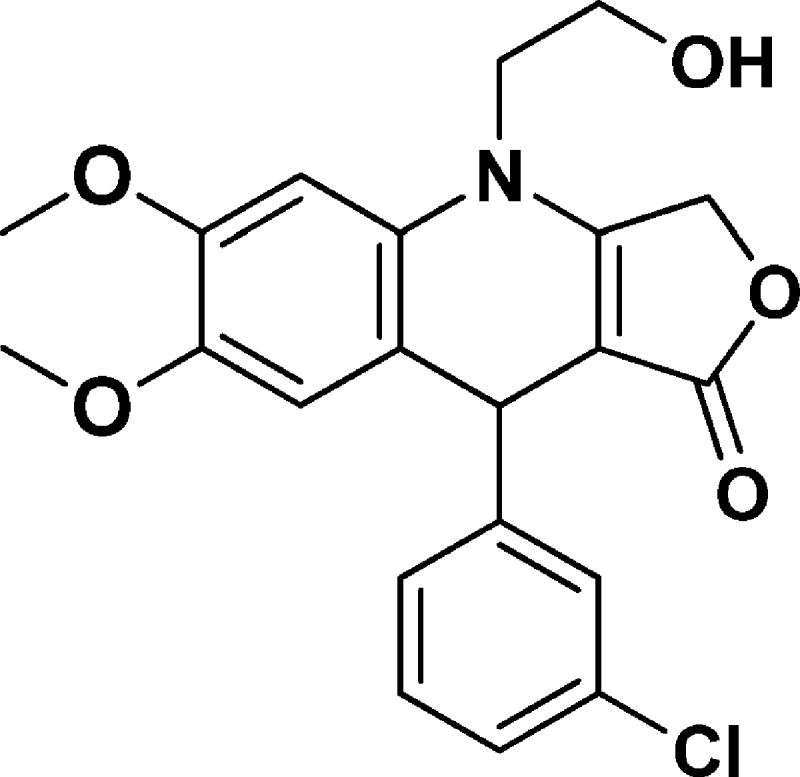
Yield: 72%. 1H NMR (DMSO-d6, 400 MHz): δ 3.60 (s, 3H), 3.68–3.77 (m, 2H), 3.79 (s, 4H), 3.87–3.95 (m, 1H), 4.99 (s, 1H), 5.02–5.16 (m, 3H), 6.67 (s, 1H), 6.77 (s, 1H), 7.18–7.25 (m, 2H), 7.26–7.30 (m, 2H). 13C NMR (DMSO-d6, 100 MHz): δ 39.26, 47.97, 55.92, 58.03, 65.83, 94.37, 99.64, 114.45, 117.13, 126.25, 126.35, 127.30, 130.11, 130.18, 132.93, 145.22, 148.28, 149.24, 160.62, 172.21. LC-MS (ESI-TOF): m/z 402.1080 ([C21H20 Cl NO5 + H]+ calcd 402.1103).
9-(3,4-Dichlorophenyl)-4-(2-hydroxyethyl)-6,7-dimethoxy-4,9-dihydrofuro[3,4-b]quinolin-1(3H)-one (NSC756105)
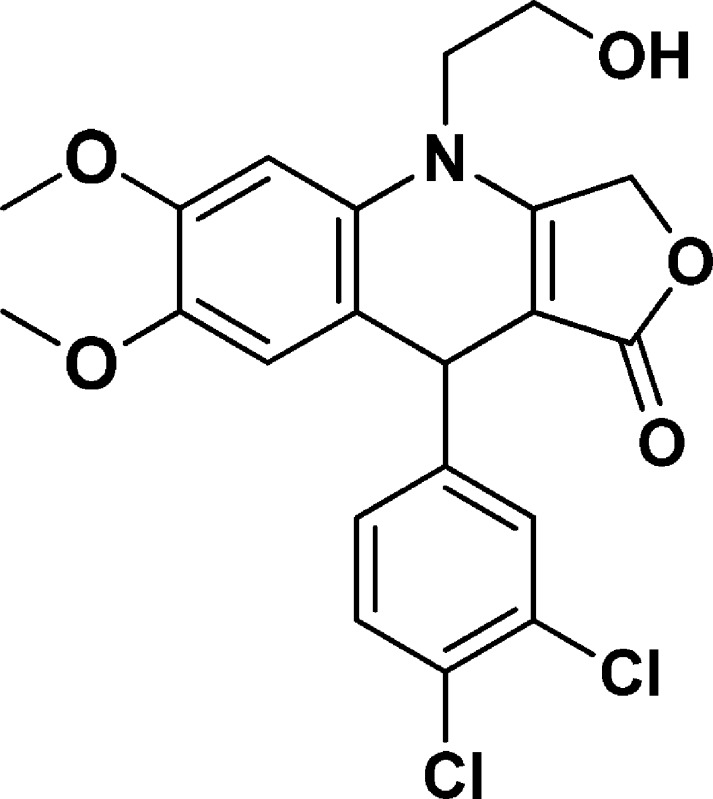
Yield: 71%. 1H NMR (DMSO-d6, 400 MHz): δ 3.60 (s, 3H), 3.68–3.77 (m, 2H), 3.79 (s, 4H), 3.87–3.95 (m, 1H), 4.99 (s, 1H), 5.02–5.06 (m, 2H), 5.08–5.15 (m, 2H), 6.67 (s, 1H), 6.77 (s, 1H), 7.19–7.22 (m, 1H), 7.48–7.53 (m, 2H). 13C NMR (DMSO-d6, 100 MHz): δ 38.55, 47.98, 55.92, 58.00, 65.90, 94.06, 99.69, 114.37, 116.70, 128.00, 128.88, 129.42, 130.14, 130.46, 130.83, 145.29, 147.74, 148.37, 160.73, 172.18. LC-MS (ESI-TOF): m/z 436.0646 ([C21H19 Cl2 NO5 + H]+ calcd 436.0713).
6-Ethyl-4-(2-hydroxyethyl)-9-(3,4,5-trimethoxyphenyl)-4,9-dihydrofuro[3,4-b]quinolin-1(3H)-one (NSC756106)
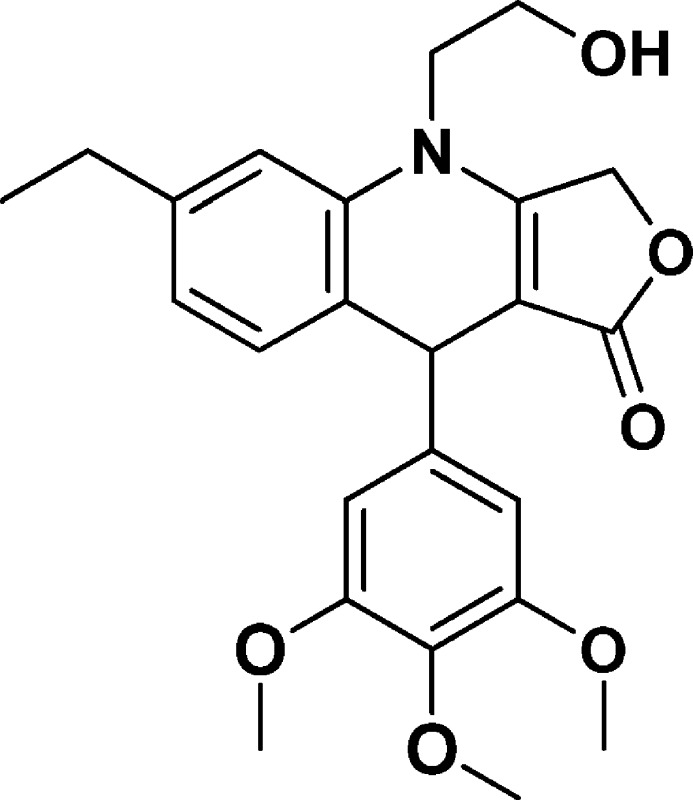
Yield: 54%. 1H NMR (DMSO-d6, 400 MHz): δ 1.14–1.18 (t, 3H), 2.53–2.59 (q, 2H), 3.59–3.72 (m, 12H), 3.95–4.02 (m, 1H), 4.88 (s, 1H), 4.99 (bs, 1H), 5.06–5.21 (q, 2H), 6.53 (s, 2H), 6.83–6.85 (d, J = 8 Hz, 1H), 7.04 (s, 1H), 7.12–7.14 (d, J = 8 Hz, 1H). 13C NMR (DMSO-d6, 100 MHz): δ 15.60, 28.00, 38.86, 47.55, 55.73, 57.83, 59.79, 65.82, 95.52, 104.56, 113.40, 122.96, 124.02, 130.90, 135.88, 142.96, 143.29, 152.74, 160.98, 172.25. LC-MS (ESI-TOF): m/z 426.1915 ([C24H27 NO6 + H]+ calcd 426.1911).
6-Ethyl-4-(2-hydroxyethyl)-9-phenyl-4,9-dihydrofuro[3,4-b]quinolin-1(3H)-one (NSC756108)
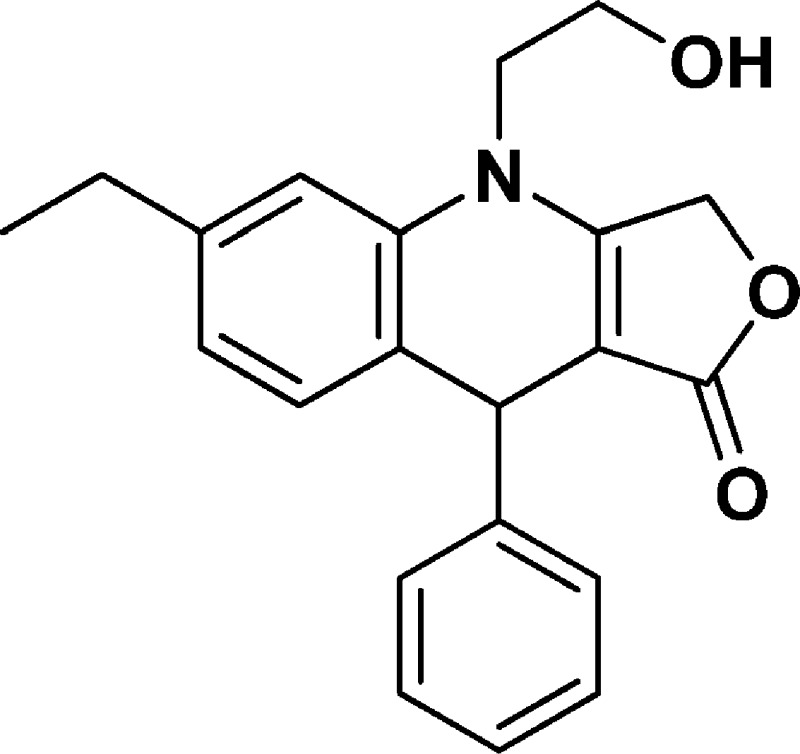
Yield: 56%. 1H NMR (DMSO-d6, 400 MHz): δ 1.06–1.10 (t, 3H), 2.45–2.51 (q, 2H), 3.58–3.70 (m, 3H), 3.75–3.3 (m, 1H), 4.88 (s, 1H), 4.96–4.50 (m, 1H), 5.02–5.09 (m, 2H), 6.73–6.75 (m, 1H), 6.90–6.92 (d, J = 8 Hz, 1H), 6.95 (s, 1H), 7.04–7.08 (m, 1H), 7.12–7.17 (m, 4H). 13C NMR (DMSO-d6, 100 MHz): δ 15.58, 27.98, 38.94, 47.69, 57.74, 65.81, 95.67, 113.42, 122.92, 123.90, 126.17, 127.58, 128.25, 131.14, 136.21, 143.32, 147.14, 160.70, 172.16. LC-MS (ESI-TOF): m/z 336.1599 ([C21H21 NO3 + H]+ calcd 336.1594).
9-(3-Bromophenyl)-6-ethyl-4-(2-hydroxyethyl)-4,9-dihydrofuro[3,4-b]quinolin-1(3H)-one (NSC756110)
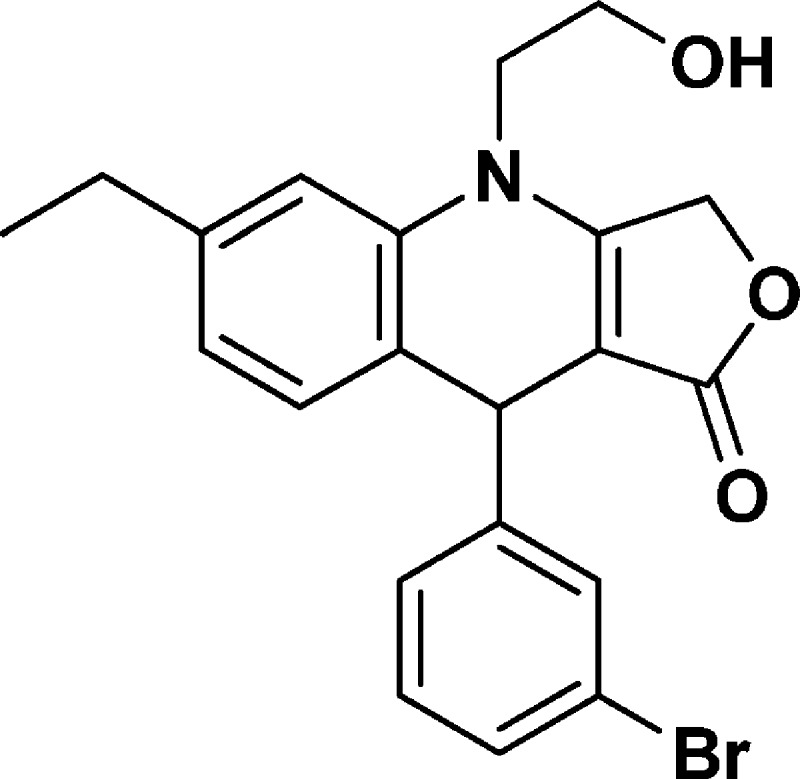
Yield: 55%. 1H NMR (DMSO-d6, 400 MHz): δ 1.14–1.18 (t, 3H), 2.54–2.59 (q, 2H), 3.65–3.82 (m, 3H), 3.84–3.92 (m, 1H), 5.01–5.19 (m, 4H), 6.83–6.85 (m, 1H), 6.98–7.00 (d, J = 8 Hz, 1H), 7.05 (s, 1H), 7.21–7.25 (m, 2H), 7.33–7.36 (m, 1H), 7.43 (s, 1H). 13C NMR (DMSO-d6, 100 MHz): δ 15.53, 27.98, 38.90, 47.76, 57.70, 65.93, 95.08, 113.63, 121.71, 123.09, 123.15, 126.89, 129.17, 130.22, 130.51, 131.17, 136.19, 143.64, 149.62, 160.98, 172.09. LC-MS (ESI-TOF): m/z 414.0626 ([C21H20 Br NO3 + H]+ calcd 414.0699).
9-(3-Chlorophenyl)-6-ethyl-4-(2-hydroxyethyl)-4,9-dihydrofuro[3,4-b]quinolin-1(3H)-one (NSC756111)
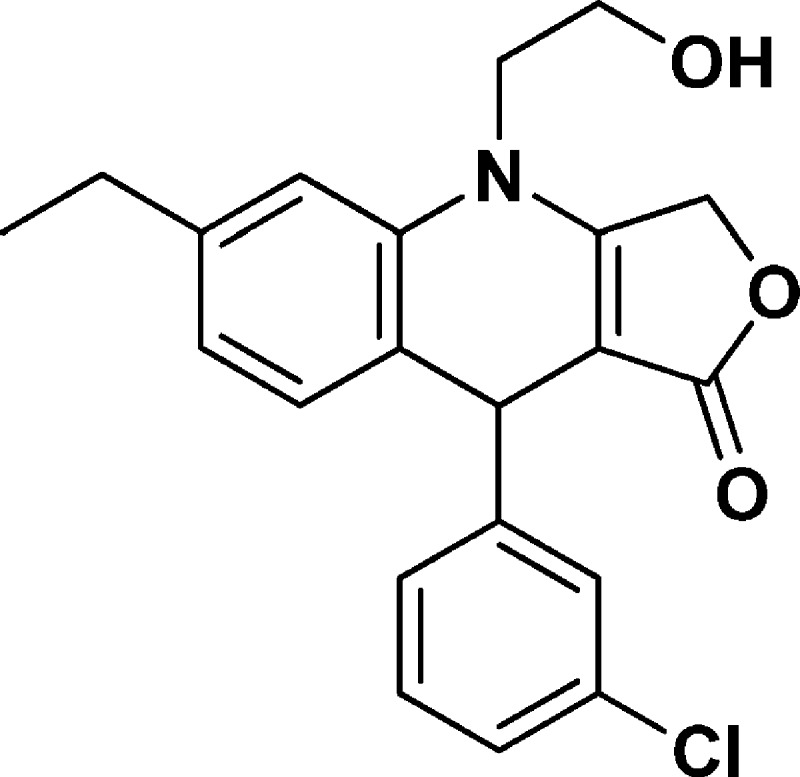
Yield: 53%. 1H NMR (DMSO-d6, 400 MHz): δ 1.14–1.18 (t, 3H), 2.54–2.58 (q, 2H), 3.68–3.80 (m, 3H), 3.80–3.91 (m, 1H), 5.03–5.19 (m, 4H), 6.83–6.85 (d, J = 8 Hz, 1H), 6.99–7.01 (d, J = 8 Hz, 1H), 7.05 (s, 1H), 7.18–7.23 (m, 2H), 7.25–7.30 (m, 2H). 13C NMR (DMSO-d6, 100 MHz): δ 16.02, 28.49, 39.44, 48.26, 58.20, 66.43, 95.58, 114.12, 123.57, 123.65, 126.76, 126.97, 127.90, 130.66, 131.65, 133.48, 136.69, 144.14, 149.86, 161.48, 172.60. LC-MS (ESI-TOF): m/z 370.1170 ([C21H20 Cl NO3 + H]+ calcd 370.1204).
9-(3,4-Dichlorophenyl)-6-ethyl-4-(2-hydroxyethyl)-4,9-dihydrofuro[3,4-b]quinolin-1(3H)-one (NSC756112)
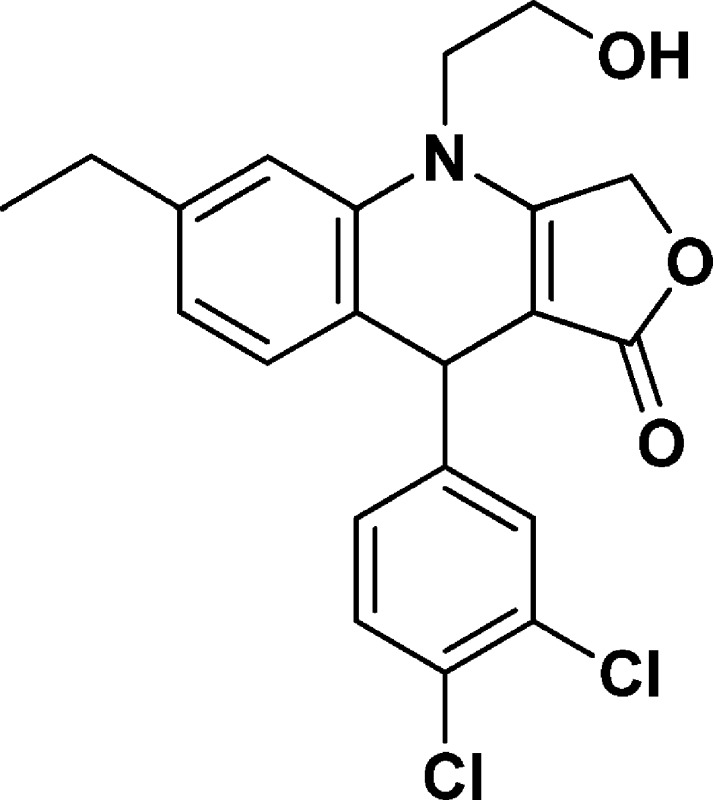
Yield: 70%. 1H NMR (DMSO-d6, 400 MHz): δ 1.14–1.18 (t, 3H), 2.54–2.59 (q, 2H), 3.69–3.81 (m, 3H), 3.83–3.91 (m, 1H), 5.03–5.19 (m, 4H), 6.83–6.85 (m, 1H), 6.99–7.01 (d, J = 8 Hz, 1H), 7.05 (s, 1H), 7.18–7.22 (m, 2H), 7.28–7.30 (m, 1H). 13C NMR (DMSO-d6, 100 MHz): δ 15.53, 27.99, 38.94, 47.76, 57.70, 65.93, 95.08, 113.63, 123.07, 123.15, 126.26, 126.47, 127.40, 130.16, 131.15, 132.98, 136.19, 143.63, 149.36, 160.98, 172.10. LC-MS (ESI-TOF): m/z 404.0711 ([C21H19 Cl2 NO3 + H]+ calcd 404.0815).
NCI-60 Panel Assay and COMPARE Analysis
Growth inhibition experiments were performed at NCI with the use of the NCI-60 panel of cell lines.
Details of the methodology are described at http://dtp.nci.nih.gov/branches/btb/ivclsp.html. Briefly, the panel was organized into nine subpanels representing diverse histologies: leukemia, melanoma, and cancers of lung, colon, kidney, ovary, breast, prostate, and central nervous system. The cells were grown in supplemented RPM1 1640 medium for 24 h. The test compounds were dissolved in DMSO and incubated with cells at five concentrations with 10-fold dilutions, the highest being 10–4 M and the others being 10–5, 10–6, 10–7, and 10–8 M. The assay was terminated by addition of cold trichloroacetic acid, and the cells were fixed and stained with sulforhodamine B. Bound stain was solubilized, and the absorbance was read on an automated plate reader. Growth inhibition effects of all the compounds were calculated in terms of GI50, which is the concentration of the drug that causes 50% of growth inhibition, after correction for the cell count at time 0.17 Percentage growth inhibition (GI50) was calculated from time zero, control growth, and the five concentration level absorbance. The inhibitory concentrations (LC50) represent the average of two independent experiments. The one-dose data of all the compounds is reported as a mean graph of the percent growth of treated. The number reported for the one-dose assay is growth relative to the no-drug control and relative to the time zero number of cells. This allows detection of both growth inhibition (values between 0 and 100) and lethality (values less than 0). For example, a value of 100 means no growth inhibition. A value of 40 would mean 60% growth inhibition. A value of 0 means no net growth over the course of the experiment. A value of −40 would mean 40% lethality. A value of −100 means all cells are dead. The drug response curves from the five-dose data on the NCI-60 panel for NSC756090, NSC756092, 756093, and 756095 are given in Supporting Information, Figures 2SI–5SI.
The principle of COMPARE analysis17 was used to analyze the activity of 4-APTs. The Z-score of the reference compounds paclitaxel, carboplatin, and cisplatin were downloaded from http://dtp.nci.nih.gov/. Using the data of all the NCI-60 cell lines, a Spearman correlation assay was performed with the Z-score of all the 31 active 4-APTs.
Activity of each compound measured as GI50 was ranked with a Z-score within the cell lines of the NCI-60 panel. Each Z-score was calculated with the formula z = (x – μ/σ), where x is the GI50 in a given cell line for a drug, μ is the average of the GI50 of the same drug within the NCI-60 panel, and σ is the standard deviation. To perform the COMPARE analysis, all these values are correlated with a Spearman test with the Z-scores of another reference drug, resulting in a ρ coefficient.
This approach allowed us to identify pattern of cross-resistance/sensitivity to the reference drugs. The NCI COMPARE mechanistic-set served to test the hypothesis that 4-APTs belong to a group of compounds with a given mechanism of action. The mechanistic diversity set consists of 879 compounds and represent a broad range of growth inhibition patterns in the NCI-60 cell line. Similarity with a member of the mechanistic set is featured by a positive and significant ρ value. The most active 21 4-APTs were analyzed for similarity with the whole mechanistic set, and similarities were selected if the ρ value was >0.55 with a p-value <0.0001. To identify scaffold with divergent activities as compared to the mechanistic set, the results were then analyzed with hierarchical cluster analysis. All the statistical analyses were performed with the JMP 9 software (SAS). GBP1 and PIM1 gene expression Z-scores for the NCI-60 panel were downloaded from http://dtp.nci.nih.gov/. An index of GBP1 and PIM1 expression was calculated by multiplying the two values. Cells were then sorted for the sensitivity to NSC756093 measured as GI50. The first and the third tertile were categorized as NSC756093-sensitive and NSC756093-resistant, respectively.
Cell Lines and Coimmunoprecipitation Experiments
The NCI-60 assay was performed at NCI as previously described.18 The cell line SKOV3 was purchased from ECACC and cultured as directed. This cell line was chosen for the detectable expression of both GBP1 and PIM1 and was cultured as previously described.6 Cells harvested in cold PBS were extracted in lysis buffer, and coimmunoprecipitation and Western blots were done as described previously.33 Antibodies were anti-GBP1 and anti-PIM1 (1:200 in 5% milk–TBST, Santacruz). Gel images were quantified from three independent experiments using an Image Station (Carestream) and densitometric analysis.
Biosensor Experiments and Proteins
Interaction analyses were done using the ProteON Xpr 36 (Biorad). Carbonic anidrase (CA) protein utilized as negative control was purchased from Sigma. The GLM sensor chip (Biorad) was equilibrated at room temperature for 45 min before use. During the binding procedure, TBST buffer (tween 0.005%, Biorad) was utilized. After the air initializing procedure, the sensor chip was conditioned on the horizontal side with first injection, sodium dodecyl sulfate (SDS, Bio Rad) 0.5%, 30 μL/min for 60 s; second injection, sodium hydroxide (NaOH, Bio Rad) 50 mM, 30 μL/min for 60 s; third injection, hydrogen chloride (HCl, Bio Rad) 100 mM, 30 μL/min for 60 s. The injections set was repeated for the vertical side of the chip to complete the conditioning protocol. The surface of the chip was activated using a 1:1 solution of 1-ethyl-3-[3-(dimethylamino)propyl] carbodiimide hydrochloride (EDC) and N-hydroxysulfosuccinimide (S-NHS), with single injections of 30 μL/min for 300 s. Once the chip surface was activated, the ligand protein PIM1 was captured on the chip (50 μg/mL) in at least two of the six available channels to have a duplicate of every protein interaction experiment. One channel was treated with acetate buffer pH 5.5 as negative control surface. PIM1 was diluted in acetate buffer pH 5.5 and then injected in the instrument 30 μL/min for 300 s. A signal of 2000 response units (RU) was obtained. The surface of the chip was then deactivated with an injection of 1 M ethanolamine–HCl solution, 30 μL/min, for 300 s. Two injections of TBST (30 μL/min for 60 s) were utilized to remove from the chip surface the excess of ligand, then the surface was flushed overnight with ultra pure water filtered with Milli Q system (Millipore, Billerica, MA). The day after the analyte was injected from lowest to highest concentrations, using a solution of 280 nM GBP1 in TBST, injected 30 μL/min for 120 s (Tween 0.05%), and allowing 15 min of dissociation time. The kinetic of the binding was measured using the Langmuir kinetic model with the ProteON software. After the immobilization, the biochip surfaces was regenerated with 30 μL/min for 60 s injections of 4 M guanidinium chloride (GuHCl). Production of GBP1 and PIM1 recombinant proteins have been described elsewhere.6 Additional controls were carried out to ensure specificity and quality of the binding. In particular, quality of the binding was confirmed in each chip with a simultaneous run of negative and positive controls (shown in Supporting Information, Figures 7SI and 8SI). In particular, in each run in which PIM1 was used as analyte, we used GBP1 and CA as positive and negative controls of the interaction. Preliminary experiments were also conducted using CA instead of PIM1 as ligand. In these experiments, GBP1 did not show any signal on the chip, thus excluding aspecific binding of GBP1 to the chip. Additional controls included also the use of denaturated GBP1 (heated at 55 °C for 20 min). Denaturated GBP1 did not produce any binding, while in the parallel lane the not denaturated protein produced the expected signal. Mutants of GBP1 were prepared using SLIM-PCR as previously described.34 The sequence of each mutant was confirmed with Sanger sequencing and the recombinant protein produced as previously described.6 For the experiments of inhibition with the compounds, the following protocol was adopted. First, the compounds were flowed on the chip in the absence of GBP1 using the following concentrations: 0.1, 1, 10, and 100 nM. Thereafter, we monitored the inhibition of the GBP1:PIM1 interaction by injecting concomitantly the tested compounds and GBP1. Each run was performed at least three times at the four concentrations indicated above plus CA (280 nM) and GBP1 (280 nM) as negative and positive control. The % of inhibition was calculated by analyzing the signal of the interaction (RU) in the presence of the compound over the maximum interaction signal with GBP1. A value of 100% indicated no inhibition. Analysis of variance (Anova) was used to identify compounds with significant inhibitory activity.
Molecular Modeling Studies
Molecular modeling calculations were performed on SGI Origin 200 8XR12000 and E4 Server Twin 2× Dual Xeon-5520, equipped with two nodes. Each node: 2× Intel Xeon QuadCore E5520-2.26 Ghz, 36 GB RAM. The molecular modeling graphics were carried out on SGI Octane 2 workstations.
Conformational Analysis of the New Azapodophyllotoxin Derivatives
The apparent pKa values of azapodophyllotoxin derivatives were calculated by using the ACD/pKa DB, version 12.00, software (Advanced Chemistry Development Inc., Toronto, Canada). All compounds were considered neutral in all calculations performed as a consequence of the estimation of percentage of neutral/ionized forms computed at pH 7.4 (physiological value) and pH 7.2 (cytoplasmic value) using the Handerson–Hasselbalch equation. The compounds were built using the Insight 2005 Builder module (Accelrys Software Inc., San Diego, CA). Atomic potentials and charges were assigned using the CVFF force field.35 The conformational space of compounds was sampled through 200 cycles of simulated annealing (ε = 1). In simulated annealing, the temperature is altered in time increments from an initial temperature to a final temperature by adjusting the kinetic energy of the structure (by rescaling the velocities of the atoms). The following protocol was applied: the system was heated to 1000 K over 2000 fs (time step of 3.0 fs); a temperature of 1000 K was applied to the system for 2000 fs (time step of 3.0 fs) to surmount torsional barriers; successively, temperature was linearly reduced to 300 K in 1000 fs (time step of 1.0 fs). Resulting conformations were then subjected to Molecular Mechanics (MM) energy minimization within the Insight 2005 Discover module (CVFF force field (ε = 1) until the maximum rmsd was less than 0.001 kcal/Å, using conjugate gradient as the minimization algorithm. Resulting conformers were grouped into families on the basis of their torsional angles and ranked by their potential energy values (i.e., ΔE from the global energy minimum).
The MM conformers were then subjected to a full geometry optimization by semiempirical calculations, using the quantum mechanical method PM736 in the MOPAC2012 package37 and EF (eigenvector following routine)38 as geometry optimization algorithm. GNORM value was set to 0.01. To reach a full geometry optimization, the criterion for terminating all optimizations was increased by a factor of 100, using the keyword PRECISE. Resulting conformers were grouped into families on the basis of their torsional angles and ranked by their potential energy values (i.e., ΔE from the global energy minimum).
Bioinformatics Analysis
The experimentally determined structures of (i) tubulin in complex with podophyllotoxin (PDB ID: 1SA1), (ii) TopoisomeraseIIβ in complex with etoposide (PDB ID: 3QX3), (iii) GBP1 (PDB IDs: 2B8W, 2B92, 2BC9, 2D4H, 1DG3, 1F5N), and (iv) PIM1 (PDB IDs: 4MBL, 4K0Y, 4K18, 4K1B, 4JX7, 4JX3, 4GW8, 4ENX, 4ENY, 4DTK, 4AS0, 4ALW, 4ALV, 4ALU, 4A7C, 3VC4, 3VBW, 3VBX, 3VBY, 3VBV, 3VBT, 3VBQ, 3UIX, 3UMW, 3UMX, 3T9I, 3R00, 3R01, 3R02, 3R04, 3QF9, 3MA3, 3JXW, 3JY0, 3JYA, 3JPV, 3F2A, 3DCV, 3CXW, 3CY2, 3CY3, 3C4E, 3BWF, 3BGP, 3BGQ, 3BGZ, 3A99, 2XIZ, 2XIY, 2XIX, 2XJ0, 2XJ2, 2XJ1, 2J2I, 2OI4, 2O3P, 2O63, 2O64, 2O65, 2OBJ, 2C3I, 2BZH, 2BZI, 2BZK, 2BZJ, 2BIK, 2BIL, 1YWV, 1YXS, 1YXT, 1YXU, 1YXV, 1YXX, 1YHS, 1YI3, 1YI4, 1XWS, 1XQZ, 1XR1) were downloaded from the Protein Data Bank (PDB; http://www.rcsb.org/pdb/). Hydrogens were added to all the PDB structures assuming a pH of 7.2. These structures were analyzed using Biopolymer and Homology module of Insight 2005 (Accelrys, San Diego).
Linear functional motifs present in (i) tubulin podophyllotoxin binding site (i.e., within a 5 Å radius from any given ligand atom), (ii) topoisomeraseIIβ etoposide binding site, (iii) GBP1, and (iv) PIM1 were identified by using the Eukaryotic Linear Motif server (http://elm.eu.org/),28 a resource for predicting small functional sites in eukaryotic proteins. The identified motifs in GBP1 and PIM1 were logically intersected with the union of those present in the binding sites of tubulin and topoisomerase. This allowed us to identify the putative binding site of NSC756093 in GBP1, characterized by three linear functional motifs present in tubulin and/or topoisomeraseIIβ binding sites.
Modeling of GBP1
The molecular model of full length human GBP1 in free form was built starting from the experimentally determined structure of free form GBP1 (hGBP1FL; PDB ID: 1DG3), which lacks four loops (amino acids 63–73, 157–166, 190–193, 244–256), the N-terminal region (aa1–5), and the C-terminal region (aa584–592). The sequence of 1DG3 was aligned with the sequence of hGBP1FL downloaded from the UniProtKB/Swiss-Prot Data Bank (http://www.uniprot.org; entry P32455) by using the Multiple_Alignment algorithm (Homology module, Accelrys, San Diego). Subsequently, the secondary structural prediction of the hGBP1FL was performed using the Structure Prediction and Sequence Analysis server PredictProtein (http://www.predictprotein.org/). The coordinates of the structurally conserved regions aa6–62, aa74–156, aa167–189, aa194–243, and aa257–583 of hGBP1FL were accordingly assigned by the SCR-AssignCoords procedure (Homology module) using 1DG3 as template structure. The lacking loop segments aa63–73, aa157–166, aa190–193, and aa244–256 were inserted by using the Generate Loops procedure. With the Generate Loops procedure, a peptide backbone chain was built between two conserved peptide segments using randomly generated values for all the loops’ φs and ψs. The chain was defined starting from the N-terminal end of the loop being built; the Start and Stop Residues were defined as the SCR residues of the model protein at either end of the loop itself. The geometry about the base was described by the four distances between Cα and N-termini of the Start residue and the Cα and C-termini of the Stop residues. In the process of closing the loop, the values for the generated φs and ψs were adjusted until the four distance criteria are met. Specifically, a function was defined for the distances in terms of the dihedral angles (Scale Torsions: 60). The differences between the desired distances and their current values were minimized using a linearized Lagrange multiplier method. After a series of 1000 iterations, the loop was closed, except in the case where the distances between the ends of the loop were not respected (Convergence = 0.05). The geometry at the base of the loop is then checked for proper chirality. Finally, the loops were screened on the basis of steric overlap violations. All loops that are found to have unacceptable contacts were rejected. Because successive calculations can correct some bad contacts, a fairly large overlap factor was used (Internal and External overlap = 0.6). A bump check of the 10 generated loops together with the evaluation of their conformational energy were used as selection criteria. The lowest conformational energy loop presenting no steric overlap with the rest of the protein was selected.
Finally, the coordinates of the N-terminal and C-terminal amino acids (1–5 and 584–592, respectively) were assigned using the EndRepair command in Homology module of Insight 2005. In particular, according to results obtained from the secondary structural prediction, the residues 584–585 (with the standard geometry of an α-helix) and the residues 1–5 and 584–592 (with an extended chain conformation) were appended to the molecular model of hGBP1FL.
The obtained homology model of hGBP1FL was completed inserting the water molecules of GBP1 experimentally determined structure (PDB ID: 1DG3) through the UnMerge and Merge commands (Biopolymer module, Accelrys, San Diego).
The entire GBP1 model was then subjected to a full energy minimization within Insight 2005 Discover_3 module (Steepest Descent algorithm, maximum RMS derivative = 10 kcal/Å; Conjugate Gradient algorithm, maximum RMS derivative = 1 kcal/Å; ε = 1). During the minimization, only the whole disordered N–C terminal and loop backbone and side chains were left free to move, whereas the structurally conserved regions (SCRs) of GBP1 were fixed to avoid unrealistic results.
Each step of refining procedure was followed by a structural check by using the Struct_Check command of the ProStat pulldown in the Homology module to verify the correctness of the geometry optimization procedure before moving to the next step. Checks included φ, ψ, χ1, χ2, χ3, and ω dihedral angles, Cα virtual torsions, and Kabsch and Sander main chain H-bond energy evaluation. The final generated model was checked for quality using Procheck39 structure evaluator software. The obtained hGBP1FL homology model was used for successive dynamic docking studies.
Docking Studies on GBP1 in Complex with the New Azapodophyllotoxin Derivatives
The putative NSC756093/GBP1 complex was subjected to dynamic docking studies (Affinity, SA_Docking;40 Insight2005, Accelrys, San Diego). A docking methodology (Affinity, SA_Docking; Insight2005, Accelrys, San Diego) which considers all the systems flexible (i.e., ligand and protein) was used. Although in the subsequent dynamic docking protocol all the systems were perturbed by means of Monte Carlo and simulated annealing procedures, nevertheless, the dynamic docking procedure formally requires a reasonable starting structure. Accordingly, the starting model of GBP1 was subjected to a preliminary energy minimization to generate roughly docked starting structure (Steepest Descent algorithm, maximum RMS derivative = 10 kcal/Å; Conjugate Gradient algorithm, maximum RMS derivative = 1 kcal/Å; ε = 1).
During the minimization, the whole system was left free to move, whereas a tethering restraint was applied on structurally conserved regions (SCRs) to avoid unrealistic results. To identify SCRs, we analyzed the hGBP1FL sequence (UniProtKB/Swiss-Prot Data Bank; entry code GBP1: P32455) using the Structure Prediction and Sequence Analysis server PredictProtein (http://www.predictprotein.org/). In GBP1, 16 α helix and four β-sheet secondary structures were predicted to be highly conserved (α1, aa26–32; α2, aa113–121; α3, aa139–151; α4, aa199–205; α5, aa221–227; α6, aa261–272; α7, aa292–303; α8, aa315–322; α9, aa326–334; α10, aa350–370; α11, aa376–397; α12, aa404–423; α13, aa433–451; α14, aa457–465; α15, aa469–563; α16, aa567–585; β1, aa12–14; β2, aa39–43; β3, aa79–80; β4, aa92–95). Accordingly, for the α-helices, the distance between hydrogen bond donors and acceptors was constrained within 2.5 Å using a force constant of 100 kcal/mol/Å (Restrain command; Discover_3 module, Accelrys, San Diego). On the other hand, for the β-sheets, the φ and ψ torsional angle were constrained within −130° and +125°, respectively, using a force constant of 100 kcal/mol/Å (Restrain command; Discover_3 module, Accelrys, San Diego).
Moreover, during these calculations, also the water molecules within the active site of GBP1 were tethered with a force constant of 100 kcal/Å2. In particular, all the water molecules within a 6 Å radius from any given nucleotide atom (i.e., GppNHp for GBP1 (PDB ID: 1F5N)) were considered.
Flexible docking was achieved using the Affinity module in the Insight 2005 suite, setting the SA_Docking procedure40 and using three different methods for the calculation of the nonbond interactions: (i) Quartic_vdW_no_Coul (vdW CUT_OFF: 5), (ii) Cell_Multipole, and (iii) Group Based (vdW and Coul CUT_OFF: 15).
The docking protocol included a Monte Carlo based conformational search of the ligand (NSC756093) within the obtained homology model of GBP1. The binding domain area was defined as a subset including all residues of GBP1 protein (aa1–592). All atoms included in the binding domain area were left free to move during the entire course of docking calculations, whereas, in order to avoid unrealistic results, a tethering restraint was applied on the structurally conserved regions (SCRs) of protein. The set of restraints applied was the same as for the preliminary energy minimization. On the other hand, in order to analyze the role of the water molecules within the binding site of GBP1, for each set of docking, two typologies of calculations were performed: one, where all water molecules were left free to move, another, where the water molecules within the active site of GBP1, were tethered with a force constant of 100 kcal/Å2 as for the preliminary energy minimization.
A Monte Carlo/minimization approach for the random generation of a maximum of 20 acceptable complexes was used. During the first step, starting from the previously obtained roughly docked structures, the ligand was moved by a random combination of translation, rotation, and torsional changes to sample both the conformational space of the ligand and its orientation with respect to the protein (MxRChange = 3 Å; MxAngChange = 180°). During this step, van der Waals (vdW) term was scaled to a factor of 0.1 to avoid severe divergences in the vdW energies. If the energy of a complex structure resulting from random moves of the ligand was higher by the energy tolerance parameter than the energy of the last accepted structure, it was not accepted for minimization. To ensure a wide variance of the input structures to be successively minimized, an energy tolerance value of 106 kcal/mol from the previous structure was used. After the energy minimization step (conjugate gradient; 2500 iterations; ε = 1), the energy test, with an energy range of 50 kcal/mol, and a structure similarity check (rms tolerance = 0.3 kcal/Å) was applied to select the 20 acceptable structures. Each subsequent structure was generated from the last accepted structure. Following this procedure, the resulting docked structures were ranked by their conformational energy and were analyzed by a structural check by using the Struct_Check command of the ProStat pulldown in the Homology module to verify the correctness of their dihedral angles values. Structures characterized by unrealistic backbone geometry were discarded.
To test the thermodynamic stability of the resulting docked complexes, these latter were subjected to a molecular dynamics simulated annealing protocol. Two typologies of calculations were performed using or the Cell_Multipole or the Group Based method (CUT_OFF: 50) for the calculation of the nonbond interactions. A tethering restraint was applied on the structurally conserved regions (SCRs) of the complex and on the water molecules within the nucleotide binding sites. The set of structural restraints applied was the same as for previous docking calculations. The protocol included 5 ps of a dynamic run divided in 50 stages (100 fs each), during which the temperature of the system was linearly decreased from 500 to 300 K (Verlet velocity integrator; time step = 1.0 fs). In simulated annealing, the temperature was altered in time increments from an initial temperature to a final temperature. The temperature was changed by adjusting the kinetic energy of the structure (by rescaling the velocities of the atoms). Molecular dynamics calculations were performed using a constant temperature and constant volume (NVT) statistical ensemble, and the direct velocity scaling as temperature control method (temp window = 10 K). In the first stage, initial velocities were randomly generated from the Boltzmann distribution, according to the desired temperature, while during the subsequent stages initial velocities were generated from dynamics restart data. The temperature of 500 K was applied with the aim of surmounting torsional barriers, thus allowing an unconstrained rearrangement of the “ligand” and the “protein” active site (initial vdW and Coulombic scale factors = 0.1). Successively temperature was linearly reduced to 300 K in 5 ps, and, concurrently, the vdW and Coulombic scale factors have been similarly increased from their initial values (0.1) to their final values (1.0). A final round of 104 minimization steps (conjugate gradient, ε = 1) followed the last dynamics steps, and the minimized structures were saved in a trajectory file. After this procedure, the resulting structures were analyzed by a structural check by using the Struct_Check command of the ProStat pulldown in the Homology module to verify the correctness of the geometry. The resulting complexes were ranked by their conformational energy and analyzed for the linear functional motifs present in their ligand binding sites. The complex characterized by the lowest conformational energy and a ligand binding site presenting at least three linear functional motifs in common with tubulin and/or topoisomeraseIIβ binding sites, was selected. The structure was further minimized (CVFF force field; Group Based method for nonbond interaction (CUTOFF: 20)) by a combination of Steepest Descent (maximum rms derivative less than 0.1 kcal/Å) and Conjugate Gradient algorithms (maximum rms derivative less than 0.01 kcal/Å) to allow the relaxation of the whole protein and resubjected to the above-reported structural evaluation. Obtained complex was checked for quality using Procheck39 structure evaluator software.
The PM7 lowest energy conformers of each conformational family of compounds NSC756094, NSC756095, NSC759100, and NSC756108 within 5 kcal/mol from the global energy minimum were superimposed on NSC756093 in complex with GBP1, and the obtained complexes were energy minimized using the above-described procedure. Finally, all ligand/enzyme complexes were ranked by considering the potential energy values of the ligands (i.e., ΔE from the global energy minimum).
Acknowledgments
We thank the NCI Developmental Therapeutics Program for 60 cell line screening. We also thank Robert Bedoukian for his advice. The study was partially supported by the National Cancer Institute, National Institutes of Health, under contract no. HHSN261200800001E (S.V.M., A.P., and V.K.), by the National Center for Research Resources and the National Institute of General Medical Sciences of the National Institutes of Health through grant no. 8 P20 GM 103475 (A.K.), by the Connecticut State Grant 2014-0908 (C.Fe.), by a liberal donation from Rudy and Sally Ruggles (C.Fe.), by the Associazione Oppo e le sue stanze ONLUS (G.S.), by the EU project Bluegenics grant 311848 (C.F.), and by the Italian MIUR financial FIRB RBFR12WB3W_003 (M.P). Sponsors of the research were not involved in the design and interpretation of the experimental activities.
Glossary
Abbreviations Used
- MTAs
microtubule targeted agents
- APTs
azapodophyllotoxins
- CA
carbonic anhydrase
- TopoIIβ
topoisomerase IIβ
Supporting Information Available
Dot chart showing the sensitivity to paclitaxel in the NCI-60 panel; five dose data on the NCI-60 panel for NSC756090, NSC756092, NSC756093, and NSC756095; heat-map showing the results of two-way hierarchical clustering of the COMPARE analysis for the most active 21 4-APTs with the reference mechanistic set; biosensograms for controls of binding specificity for the interaction GBP1:PIM1; biosensograms for the negative controls of binding of GBP1 and for the absence of binding of NSC756093 to PIM1 as ligand; X-ray structure of the human etoposide/TopoIIβ/DNA complex (PDB ID: 3QX3); X-ray structure of the human tubulin/podophyllotoxin complex (PDB ID: 1SA1); molecular model of NSC756093/GBP1 annealed complex; superimposition of NSC756095, NSC756094, NSC759100, and NSC756108 PM7 conformers on the bioactive conformation of NSC756093; mutated residues in GBP1 structure; energy values of the NSC756093/GBP1 complexes obtained by docking studies; protein functional motifs indentified in the binding sites of etoposide, podophyllotoxin, and NSC756093; Ramachandran plots, Chi1–Chi2 plots, main chain and side chain parameters of human GBP1 X-ray structure (PDB ID 1DG3) and molecular model of docked NSC756093/GBP1 complex. This material is available free of charge via the Internet at http://pubs.acs.org.
Author Contributions
◆ M.A., M.P., and A.K. contributed equally to this work.
The authors declare no competing financial interest.
Funding Statement
National Institutes of Health, United States
Supplementary Material
References
- Sullivan K. F.; Cleveland D. W. Identification of conserved isotype-defining variable region sequences for four vertebrate beta tubulin polypeptide classes. Proc. Natl. Acad. Sci. U. S. A. 1986, 83, 4327–4331. [DOI] [PMC free article] [PubMed] [Google Scholar]
- Raspaglio G.; Filippetti F.; Prislei S.; Penci R.; De Maria I.; Cicchillitti L.; Mozzetti S.; Scambia G.; Ferlini C. Hypoxia induces class III beta-tubulin gene expression by HIF-1alpha binding to its 3′ flanking region. Gene 2008, 409, 100–108. [DOI] [PubMed] [Google Scholar]
- Ferlini C.; Raspaglio G.; Cicchillitti L.; Mozzetti S.; Prislei S.; Bartollino S.; Scambia G. Looking at drug resistance mechanisms for microtubule interacting drugs: does TUBB3 work?. Curr. Cancer Drug Targets 2007, 7, 704–712. [DOI] [PubMed] [Google Scholar]
- Seve P.; Dumontet C. Is class III beta-tubulin a predictive factor in patients receiving tubulin-binding agents?. Lancet Oncol. 2008, 9, 168–175. [DOI] [PubMed] [Google Scholar]
- Mariani M.; Shahabi S.; Sieber S.; Scambia G.; Ferlini C. Class III beta-tubulin (TUBB3): more than a biomarker in solid tumors?. Curr. Mol. Med. 2011, 11, 726–731. [DOI] [PubMed] [Google Scholar]
- De Donato M.; Mariani M.; Petrella L.; Martinelli E.; Zannoni G. F.; Vellone V.; Ferrandina G.; Shahabi S.; Scambia G.; Ferlini C. Class III beta-tubulin and the cytoskeletal gateway for drug resistance in ovarian cancer. J. Cell. Physiol. 2012, 227, 1034–1041. [DOI] [PubMed] [Google Scholar]
- Katsetos C. D.; Draber P. Tubulins as therapeutic targets in cancer: from bench to bedside. Curr. Pharm. Des. 2012, 18, 2778–2792. [DOI] [PubMed] [Google Scholar]
- Arkin M. R.; Wells J. A. Small-molecule inhibitors of protein–protein interactions: progressing towards the dream. Nature Rev. Drug Discovery 2004, 3, 301–317. [DOI] [PubMed] [Google Scholar]
- Bonacci T. M.; Mathews J. L.; Yuan C.; Lehmann D. M.; Malik S.; Wu D. Differential targeting of Gbetagamma-subunit signaling with small molecules. Science 2006, 312, 443–446. [DOI] [PubMed] [Google Scholar]
- Gestwicki J. E.; Crabtree G. R.; Graef I. A. Harnessing chaperones to generate small-molecule inhibitors of amyloid beta aggregation. Science 2004, 306, 865–869. [DOI] [PubMed] [Google Scholar]
- Canel C.; Moraes R. M.; Dayan F. E.; Ferreira D. Molecules of interest: podophyllotoxin. Phytochemistry 2000, 54, 115–120. [DOI] [PubMed] [Google Scholar]
- Hartwell J. L.; Schrecker A. W. Components of podophyllin. V. The constitution of podophyllotoxin. J. Am. Chem. Soc. 1951, 73, 2909–2916. [Google Scholar]
- Bohlin L.; Rosen B. Podophyllotoxin derivatives: drug discovery and development. Drug Discovery Today 1996, 1, 343–351. [Google Scholar]
- Kumar A.; Alegria A. E. Synthesis of novel functionalized aza-podophyllotoxin derivatives in search of potent anti-tumor agents. J. Heterocycl. Chem. 2010, 47, 1275–1282. [DOI] [PMC free article] [PubMed] [Google Scholar]
- Kumar A.; Kumar V.; Alegria A. E.; Malhotra S. V. Novel N-hydroxyethyl-4-aza-didehyropodophyllotoxin derivatives, as potential antitumor agents. Eur. J. Pharm. Sci. 2011, 44, 21–26. [DOI] [PMC free article] [PubMed] [Google Scholar]
- Tratrat C.; Giorgi-Renault S.; Husson H. P. A multicomponent reaction for the one-pot synthesis of 4-aza-2,3-didehydropodophyllotoxin and derivatives. Org. Lett. 2002, 19, 3187–3189. [DOI] [PubMed] [Google Scholar]
- Deng J. Z.; Newman D. J.; Hecht S. M. Use of COMPARE analysis to discover functional analogues of bleomycin. J. Nat. Prod. 2000, 63, 1269–1272. [DOI] [PubMed] [Google Scholar]
- Shoemaker R. H. The NCI60 human tumour cell line anticancer drug screen. Nature Rev. Cancer 2006, 6, 813–823. [DOI] [PubMed] [Google Scholar]
- Liu J. F.; Wilson C. J.; Ye P.; Sprague K.; Sargent K.; Si Y.; Beletsky G.; Yohannes D.; Ng S. C. Privileged structure-based quinazolinone natural product-templated libraries: identification of novel tubulin polymerization inhibitors. Bioorg. Med. Chem. Lett. 2006, 16, 686–690. [DOI] [PubMed] [Google Scholar]
- Lopus M.; Oroudjev E.; Wilson L.; Wilhelm S.; Widdison W.; Chari R.; Jordan M. A. Maytansine and cellular metabolites of antibody–maytansinoid conjugates strongly suppress microtubule dynamics by binding to microtubules. Mol. Cancer Ther. 2010, 9, 2689–2699. [DOI] [PMC free article] [PubMed] [Google Scholar]
- De Vincenzo R.; Ferlini C.; Distefano M.; Gaggini C.; Riva A.; Bombardelli E.; Morazzoni P.; Danieli B.; Capelli G.; Mancuso S.; Scambia G. Biological evaluation on different human cancer cell lines of novel colchicine analogs. Oncol. Res. 1999, 11, 145–152. [PubMed] [Google Scholar]
- Jordan M. A.; Kamath K. How do microtubule-targeted drugs work? An overview. Curr. Cancer Drug Targets 2007, 7, 730–742. [DOI] [PubMed] [Google Scholar]
- Battaglia A.; Bernacki R. J.; Bertucci C.; Bombardelli E.; Cimitan S.; Ferlini C.; Fontana G.; Guerrini A.; Riva A. Synthesis and biological evaluation of 2′-methyl taxoids derived from baccatin III and 14beta-OH-baccatin III 1,14-carbonate. J. Med. Chem. 2003, 46, 4822–4825. [DOI] [PubMed] [Google Scholar]
- Kortagere S.; Krasowski M. D.; Ekins S. The importance of discerning shape in molecular pharmacology. Trends Pharmacol. Sci. 2009, 30, 138–147. [DOI] [PMC free article] [PubMed] [Google Scholar]
- Kellenberger E.; Hofmann A.; Quinn R. J. Similar interactions of natural products with biosynthetic enzymes and therapeutic targets could explain why nature produces such a large proportion of existing drugs. Nat. Prod. Rep. 2011, 28, 1483–1492. [DOI] [PubMed] [Google Scholar]
- Weskamp N.; Huellermeier E.; Klebe G. Merging chemical and biological space: structural mapping of enzyme binding pocket space. Proteins: Struct., Funct., Bioinf. 2009, 76, 317–330. [DOI] [PubMed] [Google Scholar]
- Brylinski M.; Skolnick J. A threading-based method (FINDSITE) for ligand-binding site prediction and functional annotation. Proc. Natl. Acad. Sci. U. S. A. 2008, 105, 129–134. [DOI] [PMC free article] [PubMed] [Google Scholar]
- Dinkel H.; Van Roey K.; Michael S.; Davey N. E.; Weatheritt R. J.; Born D.; Speck T.; Krüger D.; Grebnev G.; Kuban M.; Strumillo M.; Uyar B.; Budd A.; Altenberg B.; Seiler M.; Chemes L. B.; Glavina J.; Sánchez I. E.; Diella F.; Gibson T. J. The eukaryotic linear motif resource ELM: 10 years and counting. Nucleic Acids Res. 2014, 42, D259–D266. [DOI] [PMC free article] [PubMed] [Google Scholar]
- Leroy D.; Kajava A. V.; Frei C.; Gasser S. M. Analysis of etoposide binding to subdomains of human DNA topoisomerase II alpha in the absence of DNA. Biochemistry 2001, 40, 1624–1634. [DOI] [PubMed] [Google Scholar]
- a Prakash B.; Renault L.; Praefcke G. J.; Herrmann C.; Wittinghofer A. Triphosphate structure of guanylate-binding protein 1 and implications for nucleotide binding and GTPase mechanism. EMBO J. 2000, 19, 4555–4564. [DOI] [PMC free article] [PubMed] [Google Scholar]; b Prakash B.; Praefcke G. J.; Renault L.; Wittinghofer A.; Herrmann C. Structure of human guanylate-binding protein 1 representing a unique class of GTP-binding proteins. Nature 2000, 403, 567–571. [DOI] [PubMed] [Google Scholar]; c Ghosh A.; Praefcke G. J.; Renault L.; Wittinghofer A.; Herrmann C. How guanylate-binding proteins achieve assembly-stimulated processive cleavage of GTP to GMP. Nature 2006, 440, 101–104. [DOI] [PubMed] [Google Scholar]
- Vigil D.; Cherfils J.; Rossman K. L.; Der C. J. Ras superfamily GEFs and GAPs: validated and tractable targets for cancer therapy?. Nature Rev. Cancer 2010, 10, 842–857. [DOI] [PMC free article] [PubMed] [Google Scholar]
- Vöpel T.; Syguda A.; Britzen-Laurent N.; Kunzelmann S.; Lüdemann M. B.; Dovengerds C.; Stürzl M.; Herrmann C. Mechanism of GTPase-activity-induced self-assembly of human guanylate binding protein 1. J. Mol. Biol. 2010, 400, 63–70. [DOI] [PubMed] [Google Scholar]
- Ferlini C.; Cicchillitti L.; Raspaglio G.; Bartollino S.; Cimitan S.; Bertucci C.; Mozzetti S.; Gallo D.; Persico M.; Fattorusso C.; Campiani G.; Scambia G. Paclitaxel directly binds to Bcl-2 and functionally mimics activity of Nur77. Cancer Res. 2009, 69, 6906–6914. [DOI] [PubMed] [Google Scholar]
- Chiu J.; March P. E.; Lee R.; Tillett D. Site-Directed, Ligase-Independent Mutagenesis (SLIM): a Single-Tube Methodology Approaching 100% Efficiency in 4 h. Nucleic Acids Res. 2004, 32, e174. [DOI] [PMC free article] [PubMed] [Google Scholar]
- Dauber-Osguthorpe P.; Roberts V. A.; Osguthorpe D. J.; Wolff J.; Genest M.; Hagler A. T. Structure and energetics of ligand binding to proteins: E. coli dihydrofolate reductase–trimethoprim, a drug–receptor system. Proteins 1998, 4, 31–47. [DOI] [PubMed] [Google Scholar]
- Stewart J. J. Optimization of parameters for semiempirical methods VI: more modifications to the NDDO approximations and re-optimization of parameters. J. Mol. Model. 2013, 19, 1–32. [DOI] [PMC free article] [PubMed] [Google Scholar]
- , Stewart J. P.MOPAC2012; Computational Chemistry: Colorado Springs, CO, 2012; http://OpenMOPAC.net. [Google Scholar]
- Baker J. An algorithm for the location of transition states. J. Comput. Chem. 1986, 7, 385–395. [Google Scholar]
- Laskowski R. A.; MacArthur M. W.; Moss D. S.; Thornton J. M. PROCHECK: a program to check the stereochemical quality of protein structures. J. Appl. Crystallogr. 1993, 26, 283–291http://www.ebi.ac.uk/thornton-srv/software/PROCHECK7/. [Google Scholar]
- Senderowitz H.; Guarnieri F.; Still W. C. A smart Monte Carlo technique for free energy simulations of multiconformational molecules. Direct calculations of the conformational populations of organic molecules. J. Am. Chem. Soc. 1995, 117, 8211–8219. [Google Scholar]
Associated Data
This section collects any data citations, data availability statements, or supplementary materials included in this article.


