Significance
This paper deals with fibrosis of the kidney, a disease caused by inflammation, and so far there has been no way to diagnose and monitor the disease’s progression with noninvasive methods (the only way to determine the disease state is by biopsy, which cannot be frequently repeated). For this reason we developed a mathematical model of progression of renal fibrosis and validated it with biomarkers that were obtained from patients’ urine samples. We then used the model to show how antifibrosis drugs that are currently being developed for nonrenal fibrosis can be used to treat renal fibrosis.
Keywords: renal fibrosis, math modeling, tubulointerstitial inflammation
Abstract
Lupus nephritis (LN) is an autoimmune disease that occurs when autoantibodies complex with self-antigen and form immune complexes that accumulate in the glomeruli. These immune complexes initiate an inflammatory response resulting in glomerular injury. LN often concomitantly affects the tubulointerstitial compartment of the kidney, leading first to interstitial inflammation and subsequently to interstitial fibrosis and atrophy of the renal tubules if not appropriately treated. Presently the only way to assess interstitial inflammation and fibrosis is through kidney biopsy, which is invasive and cannot be repeated frequently. Hence, monitoring of disease progression and response to therapy is suboptimal. In this paper we describe a mathematical model of the progress from tubulointerstitial inflammation to fibrosis. We demonstrate how the model can be used to monitor treatments for interstitial fibrosis in LN with drugs currently being developed or used for nonrenal fibrosis.
Systemic lupus erythematosus (SLE) is a multisystem autoimmune disease that can affect the kidney. The most common kidney manifestation of SLE is lupus nephritis (LN). LN occurs when autoantibodies complex with self-antigens and form immune complexes that accumulate in the glomeruli, the filtering units of the kidneys. Glomerular immune complexes initiate an inflammatory response that results in the appearance of blood and protein in the urine and impaired kidney function. Rovin et al. (1) recently reviewed the clinical aspects and pathogenesis of LN and noted that, in addition to glomerular injury, LN often concomitantly affects the tubulointerstitial compartment of the kidney. Tubulointerstitial injury is thought to begin as an inflammatory process. If interstitial inflammation is not attenuated it can promote interstitial fibrosis and atrophy of the renal tubules, structural changes that are irreversible, at least with current therapies. Clinically, the prognosis of the kidney in LN is more strongly associated with the degree of tubulointerstitial injury than the original glomerulonephritis (2). LN patients with moderate to severe interstitial inflammation are more likely to progress to chronic or end-stage kidney disease than those with minimal or no interstitial inflammation (3). The prognostic impact of tubulointerstitial injury is not restricted to LN; indeed, it is observed in several other types of immune-mediated glomerular diseases (4–8).
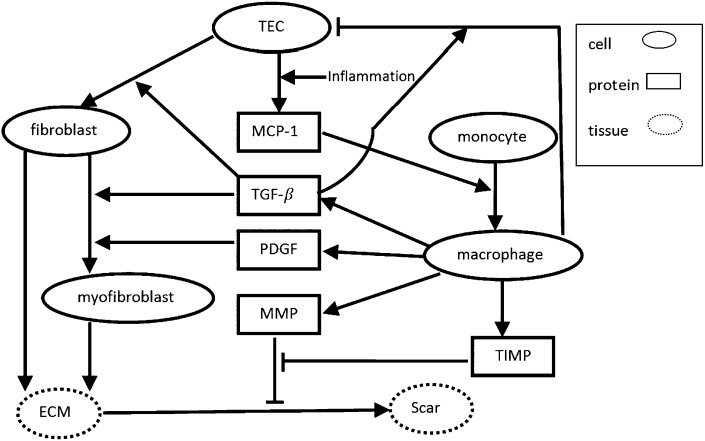
The pathogenesis of tubulointerstitial inflammation in LN is not entirely clear, although it is not related to interstitial immune complex deposition (9). It is likely that the injured glomerular compartment communicates with the tubulointerstitial compartment (10). This may occur through production of soluble mediators and/or infiltrating glomerular leukocytes in response to glomerular immune complexes. Monocytes that enter glomeruli from the circulation differentiate into tissue macrophages, and these could escape from damaged glomeruli into the tubulointerstitium. Similarly, soluble proinflammmatory factors could “leak” out of damaged glomeruli and activate tubular epithelial cells (TECs) (11–14). Activated TECs secrete a number of proinflammatory mediators including chemoattractants such as monocyte chemotactic protein-1 (MCP-1) that recruit additional circulating monocytes to the tubulointerstitial space (15–18). Infiltrating monoctyes become activated macrophages and along with activated TECs perpetuate and enhance tubulointerstitial inflammation and facilitate the progression from inflammation to interstitial fibrosis by secreting a number of cytokines and growth factors (Fig. 1). Activated macrophages secrete PDGF, TGF-β, matrix metalloproteinase (MMP), and tissue inhibitor of metalloproteinase (TIMP) (16, 19, 20), all of which are involved in the regulation of tissue fibrosis. TGF-β, along with TEC-derived basic FGF (bFGF), increases the proliferation of interstitial fibroblasts (21–24). PDGF and TGF-β transform fibroblasts to myofibroblasts (16, 19), which together with fibroblasts produce ECM (25, 26). Imbalance between MMP and its inhibitor TIMP facilitates the accumulation of ECM and formation of interstitial fibrosis (17, 20).
Fig. 1.
Network of the renal interstitial fibrosis. Arrows indicate activation or induction; hammerheads indicate inhibition or killing.
Presently, the only way to clinically assess interstitial inflammation and fibrosis is through a kidney biopsy. Because of the invasive nature of this procedure it cannot be repeated frequently to determine how LN is progressing and whether treatment has been effective. Clinical measurements have been found to poorly reflect histologic changes in the kidneys in LN, and despite very intense immunosuppression renal fibrosis occurs quickly (27). A noninvasive method to follow interstitial injury and detect the effect (or lack thereof) of therapy is an unmet need in the area of LN. We therefore developed a mathematical model of the progression from tubulointerstitial inflammation to fibrosis. We suggest that this model, upon validation and refinement, could be used to clinically follow interstitial injury in LN. The model also allows simulation of interstitial injury and how injury responds to targeting presumed pathogenic pathways. This could be developed into a tool to facilitate and test novel treatments for interstitial damage in LN.
Mathematical Model
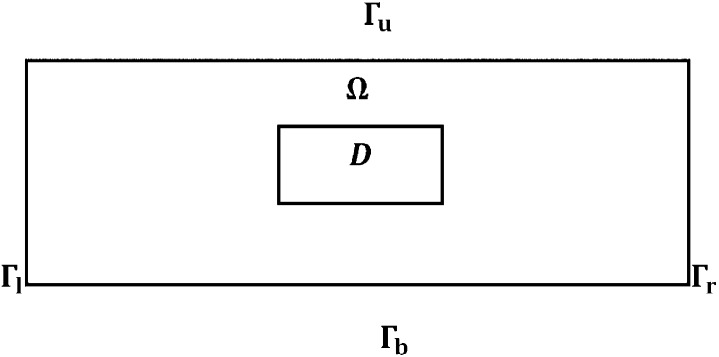
The mathematical model is based on the signaling network described in Fig. 1. Because the renal tissue is densely packed with parallel tubules and blood vessels, we consider just a rectangular cross-section Ω, a part of the renal cortex, as depicted in Fig. 2, with dimensions 1 × 2 cm2; inflammation begins in a small rectangle D interior to Ω.
Fig. 2.
Domain Ω with a damaged area D.
We assume that all species are dispersing or diffusing in Ω with appropriate diffusion coefficients. The equation for each species Xi (1 ≤ i ≤ k) has the form
| [1] |
where ∇2 is the Laplace operator ∇ ⋅ grad, or in d-dimensional space, is the diffusion coefficient, and is a function that depends on all of the species and expresses the result of their interactions on the growth of Xi. The term for cells means dispersion, which decreases crowding, and for cytokines means diffusion. Because cells are much larger than cytokines, their dispersion coefficients are much smaller than the diffusion coefficients of cytokines. In determining the structure of we use, for simplicity, the linear mass conservation law. For instance, if Xj + Xk → Xi, then , where m is the production rate of Xi. However, this law will only apply when Xj and Xk are unlimited. If, for example, Xj represents cells and Xk represents molecules that are bound and internalized by Xj, then the internalization of Xk may be limited owing to the limited rate of receptor recycling. In this case, we use the Michaelis–Menten law ; we do not use Hill’s law (n ≥ 2) because we want to keep the linear conservation law for small concentrations. In using the equation for each species, except macrophages, we ignore, for simplicity, the space occupied by the blood vessels (which is typically less that 5%).
Equation for Macrophage Density (M).
The evolution of macrophage density outside the blood vessels is modeled by
| [2] |
Here the first term on right-hand side accounts for recruitment of macrophages by a cytokine, here represented by MCP-1 (P) (16, 17).
Because macrophages are the monocytes that migrated from the blood vessels into the tissue, we assume that M satisfies the following boundary condition at the endothelial cells:
| [3] |
where M0 is the monocyte density in the blood and αε(P) depends on the MCP-1 concentration. We assume that the blood vessels (in the cross-section) are circles distributed periodically with period ω (as shown in Fig. 3A) and they occupy 5% of the total area. Fig. 3B is a 1/ω magnification of one circle enclosed in a periodic unit square.
Fig. 3.
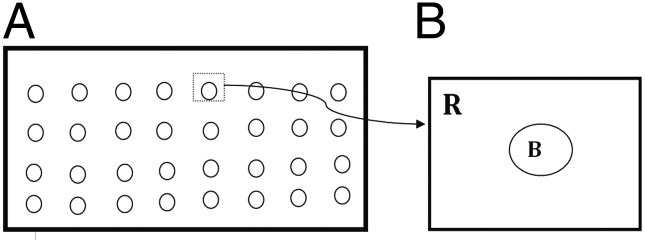
(A) Blood vessels depicted as circles in ω periodic structure and (B) 1/ω magnification of one period. R is a unit square, and B is a circle of area 0.05 with its center at the square’s center.
Because ω is small, we can use homogenization theory (28) to write down the “effective” equation for M over the entire tissue:
| [4] |
where , (KP is the saturation level of MCP-1), and . The coefficient aij is computed by
where χi satisfies the equation
and where ni is the i-th component of the outward normal n and χi is periodic in the horizontal and vertical directions. Computing aij by finite element discretization we find that a11 = a22 = 0.8 and a12 = a21 = 0.
Equation for TEC Density (E).
The density of TECs is decreased owing to the inflammation. Accordingly, the equation for TEC density is given by
| [5] |
There are many mechanisms for TEC apoptosis, but for simplicity we have taken here only TEC apoptosis directed by macrophages through nitric oxide (29), a process which is promoted by TGF-β (30) (the last term of the right-hand side of Eq. 5). The decrease in TEC density is probably also due to the expansion of the interstitium caused by inflammation and its associated edema.
Equations for Fibroblast Density (f) and Myofibroblast Density (m).
Fibroblasts and myofibroblasts are modeled by
| [6] |
| [7] |
The growth factor bFGF produced by TECs (21–23) activates fibroblasts (21, 31). For simplicity, we do not specifically include bFGF in the model, but instead represent it by TECs. The production of fibroblasts in healthy normal tissue is represented by the term Af (which depends on the density of TECs in health). In renal interstitial fibrosis, there is additional production of fibroblasts by TECs that is enabled by TGF-β (24, 32, 33) (the second term of the right-hand side of Eq. 6). Fibroblast transformation into myofibroblast by TGF-β (24, 32, 33) and PDGF (16, 34) is represented by the last term on the right-hand side of Eq. 6.
Equation for ECM Density (ρ).
The ECM, produced by fibroblasts and myofibroblasts (25, 26), is degraded by MMP (20). TGF-β enhances the production of ECM by myofibroblasts (35–37). The equation for the density of ECM is then given by
| [8] |
where if ρ < ρ0, if ρ ≥ ρ0.
Equation for MCP-1 (P).
In the case of interstitial nephritis, the TECs and macrophages secrete MCP-1 (15, 17, 18), and MCP-1 is bound and internalized by macrophages that are chemotactically attracted to MCP-1. Accordingly, the MCP-1 equation is given by
| [9] |
where λPE is a function of inflammation and ID is the characteristic function of the injured area D in the renal tissue, which gives rise to the initial focus of inflammation; see Fig. 2.
Equations for Concentrations of PDGF (G), MMP (Q), TIMP (Qr), and TGF-β (Tβ).
We have generated the following sets of reaction diffusion equations for the growth factors and proteases (G, Q, Qr, and Tβ):
| [10] |
| [11] |
| [12] |
| [13] |
These cytokines are produced by macrophages (16, 20). In Eq. 11, MMP is lost by binding with TIMP (second term).
Equation for Scar Density (S).
Fibrotic diseases are characterized by excessive scarring owing to production and deposition of ECM and disruption of normal, healthy protein cross-linking (36). We define the scar by the equation
| [14] |
where λS is a constant, but this definition is a simplified characterization of a scar because it does not account for disruption in protein cross-linking.
Boundary Conditions.
We shall simulate the model in a rectangular domain Ω with an injured area D (Fig. 2) and assume periodic boundary conditions for all variables.
Initial Conditions.
We take
and all other variables equal to zero.
Results
The parameter values of the model equations and the techniques used in the simulations are described in Supporting Information.
Model Validation.
To validate the model, we compared the model simulation with patient data. Urine for cytokine measurement was collected at the time of kidney biopsy of SLE patients, who developed clinical signs of kidney involvement, under a protocol approved by the institutional review board of The Ohio State University. All patients (n = 47) gave informed consent for collection and analysis of their urine specimens. The urine was centrifuged to remove sediment and aliquots of the supernatant were stored at −80 °C until they were assayed. The biopsies were read by a blinded renal pathologist, and the degree of interstitial fibrosis and tubular atrophy was graded in a semiquantitative fashion. Tubulointerstitial fibrosis involving less than 10% of the renal cortex was considered mild, fibrosis involving between 10% and 25% of the cortex was considered moderate, and fibrosis involving over 25% of the cortex was considered severe. Urine MCP-1 was measured by specific ELISA as we have described previously (38). Urine TGF-β was also measured by specific ELISA obtained from R&D Systems.
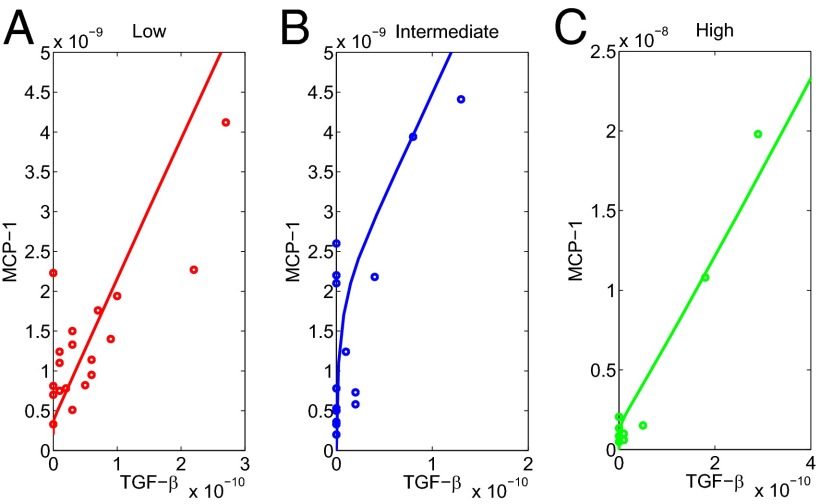
We have measured the urine biomarkers MCP-1 and TGF-β from the three groups of patients: (i) mild fibrosis, (ii) moderate fibrosis, and (iii) severe fibrosis. The individual patient data (MCP-1 and TGF-β) for the three groups are given in Supporting Information and are shown in small circles in Fig. 5.
Fig. 5.
Comparison of patient data to model simulations for different levels of interstitial fibrosis based on kidney biopsy. (A) Low fibrosis; the size of damaged area is 0.4 × 0.4, λPE = 1 × 10⁻⁸ d−1. (B) Intermediate fibrosis; the size of damaged area is 0.5 × 0.5, λPE = 4 × 10⁻⁸ d−1. (C) High fibrosis; the size of damaged area is 0.6 × 0.6, λPE = 8 × 10⁻⁸ d−1. Most of the data points fall near the simulated curves, but there are several outliers expected in real patients.
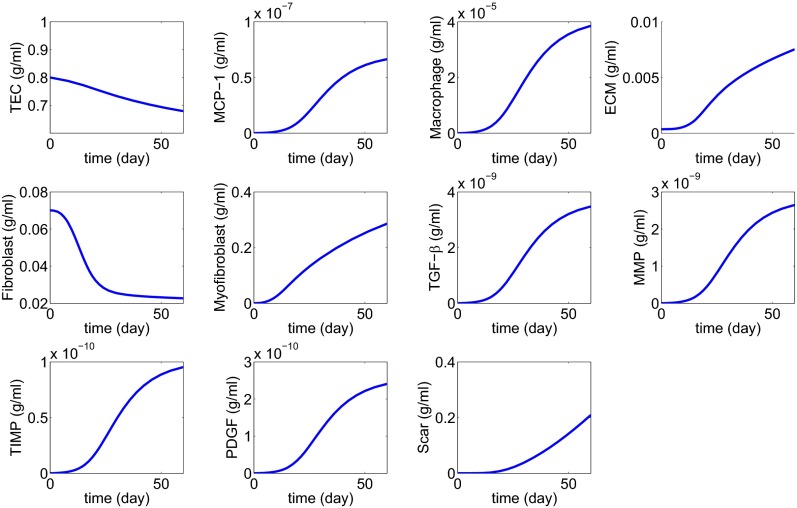
In Fig. 4 we simulated the mathematical model with λPE = 1 × 10⁻⁸ d−1 and damaged area D = 0.4 × 0.4 for 60 d. For each time t, we can take the corresponding values of MCP-1 and TGF-β and draw the curve of MCP-1 to TGF-β evolution; the result is the (nearly) straight line shown in Fig. 5A; the time variable is not marked explicitly along the curve. Fig. 5 B and C show similar curves for larger values of λPE and larger damaged areas D. The model parameters λPE and damaged areas D as indicated in the legend of Fig. 5 were chosen to give a good fit with the experimental data provided the initial fibrosis (mild, moderate, or severe) is set up appropriately by the choice of λPE and D. Indeed, by goodness-of-fit statistics we found that the R2 values, which measure the correlation between the simulation curves and the data, were 0.908 (low), 0.961 (intermediate), and 0.968 (high); values closer to 1 indicate better fit.
Fig. 4.
Simulation of all variables over a period of 60 d with λPE = 5 × 10⁻⁹ and D = 0.2 × 0.2.
It is known that MCP-1 and TGF-β are expressed in the kidney and appear in the urine in a number of disease states associated with kidney inflammation and fibrosis. Assuming that the urine reflects tissue expression, the fit established in Fig. 5 validates the model.
Treatment Studies.
In recent years many promising targets of fibrosis have been validated in animal studies. Drugs are currently being developed and even therapeutically used for patients with nonrenal fibrosis. However, there is currently no effective therapy for renal fibrosis (39, 40). A major obstacle to the development of effective therapy for renal fibrosis is the lack of noninvasive diagnostic tools to assess kidney scarring and monitor therapy. The mathematical model developed in this paper may be used as a diagnostic tool as well as to monitor renal fibrosis during therapy. To illustrate the applicability of this approach we simulated the effect of treatment over 60 d. Because treatment rarely begins at the time fibrosis starts in clinical situations, we correspondingly, in our model, applied treatment 30 d after onset of fibrosis. Additionally, we assumed that the patient presents with mild interstitial inflammation.
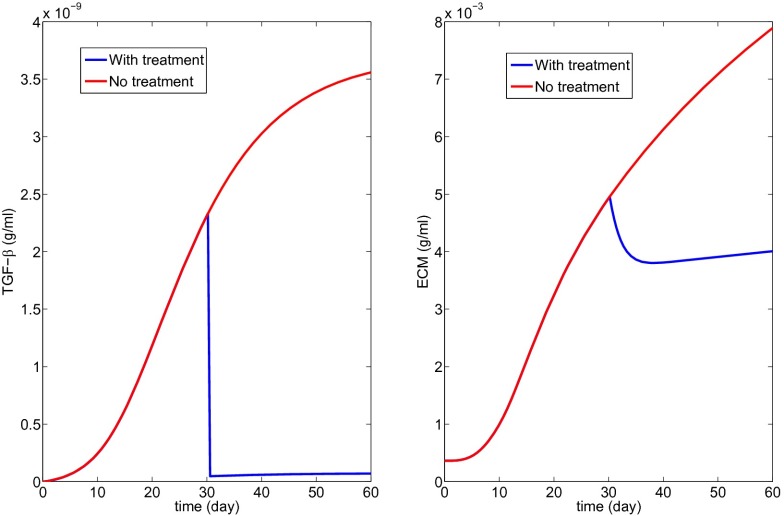
We considered five different potential therapies that target inflammation or fibrosis: a TGF-β inhibitor, anti-C5 antibodies, MCP-1 blockade by a CCR2 antagonist, anti-PDGF antibodies, and MMP administration. Starting with a TGF-β inhibitor, Eq. 13 was changed into
| [15] |
where K1 represents the amount (or strength) of the drug. To minimize side effects, we choose the smallest K1 that is required to stop the fibrosis.
Fig. 6 with K1 = 20 shows the profiles of the decreased Tβ and the resulting scar progression; notice that the state of a scar depends primarily on excessive production of ECM, but also on the disruption of protein cross-linking, so that the initial slight decrease in ECM in Fig. 6 should not be interpreted as an actual decrease of the scar. Fig. 6 suggests that to stop the growth of the fibrotic process by a TGF-β inhibitor the drug has to be so effective that it reduces the production of TGF-β by macrophages by a factor of . Whether such a drug treatment will remain under the maximum tolerated dose remains to be explored.
Fig. 6.
Treatment with a TGF-β inhibitor (K1 = 20 in Eq. 15).
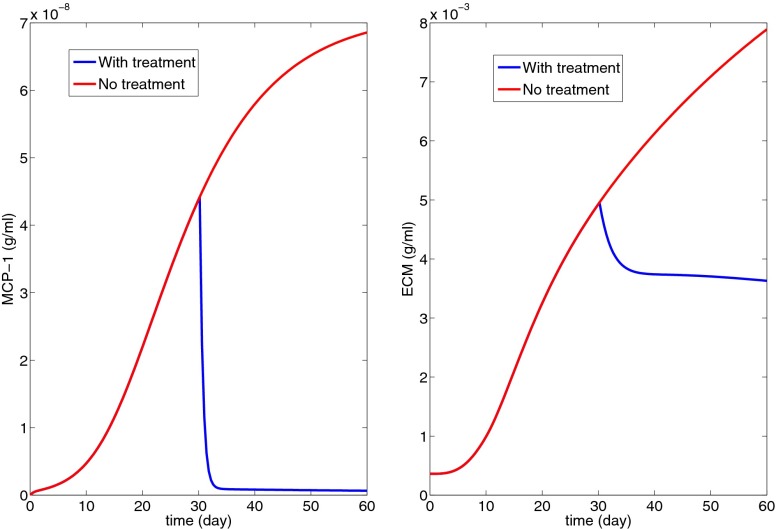
In Fig. 7 we have used anti-C5 to block the initial complement-mediated inflammation initiated by immune complexes; in this case, instead of Eq. 9 we have
| [16] |
with K2 = 50.
Fig. 7.
Treatment with anti-C5 to decrease MCP-1 concentration (K2 = 50 in Eq. 16).
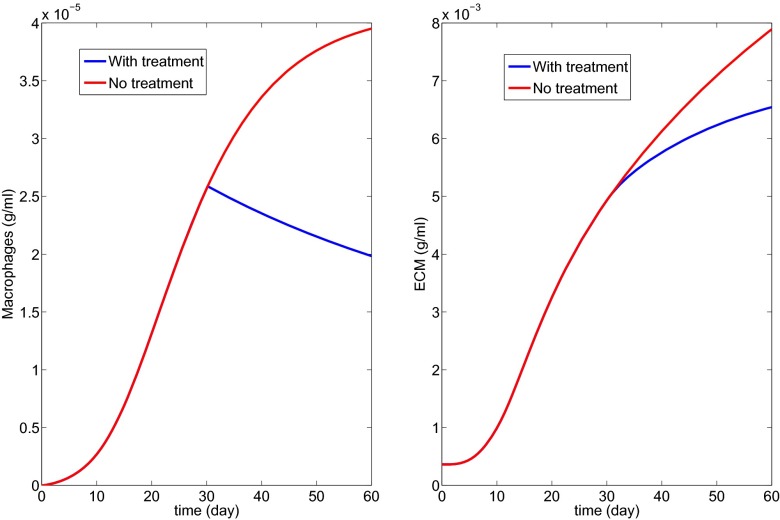
Fig. 8 shows the effect of MCP-1 blockade by a CCR2 antagonist; Eq. 4 was replaced by
| [17] |
with K3 = 100.
Fig. 8.
Treatment with MCP-1 blockade by a CCR2 antagonist to decrease macrophage density (K3 = 10 in Eq. 17).
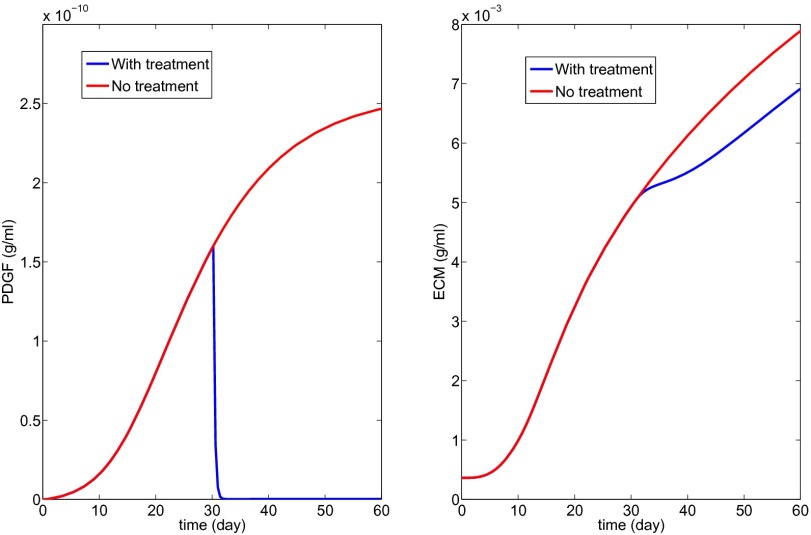
Fig. 9 shows the effect of anti-PDGF Ab, where Eq. 10 was changed into
| [18] |
with K4 = 1,000.
Fig. 9.
Anti-PDGF treatment to decrease PDGF concentration (K4 = 1,000 in Eq. 18).
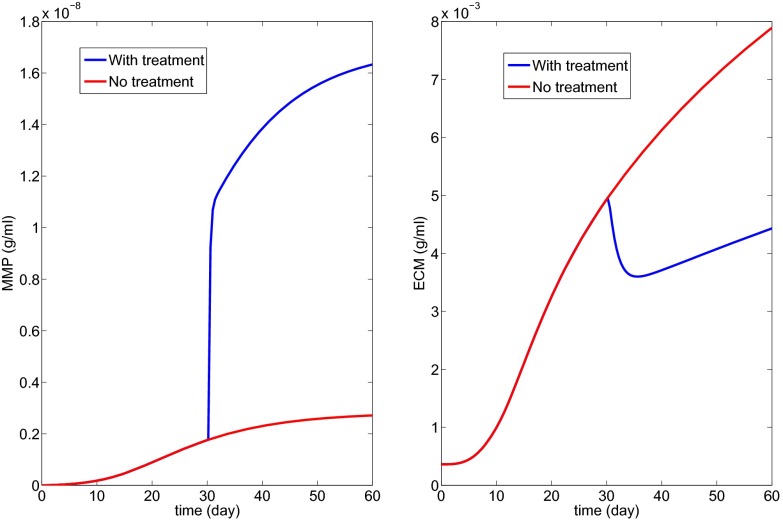
Fig. 10 shows the effect of MMP injection for ECM turnover and composition, with K5 = 1:
| [19] |
Ref. 39 reviews all of the experimental papers associated with the above treatments.
Fig. 10.
MMP injection (K5 = 5 in Eq. 19).
The simulations of Fig. 6 show that if we use a TGF-β inhibitor that reduces its production by macrophages by a factor of then fibrosis will not increase during treatment. Similar conclusions can be drawn from the other treatment simulations; in particular, Fig. 10 shows that the production of MMP by macrophages needs to increase only by a factor of 2 to stop the progression of fibrosis. Which of these drugs is “optimal” will depend on their availability, their efficacy, and their side effects.
Discussion
LN is an autoimmune disease that causes glomerular injury leading to proteinuria, hematuria, and often impaired kidney function. As in other forms of glomerulonephritis LN often involves the tubules and kidney interstitial space, and damage to the tubulointerstitium affects renal prognosis. Tubulointerstitial injury is thought to begin with interstitial inflammation, which progresses to interstitial fibrosis and atrophy of the renal tubules. Currently, interstitial pathology is assessed with a kidney biopsy, an invasive procedure that cannot be frequently repeated. It is thus difficult to follow interstitial injury on a real-time basis. To address this clinical problem we have developed a mathematical model of the progress from tubulointerestitial inflammation to fibrosis. The model was validated by showing that the expression levels of two biomarkers from LN patients at three different levels of chronic kidney damage fit with those predicted by the model. To demonstrate how the model may be clinically applied to diagnose and monitor tubulointerestitial fibrosis, we used the model to determine how treatment with anti-inflammatory or antifibrosis drugs, some of which are under development or being tested in nonrenal fibrosis, affected progression of interstitial injury. Although the model ignored drug delivery issues and potential side effects, it indicated that such drugs can stop the progression of renal fibrosis if administered continuously and at appropriate levels. Interestingly, the model suggests considerable differences in the relative potencies of the tested drugs necessary to achieve a therapeutic effect.
The most important use of the model will be to improve the design of clinical trials for new medications to treat LN. The simulations from Figs. 6–10 suggest levels of inhibition that are required for specific antagonists to be effective in attenuating the inflammation to fibrosis pathway. One of the most difficult questions in clinical trial design is how to dose a novel therapeutic. Because of limited patient and financial resources a large dose-ranging study cannot often be done, and so arbitrary choices are made. The model could give a starting point for an effective dose.
The model can also be used to identify the most vulnerable segments of the inflammation to fibrosis pathway. Drugs designed to focus on antagonists to these segments may be the most successful therapeutic candidates.
Supplementary Material
Acknowledgments
This work was supported by the Mathematical Biosciences Institute and National Science Foundation Grant DMS 0931642 (to W.H. and A.F.) and National Institutes of Health, National Institute of Diabetes and Digestive and Kidney Diseases Grant 5U01DK085673-05 (to B.H.R.).
Footnotes
The authors declare no conflict of interest.
This article contains supporting information online at www.pnas.org/lookup/suppl/doi:10.1073/pnas.1413970111/-/DCSupplemental.
References
- 1.Rovin BH, Birmingham DJ, Nadasdy T. Renal involvement in systemic lupus erythematosus. In: Schrier R, Neilson E, Molitoris B, Coffman T, Falk R, editors. Schrier’s Diseases of the Kidney. 9th Ed. Philadelphia: Lippincott Williams & Wilkins; 2012. pp. 1522–1556. [Google Scholar]
- 2.Dhingra S, Qureshi R, Abdellatif A, Gaber LW, Truong LD. Tubulointerstitial nephritis in systemic lupus erythematosus: Innocent bystander or ominous presage. Histol Histopathol. 2014;29(5):553–565. doi: 10.14670/HH-29.10.553. [DOI] [PubMed] [Google Scholar]
- 3.Hsieh C, et al. Predicting outcomes of lupus nephritis with tubulointerstitial inflammation and scarring. Arthritis Care Res (Hoboken) 2011;63(6):865–874. doi: 10.1002/acr.20441. [DOI] [PMC free article] [PubMed] [Google Scholar]
- 4.Chen YE, Korbet SM, Katz RS, Schwartz MM, Lewis EJ. Collaborative Study Group Value of a complete or partial remission in severe lupus nephritis. Clin J Am Soc Nephrol. 2008;3(1):46–53. doi: 10.2215/CJN.03280807. [DOI] [PMC free article] [PubMed] [Google Scholar]
- 5.Müller GA, Markovic-Lipkovski J, Frank J, Rodemann HP. The role of interstitial cells in the progression of renal diseases. J Am Soc Nephrol. 1992;2(10, Suppl):S198–S205. doi: 10.1681/ASN.V210s198. [DOI] [PubMed] [Google Scholar]
- 6.Peruzzi L, et al. Tubulointerstitial responses in the progression of glomerular diseases: albuminuria modulates alpha v beta 5 integrin. Kidney Int. 1996;50(4):1310–1320. doi: 10.1038/ki.1996.443. [DOI] [PubMed] [Google Scholar]
- 7.Schwartz MM, Korbet SM, Rydell J, Borok R, Genchi R. Primary focal segmental glomerular sclerosis in adults: prognostic value of histologic variants. Am J Kidney Dis. 1995;25(6):845–852. doi: 10.1016/0272-6386(95)90566-9. [DOI] [PubMed] [Google Scholar]
- 8.Walsh M, et al. Histopathologic features aid in predicting risk for progression of IgA nephropathy. Clin J Am Soc Nephrol. 2010;5(3):425–430. doi: 10.2215/CJN.06530909. [DOI] [PMC free article] [PubMed] [Google Scholar]
- 9.Hill GS, Delahousse M, Nochy D, Mandet C, Bariéty J. Proteinuria and tubulointerstitial lesions in lupus nephritis. Kidney Int. 2001;60(5):1893–1903. doi: 10.1046/j.1523-1755.2001.00017.x. [DOI] [PubMed] [Google Scholar]
- 10.Pichler R, et al. The pathogenesis of tubulointerstitial disease associated with glomerulonephritis: The glomerular cytokine theory. Miner Electrolyte Metab. 1995;21(4–5):317–327. [PubMed] [Google Scholar]
- 11.Bianco C, Griffin FM, Jr, Silverstein SC. Studies of the macrophage complement receptor. Alteration of receptor function upon macrophage activation. J Exp Med. 1975;141(6):1278–1290. doi: 10.1084/jem.141.6.1278. [DOI] [PMC free article] [PubMed] [Google Scholar]
- 12.Dorrington KJ. Properties of the Fc receptor on macrophages. Immunol Commun. 1976;5(4):263–280. doi: 10.3109/08820137609044280. [DOI] [PubMed] [Google Scholar]
- 13.Farris AB, Colvin RB. Renal interstitial fibrosis: Mechanisms and evaluation. Curr Opin Nephrol Hypertens. 2012;21(3):289–300. doi: 10.1097/MNH.0b013e3283521cfa. [DOI] [PMC free article] [PubMed] [Google Scholar]
- 14.Gomez-Guerrero C, et al. Interaction of immune complexes with Fc receptors in mesangial cells: A potential target for the treatment of IgA nephropathy. Nephrology (Carlton) 2010;3(1):95–101. [Google Scholar]
- 15.Simonson MS, Ismail-Beigi F. Endothelin-1 increases collagen accumulation in renal mesangial cells by stimulating a chemokine and cytokine autocrine signaling loop. J Biol Chem. 2011;286(13):11003–11008. doi: 10.1074/jbc.M110.190793. [DOI] [PMC free article] [PubMed] [Google Scholar]
- 16.Vernon MA, Mylonas KJ, Hughes J. Macrophages and renal fibrosis. Semin Nephrol. 2010;30(3):302–317. doi: 10.1016/j.semnephrol.2010.03.004. [DOI] [PubMed] [Google Scholar]
- 17.Wada T, Yokoyama H, Matsushima K, Kobayashi K. Monocyte chemoattractant protein-1: Does it play a role in diabetic nephropathy? Nephrol Dial Transplant. 2003;18(3):457–459. doi: 10.1093/ndt/18.3.457. [DOI] [PubMed] [Google Scholar]
- 18.Wada T, et al. Gene therapy via blockade of monocyte chemoattractant protein-1 for renal fibrosis. J Am Soc Nephrol. 2004;15(4):940–948. doi: 10.1097/01.asn.0000120371.09769.80. [DOI] [PubMed] [Google Scholar]
- 19.Nikolic-Paterson DJ, Atkins RC. The role of macrophages in glomerulonephritis. Nephrol Dial Transplant. 2001;16(Suppl 5):3–7. doi: 10.1093/ndt/16.suppl_5.3. [DOI] [PubMed] [Google Scholar]
- 20.Zhao H, et al. Matrix metalloproteinases contribute to kidney fibrosis in chronic kidney diseases. World J Nephrol. 2013;2(3):84–89. doi: 10.5527/wjn.v2.i3.84. [DOI] [PMC free article] [PubMed] [Google Scholar]
- 21.Floege J, et al. Endogenous fibroblast growth factor-2 mediates cytotoxicity in experimental mesangioproliferative glomerulonephritis. J Am Soc Nephrol. 1998;9(5):792–801. doi: 10.1681/ASN.V95792. [DOI] [PubMed] [Google Scholar]
- 22.Floege J, et al. Localization of fibroblast growth factor-2 (basic FGF) and FGF receptor-1 in adult human kidney. Kidney Int. 1999;56(3):883–897. doi: 10.1046/j.1523-1755.1999.00637.x. [DOI] [PubMed] [Google Scholar]
- 23.Ray PE, et al. bFGF and its low affinity receptors in the pathogenesis of HIV-associated nephropathy in transgenic mice. Kidney Int. 1994;46(3):759–772. doi: 10.1038/ki.1994.331. [DOI] [PubMed] [Google Scholar]
- 24.Strutz F, et al. TGF-beta 1 induces proliferation in human renal fibroblasts via induction of basic fibroblast growth factor (FGF-2) Kidney Int. 2001;59(2):579–592. doi: 10.1046/j.1523-1755.2001.059002579.x. [DOI] [PubMed] [Google Scholar]
- 25.Nakatsuji S, Yamate J, Sakuma S. Macrophages, myofibroblasts, and extracellular matrix accumulation in interstitial fibrosis of chronic progressive nephropathy in aged rats. Vet Pathol. 1998;35(5):352–360. doi: 10.1177/030098589803500504. [DOI] [PubMed] [Google Scholar]
- 26.Strutz F, Zeisberg M. Renal fibroblasts and myofibroblasts in chronic kidney disease. J Am Soc Nephrol. 2006;17(11):2992–2998. doi: 10.1681/ASN.2006050420. [DOI] [PubMed] [Google Scholar]
- 27.Alvarado A, et al. The value of repeat kidney biopsy in quiescent Argentinian lupus nephritis patients. Lupus. 2014;23(8):840–847. doi: 10.1177/0961203313518625. [DOI] [PubMed] [Google Scholar]
- 28.Goel P, Sneyd J, Friedman A. Homogenization of the cell cytoplasm: The calcium bidomain equations. Multiscale Model Simul. 2006;5(4):1045–1062. [Google Scholar]
- 29.Kipari T, et al. Nitric oxide is an important mediator of renal tubular epithelial cell death in vitro and in murine experimental hydronephrosis. Am J Pathol. 2006;169(2):388–399. doi: 10.2353/ajpath.2006.050964. [DOI] [PMC free article] [PubMed] [Google Scholar]
- 30.Dai C, Yang J, Liu Y. Transforming growth factor-beta1 potentiates renal tubular epithelial cell death by a mechanism independent of Smad signaling. J Biol Chem. 2003;278(14):12537–12545. doi: 10.1074/jbc.M300777200. [DOI] [PubMed] [Google Scholar]
- 31.Shankland SJ, et al. Mesangial cell proliferation mediated by PDGF and bFGF is determined by levels of the cyclin kinase inhibitor p27Kip1. Kidney Int. 1997;51(4):1088–1099. doi: 10.1038/ki.1997.151. [DOI] [PubMed] [Google Scholar]
- 32.Fan JM, et al. Transforming growth factor-beta regulates tubular epithelial-myofibroblast transdifferentiation in vitro. Kidney Int. 1999;56(4):1455–1467. doi: 10.1046/j.1523-1755.1999.00656.x. [DOI] [PubMed] [Google Scholar]
- 33.Rastaldi MP, et al. Epithelial-mesenchymal transition of tubular epithelial cells in human renal biopsies. Kidney Int. 2002;62(1):137–146. doi: 10.1046/j.1523-1755.2002.00430.x. [DOI] [PubMed] [Google Scholar]
- 34.Midgley AC, et al. Transforming growth factor-β1 (TGF-β1)-stimulated fibroblast to myofibroblast differentiation is mediated by hyaluronan (HA)-facilitated epidermal growth factor receptor (EGFR) and CD44 co-localization in lipid rafts. J Biol Chem. 2013;288(21):14824–14838. doi: 10.1074/jbc.M113.451336. [DOI] [PMC free article] [PubMed] [Google Scholar]
- 35.Leask A. TGFbeta, cardiac fibroblasts, and the fibrotic response. Cardiovasc Res. 2007;74(2):207–212. doi: 10.1016/j.cardiores.2006.07.012. [DOI] [PubMed] [Google Scholar]
- 36.Leask A, Abraham DJ. TGF-beta signaling and the fibrotic response. FASEB J. 2004;18(7):816–827. doi: 10.1096/fj.03-1273rev. [DOI] [PubMed] [Google Scholar]
- 37.Lijnen P, Petrov V. Transforming growth factor-beta 1-induced collagen production in cultures of cardiac fibroblasts is the result of the appearance of myofibroblasts. Methods Find Exp Clin Pharmacol. 2002;24(6):333–344. doi: 10.1358/mf.2002.24.6.693065. [DOI] [PubMed] [Google Scholar]
- 38.Rovin BH, et al. Urine chemokines as biomarkers of human systemic lupus erythematosus activity. J Am Soc Nephrol. 2005;16(2):467–473. doi: 10.1681/ASN.2004080658. [DOI] [PubMed] [Google Scholar]
- 39.Boor P, Sebeková K, Ostendorf T, Floege J. Treatment targets in renal fibrosis. Nephrol Dial Transplant. 2007;22(12):3391–3407. doi: 10.1093/ndt/gfm393. [DOI] [PubMed] [Google Scholar]
- 40.Chuang PY, Menon MC, He JC. Molecular targets for treatment of kidney fibrosis. J Mol Med (Berl) 2013;91(5):549–559. doi: 10.1007/s00109-012-0983-z. [DOI] [PMC free article] [PubMed] [Google Scholar]
Associated Data
This section collects any data citations, data availability statements, or supplementary materials included in this article.


