

Abstract
MYC overexpression has been implicated in the pathogenesis of most types of human cancers. MYC is likely to contribute to tumorigenesis by its effects on global gene expression. Previously, we have shown that the loss of MYC overexpression is sufficient to reverse tumorigenesis. Here, we show that there is a precise threshold level of MYC expression required for maintaining the tumor phenotype, whereupon there is a switch from a gene expression program of proliferation to a state of proliferative arrest and apoptosis. Oligonucleotide microarray analysis and quantitative PCR were used to identify changes in expression in 3,921 genes, of which 2,348 were down-regulated and 1,573 were up-regulated. Critical changes in gene expression occurred at or near the MYC threshold, including genes implicated in the regulation of the G1-S and G2-M cell cycle checkpoints and death receptor/apoptosis signaling. Using two-dimensional protein analysis followed by mass spectrometry, phospho-flow fluorescence-activated cell sorting, and antibody arrays, we also identified changes at the protein level that contributed to MYC-dependent tumor regression. Proteins involved in mRNA translation decreased below threshold levels of MYC. Thus, at the MYC threshold, there is a loss of its ability to maintain tumorigenesis, with associated shifts in gene and protein expression that reestablish cell cycle checkpoints, halt protein translation, and promote apoptosis.
Introduction
MYC is a transcription factor involved in the regulation of thousands of genes, binding to more than 15% of human promoters (1–4). Recent reports have shown that MYC plays a critical role in modifying chromatin structure and binds to specific modifications in the DNA (5, 6). MYC is overexpressed in the majority of human cancers, suggesting that it commonly plays a role in the pathogenesis of neoplasia (1–3). We and others have used conditional transgenic model systems to show that the suppression of MYC overexpression is sufficient to induce sustained tumor regression in different model systems (7–13). The consequences of MYC inactivation in different tumors have shared certain common features most notably that on MYC inactivation tumors variously undergo proliferative arrest, differentiation, and apoptosis.
MYC has been generally presumed to induce tumorigenesis through its effects as a transcription factor. We hypothesized that there may be a threshold level of MYC expression required to maintain a tumor phenotype. At this threshold, there would be specific changes in gene and protein expression that would define the ability of MYC to function as an oncogene. To address this possibility, we titrated the levels of MYC expression in our conditional tumor model of MYC-induced lymphoma by treating cells with different concentrations of doxycycline. Changes in gene expression were measured by oligonucleotide microarray analysis, quantitative PCR, and changes in protein expression by two-dimensional protein gels, mass spectrometry, and antibody arrays. Phosphorylation changes in proteins were measured by Phospho-Flow. We identified a specific level of MYC required to maintain tumorigenesis and that this is associated with a switch from a cellular state of proliferation to a state of arrest and apoptosis.
Materials and Methods
Transgenic mice
The “Tet system” was used to generate transgenic mice that conditionally express the human MYC cDNA in T-cell lymphocytes, as previously described (9, 14). Tumorigenesis experiments were performed as previously described (13).
Histology
Tissues were fixed in 10% buffered formalin and embedded in paraffin. Sections (5 μm) were stained with H&E.
Terminal deoxynucleotidyl transferase–mediated dUTP nick end labeling assay
Apoptotic cells were detected by the terminal deoxynucleotidyl transferase–mediated dUTP nick end labeling assay in situ death detection kit (Roche Diagnostics) as described by supplier. Cells were counterstained with 4′,6-diamidino-2-phenylindole (Vector Laboratories).
Proliferation assay
Cells were grown in their respective medium requirements and cultures were pulsed with 0.1 mmol/L bromodeoxyuridine (BrdUrd) for 1 h. Cells were collected and fixed with 70% ethanol and stained for BrdUrd incorporation according to the manufacturer’s instructions (BD PharMingen).
Microarray analysis
For gene expression profiling, 50 μg of total RNA from each cell line and 50 μg of pooled sample reference mRNA (derived from the experimental samples at different concentrations of doxycycline treatment) were differentially labeled with Cy5 and Cy3, respectively, and cohybridized to Stanford MEEBO oligonucleotide microarrays according to standard protocols.8
Microarrays were gridded and processed using TIGR SpotFinder version 3.11.9 Threshold for spot inclusion was set at background + 2 SDs. Approximately 8% of spots were flagged as bad and were excluded from further analysis. Spots with signal-to-noise ratio greater than two were background checked, and integrated intensities were normalized using TIGR Midas version 2.19. Intensities were corrected using local block Lowess normalization, and SD regularization was performed within and across slides. Finally, a low intensity filter was applied (minimum integrated intensity of 20,000 in both channels). Expression data were converted to log2 ratios using TIGR MeV, median centered by array.
To identify genes differentially expressed below/above threshold, we grouped them, excluding the array at MYC threshold (doxycycline, 0.05 ng/mL), and used the two class unpaired analysis option of significance analysis of microarrays (SAM). The false discovery rate (FDR), which estimates the proportion of genes identified as significant by chance, was adjusted to ~5%. Significant networks were identified by supplying to IPA the list of significant SAM genes, together with their mean fold change.
Quantitation of mRNA by real-time PCR
Total RNA was extracted and purified using Trizol reagent (Invitrogen). After DNase I digestion (Invitrogen), 2 μg of total RNA were reverse transcribed by SuperScript II reverse transcriptase (Invitrogen) according to the manufacturer’s protocol. Real-time PCR analysis was carried out on an ABI Prism 7900HT system (Applied Biosystems) using SYBR Green (Stratagene). Standard curves were generated by a serial dilution of cDNA pooled from all RNA samples. Each mRNA is normalized to that of ubiquitin. Results were visualized using TreeView (Eisen).
Immunodetection
Cell extracts were prepared by washing 2 × 10⁶ cells in ice-cold PBS and harvesting in lysis buffer [20 mmol/L Tris (pH 7.5), 150 mmol/L NaCl, 1 mmol/L EDTA, 1 mmol/L EGTA, 1% Triton X-100, 2.5 mmol/L Na2PO4, 1 mmol/L h-glycerolphosphate, 1 mmol/L Na3VO4, 1 μg/mL leupeptin, 1 mmol/L phenylmethylsulfonyl fluoride, protease inhibitor cocktail tablet (Boehringer Mannheim)]. Extracts were immuno-blotted using standard procedures.
Results
Threshold level of MYC expression is required to maintain tumorigenesis
Conditional overexpression of MYC using the tetracycline regulatory system (Tet system) drives development of T-cell lymphomas in FVB/N mice, as we have previously described (8). Notably, we found that the tumors arising in these mice express MYC protein levels similar to that expressed in human Burkitt’s lymphoma–derived tumor cell lines and at higher levels than in proliferating EBV-transformed normal human lymphocytes (Fig. 1A; Supplementary Fig. S1A and B). We conclude that in our tumor model system MYC is expressed at levels that approximate those seen in Burkitt’s lymphoma.
Figure 1.

MYC expression of murine transgenic tumors and human Burkitt’s lymphoma. A, Western blot analysis of MYC proteins in EμSrα-tTA MYC transgenic mice tumors (6814, 6816, 5720, 966, and 6780), Burkitt’s lymphomas (Daudi, Raji, and Jujoye), and normal EBV-transformed lymphocytes (KRA, KRB, and GM). B, mice transplanted with EμSrα-tTA MYC tumors express varying levels of MYC when treated with different concentrations of doxycycline in their drinking water from 0 to 0.5 μg/mL. MYC expression was measured by Western blot analysis. C, EμSrα-tTA MYC tumors transplanted in mice respond differentially to varying levels of doxycycline treatment. Mice were treated with doxycycline in their drinking water (0, 0.05, 0.1, 0.15, 0.2, 0.25, 0.5, and 100 μg/mL) and tumor regression was measured. Changes in tumor size are indicated as percent of original tumor size. See Supplementary Fig. S1 for quantitations.
Previously, we and others have described that the suppression of MYC overexpression is sufficient to result in sustained tumor regression (7, 9–11, 14–16). To interrogate the precise level of MYC overexpression required to maintain tumorigenesis in vivo, we transplanted transgenic tumors into syngeneic hosts and then titrated levels of MYC expression in tumors by providing the mice different concentrations of doxycycline in their drinking water. We confirmed that in this way we could titrate the level of MYC protein expression (Fig. 1B; Supplementary Fig. S1C). Importantly, tumors in mice regressed when they were treated with >0.1 μg/mL doxycycline in their drinking water, although the MYC transgene continued to be detectably expressed as measured by Western blot analysis, whereas tumors continued to grow in mice administered ≤0.05 μg/mL doxycycline (Fig. 1C). Expression of transgenic MYC was up to 30 times higher than that of endogenous MYC, as measured by quantitative PCR (data not shown). To measure the serum concentration of doxycycline, a Tet system luciferase reporter cell line was used (Supplementary Fig. S2). The measured luciferase activity was then used to determine serum doxycycline concentration. The plasma concentration of doxycycline in mice was 0.2 ng/mL when the tumors regressed, corresponding to 0.05 μg/mL in their drinking water. Thus, partial inhibition of MYC expression can induce tumor regression.
Similarly, we found that we could titrate the level of expression of MYC in vitro to study how the level of MYC inhibition affects tumor regression (Fig. 2A; Supplementary Fig. S1D). Levels of MYC expression correlated with the protein expression of known MYC target genes, odc and cyclin D1 (Supplementary Fig. S1E). We found that at a specific level of doxycycline in vitro (0.05 ng/mL) and associated MYC expression, tumor cells ceased to proliferate (Fig. 2B), exhibited reduced rates of DNA synthesis as measured by BrdUrd incorporation (Fig. 2C), underwent apoptosis as measured by Annexin V/7-aminoactinomycin D (7AAD) stain (Fig. 2C), and exhibited reduced cell size (Fig. 2D). We concluded that there is a threshold level of MYC expression at which tumor cells lose their neoplastic properties and undergo proliferative arrest and apoptosis.
Figure 2.
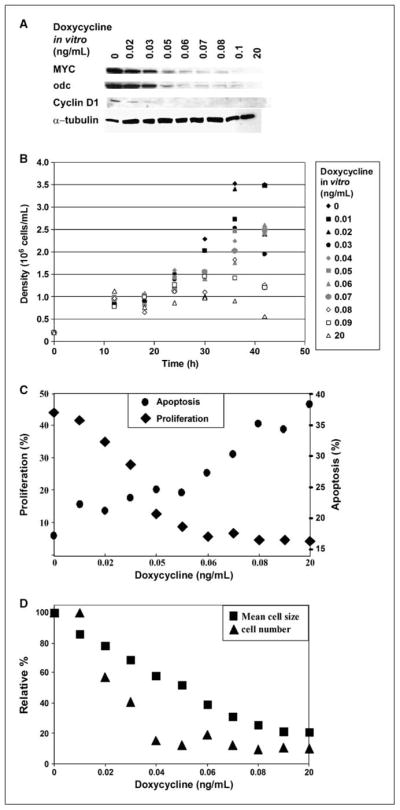
A specific level of MYC expression correlates with proliferation, death, and cell size. A, MYC-expressing tumor cells grown in tissue culture were treated in culture with different concentrations of doxycycline (0.01–20 ng/mL). MYC expression was analyzed by Western blot. The expression of the MYC target genes odc and cyclin D1 are also shown. B, cells that express decreasing levels of MYC have lowered growth rates. Cells were plated at the density of 0.2 × 10⁶/mL and counted every 6 h. C, cells with decreasing levels of MYC have lowered rates of proliferation and arrest when cells express a threshold level of MYC (◆). Cells were treated with BrdUrd for 1 h in the tissue culture medium and analyzed for BrdUrd incorporation by FACS using an anti-BrdUrd antibody. ●, cells with decreasing levels of MYC increase the level of cell death at the threshold level of MYC expression. Apoptosis was measured by FACS for the incorporation of Annexin V and 7AAD. Cells that incorporated both Annexin V and 7AAD were considered as undergoing apoptosis. D, cells with decreasing levels of MYC cease to divide and decrease in size. Cell numbers were counted in culture and cell size was measured using forward scatter by flow cytometry.
Changes in gene expression programs at MYC threshold levels
Global changes in gene expression were measured in MYC-induced tumor cells at precise levels of MYC expression by treatment with different doxycycline concentrations. Most significant changes in gene expression following complete MYC inactivation occurred within 24 h (Fig. 3A). Gene expression was measured at different levels of MYC expression after 24 h of doxycycline treatment using mouse MEEBO oligonucleotide microarrays. Data are available in Gene Expression Omnibus10 under accession GSE10200. To identify discreet binary step changes in gene expression, microarray data were analyzed by StepMiner (Fig. 3B; ref. 17). We identified 1,863 probes that were up-regulated in the titration series, whereas 2,069 were down-regulated (FDR = 0.17). Notably, the number of down-regulated genes peaked at, or just below, the MYC threshold level with doxycycline treatment of 0.05 ng/mL (Fig. 3C).
Figure 3.

MYC inactivation induced changes in gene expression. A, changes in gene program following MYC inactivation are complete after 24 h of MYC inactivation; EμSrα-tTA MYC-expressing tumor cells were treated with 20 ng/mL doxycycline. Cells were analyzed for changes in gene expression at 6, 12, 18, 24, 30, and 38 h following treatment by cDNA microarray. Temporal changes in gene expression were analyzed using StepMiner (P ≤ 0.05). B, changes in gene expression for different levels of MYC inactivation after 24 h. EμSrα-tTA MYC-expressing tumor T cells were treated with increasing concentrations of doxycycline (0.01–20 ng/mL). The tumor cells were analyzed for changes in gene expression after 24 h of treatment using mouse MEEBO oligonucleotide microarrays. Step changes in gene expression were determined using StepMiner (FDR <5%). C, number of microarray probes detected by StepMiner that transit in expression level at the different levels of MYC expression (P < 0.05). D, quantitative analysis of MYC target gene expression. The expression of 43 different genes known to be regulated by MYC was analyzed using real-time quantitative PCR. Gene expression was normalized to ubiquitin c and transformed to log2 ratio.
To investigate changes in expression of known MYC target genes, we compared our data to 1,697 genes annotated in the MYC Target Gene Database (18, 19). The array data contain 1,445 probes, corresponding to 937 unique MYC target genes. Four hundred and two had a statistically significant binary transition in expression level (StepMiner; P = 0.05). Three hundred and fourteen MYC target genes were down-regulated during progressive MYC inactivation, whereas 88 were up-regulated. The changes in MYC targets at varying MYC expression levels are shown along with their gene symbols (Supplementary Table S1). Major changes in transcriptional activity occurred up to the 0.05 ng/mL doxycycline treatment, thus supporting the existence of a MYC threshold at the gene expression level. Our results were then compared with a set of 756 direct MYC targets in human B cells (20). Five hundred and forty-one of our probes mapped to those genes and 423 (79%) probes showed the same change correlating with MYC expression (induction or repression) in both studies. The ability of MYC to alternatively induce or repress a target gene in a tissue- and species-specific manner has been observed previously (11, 15, 21–29).
To validate our microarray data, the mRNA expression levels of 43 genes known to be regulated by MYC were quantified using real-time quantitative PCR (Fig. 3D). A strong correlation was found between levels of MYC expression and known MYC targets (cdc25, cad1, odc, cad, cul1, elf4e, gpat, tfrc, fkbp 53, p16ink4, dhfr, nup120, e2f1, and bap). Notably, all of these genes also exhibited significant step decreases in expression at 0.05 to 0.06 ng/mL doxycycline treatments corresponding to the MYC expression threshold required to maintain a neoplastic phenotype. Thus, gene expression levels measured by microarray analysis correlated well with real-time quantitative PCR (Supplementary Fig. S3).
Ingenuity pathway analysis identifies an interaction network connected to MYC
To identify gene expression programs that formed a MYC interaction network, we used Ingenuity Pathways Analysis (IPA; Ingenuity Systems, Inc.). SAM (30) was used to identify 1,573 probes for genes that were up-regulated, and 2,348 probes that were down-regulated, when MYC expression decreased below threshold, with a FDR of ~5%. These represent 7.7% and 11.7% of the measured probes (22,039), respectively. We then constructed a network of 127 genes downstream of MYC using IPA. These genes were organized according to the subcellular localization of their products (Supplementary Fig. S4). The network of 127 genes was annotated by IPA as relevant to apoptosis (P = 5.1 × 10⁻²¹), cell growth (P = 4.5 × 10⁻⁹), and proliferation (P = 4.9 × 10⁻¹⁵). In addition, cell cycle function was prominent, including regulation of G1 phase (P = 2.3 × 10⁻¹³), S phase (P = 5.9 × 10⁻¹³), cell division (P = 1.8 × 10⁻¹²), and G2 phase (P = 3.3 × 10⁻¹¹). Interestingly, MYC inactivation directly affects protein synthesis (P = 1.2 × 10⁻¹²) by reducing expression of ribosomal protein genes. Thus, we were able to identify a MYC interaction network.
MYC inactivation induces a shift in transcriptional programs affecting the cell cycle and apoptosis
By analyzing only genes whose changes in expression were found to be significant through SAM analysis, we were able to use IPA to identify 35 gene networks, characterized by highly connected genes (“hubs”), and processes associated with them (Table 1). These networks were broadly perturbed in MYC-overexpressing proliferating tumor cells compared with cells where MYC levels are insufficient to maintain proliferation. Importantly, our approach enabled us to identify both direct and indirect effects of MYC inactivation that would not necessarily correlate with levels of MYC expression.
Table 1.
Significant gene networks significantly expressed below/above threshold, determined by SAM + IPA
| Network | Score | “Hub” genes | Functions |
|---|---|---|---|
| 1 | 24 | Myc | Cellular transformation and proliferation |
| 2 | 24 | Bcl2, Ran | Apoptosis, RNA splicing, nucleocytoplasmic transport |
| 3 | 24 | Ccnd1 (Bcl1), Cul1 | Stem cell factor ubiquitin ligase complex |
| 4 | 24 | Fn1 | Cell adhesion |
| 5 | 24 | Egfr, small nuclear riboproteins | DNA synthesis, cell proliferation |
| 6 | 24 | Mapk7, Mapk14, Titf1 | Cytokine production, transcription termination |
| 7 | 24 | Rb1 | Tumor suppression, epigenetic transcriptional regulation, cell cycle control |
| 8 | 24 | H-Ras | Cellular transformation |
| 9 | 24 | Vim, Agt | Cell morphology and integrity |
| 10 | 24 | Il10, Chuk | Cytokine synthesis, modulation of NF-ÊÂ complex |
| 11 | 24 | Erbb2 | Growth factor receptor production |
| 12 | 24 | NF-κβ ia, Tnfaip3, Ikbkg, Traf2 | Cell adhesion, immune and proinflammatory responses, apoptosis, differentiation and growth |
| 13 | 24 | Crebbp, Ncoa2, Ncoa3 | Nuclear receptor coactivation |
| 14 | 24 | Cepb, Eif*, Pabpc1 | Regulation of immune/inflammatory responses, mRNA metabolism |
| 15 | 24 | Cdkn1b, Cops*, Eif*, Psmd1 | Cell cycle arrest, regulation of transcription and ubiquitin ligase, proteasome |
| 16 | 24 | Bcl2l1, Cycs, Casp8/Casp9, Bax | Apoptosis |
| 17 | 24 | Egr1, Nr5a1, Fbl, Exosc | Proliferation, pre-RNA processing (exosome complex) |
| 18 | 24 | App, Nfatc1 | T-cell activation, apoptosis, inhibition of notch signaling |
| 19 | 24 | Grb2, Rala, Sumo2, Ncl | Epidermal growth factor/platelet-derived growth factor signaling and Ras signaling, posttranslational modification, chromatin decondensation |
| 20 | 24 | Creb1, Sumo1, Hdac* | Histone deacetylation, transcription regulation |
| 21 | 24 | Prkar1a, Cox*, Gabpa, Icam1 | Tumor suppression, mitochondrial structure, integrin binding |
| 22 | 24 | Tgfbr2, Smad1, Smad2, Smad3, Smad4, Mmp13 | Tumor growth factor signaling, collagen degradation |
| 23 | 24 | Cdkn2a | Tumor suppression, G1–G2 cell cycle arrest |
| 24 | 24 | Igf2, Mcm2, Pcaf, Myst2/Myst4 | Cell growth, DNA replication, histone acetylation |
| 25 | 24 | Il15, Polr* | Stimulation of T-cell proliferation, transcription |
| 26 | 24 | Epo, Jak1 | Cytokine receptor signal transduction |
| 27 | 24 | Tpb, Smarc* | Transcription initiation, chromatin structure regulation |
| 28 | 24 | Itgam, Clec11a | Integrin adhesion, stimulation and proliferation of hematopoietic precursors |
| 29 | 24 | Myb, Sod1, Cdk4 | Hematopoietic precursor proliferation, free radical destruction, G1-S cell cycle progression |
| 30 | 24 | Shh, Cd44, Fgf10 | Proliferation signaling, cell differentiation |
| 31 | 24 | Irf1, Ifnb1, Isg15, Tnfrsf1b | IFN regulation and ubiquitination, apoptosis |
| 32 | 24 | Tra@, Cd247, Gata3, Parp1 | T-cell receptor signaling, excision repair pathway |
| 33 | 24 | Rhoa, Gnaq, Plcb1, Gnb1 | G protein signaling, focal adhesion point and actin fiber formation |
| 34 | 24 | Mdm2, Pax3 | p53, Rb, E2F1 regulation, apoptosis |
| 35 | 20 | Ywhaz | Apoptosis, T-cell receptor signaling, histone modification |
NOTE: For each network, prominent hub (highly connected) genes and cellular functions that are associated with the IPA network are listed. Network scores are −log(P value).
Gene networks specifically connected with cellular proliferation and transformation were differentially activated below/above the defined MYC threshold. The most significant networks were associated with MYC itself, the retinoblastoma tumor suppressor gene Rb1, and the H-Ras oncogene (networks 1, 7, and 8; Table 1). We observed that as MYC drops below threshold, an increased expression of Rb1 and reduction in H-Ras expression occurred. Several networks were enriched for genes anticipated to be significant in maintaining cell growth and replication. These included several small nuclear ribosomal proteins (network 5; Table 1), eukaryotic translation initiation factor (EIF) family transcription factors involved in mRNA metabolism (network 14; Table 1), transcriptional and proteasome regulation (network 15), as well as components of RNA polymerase II (network 25). All of these groups of genes were found to be substantially down-regulated as a result of decreasing MYC levels. The networks identified by IPA involved genes crucial for cell cycle control, and their downstream effectors. Specifically, several cell cycle regulators of the G1-S transition were found to be significant hubs of networks 15 and 23, including Cdkn1b (p27) and Cdkn2a (p16), and Cdk4 was found to be a hub of network 29, involving control of cell cycle G1-S phase progression. Components of the signalosome complex, which regulate the ubiquitin conjugation pathway, were down-regulated in tandem with changes in cyclin-dependent kinases (Cdks). Multiple other components of the proteasome and members of the EIF transcription factor families were also down-regulated. Therefore, restoration of cell cycle checkpoints seems critical for the consequence of MYC inactivation.
Gene expression networks involved in apoptosis were also identified, including the Bcl2 pathways, Bcl2l1, Cycs cytochrome c, caspase-8, caspase-9, and the Bcl2-associated factor X, Bax (networks 2 and 16). The changes in gene expression of the Bcl2 hub correlate with the significant increase in apoptosis found when MYC levels decrease below threshold. The tumor necrosis factor (TNF) receptor subunit 1b (Tnfrsf1b; CD120b antigen) is up-regulated as MYC levels decrease in contrast to what might be anticipated. Tnfrsf1b blocks TNF-α–induced apoptosis (hub of network 31). Therefore, increased apoptosis following MYC inactivation is probably induced through the Bcl2/Bax pathway and not through the TNF pathway.
Finally, StepMiner was used to visualize transitions in expression levels in the death receptor/apoptosis and cell cycle pathways (Fig. 4A and B). Genes central to cell cycle control, including Rb1, Chek2, Ccnd3, and Suv39h1, were up-regulated early on initial MYC inactivation (Fig. 4A). Approaching the MYC threshold, G1-S phase inhibitory genes, Top2a, Hdac4, Mdm2, Btrc, and Cdc25b, were up-regulated, whereas transcription factor DP1 (Tfdp1), Cdk4, and E2f6 were down-regulated. At the MYC threshold, Cdkn1b (p27 protein) and Gadd45a (inhibitor of Rb pathway) were up-regulated. On initial MYC inactivation, induction of genes involved in apoptosis and death receptor signaling was evident (Fig. 4B). Casp6 was up-regulated already at 0.01 ng/mL doxycycline treatment. Apoptosis and death receptor signaling genes, such as Rock1, Casp8, Mapk3, and Daxx, increased more prominently as MYC levels decreased, whereas Cycs, Parp1, and Pdcd8 genes decreased. We also observed that initial MYC inactivation down-regulated Bcl2. At threshold, Bcl2l1 was up-regulated, whereas expression of Bax was down-regulated. Hence, we have established that there are distinct step changes in the expression of gene transcriptional programs, critically related to proliferation and apoptosis, which occur as MYC is progressively inactivated.
Figure 4.

MYC inactivation induces a switch from a cellular program of proliferation to apoptosis. A, microarray probes corresponding to annotated transcribed genes involved in G1-S cell cycle checkpoint and G2-M DNA damage checkpoint pathways. Expression changes were visualized using StepMiner (P < 0.1). Doxycycline levels (ng/mL) are shown across the top of the heat map. Gene symbols and identifiers label rows. B, probes corresponding to annotated transcribed genes involved in apoptosis and death receptor signaling pathways.
Multimodal proteomic analysis of the effect of MYC inactivation
We determined if changes in gene expression also reflected changes in protein expression. Evaluation of proteomic changes was performed using multiple approaches, including two-dimensional PAGE and mass spectrometry, antibody arrays, and phospho-flow fluorescence-activated cell sorting (FACS) analysis.
Total proteins were separated from cells expressing different levels of MYC by two-dimensional PAGE (Fig. 5A). Changes in the intensity of the protein spots were analyzed using PDQuest (Bio-Rad Laboratories). We analyzed the data in three groups: MYC ON, comprising MYC-overexpressing cells treated with 0, 0.01, 0.02, and 0.03 ng/mL of doxycycline; threshold (0.04, 0.05, and 0.06 ng/mL of doxycycline); and MYC OFF (0.07, 0.08, 0.09, and 20 ng/mL of doxycycline). We identified 196 ± 12 matched spots for the MYC ON group, 213 ± 19 for the threshold group, and 194 ± 11 spots for the MYC OFF group. One hundred and twenty-eight protein spots were analyzed by mass spectrometry. Some of the spots were analyzed in replicates from the three groups to validate the image analysis. Quantitative changes for 40 proteins identified by mass spectroscopy were visualized using StepMiner (17). The 26S proteasomal regulatory protein 7 and SUMO1, both of which are involved in protein degradation, were up-regulated. Coronin1 and copper zinc superoxide dismutase (CuZn SOD) affect cell motility and were up-regulated before MYC levels reached threshold. Changes in protein disulfide isomerase A3 precursor, nuclear migration protein, HSP71, polyadenylate binding protein, EIF5a, and γ enolase proteins that are expressed when cells are undergoing cellular stress occurred when MYC levels reached threshold. As MYC levels decreased below threshold, changes occurred in several genes that are known to regulate cellular proliferation, including Tom34, EIF, CAAT binding protein, and EF2 (Fig. 5B).
Figure 5.

MYC inactivation and changes in protein expression. A, proteins at different levels of MYC were separated by two-dimensional PAGE. 1 to 17, representative gels for MYC ON, threshold, and MYC OFF are displayed with the proteins that show a change during MYC down-regulation. B, differential expression of proteins in MYC-induced tumor cells expressing different levels of MYC, identified by mass spectrometry. Changes in protein intensity were quantitated by PDQuest. The top proteins exhibited a step change in expression. The intensity of each spot was normalized to the total density of matched spots. The intensity was then normalized to the intensity of ubiquitin, which was identified by mass spectrometry and did not vary with the different treatments. Determination of where the step occurs was done using StepMiner and visualized by TreeView.
Changes in protein expression were compared with gene expression levels. Coronin1, Eif5a, Ef1a1, C/EBP-ζ, and EF2 changed in the same direction. On the other hand, SUMO1 (which degrades cyclins) and CuZn SOD were discordant. Hence, there seem to be posttranscriptional modifications occurring in addition to the expression level effects induced by MYC inactivation. In addition, even if we determined that mRNA levels have stabilized after 24 h of treatment, changes in protein abundances need not necessarily occur on exactly the same time scale.
Antibody arrays were used to analyze changes in the expression of cell surface proteins (Supplementary Materials and Methods and Supplementary Fig. S5). The T-cell lymphomas derived from the EμSrα-tTA/Tet-O-MYC mouse model are CD4/CD8 double-positive cells. During normal T-cell development, CD4/CD8 double-positive cells differentiate into single CD4+ or CD8+ cells. Changes in surface markers during normal lymphoid cell differentiation have been studied and characterized extensively. Based on these studies, we analyzed changes in several surface protein expression following MYC inactivation. Similarly to what is observed in normal T-cell differentiation, we found that MYC inactivation decreased the expression of CD4, CD8, CD28, CD44, CD45, CD71, CD90, CD138, and Mac3; increased the expression of CD3ε, CD5, and CD29; but did not induce changes in CD3, CD9, CD24, CD31, CD47, and TCRa-3 expression (Supplementary Fig. S5A). Reevaluation of these results by FACS revealed that the strongest correlation was between decreasing MYC levels and an increase in CD5 expression (Supplementary Fig. S5B). We specifically assessed changes of CD4 and CD8 expression, but no significant change from double-positive cells to single-positive cells was noted. Changes in both CD3e and CD5 surface protein expression levels correlated with the gene expression (Supplementary Table S4). CD44 surface protein increased as a result of MYC inactivation, but different array probes for CD44 gene transcripts showed both up-regulation and down-regulation. A decrease in CD8a/b and CD28 surface protein levels was accompanied by an increase in their gene expression.
We investigated if MYC inactivation affected protein phosphorylation using phospho-flow FACS analysis (31–33). The states of phosphorylation of 56 phosphoproteins were examined 24 and 36 h after MYC inactivation (Supplementary Fig. S6). The phosphorylation of Lck, Ikkα, and p38 increased already after 24 h of MYC inactivation and Vav, Erk1/2, Mek, Stat3, and cRaf phosphorylation increased after 36 h. An increased level of phosphorylated Vav was reflected in the expression level of the Vav1 gene (Supplementary Table S2). For p38 (Mapk14), levels of phosphorylated protein increased, but gene expression decreased. However, expression of Dpp4 (CD26), an upstream effector of p38 phosphorylation, became up-regulated during MYC inactivation. Changes in the upstream activator may account for increases in phosphorylated p38 even if absolute levels of p38 decreased. The genes encoding Raf1, Stat3, and Mek showed no clear pattern of change in their expression. Thus, suppression of MYC expression was accompanied by changes in protein signaling.
Discussion
Here, we report that there is a precise threshold level of MYC expression that is required to maintain a neoplastic state in murine MYC-driven lymphomas. At this threshold, there was a change in the transcriptional program from one supporting proliferation to one promoting arrest and apoptosis. The level of MYC expression required to maintain oncogenic cell proliferation was significantly lower than the level seen in the human tumor cell lines we examined but higher than the level observed in normal proliferating lymphocytes. Hence, we conclude that in our tumor model system there is a precise threshold level of MYC expression required to maintain a transcriptional program that supports tumorigenesis.
A multitude of genes critical to cellular proliferation, cell cycle checkpoints, and apoptosis changed around this critical threshold level of MYC expression. Specifically, we observed the up-regulation of Rb1 consistent with cell cycle progression through the G1-S phase being blocked. In addition, the transcription factor Tfdp1 (DP1) was down-regulated as MYC levels decrease, associated with the up-regulation of Chek2. Hence, it seemed that, below the threshold, cells were now able to restore cell cycle checkpoint controls associated with proliferative and growth arrest. MYC seems to orchestrate the regulation of gene products that coordinate whether a cell chooses to undergo cellular proliferation or apoptosis, as globally illustrated through IPA analysis (Supplementary Fig. S4).
There are several key future questions to address. First, it remains to be seen if in general tumors exhibit a threshold level of MYC expression required to sustain tumorigenesis. It will be important to identify if a similar threshold effect occurs in different types of tumors that do or do not exhibit MYC overexpression and/or genomic abnormalities in the MYC locus. It is important to note that it is well known that MYC levels are highly heterogeneous in tumors and that even in tumors with genomic amplification or translocation of the MYC locus the levels of MYC expression are highly variable (34). Thus, the threshold level of MYC may be different in different tumors, may depend if MYC is activated through genomic amplification/chromosomal translocation versus epigenetic dysregulation of expression, and may depend if MYC overexpression is an early or late event in tumorigenesis, or the particular context of genetic events. Another important question is whether changes in expression levels reflect the behavior of all cells, or whether we are observing a shift in the distribution of cells in different states of proliferation/apoptosis. Although we cannot resolve this issue using population-level methods, such as microarrays, single-cell flow cytometry measurement of BrdUrd incorporation indicated a sharp drop in the proportion of proliferating cells at the same titration point as expression levels suggested that individual cells were shifting from a program of proliferation to apoptosis. Furthermore, when MYC is completely inactivated, 98% of the changes in gene expression occurred by 24 h of treatment. Thus, the “threshold” MYC level apparently defines the ability of most of the cells to maintain their neoplastic state. Regardless, further investigation will be required to determine whether there are subpopulations that escape the consequences of MYC inactivation.
We found critical changes in gene expression at the MYC threshold. Many of the changes we observed as a result of changes in the MYC expression level concur with many previous reports (20). However, we found discrepancies that may reflect tissue specificity and/or alternative splicing. A similar effect was seen by Chen and colleagues (20), who found that expression of a gene could be positively or negatively correlated with MYC levels depending on cell type. Most notably, Lawlor and colleagues identified genes that were consistently up-regulated or down-regulated in concert with MYC levels. In particular, they proposed a set of 10 direct MYC target genes that are necessary for tumor maintenance in their mouse model. Of these, Dap, Eifebp1, St6gamnac4, and BC037006 seem to be necessary for tumor maintenance in our MYC-induced lymphoma model. We have also examined gene expression changes as a result of MYC inactivation, followed by reactivation, in a murine osteosarcoma model.11 In both that study and the present one, MYC was found to globally regulate ribosomal proteins, as has been described before (35, 36). The similarities observed in the osteosarcoma and lymphoma systems are interesting. However, the consequences of MYC suppression are markedly different in the tumor types. MYC-induced lymphomas arrest, differentiate, and undergo apoptosis on MYC inactivation. In contrast, osteosarcomas arrest, differentiate, or senesce on MYC inactivation. When MYC is reactivated, either the osteosarcomas die or the tumorigenic properties are restored (9, 37).
A unique feature of our study is that we combined genomic analysis with an unbiased proteomic analysis using several methods. We found by two-dimensional PAGE significant changes in the cellular program regulating proliferation versus apoptosis at the MYC threshold (Fig. 5). Notably, E2F family member protein levels changed, as did gene products that are well known to play a major role in the regulation of G1-S transition in the mammalian cell cycle through their regulation of transcriptional targets, including cyclins, Cdks, checkpoint regulators, and DNA repair and replication proteins (38). Additionally, we examined changes in 56 phosphoproteins during MYC inactivation using PhosphoFlow (31–33). Curiously, only a few changes were seen in the phosphoproteins analyzed (Supplementary Fig. S6). Finally, using antibody arrays, we found evidence consistent with the notion that MYC inactivation induces differentiation of lymphomas into more mature lymphocytes (Supplementary Fig. S5). Significantly, some but not all changes at the protein level were reflected in our gene expression data. The most likely explanation is that there are posttranscriptional effects that influence the outcome that will require further experimental dissection. It has been shown recently that, in T-cell lymphoblastic leukemia, NOTCH1 directly regulates MYC in a feed-forward transcriptional network (39).
Our results show that there is a threshold level of MYC required to maintain a tumor phenotype. At this critical threshold level of MYC expression, there is a marked change in the global cellular program from cellular proliferation to proliferative arrest and apoptosis. Importantly, we performed both a gene expression–based analysis as well as a proteomic analysis to identify genes and proteins that may be useful as biomarkers for indicating tumor status. A crucial future direction will be to investigate how different levels of MYC expression influence gene expression and outcome as well as whether this occurs because of different levels of promoter occupancy. Most importantly, we plan to investigate if human tumors also exhibit a threshold level of oncogene expression to maintain tumorigenesis. Our results provide a first glimpse, suggesting that, at least in some cases, partial suppression of the level of MYC overexpression may be sufficient to induce a clinical effect on a tumor.
Supplementary Material
Acknowledgments
Grant support: National Cancer Institute grants 1R01 CA89305-01A1, 3RO1 CA89305-0351, and 1RO1 CA105102; Leukemia and Lymphoma Society; Damon Runyon Foundation; Burroughs Wellcome Fund (D.W. Felsher); Weiland Family Fellowship (C.M. Shachaf); Flight Attendant Medical Research Institute Young Clinical Scientist Award (C.M. Shachaf); National Cancer Institute Integrative Cancer Biology Program grant 3U56 CA112973-03S1 (A.J. Gentles, C.M. Shachaf, D.W. Felsher, and S.K. Plevritis); and NIH N01-HV-28183, 2P01 CA034233-22A1, R01-AI065824, 1U54RR022241, Leukemia and Lymphoma Society 7017-6 (G.P. Nolan).
We thank the members of the Felsher and Plevritis laboratories for their helpful suggestions.
Footnotes
C-H. Wu, D. Sahoo, C. Arvanitis, N. Bradon, D. Dill, D. W. Felsher. Combined analysis of murine and human microarrays and ChIP analysis reveals genes associated with the ability of MYC to maintain tumorigenesis. PLOS Genetics. In press 2008.
Note: Supplementary data for this article are available at Cancer Research Online (http://cancerres.aacrjournals.org/).
Disclosure of Potential Conflicts of Interest
O. Perez: employment, Nodality; consultant, BD Biosciences; patents related to phospho-flow technology. D.W. Felsher: consultant/advisory board, Cell Biosciences. The other authors disclosed no potential conflicts of interest.
References
- 1.Li Z, Van Calcar S, Qu C, Cavenee WK, Zhang MQ, Ren B. A global transcriptional regulatory role for c-Myc in Burkitt’s lymphoma cells. Proc Natl Acad Sci U S A. 2003;100:8164–9. doi: 10.1073/pnas.1332764100. [DOI] [PMC free article] [PubMed] [Google Scholar]
- 2.Fernandez PC, Frank SR, Wang L, et al. Genomic targets of the human c-Myc protein. Genes Dev. 2003;17:1115–29. doi: 10.1101/gad.1067003. [DOI] [PMC free article] [PubMed] [Google Scholar]
- 3.Orian A, van Steensel B, Delrow J, et al. Genomic binding by the Drosophila Myc, Max, Mad/Mnt transcription factor network. Genes Dev. 2003;17:1101–14. doi: 10.1101/gad.1066903. [DOI] [PMC free article] [PubMed] [Google Scholar]
- 4.Adhikary S, Eilers M. Transcriptional regulation and transformation by Myc proteins. Nat Rev Mol Cell Biol. 2005;6:635–45. doi: 10.1038/nrm1703. [DOI] [PubMed] [Google Scholar]
- 5.Guccione E, Martinato F, Finocchiaro G, et al. Myc-binding-site recognition in the human genome is determined by chromatin context. Nat Cell Biol. 2006;8:764–70. doi: 10.1038/ncb1434. [DOI] [PubMed] [Google Scholar]
- 6.Knoepfler PS, Zhang XY, Cheng PF, Gafken PR, McMahon SB, Eisenman RN. Myc influences global chromatin structure. EMBO J. 2006;25:2723–34. doi: 10.1038/sj.emboj.7601152. [DOI] [PMC free article] [PubMed] [Google Scholar]
- 7.D’Cruz CM, Gunther EJ, Boxer RB, et al. c-MYC induces mammary tumorigenesis by means of a preferred pathway involving spontaneous Kras2 mutations. Nat Med. 2001;7:235–9. doi: 10.1038/84691. [DOI] [PubMed] [Google Scholar]
- 8.Felsher DW. Cancer revoked: oncogenes as therapeutic targets. Nat Rev Cancer. 2003;3:375–80. doi: 10.1038/nrc1070. [DOI] [PubMed] [Google Scholar]
- 9.Jain M, Arvanitis C, Chu K, et al. Sustained loss of a neoplastic phenotype by brief inactivation of MYC. Science. 2002;297:102–4. doi: 10.1126/science.1071489. [DOI] [PubMed] [Google Scholar]
- 10.Shachaf CM, Kopelman AM, Arvanitis C, et al. MYC inactivation uncovers pluripotent differentiation and tumour dormancy in hepatocellular cancer. Nature. 2004;431:1112–7. doi: 10.1038/nature03043. [DOI] [PubMed] [Google Scholar]
- 11.Marinkovic D, Marinkovic T, Mahr B, Hess J, Wirth T. Reversible lymphomagenesis in conditionally c-MYC expressing mice. Int J Cancer. 2004;110:336–42. doi: 10.1002/ijc.20099. [DOI] [PubMed] [Google Scholar]
- 12.Pelengaris S, Khan M, Evan GI. Suppression of Myc-induced apoptosis in β cells exposes multiple oncogenic properties of Myc and triggers carcinogenic progression. Cell. 2002;109:321–34. doi: 10.1016/s0092-8674(02)00738-9. [DOI] [PubMed] [Google Scholar]
- 13.Shachaf CM, Perez OD, Youssef S, et al. Inhibition of HMGcoA reductase by atorvastatin prevents and reverses MYC-induced lymphomagenesis. Blood. 2007;110:2674–84. doi: 10.1182/blood-2006-09-048033. [DOI] [PMC free article] [PubMed] [Google Scholar]
- 14.Felsher DW, Bishop JM. Reversible tumorigenesis by MYC in hematopoietic lineages. Mol Cell. 1999;4:199–207. doi: 10.1016/s1097-2765(00)80367-6. [DOI] [PubMed] [Google Scholar]
- 15.Lawlor ER, Soucek L, Brown-Swigart L, Shchors K, Bialucha CU, Evan GI. Reversible kinetic analysis of Myc targets in vivo provides novel insights into Myc-mediated tumorigenesis. Cancer Res. 2006;66:4591–601. doi: 10.1158/0008-5472.CAN-05-3826. [DOI] [PubMed] [Google Scholar]
- 16.Pelengaris S, Abouna S, Cheung L, Ifandi V, Zervou S, Khan M. Brief inactivation of c-Myc is not sufficient for sustained regression of c-Myc-induced tumours of pancreatic islets and skin epidermis. BMC Biol. 2004;2:26. doi: 10.1186/1741-7007-2-26. [DOI] [PMC free article] [PubMed] [Google Scholar]
- 17.Sahoo D, Dill DL, Tibshirani R, Plevritis SK. Extracting binary signals from microarray time-course data. Nucleic Acids Res. 2007;35:3705–12. doi: 10.1093/nar/gkm284. [DOI] [PMC free article] [PubMed] [Google Scholar]
- 18.Dang CV, O’Donnell KA, Zeller KI, Nguyen T, Osthus RC, Li F. The c-Myc target gene network. Semin Cancer Biol. 2006;16:253–64. doi: 10.1016/j.semcancer.2006.07.014. [DOI] [PubMed] [Google Scholar]
- 19.Zeller KI, Jegga AG, Aronow BJ, O’Donnell KA, Dang CV. An integrated database of genes responsive to the Myc oncogenic transcription factor: identification of direct genomic targets. Genome Biol. 2003;4:R69. doi: 10.1186/gb-2003-4-10-r69. [DOI] [PMC free article] [PubMed] [Google Scholar]
- 20.Zeller KI, Zhao X, Lee CW, et al. Global mapping of c-Myc binding sites and target gene networks in human B cells. Proc Natl Acad Sci U S A. 2006;103:17834–9. doi: 10.1073/pnas.0604129103. [DOI] [PMC free article] [PubMed] [Google Scholar]
- 21.Wechsler DS, Papoulas O, Dang CV, Kingston RE. Differential binding of c-Myc and Max to nucleosomal DNA. Mol Cell Biol. 1994;14:4097–107. doi: 10.1128/mcb.14.6.4097. [DOI] [PMC free article] [PubMed] [Google Scholar]
- 22.Chan KL, Guan XY, Ng IO. High-throughput tissue microarray analysis of c-myc activation in chronic liver diseases and hepatocellular carcinoma. Hum Pathol. 2004;35:1324–31. doi: 10.1016/j.humpath.2004.06.012. [DOI] [PubMed] [Google Scholar]
- 23.Ellwood-Yen K, Graeber TG, Wongvipat J, et al. Myc-driven murine prostate cancer shares molecular features with human prostate tumors. Cancer Cell. 2003;4:223–38. doi: 10.1016/s1535-6108(03)00197-1. [DOI] [PubMed] [Google Scholar]
- 24.Watson JD, Oster SK, Shago M, Khosravi F, Penn LZ. Identifying genes regulated in a Myc-dependent manner. J Biol Chem. 2002;277:36921–30. doi: 10.1074/jbc.M201493200. [DOI] [PubMed] [Google Scholar]
- 25.Menssen A, Hermeking H. Characterization of the c-MYC-regulated transcriptome by SAGE: identification and analysis of c-MYC target genes. Proc Natl Acad Sci U S A. 2002;99:6274–9. doi: 10.1073/pnas.082005599. [DOI] [PMC free article] [PubMed] [Google Scholar]
- 26.Neiman PE, Ruddell A, Jasoni C, et al. Analysis of gene expression during myc oncogene-induced lymphomagenesis in the bursa of Fabricius. Proc Natl Acad Sci U S A. 2001;98:6378–83. doi: 10.1073/pnas.111144898. [DOI] [PMC free article] [PubMed] [Google Scholar]
- 27.Guo QM, Malek RL, Kim S, et al. Identification of c-myc responsive genes using rat cDNA microarray. Cancer Res. 2000;60:5922–8. [PubMed] [Google Scholar]
- 28.Huang E, Ishida S, Pittman J, et al. Gene expression phenotypic models that predict the activity of oncogenic pathways. Nat Genet. 2003;34:226–30. doi: 10.1038/ng1167. [DOI] [PubMed] [Google Scholar]
- 29.Iizuka N, Tsunedomi R, Tamesa T, et al. Involvement of c-myc-regulated genes in hepatocellular carcinoma related to genotype-C hepatitis B virus. J Cancer Res Clin Oncol. 2006;132:473–81. doi: 10.1007/s00432-006-0094-8. [DOI] [PubMed] [Google Scholar]
- 30.Tusher VG, Tibshirani R, Chu G. Significance analysis of microarrays applied to the ionizing radiation response. Proc Natl Acad Sci U S A. 2001;98:5116–21. doi: 10.1073/pnas.091062498. [DOI] [PMC free article] [PubMed] [Google Scholar]
- 31.Irish JM, Hovland R, Krutzik PO, et al. Single cell profiling of potentiated phosphoprotein networks in cancer cells. Cell. 2004;118:217–28. doi: 10.1016/j.cell.2004.06.028. [DOI] [PubMed] [Google Scholar]
- 32.Krutzik PO, Irish JM, Nolan GP, Perez OD. Analysis of protein phosphorylation and cellular signaling events by flow cytometry: techniques and clinical applications. Clin Immunol. 2004;110:206–21. doi: 10.1016/j.clim.2003.11.009. [DOI] [PubMed] [Google Scholar]
- 33.Perez OD, Krutzik PO, Nolan GP. Flow cytometric analysis of kinase signaling cascades. Methods Mol Biol. 2004;263:67–94. doi: 10.1385/1-59259-773-4:067. [DOI] [PubMed] [Google Scholar]
- 34.Saez AI, Artiga MJ, Romero C, et al. Development of a real-time reverse transcription polymerase chain reaction assay for c-myc expression that allows the identification of a subset of c-myc+ diffuse large B-cell lymphoma. Lab Invest. 2003;83:143–52. doi: 10.1097/01.lab.0000057000.41585.fd. [DOI] [PubMed] [Google Scholar]
- 35.Grewal SS, Li L, Orian A, Eisenman RN, Edgar BA. Myc-dependent regulation of ribosomal RNA synthesis during Drosophila development. Nat Cell Biol. 2005;7:295–302. doi: 10.1038/ncb1223. [DOI] [PubMed] [Google Scholar]
- 36.Grandori C, Gomez-Roman N, Felton-Edkins ZA, et al. c-Myc binds to human ribosomal DNA and stimulates transcription of rRNA genes by RNA polymerase I. Nat Cell Biol. 2005;7:311–8. doi: 10.1038/ncb1224. [DOI] [PubMed] [Google Scholar]
- 37.Wu CH, van Riggelen J, Yetil A, Fan AC, Bachireddy P, Felsher DW. Cellular senescence is an important mechanism of tumor regression upon c-Myc inactivation. Proc Natl Acad Sci U S A. 2007;104:13028–33. doi: 10.1073/pnas.0701953104. [DOI] [PMC free article] [PubMed] [Google Scholar]
- 38.Zwicker J, Liu N, Engeland K, Lucibello FC, Muller R. Cell cycle regulation of E2F site occupation in vivo. Science. 1996;271:1595–7. doi: 10.1126/science.271.5255.1595. [DOI] [PubMed] [Google Scholar]
- 39.Palomero T, Lim WK, Odom DT, et al. NOTCH1 directly regulates c-MYC and activates a feed-forward-loop transcriptional network promoting leukemic cell growth. Proc Natl Acad Sci U S A. 2006;103:18261–6. doi: 10.1073/pnas.0606108103. [DOI] [PMC free article] [PubMed] [Google Scholar]
Associated Data
This section collects any data citations, data availability statements, or supplementary materials included in this article.