Abstract
The estrogen receptors (ERs) ERα and ERβ mediate the actions of endogenous estrogens as well as those of botanical estrogens (BEs) present in plants. BEs are ingested in the diet and also widely consumed by postmenopausal women as dietary supplements, often as a substitute for the loss of endogenous estrogens at menopause. However, their activities and efficacies, and similarities and differences in gene expression programs with respect to endogenous estrogens such as estradiol (E2) are not fully understood. Because gene expression patterns underlie and control the broad physiological effects of estrogens, we have investigated and compared the gene networks that are regulated by different BEs and by E2. Our aim was to determine if the soy and licorice BEs control similar or different gene expression programs and to compare their gene regulations with that of E2. Gene expression was examined by RNA-Seq in human breast cancer (MCF7) cells treated with control vehicle, BE or E2. These cells contained three different complements of ERs, ERα only, ERα+ERβ, or ERβ only, reflecting the different ratios of these two receptors in different human breast cancers and in different estrogen target cells. Using principal component, hierarchical clustering, and gene ontology and interactome analyses, we found that BEs regulated many of the same genes as did E2. The genes regulated by each BE, however, were somewhat different from one another, with some genes being regulated uniquely by each compound. The overlap with E2 in regulated genes was greatest for the soy isoflavones genistein and S-equol, while the greatest difference from E2 in gene expression pattern was observed for the licorice root BE liquiritigenin. The gene expression pattern of each ligand depended greatly on the cell background of ERs present. Despite similarities in gene expression pattern with E2, the BEs were generally less stimulatory of genes promoting proliferation and were more pro-apoptotic in their gene regulations than E2. The distinctive patterns of gene regulation by the individual BEs and E2 may underlie differences in the activities of these soy and licorice-derived BEs in estrogen target cells containing different levels of the two ERs.
Keywords: botanical estrogens, ERα, ERβ, gene regulatory networks, transcriptome, genistein, equol, liquiritigenin, soy, licorice
Introduction
The estrogen receptors (ERs), ERα and ERβ, are members of the nuclear receptor superfamily that are expressed in reproductive and non-reproductive tissues and in hormone-dependent cancers, such as breast cancer, in which they mediate the many physiological activities of estrogens in. In different target cells, the two receptor subtypes are present separately or together. ERα and ERβ can be activated by endogenous estrogens, such as estradiol (E2), but they can also be activated by estrogenic compounds present in plants, known as botanical estrogens (BEs), that are ingested in the diet and can be formulated into dietary supplements. BEs are widely consumed by women as dietary supplements, often in the hopes of having them serve as a substitute for the loss of endogenous estrogens at menopause, but their activities, efficacies and safety are not fully understood. The major isoflavone components in soy-based products and dietary supplements, genistein and S-equol, are known to bind to ERα and ERβ [1], and to have estrogenic effects. However, preclinical studies [2,3] and clinical studies in humans have given inconclusive results regarding the efficacy and beneficial actions of these components in aging females [1,4–6]. Licorice root-derived components consumed in the diet or as dietary supplements, such as liquiritigenin, also bind to the two ERs, but even less is known about their biological activities compared to E2 [1,7].
Because gene regulatory networks underlie and control the broad physiological effects of hormones such as the endogenously produced estrogen, E2, in estrogen target cells and in ER-containing breast cancers, we have investigated and compared the gene regulatory networks that are controlled by different BEs and by E2. Our aim was to determine if the soy and licorice BEs regulate similar or different gene expression programs and to compare their gene regulations with that elicited by the endogenous estrogen E2.
ERα and ERβ are encoded by genes on different chromosomes, and the levels of ERα and ERβ differ in different estrogen target cells [8,9]. Therefore, we have investigated the effects of the BEs on gene regulation in cells containing ERα or ERβ only, or both ERα and ERβ. Our studies employing genome-wide RNA-Seq [10], principal component analysis (PCA) [11,12], and hierarchical clustering and functional pathway interactome analyses allow a discrimination among the BEs and identify similarities and differences in their gene regulation from that evoked by E2. The studies also enable delineation of the transcriptional effects of BEs in cells with co-presence of both ERα and ERβ versus effects of the BEs when acting through only one of the ERs, ERα or ERβ, in order to mirror the situation in different ER target tissues. Our findings highlight that the background complement of receptors is a crucial determinant of the activities of BEs and E2 in target cells.
Many reports have examined through microarrays the effects of E2 on gene expression in MCF-7 cells, some of which have been analyzed to generate a gene expression metasignature [13], and we recently reported on the impact of the two ERs on gene expression programs regulated by E2 [14]. The studies reported here are the first to our knowledge to provide novel datasets and analyses that compare the genome-wide patterns of gene regulation for three BEs and E2 in MCF-7 cells containing three different complements of the ERs.
Results
Patterns of gene regulation by botanical estrogens (BEs) and Estradiol (E2) in MCF-7 Cells with three complements of ERα and ERβ
We used RNA-seq to examine the patterns of gene expression regulation by different BEs in breast cancer cells containing three complements of ERα and ERβ, as schematized in the left panel of Figure 1 . ERβ was introduced into MCF-7 cells containing endogenous ERα by adenoviral infection, to generate ERα+ERβ cells, and subsequent knockdown of ERα with siRNA gave cells containing ERβ only. As reported previously, these cells expressed equivalent amounts of ERα and ERβ [1,14,15]. Cells were treated with BE or E2, and RNA was collected for RNA-seq analysis. The BEs studied included the soy-derived BEs, genistein and S-equol, and liquiritigenin, derived from licorice. In our previous studies, we used microarray analysis to identify E2 regulated genes in the three different ER-containing cell backgrounds. Because RNA-seq is more sensitive and informative [16], we used this method in the current study. Nearly all of the E2-regulated genes identified from our prior microarray analyses (77%) were also identified by RNA-seq, but the new datasets included many more E2-regulated genes (see Figure 1 , right panel).
Figure 1. Experimental design and compounds studied (left panel) and comparison of E2 regulated genes obtained by RNA Seq vs. microarray analysis (right panel).
Left panel: schematic of the experimental design for generating MCF-7 cells containing the three complements of ERα and ERβ, and for the cell treatments with BEs or E2, and preparation of the RNA-seq samples. Cells were treated with control vehicle (0.1% ethanol), genistein, S-equol or liquiritigenin (1 µM) or E2 (10 nM) for 24 h prior to harvest of RNA and further processing. Right panel: MCF-7 cells were exposed to 10-8M estradiol (E2) for 24h and RNA was isolated and analyzed by RNA-Seq (this study) or previously by Affymetrix microarrays (ref. 14, Mol Syst Biol 2013). Venn diagram shows the number of genes regulated by E2 and the percent of E2-regulated genes found to be regulated by microarray analysis that overlap with those found by RNA-seq analysis.
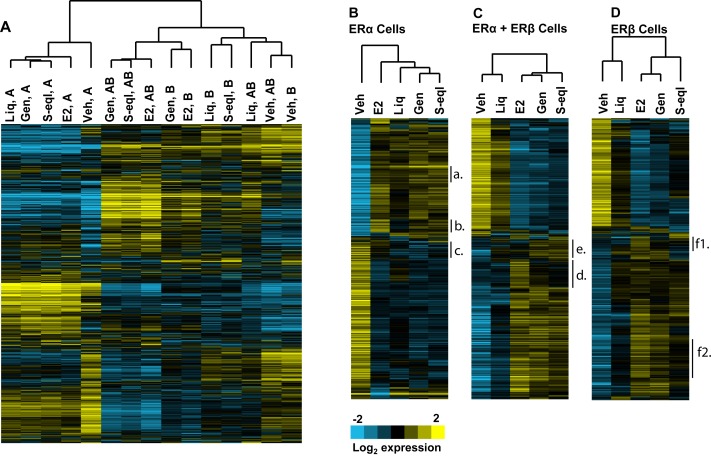
Hierarchical clustering of the gene expression patterns ( Figure 2 ) revealed differences in gene expression based on the particular nature of the ligand (different BEs vs. E2) and differences dependent on the complement of the two ERs present in the cells. Although genistein and S-equol tended to cluster together and with E2, the expression patterns for liquiritigenin were considerably different ( Figure 2A ). Hierarchical clustering of genes regulated by E2 and BEs in the three ER cell backgrounds ( Figure 2B-D ) shows genes up-regulated less by BE vs. E2, or up-regulated more by BE vs. E2 in ERα-only cells, as well as genes down-regulated more by BEs vs. E2 in the three different ER backgrounds. Next, we used web-based DAVID software to examine overrepresented functional gene groups in clusters that are differentially regulated by E2 vs. BEs. We show a few such clusters in Figure 2B, C and D (labelled a-f) and gene ontology (GO) terms associated with each cluster are indicated in Table 1 . From this analysis, inflammatory responses were activated by E2 in all three cell backgrounds whereas BEs minimally activated these pathways (clusters b, d and f). Moreover, E2 induced cell motility genes (cluster c) in ERα only cells whereas BEs repressed expression of these genes. Finally, genistein and S-equol differentially activated genes associated with the DNA damage repair pathway (cluster e) in ERα+ERβ cells whereas E2 and liquiritigenin did not activate these genes.
Figure 2. Hierarchical clustering of the genes regulated by BEs and E2 in the 3 ER cell backgrounds.
Hierarchical clustering is shown for all four compounds and cell backgrounds (Panel A), and individually for ERα only (Panel B), ERα + ERβ (Panel C), and ERβ only (Panel D) cells. Several identified clusters showing different patterns of gene regulation by the ligands in the different cell backgrounds are denoted by letters a-f.
Table 1. Gene Ontology (GO) terms identified using the clustering approach in Figure 2.
Identified gene lists were exported and further analyzed using DAVID software.
| Cell type |
Cluster (Fig. 2) |
GO term | Genes | P-value |
|---|---|---|---|---|
| ERα only | a | Response to hormone stimulus | RERG, GAL, IRS1, IGF1R, NPY1R, PTCH1 | 2.2X10⁻² |
| b | Inflammatory response | CCL2, CXCL10, FN1, ITGAL, IL6R, IL8, SERPINA3, TLR7, TNF | 2.3X10⁻⁵ | |
| Regulation of cell proliferation | KLF4, CCL2, CXCL10, CSF3, FRK, IL6R, IL8, LIF, PLA2G4A, STAT5A, TNF | 5.1X10⁻⁴ | ||
| Cell adhesion | CD36, CCL2, FN1, ITGA1, ITGAL, LAMB3, MCAM, TNF | 8.2X10⁻³ | ||
| c | Cell adhesion | SOX9, ACHE, AMTN, CDH13, CDH2, COL20A1, LAMB1, ROPN1B, SIGLEC5, SUSD5 | 2.2X10⁻³ | |
| Cell proliferation | CD74, NDP, ACHE, ARX, CDH13, EMP1 | 3.4X10⁻² | ||
| Cell motion | ARX, CDH13, CDH2, FPR3, ROPN1B, SEMA6C, SCNN1B | 1.3X10⁻² | ||
| ERα+ERβ | d | Inflammatory response | CD14,ELF3, GPR68, PXK, AOX1, BDKRB2, CCL20, CXCL10, CFB, ITGAL, LBP, NFE2L1, NFKB1, NFKBID, NFKBIZ, SPP1, SELP, SAA2, TLR9, TICAM1 | 4.1X10⁻⁹ |
| Cell motility | CUZD1, CEACAM1, CNTN2, DNAH17, EFNB1, ESR2, HBEGF, ITGA1, ICAM1, MSN, SCARB1, SELP, SAA2, SRC | 4.3X10⁻⁵ | ||
| e | Damaged DNA binding | NEIL2, POLQ, TP63 | 5X10⁻² | |
| Retinoid binding | CYP26A1, RBP3, RBP7 | 9.8X10⁻³ | ||
| ERβ | f | Cell motility | CD44, S100P, CEACAM1, CCL2, CORO1A, FN1, ICAM1, IL6R, IL8, NTN1, PLAT, SDCBP | 1.1X10⁻³ |
| Inflammatory response | CD44, CCL2, CXCL10, FN1, IL6R, IL8, PTGER3, TLR5, TLR7 | 3.9X10⁻² |
Comparisons among the three botanical estrogens and estradiol: principal component analysis
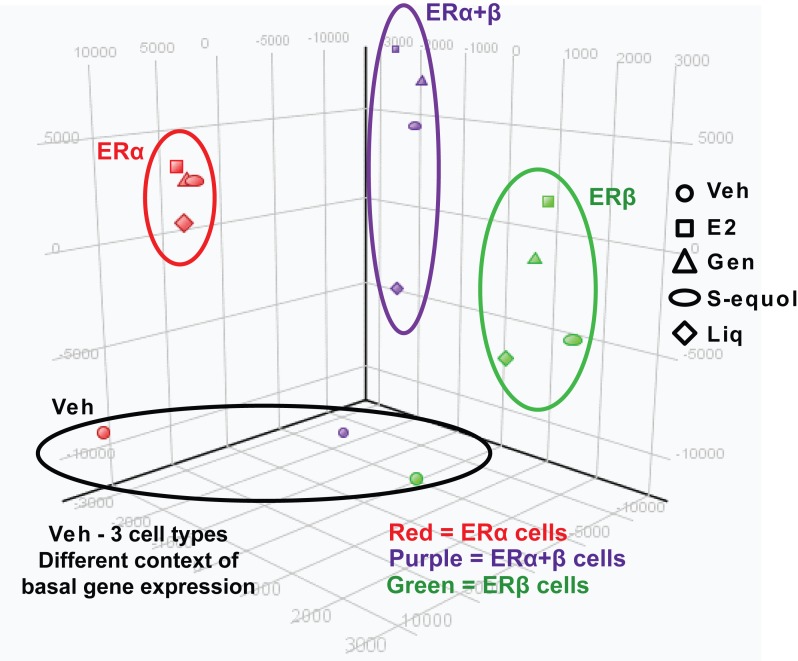
These comparisons among the four estrogens were examined further by principal component analysis (PCA, Figure 3 ), which enables one to visually assess global similarities and differences between sample groups [11,12]. Expression patterns for all compounds were different from those in vehicle control treated cells ( Figure 3 ). Further, PCA revealed differences in basal gene expression in the three cell types with different complements of the two ERs (black circle). The 3 BEs and E2 regulated relatively similar gene sets in cells containing ERα, as indicated by the small red circle. By contrast, the patterns of genes regulated by the 3 BEs differed from that of E2 to a greater extent in ERα+ERβ cells, and notably with liquiritigenin showing the most distinctly different pattern of gene regulation (purple circle). In ERβ-only cells, liquiritigenin was again the most different from E2 in gene regulation, and there were greater differences from E2 for the two other BEs than was observed in ERα cells or ERα+ERβ cells.
Figure 3. Principal component analysis (PCA) of RNA-seq Data.
RNA-seq reads of each sample were mapped to known and new genes. Differentially regulated genes were determined by comparison of the gene expression level with E2 or BE treatment vs. Veh in the same ER background. Differentially regulated genes were considered to be those with a ≥2-fold difference in expression level and an FDR of 0.01. The expression values of differentially regulated genes in Veh and treatment groups in all 3 cell types were subjected to PCA.
Gene-specific patterns of regulation dependent on compound and cell background of ERs
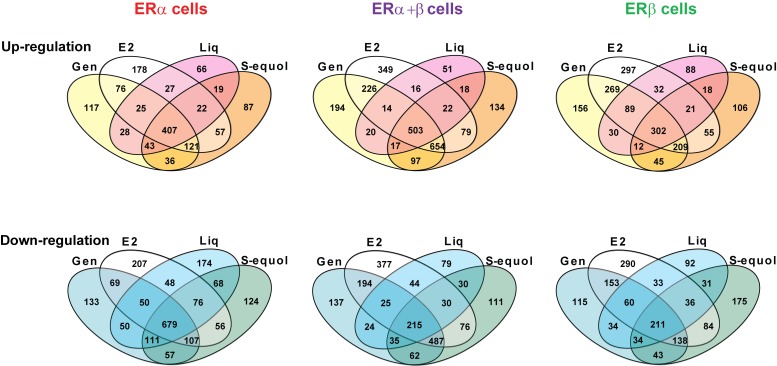
To examine in a more quantitative fashion the degree to which these differences in gene regulation are seen in up- and down-regulated genes and to what extent they can be attributed to the different compounds or to the different ER contexts of the cells, we made the comparisons shown in Figures 4 and 5 . In Figure 4 , comparisons are shown for genes regulated by E2 and the three BEs in each of the three cell types. As seen in these Venn diagrams, BEs up- or down-regulated many of the same genes as did E2, but each ligand showed some differences from E2 and also from each other, with each having some uniquely up- and down-regulated genes. Overall, the overlap in gene regulation with E2 was greatest for genistein and S-equol, with the expression pattern for liquiritigenin being the most different.
Figure 4. Comparison of the genes regulated by the three BEs and by E2 in the three ER cell backgrounds (ERα only, ERα + ERβ and ERβ only).
Cells were treated with genistein, S-equol or liquiritigenin (1 µM) or E2 (10 nM) for 24 h prior to harvest of RNA and further processing. Venn diagrams show overlap of BEs and E2 for up- and down-regulated genes in the three cell backgrounds.
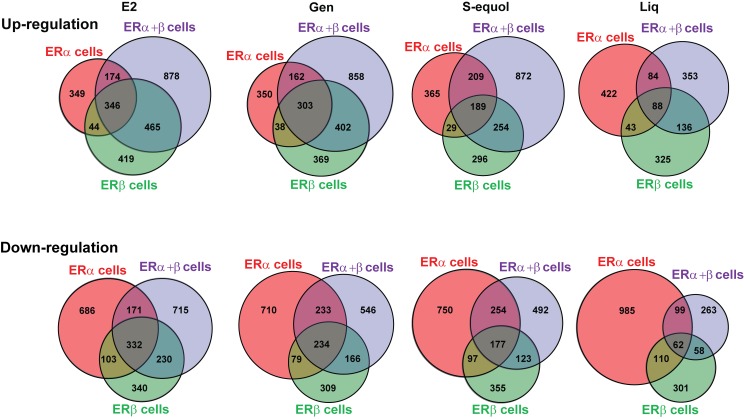
Figure 5. Comparison of the genes regulated by the E2 or by each individual BE in the three ER cell backgrounds (ERα only, ERα + ERβ and ERβ only).
Cells were treated with genistein, S-equol or liquiritigenin (1 µM) or E2 (10 nM) for 24 h prior to harvest of RNA and further processing. Venn diagrams show for each of the four compounds overlap of up- and down-regulated genes in each of the three cell backgrounds.
In Figure 5 , we compared genes regulated by each of the four ligands in the three cell types. Here, it is clear that the ER context of the cell has a major effect on the patterns of gene up- and down-regulation for each compound. In these comparisons, we again observed that genistein and E2 were the most similar in terms of cell-context dependence, whereas S-equol and to a greater extent, liquiritigenin, showed greater differences. These comparisons of compound and cell-context dependence of gene regulation are consistent with the PCA analysis shown in Figure 3 .
Functional analyses of regulated genes and signaling pathways by BEs and E2 ( Figure 2 and Table 1 ) indicated pathways controlling proliferation, antioxidant activities, anti-inflammatory activities and cell motility. Notably, BEs were less stimulatory of genes promoting proliferation, motility, and inflammation vs. E2 and were more pro-apoptotic in their gene regulations.
BEs and E2 regulate distinct functional gene interactions in the different ERα and/or ERβ cell backgrounds
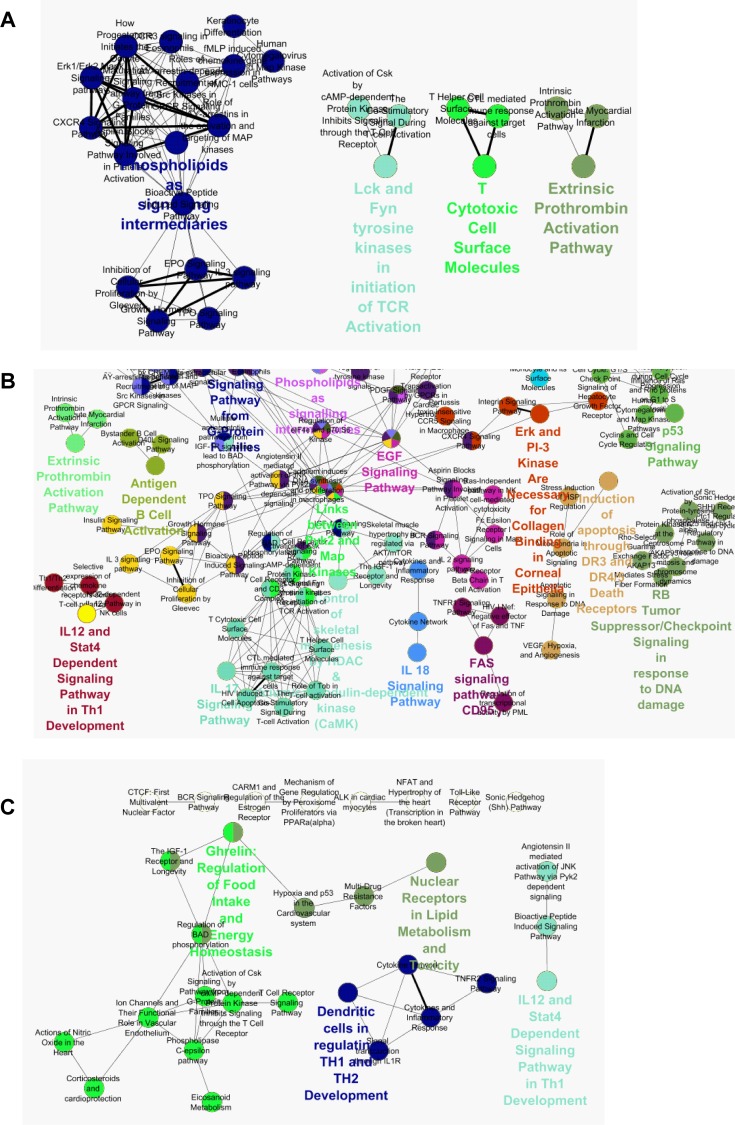
Based on our findings from this initial clustering analysis ( Figure 2 and Table 1 ), we further performed GO term analysis using lists of genes that were differentially regulated by BEs in the different cell ER backgrounds. We then used CLUEGO plugin of Cytoscape [17] with REACTOME information from Biocarta. In this way, we identified genes that were differentially regulated by BEs in the different cell backgrounds that interact with each other, which is more meaningful in terms of regulation of functionally regulated gene groups ( Figure 6 ). The data presented in this figure are annotated networks of interacting proteins identified in a given regulated gene dataset. Figure 6 shows networks of interacting proteins belonging to the same or related GO term categories that are preferentially regulated by botanical estrogens but not by E2. Nodes represent the functionally grouped networks, and they are linked based on their kappa score level (≥0.3) showing commonality of genes in connected groups. In a group, the label of the most significant term is color-coded and printed with a larger font. Functionally related groups partially overlap based on similarity of gene lists in each group
Figure 6. Pathway analysis of genes preferentially regulated by BEs vs. E2 in ERα and/or ERβ Cells.
(A) Clustering of gene ontologies that were preferentially regulated by BEs vs. E2 in ERα cells. ClueGO plugin in Cytoscape was used to identify preferentially regulated REACTOME terms from Biocarta. (B) Clustering of gene ontologies that were preferentially regulated by BEs vs. E2 in ERα plus ERβ cells. (C) Clustering of gene ontologies that were preferentially regulated by BEs vs. E2 in ERβ cells.
While some interacting gene groupings were evident in ERα-containing cells ( Figure 6A ), more interactome groups were regulated by BEs in ERα+ERβ cells and in ERβ-containing cells ( Figure 6B and C ). In ERα+ERβ cells, prominent interactome groups included those associated with activation of apoptosis, cell adhesion, and inflammatory signaling ( Figure 6B ). Interestingly, metabolism-related gene groups were notable in ERβ-containing cells which included nuclear receptors in lipid metabolism and toxicity and mechanism of gene regulation by PPARs, which suggest that BEs regulate cellular metabolism in this cell background ( Figure 6C ), as observed for E2 previously [14].
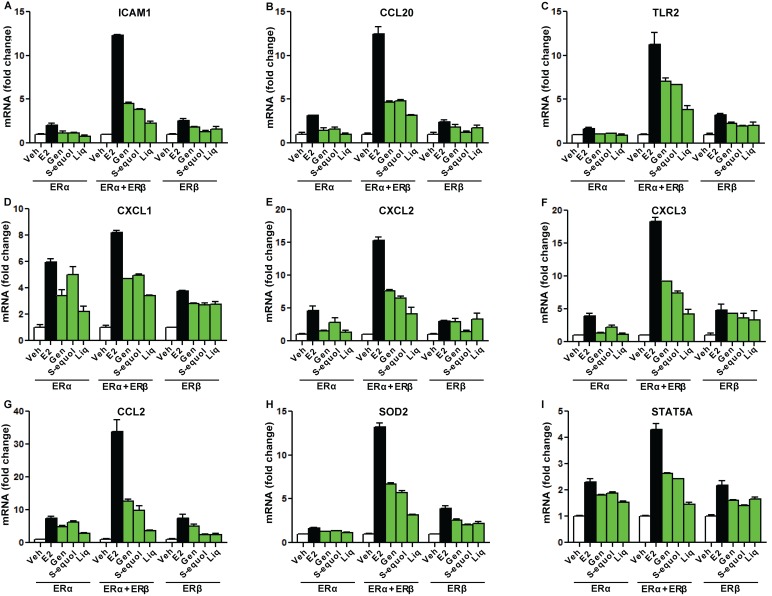
Some representative patterns of gene regulation observed with BEs and E2 are shown in Figures 7 , 8 , and 9 . Figure 7 shows genes that were up-regulated more by BEs and E2 in cells with both ERα+ERβ than in cells with only one of the ERs. Of interest, many of these genes have functions associated with inflammation and apoptosis and, in all cases, the magnitude of regulation by E2 was considerably greater than that elicited by BEs. These included genes encoding several cytokines and chemokines, as well as toll-like receptor-2 (TLR2), superoxide dismutase 2 (SOD2), and STAT5A. Among the BEs, genistein and S-equol often achieved a higher magnitude of stimulation than was observed with the same concentration (1 µM) of liquiritigenin.
Figure 7. Examples of genes whose expression was preferentially stimulated by E2 or BEs in cells containing ERα+ERβ compared with cells containing ERα only or ERβ only.
Cells were treated with control vehicle (0.1% ethanol), 10 nM E2, or 1 µM genistein, S-equol, or liquiritigenin for 24 h prior to harvest and real-time PCR analysis. mRNA fold change is shown for specific genes in the three cell types. Real-time PCR data shown are mean ± SD for triplicate analyses.
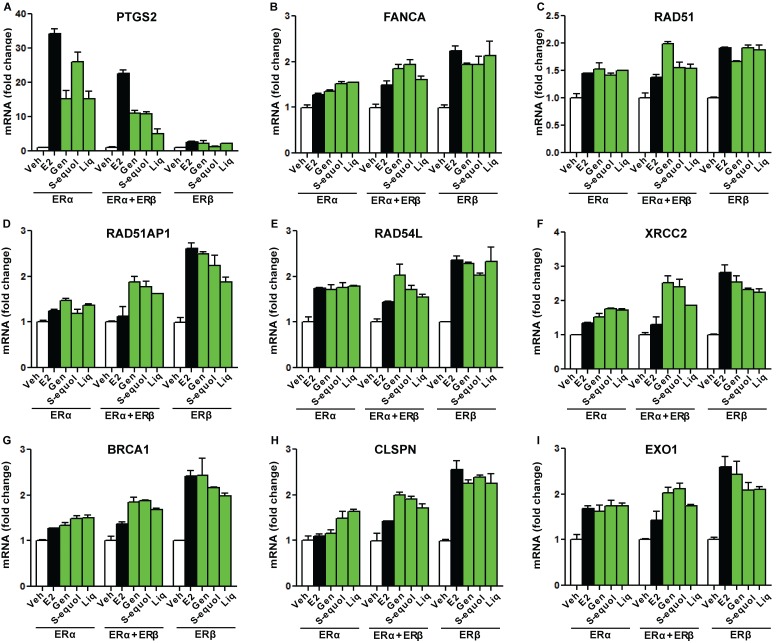
Figure 8. Examples of genes whose expression was preferentially stimulated by E2 or by BEs in cells containing only one ER (ERα or ERβ).
Cells were treated with control vehicle (0.1% ethanol), 10 nM E2, or 1 µM genistein, S-equol, or liquiritigenin for 24 h prior to harvest and real-time PCR analysis. mRNA fold change is shown for the specific genes in the three cell types. (Panel A) Example of a gene stimulated more by all compounds in ERα only cells. (Panels B-I) Examples of genes stimulated more by E2 or BEs in ERβ only cells. Values are from real-time PCR determinations and are mean ± SD for triplicate analyses.
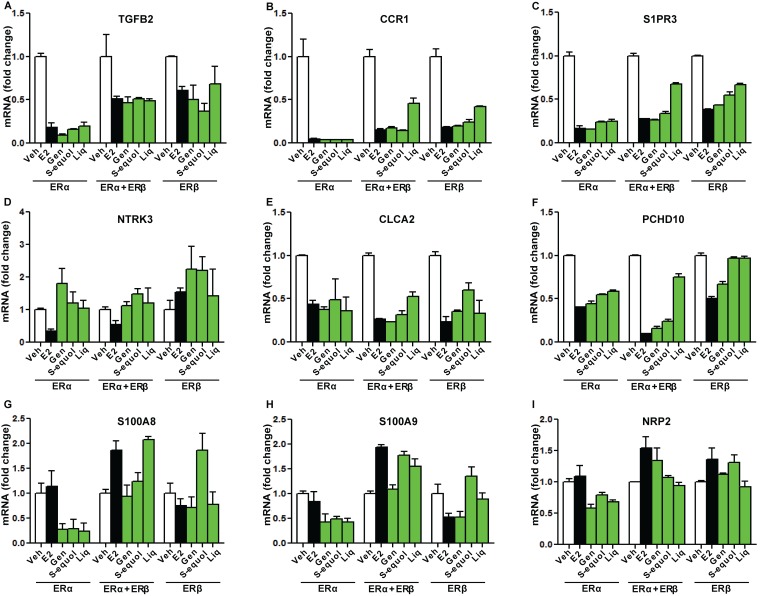
Figure 9.
Examples of genes down-regulated by E2 or BEs compared in cells containing the three complements of ER
Cells were treated with control vehicle (0.1% ethanol), 10 nM E2, or 1 µM genistein, S-equol, or liquiritigenin for 24 h prior to harvest and real-time PCR analysis. mRNA fold change is shown for the specific genes in the three cell types. A-C, immune response genes, D-F, tumor suppressor genes, G-I, genes associated with invasion. Values are mean ± SD for triplicate analyses.
Figure 8A shows an example of a gene, prostaglandin synthetase 2 (PTGS2), more highly stimulated by BEs and E2 in ERα cells than in ERα+ERβ cells, with no stimulation seen in cells with ERβ only. Figure 8 (Panels B-I) shows genes where expression was stimulated by BEs and E2 to an approximately similar extent in ERα-only and ERβ-only cells, and generally more by BEs than by E2 in ERα+ERβ cells. Of interest, the genes in Figure 8B-I are known to be associated with DNA-damage repair, and include several RAD genes, XRCC2, BRCA1, and EXO1.
The expression of some genes was also suppressed by treatment with E2 or BEs ( Figure 9 ). These down-regulated genes included tumor suppressor and immune response genes, and genes associated with invasion. They showed different patterns of dependence on compound and on cell context. For example BEs and E2 were similar in suppressing expression of three immune-response genes (TGFB2, CCR1, S1PR3), but suppression was greatest in ERα-only cells ( Figure 9A-C ). Tumor suppressor genes were in some cases suppressed by E2 when ERα was present, but not by BEs (NTRK3); were suppressed by E2 and BEs in all three cell contexts (CLCA2); or were suppressed by E2 in all three contexts, but differentially by different BEs when ERβ was present (PCDH10) ( Figure 9D-F ). All BEs but not E2 suppressed three genes (S100A8, S100A9, NRP2) associated with invasion in ERα cells, but E2 and BEs did not suppress these genes when ERβ was present ( Figure 9G-I ).
Discussion
These studies reveal that BEs show some similar as well as distinctly different patterns of gene regulation from each other and from that of the endogenous estrogen, E2, and they provide novel datasets and analyses comparing the genome-wide patterns of gene expression for three BEs and E2 in MCF-7 cells containing three different complements of the ERs. They expand upon earlier reports on the effects of E2 on gene expression in MCF-7 cells [13,18–20], and the impact of the two ERs on gene expression programs regulated by E2 [14]. The RNA-seq datasets we have now obtained also provide more complete information than have been obtained previously, even for E2, by Affymetrix microarray analyses.
We observed that among the BEs, the expression patterns of the soy BEs, genistein and S-equol, clustered together quite closely and were distinctly different from that of liquiritigenin. Liquiritigenin profiled as the most different in gene regulation from E2, as was evident both by PCA and by direct comparisons of up- and down-regulated genes. The complement of ERs present in cells also had a major effect on the pattern of genes regulated by each compound.
Although the BEs and E2 regulated genes and signaling pathways controlling proliferation, and antioxidant and anti-inflammatory activities, the BEs were notably less stimulatory of genes promoting proliferation and motility than was E2 and were more pro-apoptotic in their gene regulations. Our findings would be supportive of observations that BEs are generally ERβ preferential in their ER binding and actions, and that ERβ exerts a suppressive effect on proliferation mediated through ERα, the proproliferative receptor, when both ERs are co-present in cells [15,18,21]. Hence, the distinctive patterns of gene regulation by the individual BEs and E2 may underlie differences in the activities of these soy and licorice-derived BEs in estrogen target cells containing different levels of the two ERs.
There is much evidence for differences in the expression of ERα and ERβ in different tissues and cells, with ERβ high in ovary, lung, and some breast cancers, and ERα being the predominant ER in liver and uterus [8,9]. In human breast cancers, ERα is usually the more abundant ER, although over 70% of breast cancers express both ERα and ERβ. Of interest, as tumors progress, levels of the tumor-suppressive ERβ decline, so that ERα becomes even more dominant [22–24]. Consistent with differences in the biologies of ERα and ERβ, we have reported that the ERs show different genome-wide patterns of chromatin binding sites with E2 [14,25] and that liquiritigenin induced preferential binding of ERβ at gene regulatory sites [1]. Studies by others have also shown differences in gene regulation by liquiritigenin and E2 in U2OS bone-derived osteosarcoma cells [26,27].
Clustering of gene expression patterns for the 4 estrogens studied and Cytoscape analysis [17] of patterns of gene pathway connectedness revealed the soy-derived BEs to be more similar to each other and to E2 compared to liquiritigenin. Thus, the distinctive patterns of gene regulation by the individual BEs and E2 may contribute to the differences observed in the activities of these soy and licorice-derived BEs in estrogen target tissues that contain different levels of ERα and ERβ [27–30].
Conclusions
Elucidation of the gene regulatory networks that underlie and control the actions of BEs in estrogen-target cells containing ERα and ERβ, either separately or together, provide a framework for understanding likely clinical outcomes of BE consumption in the diet and as dietary supplements. These genomic analyses also enable a comparison of similarities and differences in gene regulation among different BEs and the endogenous hormone, E2.
Methods
Botanical estrogens, cell culture, and construction of MCF-7 breast cancer cells containing ERα, ERα and ERβ, or ERβ only
MCF-7 cells (ATCC) were cultured in DMEM (Gibco/Life Technologies, Grand Island, NY), supplemented with 5% calf serum (HyClone, Logan, UT), and 100 µg/ml penicillin/streptomycin (Invitrogen, Carlsbad, CA). For experiments, the cells were seeded in phenol red-free DMEM (Gibco/Life Technologies) plus 5% charcoal-dextran-treated calf serum for 3 days before siRNA transfection and adenovirus infection. Recombinant adenoviruses were constructed and prepared as described (4). Cells were infected with either control adenovirus expressing β-galactosidase (Ad) or adenovirus expressing ERβ (AdERβ) for 72 h. Conditions used were those described previously [15,18,31] to generate MCF-7 cells expressing levels of ERβ equal to that of the endogenously expressed ERα. For knockdown of the endogenous ERα in MCF-7 cells, cells were treated with siRNA as previously described and resulted in knockdown of ERα mRNA and protein by greater than 95% [15]. siERα sequences (Dharmacon, Lafayette, CO) were forward,5’-UCAUCGCAUUCCUUGCAAAdTdT-3’, and reverse, 5’-UUUGCAAGGAAUGCGAUGAdTdT-3’ [15]. Estradiol and genistein were from Sigma (St Louis, MO), and liquiritigenin from Tocris Bioscience (Bristol, UK). S-equol was prepared as described [32,33]. All BEs were checked for identity and purity by mass spectrometry and NMR. Cells were then treated with compounds as indicated in the text and figure legends.
RNA Extraction and Real-Time PCR Analysis of Gene Expression Regulation
After cell treatments, total RNA was isolated, reverse transcribed, and analyzed by real-time PCR exactly as described previously [34]. Primer sequences for the genes studied were obtained from Harvard Primer Bank (http://pga.mgh.harvard.edu/primerbank/).
Illumina TruSeq RNA Library Preparation and Sequencing
Total RNA was extracted from 2 separate samples for each ligand treatment using Trizol reagent and further cleaned using the RNAeasy kit from QIAGEN. RNA at a concentration of 100 ng/µL in nuclease-free water was used for library construction. Libraries were constructed following the manufacturer’s protocol with reagents supplied in Illumina’s TruSeq RNA sample preparation kit v2. Briefly, the poly-A containing mRNA was purified from total RNA, RNA was fragmented, double-stranded cDNA was generated from fragmented RNA, and adapters were ligated to the ends.
The final construct of each purified library was evaluated using the BioAnalyzer 2100 automated electrophoresis system, quantified with the Qubit fluorometer using the quant-iT HS dsDNA reagent kit (Invitrogen), and diluted according to Illumina’s standard sequencing protocol for sequencing on the HiSeq 2000. The constructed libraries were loaded onto a standard 7-lane flow cell. Samples were sequenced using an Illumina HiSeq 2000 platform utilizing 100 single base reads and multiplexed so that ~20 million reads per sample could be achieved.
Analysis of RNA-Seq data and bioinformatics
The read data from the HiSeq 2000 were processed and analyzed through a series of steps. First, FASTX-Toolkit [35] was used to trim RNA-Seq reads to remove adaptors and filter out reads with low quality (quality score <20). TopHat [36] and Bowtie [37] were employed to map RNA-Seq reads to versions hg18 and hg19 of the Homo sapiens reference genomes in the UCSC genome browser [38], in conjunction with the RefSeq genome reference annotation [39]. The threshold of the maximum number of mismatches was set to 2. MULTICOM-MAP [40–42] was used to remove reads mapped to multiple locations on a reference genome from the mapped data in the BAM/SAM format [43]. Only reads that mapped to a unique location on the genome were retained to calculate the read counts of the genes. Gene expression values (raw read counts) were calculated using our in-house tool MULTICOM-MAP [40–42] and a public tool HTseq [44] according to the genome mapping output and the RefSeq genome reference annotation [39]. Differentially expressed genes were then determined. The control samples were compared to each of the treatment samples. Based on read counts calculated by MULTICOM-MAP, differentially expressed genes were identified by the R Bioconductor package DESeq [45]. The p-value cut-off was set at 0.05. MULTICOM-PDCN [46,47] was then used to predict the functions of differentially expressed genes in terms of Gene Ontology (GO) [14]. MULTICOM-PDCN also provided a statistical summary of predicted functions, such as the number of differentially expressed genes annotated in each GO function term. MULTICOM-GNET [48,49] was used to construct gene regulatory networks based on differentially expressed genes, their expression data, and known transcription factors in the human genome. All RNA-Seq datasets have been deposited with the NCBI and can be accessed under accession number GSE56066.
Principal component, Gene Ontology, and regulatory pathway analyses
Principal component analysis was conducted as described [11,12]. Data is visualized using GeneSpring software. Gene Ontology analysis was conducted as described [14], and assessment of the connectedness of gene profiles was performed using web-based DAVID software or CLUEGO plugin of Cytoscape software with data sets from REACTOME from Biocarta [17,20].
ACKNOWLEDGMENTS
This research was supported by NIH grant P50AT006268 (BSK, WGH, JAK) and NIH supplement grant P50 AT006288 (BSK, CMG, WGH) from the National Center for Complementary and Alternative Medicines (NCCAM), the Office of Dietary Supplements (ODS) and the National Cancer Institute (NCI). Its contents are solely the responsibility of the authors and do not necessarily represent the official views of the NCCAM, ODS, NCI, or the National Institutes of Health.
- BE
botanical estrogen
- ER
estrogen receptor
- E2
estradiol
- Gen
genistein
- Liq
liquiritigenin
Footnotes
The authors declare that they have no conflict of interest.
The authors declare no competing financial interests.
REFERENCES
- 1. Jiang Y, Gong P, Madak-Erdogan Z, Martin T, Jeyakumar M, Carlson K, et al. Mechanisms enforcing the estrogen receptor β selectivity of botanical estrogens. FASEB J. 2013;27(11):4406–18. 10.1096/fj.13-234617 [DOI] [PMC free article] [PubMed] [Google Scholar]
- 2. Allred CD, Allred KF, Ju YH, Virant SM, Helferich WG. Soy diets containing varying amounts of genistein stimulate growth of estrogen-dependent (MCF-7) tumors in a dose-dependent manner. Cancer Res. 2001. Jul 1;61(13):5045–50. [PubMed] [Google Scholar]
- 3. Hsieh CY, Santell RC, Haslam SZ, Helferich WG. Estrogenic effects of genistein on the growth of estrogen receptor-positive human breast cancer (MCF-7) cells in vitro and in vivo. Cancer Res. 1998. Sep 1;58(17):3833–8. [PubMed] [Google Scholar]
- 4. Huntley AL, Ernst E. Soy for the treatment of perimenopausal symptoms--a systematic review. Maturitas. 2004;47(1):1–9. 10.1016/S0378-5122(03)00221-4 [DOI] [PubMed] [Google Scholar]
- 5. Siow RC, Li FY, Rowlands DJ, de Winter P, Mann GE. Cardiovascular targets for estrogens and phytoestrogens: transcriptional regulation of nitric oxide synthase and antioxidant defense genes. Free Radic Biol Med. 2007;42(7):909–25. 10.1016/j.freeradbiomed.2007.01.004 [DOI] [PubMed] [Google Scholar]
- 6. Taku K, Melby MK, Kronenberg F, Kurzer MS, Messina M. Extracted or synthesized soybean isoflavones reduce menopausal hot flash frequency and severity: systematic review and meta-analysis of randomized controlled trials. Menopause. 2012;19(7):776–90. 10.1097/gme.0b013e3182410159 [DOI] [PubMed] [Google Scholar]
- 7. Vivar OI, Zhao X, Saunier EF, Griffin C, Mayba OS, Tagliaferri M, et al. Estrogen receptor beta binds to and regulates three distinct classes of target genes. J Biol Chem. 2010;285(29):22059–66. 10.1074/jbc.M110.114116 [DOI] [PMC free article] [PubMed] [Google Scholar]
- 8. Kuiper GG, Carlsson B, Grandien K, Enmark E, Häggblad J, Nilsson S, et al. Comparison of the ligand binding specificity and transcript tissue distribution of estrogen receptors alpha and beta. Endocrinology. 1997. Mar;138(3):863–70. [DOI] [PubMed] [Google Scholar]
- 9. Couse JF, Lindzey J, Grandien K, Gustafsson JA, Korach KS. Tissue distribution and quantitative analysis of estrogen receptor-alpha (ERalpha) and estrogen receptor-beta (ERbeta) messenger ribonucleic acid in the wild-type and ERalpha-knockout mouse. Endocrinology. 1997. Nov;138(11):4613–21. [DOI] [PubMed] [Google Scholar]
- 10. Pepke S, Wold B, Mortazavi A. Computation for ChIP-seq and RNA-seq studies. Nat Methods. 2009;6(11) Suppl:S22–32. 10.1038/nmeth.1371 [DOI] [PMC free article] [PubMed] [Google Scholar]
- 11. Ringnér M. What is principal component analysis? Nat Biotechnol. 2008;26(3):303–4. 10.1038/nbt0308-303 [DOI] [PubMed] [Google Scholar]
- 12. Abdi H, Williams LJ. Principal component analysis. Wiley Interdiscip Rev Comput Stat. 2010;2(4):433–59. 10.1002/wics.101 [DOI] [Google Scholar]
- 13. Ochsner SA, Steffen DL, Hilsenbeck SG, Chen ES, Watkins C, McKenna NJ. GEMS (Gene Expression MetaSignatures), a Web resource for querying meta-analysis of expression microarray datasets: 17beta-estradiol in MCF-7 cells. Cancer Res. 2009;69(1):23–6. 10.1158/0008-5472.CAN-08-3492 [DOI] [PMC free article] [PubMed] [Google Scholar]
- 14. Madak-Erdogan Z, Charn TH, Jiang Y, Liu ET, Katzenellenbogen JA, Katzenellenbogen BS. Integrative genomics of gene and metabolic regulation by estrogen receptors α and β, and their coregulators. Mol Syst Biol. 2013;9(1):676. 10.1038/msb.2013.28 [DOI] [PMC free article] [PubMed] [Google Scholar]
- 15. Chang EC, Charn TH, Park SH, Helferich WG, Komm B, Katzenellenbogen JA, et al. Estrogen Receptors alpha and beta as determinants of gene expression: influence of ligand, dose, and chromatin binding. Mol Endocrinol. 2008;22(5):1032–43. 10.1210/me.2007-0356 [DOI] [PMC free article] [PubMed] [Google Scholar]
- 16. Wang Z, Gerstein M, Snyder M. RNA-Seq: a revolutionary tool for transcriptomics. Nat Rev Genet. 2009;10(1):57–63. 10.1038/nrg2484 [DOI] [PMC free article] [PubMed] [Google Scholar]
- 17. Bindea G, Mlecnik B, Hackl H, Charoentong P, Tosolini M, Kirilovsky A, et al. ClueGO: a Cytoscape plug-in to decipher functionally grouped gene ontology and pathway annotation networks. Bioinformatics. 2009;25(8):1091–3. 10.1093/bioinformatics/btp101 [DOI] [PMC free article] [PubMed] [Google Scholar]
- 18. Chang EC, Frasor J, Komm B, Katzenellenbogen BS. Impact of estrogen receptor beta on gene networks regulated by estrogen receptor alpha in breast cancer cells. Endocrinology. 2006;147(10):4831–42. 10.1210/en.2006-0563 [DOI] [PubMed] [Google Scholar]
- 19. Frasor J, Danes JM, Komm B, Chang KC, Lyttle CR, Katzenellenbogen BS. Profiling of estrogen up- and down-regulated gene expression in human breast cancer cells: insights into gene networks and pathways underlying estrogenic control of proliferation and cell phenotype. Endocrinology. 2003;144(10):4562–74. 10.1210/en.2003-0567 [DOI] [PubMed] [Google Scholar]
- 20. Madak-Erdogan Z, Lupien M, Stossi F, Brown M, Katzenellenbogen BS. Genomic collaboration of estrogen receptor alpha and extracellular signal-regulated kinase 2 in regulating gene and proliferation programs. Mol Cell Biol. 2011;31(1):226–36. 10.1128/MCB.00821-10 [DOI] [PMC free article] [PubMed] [Google Scholar]
- 21. Ström A, Hartman J, Foster JS, Kietz S, Wimalasena J, Gustafsson JA. Estrogen receptor beta inhibits 17beta-estradiol-stimulated proliferation of the breast cancer cell line T47D. Proc Natl Acad Sci USA. 2004;101(6):1566–71. 10.1073/pnas.0308319100 [DOI] [PMC free article] [PubMed] [Google Scholar]
- 22. Palmieri C, Cheng GJ, Saji S, Zelada-Hedman M, Wärri A, Weihua Z, et al. Estrogen receptor beta in breast cancer. Endocr Relat Cancer. 2002;9(1):1–13. 10.1677/erc.0.0090001 [DOI] [PubMed] [Google Scholar]
- 23. Saji S, Hirose M, Toi M. Clinical significance of estrogen receptor beta in breast cancer. Cancer Chemother Pharmacol. 2005;56(S1) Suppl 1:21–6. 10.1007/s00280-005-0107-3 [DOI] [PubMed] [Google Scholar]
- 24. Gruvberger-Saal SK, Bendahl PO, Saal LH, Laakso M, Hegardt C, Edén P, et al. Estrogen receptor beta expression is associated with tamoxifen response in ERalpha-negative breast carcinoma. Clin Cancer Res. 2007;13(7):1987–94. 10.1158/1078-0432.CCR-06-1823 [DOI] [PubMed] [Google Scholar]
- 25. Charn TH, Liu ET, Chang EC, Lee YK, Katzenellenbogen JA, Katzenellenbogen BS. Genome-wide dynamics of chromatin binding of estrogen receptors alpha and beta: mutual restriction and competitive site selection. Mol Endocrinol. 2010;24(1):47–59. 10.1210/me.2009-0252 [DOI] [PMC free article] [PubMed] [Google Scholar]
- 26. Paruthiyil S, Cvoro A, Zhao X, Wu Z, Sui Y, Staub RE, et al. Drug and cell type-specific regulation of genes with different classes of estrogen receptor beta-selective agonists. PLoS ONE. 2009;4(7):e6271. 10.1371/journal.pone.0006271 [DOI] [PMC free article] [PubMed] [Google Scholar]
- 27. Mersereau JE, Levy N, Staub RE, Baggett S, Zogovic T, Chow S, et al. Liquiritigenin is a plant-derived highly selective estrogen receptor beta agonist. Mol Cell Endocrinol. 2008;283(1-2):49–57. 10.1016/j.mce.2007.11.020 [DOI] [PMC free article] [PubMed] [Google Scholar]
- 28. Naaz A, Yellayi S, Zakroczymski MA, Bunick D, Doerge DR, Lubahn DB, et al. The soy isoflavone genistein decreases adipose deposition in mice. Endocrinology. 2003;144(8):3315–20. 10.1210/en.2003-0076 [DOI] [PubMed] [Google Scholar]
- 29. Selvaraj V, Zakroczymski MA, Naaz A, Mukai M, Ju YH, Doerge DR, et al. Estrogenicity of the isoflavone metabolite equol on reproductive and non-reproductive organs in mice. Biol Reprod. 2004;71(3):966–72. 10.1095/biolreprod.104.029512 [DOI] [PubMed] [Google Scholar]
- 30. Yellayi S, Naaz A, Szewczykowski MA, Sato T, Woods JA, Chang J, et al. The phytoestrogen genistein induces thymic and immune changes: a human health concern? Proc Natl Acad Sci USA. 2002;99(11):7616–21. 10.1073/pnas.102650199 [DOI] [PMC free article] [PubMed] [Google Scholar]
- 31. Paruthiyil S, Parmar H, Kerekatte V, Cunha GR, Firestone GL, Leitman DC. Estrogen receptor beta inhibits human breast cancer cell proliferation and tumor formation by causing a G2 cell cycle arrest. Cancer Res. 2004;64(1):423–8. 10.1158/0008-5472.CAN-03-2446 [DOI] [PubMed] [Google Scholar]
- 32. Muthyala RS, Ju YH, Sheng S, Williams LD, Doerge DR, Katzenellenbogen BS, et al. Equol, a natural estrogenic metabolite from soy isoflavones: convenient preparation and resolution of R- and S-equols and their differing binding and biological activity through estrogen receptors alpha and beta. Bioorg Med Chem. 2004;12(6):1559–67. 10.1016/j.bmc.2003.11.035 [DOI] [PubMed] [Google Scholar]
- 33. Heemstra JM, Kerrigan SA, Doerge DR, Helferich WG, Boulanger WA. Total synthesis of (S)-equol. Org Lett. 2006;8(24):5441–3. 10.1021/ol0620444 [DOI] [PubMed] [Google Scholar]
- 34. Madak-Erdogan Z, Kieser KJ, Kim SH, Komm B, Katzenellenbogen JA, Katzenellenbogen BS. Nuclear and extranuclear pathway inputs in the regulation of global gene expression by estrogen receptors. Mol Endocrinol. 2008;22(9):2116–27. 10.1210/me.2008-0059 [DOI] [PMC free article] [PubMed] [Google Scholar]
- 35. Cook B, Hunter RHF, Kelly ASL. Steroid-binding proteins in follicular fluid and peripheral plasma from pigs, cows and sheep. J Reprod Fertil. 1977;51(1):65–71. 10.1530/jrf.0.0510065 [DOI] [PubMed] [Google Scholar]
- 36. Trapnell C, Pachter L, Salzberg SL. TopHat: discovering splice junctions with RNA-Seq. Bioinformatics. 2009;25(9):1105–11. 10.1093/bioinformatics/btp120 [DOI] [PMC free article] [PubMed] [Google Scholar]
- 37. Langmead B, Trapnell C, Pop M, Salzberg SL. Ultrafast and memory-efficient alignment of short DNA sequences to the human genome. Genome Biol. 2009;10(3):R25. 10.1186/gb-2009-10-3-r25 [DOI] [PMC free article] [PubMed] [Google Scholar]
- 38. Karolchik D, Baertsch R, Diekhans M, Furey TS, Hinrichs A, Lu YT, et al. University of California Santa Cruz The UCSC Genome Browser Database. Nucleic Acids Res. 2003;31(1):51–4. 10.1093/nar/gkg129 [DOI] [PMC free article] [PubMed] [Google Scholar]
- 39. Pruitt KD, Tatusova T, Maglott DR. NCBI reference sequences (RefSeq): a curated non-redundant sequence database of genomes, transcripts and proteins. Nucleic Acids Res. 2007;35(Database issue):D61–5. 10.1093/nar/gkl842 [DOI] [PMC free article] [PubMed] [Google Scholar]
- 40. Sun L, Fernandez HR, Donohue RC, Li J, Cheng J, Birchler JA. Male-specific lethal complex in Drosophila counteracts histone acetylation and does not mediate dosage compensation. Proc Natl Acad Sci USA. 2013;110(9):E808–17. 10.1073/pnas.1222542110 [DOI] [PMC free article] [PubMed] [Google Scholar]
- 41. Sun L, Johnson AF, Donohue RC, Li J, Cheng J, Birchler JA. Dosage compensation and inverse effects in triple X metafemales of Drosophila. Proc Natl Acad Sci USA. 2013;110(18):7383–8. 10.1073/pnas.1305638110 [DOI] [PMC free article] [PubMed] [Google Scholar]
- 42. Sun L, Johnson AF, Li J, Lambdin AS, Cheng J, Birchler JA. Differential effect of aneuploidy on the X chromosome and genes with sex-biased expression in Drosophila. Proc Natl Acad Sci USA. 2013;110(41):16514–9. 10.1073/pnas.1316041110 [DOI] [PMC free article] [PubMed] [Google Scholar]
- 43. Li H, Handsaker B, Wysoker A, Fennell T, Ruan J, Homer N, et al. 1000 Genome Project Data Processing Subgroup The sequence alignment/map format and SAMtools. Bioinformatics. 2009;25(16):2078–9. 10.1093/bioinformatics/btp352 [DOI] [PMC free article] [PubMed] [Google Scholar]
- 44.Anders S, Pyl PT, Huber W: HTSeq - A Python framework to work with high-throughput sequencing data. bioRxiv 2014. [DOI] [PMC free article] [PubMed]
- 45. Anders S, Huber W. Differential expression analysis for sequence count data. Genome Biol. 2010;11(10):R106. 10.1186/gb-2010-11-10-r106 [DOI] [PMC free article] [PubMed] [Google Scholar]
- 46. Wang Z, Cao R, Cheng J. Three-level prediction of protein function by combining profile-sequence search, profile-profile search, and domain co-occurrence networks. BMC Bioinformatics. 2013;14 Suppl 3:S3. [DOI] [PMC free article] [PubMed] [Google Scholar]
- 47. Wang Z, Zhang X-C, Le MH, Xu D, Stacey G, Cheng J. A protein domain co-occurrence network approach for predicting protein function and inferring species phylogeny. PLoS ONE. 2011;6(3):e17906. 10.1371/journal.pone.0017906 [DOI] [PMC free article] [PubMed] [Google Scholar]
- 48. Zhu M, Deng X, Joshi T, Xu D, Stacey G, Cheng J. Reconstructing differentially co-expressed gene modules and regulatory networks of soybean cells. BMC Genomics. 2012;13(1):437. 10.1186/1471-2164-13-437 [DOI] [PMC free article] [PubMed] [Google Scholar]
- 49. Zhu M, Dahmen JL, Stacey G, Cheng J. Predicting gene regulatory networks of soybean nodulation from RNA-Seq transcriptome data. BMC Bioinformatics. 2013;14(1):278. 10.1186/1471-2105-14-278 [DOI] [PMC free article] [PubMed] [Google Scholar]


