

Abstract
The SNARE protein vti1a is proposed to drive fusion of intracellular organelles, but recent data also implicated vti1a in exocytosis. Here we show that vti1a is absent from mature secretory vesicles in adrenal chromaffin cells, but localizes to a compartment near the trans-Golgi network, partially overlapping with syntaxin-6. Exocytosis is impaired in vti1a null cells, partly due to fewer Ca2+-channels at the plasma membrane, partly due to fewer vesicles of reduced size and synaptobrevin-2 content. In contrast, release kinetics and Ca2+-sensitivity remain unchanged, indicating that the final fusion reaction leading to transmitter release is unperturbed. Additional deletion of the closest related SNARE, vti1b, does not exacerbate the vti1a phenotype, and vti1b null cells show no secretion defects, indicating that vti1b does not participate in exocytosis. Long-term re-expression of vti1a (days) was necessary for restoration of secretory capacity, whereas strong short-term expression (hours) was ineffective, consistent with vti1a involvement in an upstream step related to vesicle generation, rather than in fusion. We conclude that vti1a functions in vesicle generation and Ca2+-channel trafficking, but is dispensable for transmitter release.
Keywords: adrenal chromaffin cells, Ca2+-channels, exocytosis, SNARE, vesicle biogenesis
Introduction
Communication between intracellular compartments in eukaryotic cells, but also communication between cells, relies mostly on the fusion of cargo-containing vesicles with target membranes driven by evolutionarily conserved SNARE proteins (Jahn & Scheller, 2006; Sudhof & Rothman, 2009). SNARE complexes consist of four α-helices in a coiled coil structure, with 16 layers of amino acids facing the center that add to complex stability through mostly hydrophobic interactions (Sutton et al, 1998). The exception is the central zero layer of the complex, which contains highly conserved polar side chains of either glutamine (Q) or arginine (R) residues, leading to the classification into Q- and R-SNAREs (Fasshauer et al, 1998). All known SNARE complexes are made up of three Q-SNARE motifs, one from each separate subfamily (denoted Qa, Qb, and Qc), and one R-SNARE (Sutton et al, 1998; Antonin et al, 2002; Zwilling et al, 2007). A large body of work has focused on the SNARE complex involved in neuronal exocytosis, which consists of syntaxin-1 (a Qa-SNARE), SNAP-25 (contributes both the Qb and the Qc helices), and VAMP2/synaptobrevin-2 (an R-SNARE). Genetic ablation of neuronal SNAREs leads to a loss of triggered neurotransmitter release, demonstrating the essential role of the SNAREs in exocytosis (Sorensen et al, 2003b; Borisovska et al, 2005).
Vps-ten-interacting-1a (vti1a) is classified as a Qb-SNARE, although it is unique by harboring an aspartate residue within the zero layer (Antonin et al, 2000a). This aspartate is involved in similar interactions as the glutamine in other complexes (Zwilling et al, 2007). Vti1a was suggested to play a role in (i) homotypic early-endosome fusion with syntaxin-13 (or syntaxin-16), syntaxin-6, and VAMP4 (Kreykenbohm et al, 2002; Brandhorst et al, 2006), (ii) early-endosome-to-Golgi fusion with syntaxin-16, syntaxin-6 and VAMP3 (or VAMP4) (Mallard et al, 2002), and (iii) late-endosome-to-Golgi fusion with syntaxin-16, syntaxin-10, and VAMP3 (Medigeshi & Schu, 2003; Ganley et al, 2008). Notably, syntaxin-6 has been implicated in the maturation of secretory vesicles, by stimulating homotypic fusion of immature secretory granules (ISGs) (Wendler et al, 2001), and VAMP4 was also found in ISGs (Wendler et al, 2001). Based on the fact that vti1a participates in two other pathways together with syntaxin-6 and VAMP4, the question arises whether there is a role for vti1a in vesicle biogenesis or maturation.
Vti1a is one of the two yeast orthologs of vti1p in mammals, the other is vti1b (Advani et al, 1998; Fischer von Mollard & Stevens, 1998). Loss of vti1p in yeast is lethal (Lupashin et al, 1997; von Mollard et al, 1997), but individual loss of vti1a or vti1b is tolerated in mouse, while the simultaneous deletion of both results in widespread neurodegeneration and peri-natal lethality (Atlashkin et al, 2003; Kunwar et al, 2011). Vti1b is mainly found on late endosomes (Kreykenbohm et al, 2002) and has been associated with the fusion of late endosomes together with syntaxin-7, syntaxin-8, and the R-SNARE VAMP8 (Antonin et al, 2000a), whereas vti1b interaction with VAMP7 is required for transport from late endosomes to lysosomes (Pryor et al, 2004).
Recent investigations of vti1a and VAMP4 in neurons have implicated these ‘endosomal’ SNAREs in regulated exocytosis reactions: VAMP4 is involved in asynchronous neurotransmitter release (Raingo et al, 2012), whereas vti1a was suggested to play a role in the action-potential-independent—spontaneous—fusion of synaptic vesicles (Ramirez et al, 2012). This is controversial, since vti1a-carrying vesicles also fused during prolonged stimulation trains (Hoopmann et al, 2010; Ramirez et al, 2012), and other studies have shown that spontaneous release is modulated by mutation of the neuronal SNAREs (Deak et al, 2006; Weber et al, 2010). The question remains whether endosomal SNAREs compete with neuronal ones to directly drive exocytosis, or whether their apparent involvement in exocytosis is due to a function in upstream processes.
Here, we used adrenal chromaffin cells to answer this question as it applies to large dense-core vesicles (LDCVs) in neurosecretory cells. Adrenal chromaffin cells secrete catecholamines and various peptides into the blood as part of the stress response, and isolated cells constitute a powerful assay system, where exocytosis can be monitored with sub-millisecond time resolution (Rettig & Neher, 2002). The basal fusion mechanism appears to be largely conserved between LDCVs in chromaffin cells and synaptic vesicles, but notable differences include the biogenesis pathway of vesicles. In neurosecretory cells (and in neurons), LDCVs are formed by budding from the trans-Golgi network, whereas small synaptic vesicles are formed via fast (within few minutes) recycling of endocytosed components (Burgoyne & Morgan, 2003; Sudhof, 2004).
Results
To investigate the role of vti1a and vti1b in the regulated exocytosis pathway in neurosecretory cells, we here studied adrenal chromaffin cells.
Vti1a localizes to a peri-nuclear compartment positive for syntaxin-6
In NRK epithelial cells, vti1a is found localized to the Golgi/trans-Golgi network (TGN) (Kreykenbohm et al, 2002), but in addition, vti1a is localized to a subset of synaptic vesicles in neurons (Antonin et al, 2000b; Kreykenbohm et al, 2002; Ramirez et al, 2012). The localization in neurosecretory cells is not clear, as these cells contain a different kind of secretory vesicle with an electron-dense core, hence denoted large dense-core vesicles (LDCVs). We stained cultured mouse adrenal chromaffin cells using two vti1a-specific antibodies and imaged cells using 3D-structured illumination microscopy (3D-SIM) (Schermelleh et al, 2010). This resulted in vti1a-specific staining of a peri-nuclear compartment (Fig1A, compare wild-type and vti1a null). Co-staining against syb-2 (VAMP2/synaptobrevin-2), the R-SNARE responsible for LDCV fusion (Borisovska et al, 2005) resulted in a clearly vesicular staining, with many vesicles in the periphery of the cell (Fig1A), consistent with the localization of mature vesicles in chromaffin cells (Toonen et al, 2006). Staining for syntaxin-6—which has been described from the TGN, immature vesicles, and endosomes (Bock et al, 1997; Klumperman et al, 1998; Wendler et al, 2001; Kreykenbohm et al, 2002; Mallard et al, 2002; Brandhorst et al, 2006)—showed partial colocalization with vti1a (Fig1B). The compartment positive for vti1a was distinct from the cis-Golgi, as revealed by GM130 staining (Fig1C), and might therefore be TGN. However, staining against a classical TGN-marker, TGN38, also did not reveal overlap with vti1a (Fig1D). Instead, vti1a appears to be surrounded by the TGN38-positive compartment. Consistent with the partial co-localization, syntaxin-6 was also found surrounded by TGN38 staining (Fig1E). Thus, the compartment positive for vti1a appears very similar to the syntaxin-6 positive, but TGN38 negative, subdomain of the TGN shown to be involved in the recycling of GLUT4 (Shewan et al, 2003) and vesicle formation in pancreatic β-cells (Kuliawat et al, 2004). This compartment has recently been shown to contain PICK1, which is involved in vesicle generation in growth hormone secreting cells, and it was suggested that it might constitute immature vesicles (Holst et al, 2013).
Figure 1. Vti1a is localized in a peri-nuclear compartment together with syntaxin-6.

- Structured illumination microscopy (3D-SIM) image showing a single optical section through the equatorial plane of a chromaffin cell (top: WT, bottom: vti1a null) stained for vti1a (green) and synaptobrevin-2/VAMP2 (magenta).
- A single optical section of a chromaffin cell (top: WT, bottom: vti1a null) stained for vti1a (green) and syntaxin-6 (magenta), a marker for TGN/immature vesicles/endosomes.
- A single optical section through a chromaffin cell (top: WT, bottom: vti1a null) stained for vti1a (green) and GM130 (magenta), a marker for cis-Golgi.
- A single optical section through a WT chromaffin cell stained for vti1a (green) and TGN38 (magenta), a marker for TGN.
- A single optical section through a WT chromaffin cell stained for syntaxin-6 (green) and TGN38 (magenta).
Data information: Scale bars, 2 μm.
Recent analysis of vti1a/b double knockouts revealed that more lysosomal hydrolases are secreted, probably due to defects in transport between TGN and endosomes (Kunwar et al, 2011). We found no apparent changes in the morphology of lysosomes stained with Lamp1 in the vti1a null; their number, size, and area were not different from wild-type littermate controls (Fig2Ai and Aii, Supplementary Fig S1Di–Dii).
Figure 2. Chromaffin cells of vti1a nulls show decreased levels of syntaxin-6 and synaptobrevin-2.

Ai Confocal images of wild-type (top) and vti1a null (bottom) chromaffin cells co-stained against vti1a (green) together with syb-2, syntaxin-6, GM130 or Lamp1 (magenta).
Aii Quantification of syb-2 (WT: n = 40 cells, vti1a null: n = 40 cells), syntaxin-6 (WT: n = 43, vti1a null: n = 41), and GM130 (WT: n = 29, vti1a null: n = 23) fluorescence intensities and Lamp1-positive lysosomes (WT: n = 26, vti1a null: n = 26).
Bi Western blots of wild-type (WT) and vti1a null whole adrenal homogenates probed against syntaxin-6 (syx6), synaptobrevin-2 (syb-2), SNAP47, SNAP29, SNAP23, syntaxin-16 (syx16), SNAP25 and VAMP4. HSP70 was used as a loading control.
Bii Quantification of protein levels in the vti1a null relative to WT. Note that a similar reduction in synaptobrevin-2 levels was detected by both analyses, while a reduction in syntaxin-6 was only detected in immunostainings.
Data information: Data are mean ± SEM, **P < 0.01, ***P < 0.001, #P = 0.06. In panel BII, the test was a paired t-test, two-tailed. Scale bar, 2 μm.
Since 3D-SIM is not a strictly quantitative method, we quantified staining intensities using images obtained in the confocal microscope. Interestingly, this showed that the expression of the presumed vti1a-partner syntaxin-6 was depressed in vti1a null cells (Fig2Ai and Aii). Since the syntaxin-6-positive compartment is involved in vesicle formation, its reduction might lead to fewer mature vesicles. Quantification of syb-2 staining indeed revealed that the mean cellular syb-2 level was significantly reduced in vti1a nulls (Fig2Ai and Aii). In contrast, the levels of GM-130 were unchanged by elimination of vti1a (Fig2Ai and Aii).
To understand whether elimination of vti1a causes upregulation and compensation by other SNAREs, we performed immunoblotting from whole adrenal glands from newborn vti1a null and wild-type mice. Protein levels of syntaxin-16, SNAP-23, -25, -29, -47, and VAMP4 were unchanged in the vti1a null (Fig2Bi and Bii). However, the level of syb-2 was reduced (Fig2Bii), consistent with the results from immunostaining. The level of syntaxin-6 was unchanged in this analysis, which appears inconsistent with the results from immunostaining. However, syntaxin-6 is a ubiquitous SNARE, which is also present in the adrenal cortex, and therefore a selective reduction in the chromaffin cells of the adrenal medulla might go undetected. Alternatively, the apparent reduction in immunostainings might have been caused by a partial collapse of the syntaxin-6-positive compartment in the absence of vti1a, leading to impaired immuno-availability.
To investigate whether vti1a might be present on syb-2-positive mature LDCVs as a prerequisite for driving secretion, we scrutinized 3D-SIM image planes obtained close to the footprint of the cells, where peri-nuclear staining was absent (Fig3). The background staining for vti1a in the null appears as speckles (Figs1A–C and 3B), which is an artifact of the 3D-SIM reconstruction algorithm when applied to weak homogeneous staining (compare to Supplementary Fig S1A–D outside of the Golgi area). A few vesicular structures positive for vti1a staining were found in the periphery, which were negative for syb-2 (Fig3A, line profiles), but such structures were also found occasionally in vti1a null cells (Fig3B) and thus they were not further investigated. Vti1a staining on syb-2-positive vesicles was generally not detected (Fig3A), but the speckled nature of the vti1a staining made the assessment difficult. To circumvent this problem, we averaged subimages, selected such that the vesicle was centered in the middle. Averaging subimages of 76 vesicles from the vti1a wild-type (WT) cells, we obtained an averaged vesicular spot of Gaussian shape, as expected (Fig3C). Strikingly, averaging the same sub-images in the vti1a channel resulted in a homogeneous signal, with no sign of vti1a accumulation on the vesicle (Fig3C). This shows that the ‘speckles’ do not constitute a vesicle-associated signal and is strong evidence against localization of vti1a on syb-2-positive LDCVs in chromaffin cells. Similar averaging of 63 vesicles in the vti1a null revealed homogeneous staining almost indistinguishable from WT cells (Fig3D), indicating that background staining dominates the vti1a-channel outside the TGN. Strikingly, the syb-2 signal of the averaged vesicle in vti1a null cells was significantly weaker than in WT cells (Fig3C and D, right panels), indicating that the syb-2 level on the vesicle is depressed (see also below). Co-staining against vti1a and chromogranin B, another vesicular marker, also did not reveal co-localization (Supplementary Fig S1E).
Figure 3. Mature secretory vesicles are devoid of vti1a staining.
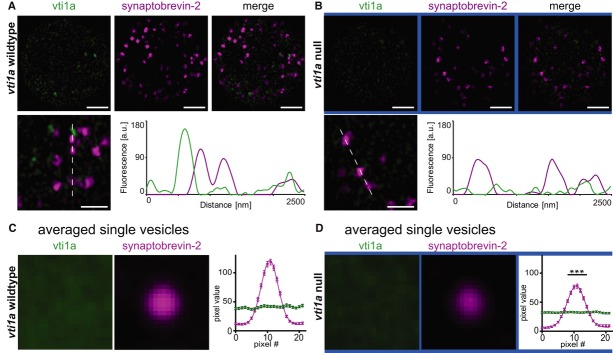
A, B 3D-SIM optical sections obtained near the footprint of a WT cell (A) and a vti1a null cell (B) stained for vti1a (green) and syb-2/VAMP2 (magenta). Syb-2-positive granules appear to be largely devoid of vti1a, as shown by the line profile (A, bottom panels). In 3D-SIM, the homogeneous background staining in the null appears as ‘speckles’ (B, bottom panel).
C To investigate whether vti1a is enriched on LDCVs, individual vesicles were aligned by their syb-2 fluorescence in subimages (22 × 22 pixel, pixel size: 40 nm) and averaged. The syb-2 staining (middle panel) was highly enriched on the vesicle, while the averaged vti1a staining (left panel) was homogenous, showing that there is no enrichment of vti1a on the vesicle. The right panel shows the pixel intensity distribution through the mid-section of the vesicle. The line is a fit of a Gaussian to the syb-2 signal.
D Single-vesicle fluorescence analysis in the vti1a null. The peak fluorescence values for syb-2 are significantly reduced compared to the WT (C). The line shows the best fit of a Gaussian.
Data information: Data are means, and error bars represent SEM. Number of cells (n) and vesicles (N) that were analyzed in (C) and (D): wild-type: n = 3, N = 76; vti1a null: n = 3, N = 63. ***P < 0.001. Scale bar, 2 μm.
Overall, immunofluorescence combined with confocal and 3D-SIM established that vti1a is present in a compartment near the TGN, where it partly co-localizes with and stabilizes syntaxin-6, a known participant in vesicle biogenesis. During biogenesis, vti1a is sorted away from the nascent vesicle, since it is absent from mature vesicles. The important role of vti1a in vesicle biogenesis is demonstrated by the fact that its absence results in fewer mature vesicles (see also below) containing less syb-2.
Exocytosis and Ca2+-channel abundance are reduced by deletion of vti1a
In order to understand how exocytosis depends on vti1a, we performed cellular capacitance measurements. During exocytosis, the addition of vesicular membrane to the plasma membrane leads to an increase in the surface area of the cell, which is proportional to the increase in cellular capacitance. We used a well-characterized stimulation protocol to elicit exocytosis: six 10 ms depolarization followed by four depolarizations of 100 ms duration (Voets et al, 1999). We found that the total amount of exocytosis triggered by this type of stimulation was reduced in vti1a null cells compared to littermate controls (Fig4Ai). The difference between the groups was augmented during a second stimulation 60 s after the first one, leading to a highly significant decrease in release from vti1a-deficient cells (Fig4Aii and C). In these experiments we simultaneously performed amperometric measurements which showed decreased transmitter release from the vti1a-deficient cells (Fig4A bottom panels). Intracellular Ca2+-concentrations were measured simultaneously using microfluorimetry and showed significantly lower Ca2+-levels in response to the depolarizations in knockout cells (Fig4A, top panels). We therefore quantified the sizes of Na+ and Ca2+-currents measured during the first depolarization and indeed found that Ca2+-currents were significantly reduced in vti1a-deficient cells (Fig4B).
Figure 4. Vti1a-deficient cells show reduced secretion and depressed surface levels of voltage-gated Ca2+-channels.
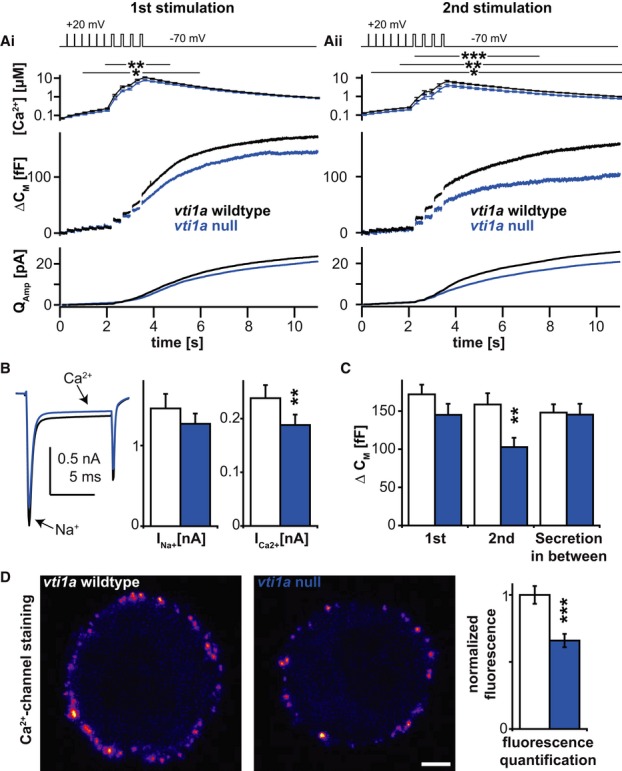
Ai, Aii Top panel: depolarization protocol used to elicit secretion. The resulting increase in intracellular Ca2+ levels (second panel) was paralleled by an increase of cellular capacitance (third panel) and cumulative amperometric charge (bottom panel), indicating exocytosis of secretory vesicles. The second stimulation (Aii) was applied 60 s after the first one.
B Average Na+ and Ca2+ currents induced by the first voltage depolarization. The bar diagram shows the quantification.
C Quantification of capacitance increase during and between the two depolarization protocols.
D Confocal mid-sections (left panels) of WT and vti1a null chromaffin cells stained live with an antibody against an extracellular stretch of the α2δ loop of voltage-gated Ca2+-channels. The bar diagram shows the quantification.
Data information: Wild-type control is shown in black (or white bars in (B) and (C) histograms), vti1a null in blue. Traces and bar diagrams show means ± SEM. Number of cells (n) in (A–C): wild-type: n = 61; vti1a null: n = 66. Number of cells (n) in (D): wild-type: n = 59; vti1a null: n = 60. Scale bar, 2 μm. *P < 0.05, **P < 0.01, ***P < 0.001.
To further investigate this point, we argued that the Ca2+-current reduction could be due to (1) a change in Ca2+-channel activation, (2) a decrease in the single-channel conductance, or (3) a reduction in Ca2+-channel number. We investigated hypothesis 1 by performing tail-current analysis and plotted the activation curve (Supplementary Fig S2A). WT cells and vti1a nulls had overlapping activation curves and indistinguishable activation thresholds (Supplementary Fig S2A), ruling out hypothesis 1. Next, we performed non-stationary fluctuation analysis on the activation of the Ca2+-currents (Fenwick et al, 1982). Fitting the variance–mean relationship with parabolas allowed us to estimate the single-channel conductance and the number of channels. We found that single-channel currents were not significantly different between vti1a nulls and WT, although a trend toward even larger currents in the knockout was found. In contrast, the number of channels was significantly lower in vti1a nulls (Supplementary Fig S2B). To verify this finding by independent means, we performed live staining (on ice to prevent endocytosis) with an antibody recognizing the extracellular part of the α2δ4 subunit of all Ca2+-channel subtypes expressed in chromaffin cells. Quantitative confocal analysis revealed a highly significant reduction in the Ca2+-channel levels (Fig4D), in line with our electrophysiological analysis. Thus, we conclude that vti1a is involved in maintaining normal Ca2+-channel numbers at the plasma membrane, consistent with a role for vti1a in Ca2+-channel trafficking.
Exocytosis is decreased by vti1a-deletion even after stimulation bypassing Ca2+-channels
In order to test whether the observed exocytosis defect in knockout cells was secondary to the reduction in Ca2+-currents, we progressed with a stimulation protocol that is independent of Ca2+-channel activation.
We used Ca2+-uncaging to trigger exocytosis, which evoked a robust multi-phasic increase of cellular capacitance in WT cells, due to the fusion of catecholamine-containing vesicles, illustrated by a concomitant oxidative current through the amperometric fiber (Fig5A). Ca2+-triggered release from vti1a-deficient chromaffin cells was significantly impaired, resulting in approximately 50% less capacitance increase (Fig5A and B). The size of the exocytotic burst (exocytosis elicited within 1 s of the calcium stimulus) reports on the number of pre-primed vesicles at the time of the stimulus, whereas the sustained component (exocytosis between 1 and 5 s after the stimulus) reports on the rate of ongoing vesicle priming at high [Ca2+]. Both components were reduced in similar proportions (Fig5B). However, the temporal behavior of the capacitance traces was very similar between the wild-type and knockout cells when the responses were normalized (Fig5C). This shows that—although the magnitude of the response is affected by the loss of vti1a—the kinetics of release is unaltered.
Figure 5. Loss of vti1a results in a decreased number of releasable (primed) vesicles.
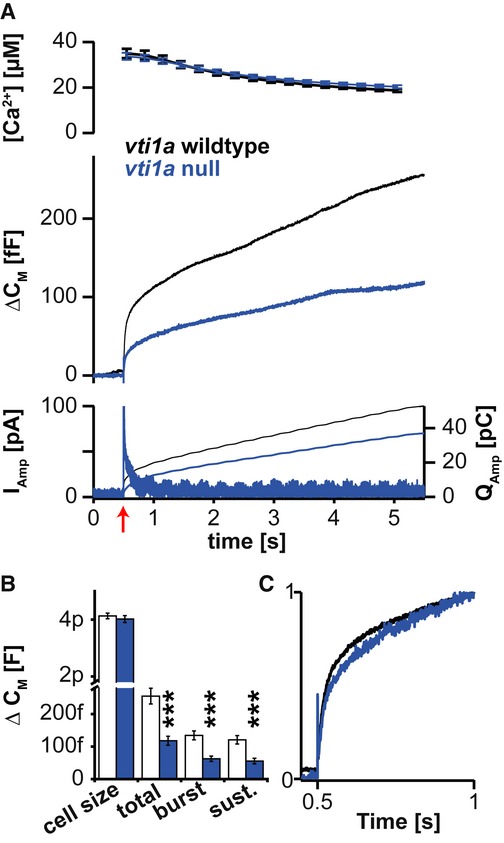
- Exocytosis induced by Ca2+-uncaging is reduced in vti1a nulls. Ca2+-uncaging at 0.5 s (at red arrow) led to a rapid increase in the global Ca2+-concentration (top) which resulted in vesicle fusion leading to an increase in cellular capacitance (middle), amperometric current (bottom, left ordinate), and cumulative charge (bottom, right ordinate).
- Quantification of the cellular capacitance prior to uncaging (cell size) and changes in capacitance at 1 s (burst) and 5 s (total) after uncaging. The sustained release (sust.) is the difference between total and burst secretion.
- Release kinetics is unaltered in vti1a nulls: capacitance curves from the middle panel of (A) scaled to their respective values at 1 s have similar shapes.
Data information: Bar diagram shows means ± SEM. Number of cells (n): wild-type: n = 34; vti1a null: n = 30. ***P < 0.001.
Thus, vti1a null cells display a clear defect in the extent, but not the kinetics, of secretion, when using a stimulus independent of Ca2+-channels. The defect appears overall stronger when cells are tested with Ca2+-uncaging (Fig5) than when probed by depolarization (Fig4). This is most likely due to the higher basal Ca2+ concentration used during uncaging experiments (784 ± 23 nM in WT cells; 831 ± 31 nM in vti1a null cells) than during depolarization experiments (68.8 ± 5.8 nM in WT cells; 69.0 ± 6.3 nM in vti1a null cells). This increase in basal Ca2+ concentration causes an increase in the releasable vesicle pools by stimulating priming (Voets, 2000) and therefore increases the demand for secretory vesicles, which the vti1a null cells cannot meet (see also below). This is consistent with the finding that the decrease in secretion was stronger during the second round of depolarizations (Fig4). We conclude that vti1a null cells suffer from a secretion defect, which is more severe during stronger stimulation.
Loss of vti1a does not affect the Ca2+-sensitivity of exocytosis
We directly tested the Ca2+-sensitivity of exocytosis in so-called ‘ramp experiments’, where the intracellular Ca2+-concentration is increased slowly (ramplike) while the cellular capacitance and Ca2+ concentrations are measured simultaneously (Sorensen et al, 2002). The Ca2+ level at the point of fastest secretion acceleration—the release threshold—was determined as a sensitive readout of the Ca2+-sensitivity for release (vertical lines in Supplementary Fig S3A and B). This parameter is changed when mutating components of the release machinery including synaptotagmin-1 (syt-1) (Sorensen et al, 2003a) and the syt-1–SNARE interaction site (Mohrmann et al, 2013). The average release threshold (vertical dashed lines and error bars in Supplementary Fig S3C) was similar in both conditions (vti1a WT: 1.29 ± 0.11 μM, n = 50; vti1a null: 1.22 ± 0.08 μM, n = 48), demonstrating normal Ca2+-sensitivity of the release machinery in vti1a-deficient chromaffin cells.
Since neither the kinetics nor the Ca2+-sensitivity of release was changed in the vti1a null, we conclude that exocytosis triggering is independent of vti1a, and the secretion defect in knockout cells must be due to reactions upstream of exocytosis itself.
Vti1a loss decreases the number of secretory granules
In order to investigate which upstream reactions were affected by the loss of vti1a, we performed ultra-structural analyses of chromaffin cells from the vti1a null (Fig6). We found that the overall cell morphology was normal in the vti1a null, but loss of vti1a profoundly decreased the total number of LDCVs by approximately 40% (Fig6Ai, Bi, Ci, and Cii). The number of vesicles docked to the plasma membrane was reduced to a similar extent (Fig6Aii, Bii, and Ciii), indicating that the defect in docking is secondary to the reduction in the number of granules. The reduction in exocytotic burst size (Fig5A and B)—indicative for vesicle priming—also roughly agrees with the reduction in vesicle numbers. Overall, these findings are consistent with the reduction in exocytosis being caused by the paucity of vesicles in the cell, not by a defect in the docking, priming, or triggering mechanisms.
Figure 6. Vti1a null cells have fewer and smaller large dense-core vesicles.

A, B Electron micrographs of cultured vti1a WT (Ai) and vti1a null (Bi) cell, showing overall normal morphology. Scale bars, 1,000 nm. Close-up of vti1a WT (Aii) and vti1a null cells (Bii) showing docked vesicles. Scale bars, 500 nm. Examples of docked and undocked vesicles in the vti1a WT (Aiii) and the vti1a null (Biii). Scale bars, 50 nm.
Ci Cumulative distribution of the number of vesicles from the surface of the cell. Vti1a null cells have overall fewer vesicles. Insert: close-up of the first 100 nm, showing differences in docked vesicles (corresponds to first bin).
Cii, Ciii Bar diagrams showing a reduction in total number of vesicles and docked vesicles in the vti1a null. Number of cells (n): wild-type: n = 28, vti1a null n = 23. ***P < 0.001.
Civ Average diameter (mean of cell means) of undocked vesicles, docked vesicles, and all vesicles. *P < 0.05, #P = 0.0677.
Cv Size distribution of all vesicles in vti1a WT and vti1a null cells. Number of cells (n): wild-type: n = 21, vti1a null: n = 21.
We analyzed the morphology of individual vesicles and found that vti1a-deficient mice had slightly, but significantly, smaller vesicles (Fig6Aiii, Biii, Civ, and Cv). Docked vesicles showed the same trend as non-docked (Fig6Civ). This finding correlates with the lower syb-2 staining per vesicle described above (Fig3C and D), and, indeed, when we calculated the average syb-2 staining per vesicle (Fig3C and D) and normalized to the membrane area of the vesicles, calculated from the diameters (Fig6Civ), the specific syb-2 abundance was indistinguishable between WT and vti1a null (normalized data: WT = 100 ± 14%; vti1a null: 93 ± 16%). Thus, vesicles are fewer and smaller in the vti1a null, but maintain similar specific syb-2 density in the membrane. These findings again point to a function of vti1a in the formation and maturation of LDCVs.
Lack of re-release of vesicular components in chromaffin cells
The reduction in exocytosis and vesicle numbers found in the vti1a null would be consistent with a role for vti1a in vesicle biogenesis, in agreement with its localization to immature vesicles and the TGN-compartments leading to formation of mature LDCVs. However, another possibility is that the reduction in vesicle number is caused indirectly, by a defect in recycling of vesicular components back to the TGN, consistent with the proposed role of vti1a in endosome-to-Golgi fusion (Mallard et al, 2002). However, the extent to which recycling of vesicular components plays a role in LDCV biogenesis in chromaffin cells is unknown.
In an attempt to distinguish between those two possibilities, we examined whether the vesicular component syt-1 would recycle to functional vesicles and thus be available for re-release at later times. We incubated chromaffin cells undergoing exocytosis with a syt-1 antibody covalently liked to CypHer, a pH-sensitive cyanine dye, which is quenched at neutral, but fluorescent at low pH (Hua et al, 2011) (Fig7A). Vesicle cycling (exocytosis followed by endocytosis) was stimulated by depolarization of the cells in a solution with a high K+ concentration in the presence of the antibody. This was followed by 1-h incubation in culture medium at 37°C in a CO2 incubator (Fig7B). The cells were washed and imaged. Overall, staining was weak, but specific, as it was quenched by the alkalization of intracellular compartments with NH4Cl (pH 8.2, Fig7D), reduced by preincubation of the antibody with the antigenic peptide (Supplementary Fig S4B) and identical treatment of cells in the absence of the antibody resulted in no fluorescence (Supplementary Fig S4A). Staining in WT cells was two times stronger than in vti1a null cells (Fig7D), consistent with the difference in secretory capacity. A second stimulation with high K+ solution did not lead to any detectable exocytosis of CypHer-loaded compartments, as shown by the lack of a significant decrease in fluorescence (Fig7D). Also, no detectable surface-stranded CypHer remained that could be de-quenched by an acidic wash (acetic acid, pH = 5, Fig7D).
Figure 7. Antibody uptake experiment fails to demonstrate re-release of syt-1.
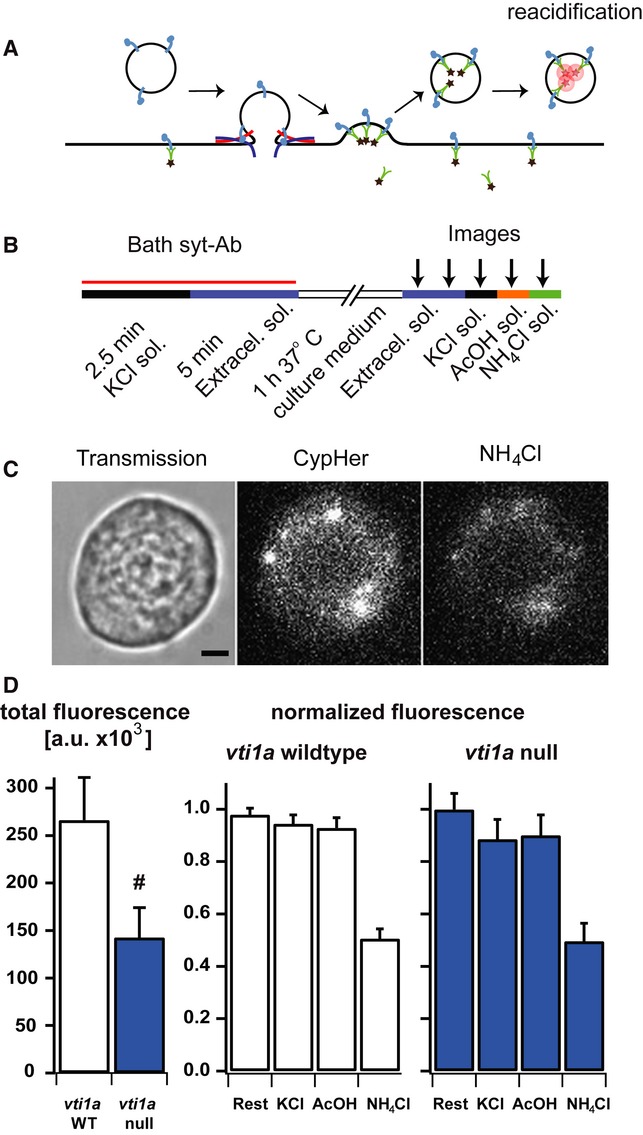
- The antibody against syt-1 was labeled with CypHer5E, a pH-dependent dye, which is fluorescent in acidic compartments. This antibody would therefore label syt-1 in endosomes or recycling vesicles.
- Cells were stimulated with high K+ solution (KCl Sol.) and washed with normal extracellular solution in the continuous presence of the antibody and then transferred to a CO2-incubator for 1 h at 37°C. Images were captured twice in extracellular solution (to assess bleaching), then once in the presence of high K+ solution, then in acidic buffer (AcOH: acetic acid, 50 mM), and finally in ammonium buffer (NH4Cl: 50 mM).
- Transmission (left) and fluorescent images in the presence of acetic acid (AcOH, middle) and NH4Cl (right). Scale bar, 2 μm. Notice that dimmer staining in the presence of ammonium overlaps with staining in the presence of AcOH, indicating incomplete quenching of fluorescence, rather than unspecific staining.
- Left: total fluorescence in vti1a WT and vti1a null cells in extracellular solution. Middle: fluorescence in extracellular solution [2nd image, see (B), ‘Rest’], high K+ (‘KCl’), AcOH and NH4Cl solution; all are normalized to the intensity during the 1st image. The difference between the ‘Rest’ and the value 1.0 reports on the bleaching from one image to the next. Right: same as middle, in vti1a null cells. Data are means, and error bars SEM. #P = 0.06. Number of cells: vti1a wild-type: n = 40; vti1a null: n = 29.
The lack of significant re-release indicates that syt-1 does not recycle to releasable vesicles in either WT or vti1a null cells. These data suggest that a normal secretion capacity of chromaffin cells can be maintained without recycling constituents of the release machinery, at least on a timescale of hours. Longer incubations led to weaker signals probably indicative of syt-1 breakdown, rather than targeting to the TGN (Supplementary Fig S4A). The fluorescence decay in vti1a null and WT cells occurred at similar speeds, suggesting that protein degradation occurs with the same capacity independent of vti1a. However, we cannot rule out that a minor fraction of syt-1 recycles to new vesicles after longer times. Our experiment overall suggests that a possible role of vti1a in retrograde trafficking is not likely to explain the observed secretion phenotype and that a role in the anterograde pathway is the most likely explanation for the observed impairment of the secretion response.
Vti1b does not compensate for the loss of vti1a
The closest related protein to vti1a in mouse is vti1b, and previous analysis of vti1b-deficient mice showed only subtle defects (Atlashkin et al, 2003), whereas double vti1a/vti1b null mice are not viable (Kunwar et al, 2011). This led to the suggestion that these proteins might compensate for each other. We studied the role of vti1b in secretion and secretory vesicle biogenesis and possible compensation by vti1b in the vti1a null by analyzing vti1b nulls and vti1a/b double null mice.
Loss of vti1b neither had any effect on exocytosis evoked by Ca2+-uncaging (Supplementary Fig S5), nor did it change the number or distribution of LDCVs (Fig8Bvi and Bvii). In the double vti1a/vti1b null, secretion, total and docked vesicle numbers were reduced to a similar extent as in the vti1a single null (Fig 8Ai–Bvii). This demonstrates that the additional loss of vti1a's closest relative vti1b did not increase the severity of the vti1a null phenotype and establishes that vti1b does not compensate for vti1a loss. Therefore, we conclude that vti1a and vti1b subserve non-overlapping roles in adrenal chromaffin cells.
Figure 8. The phenotype of vti1a/vti1b double null chromaffin cells is similar to that of the vti1a null.

Ai Ca2+-uncaging experiment. Panels arranged as in Fig5A.
Aii Quantification of cell size, total-, burst- and sustained secretion reveals a reduction of all release phases in vti1a/b double nulls (DKO) compared to littermate double heterozygous (DHet) controls.
Aiii Capacitance curves scaled to their respective values at 1 s have similar shapes in vti1a DKO and DHet cells. Number of cells: vti1a/b DHet: n = 38; vti1a/b DKO: n = 52.
Bi–Biv Electron micrographs of chromaffin cells in the intact gland of vti1a/vti1b DHet animals (Bi, Bii) and a vti1a/b DKO animal (Biii, Biv). Bi, Biii: scale bars, 1,000 nm; Bii, Biv: scale bars, 200 nm.
Bv Size distribution of secretory vesicles in DHet (grey bars), and the DKO (red bars), respectively. The double null has smaller vesicles, consistent with findings in vti1a null cells.
Bvi The number of docked vesicles is reduced in the vti1a null and the vti1a/b DKOs. Animals prepared in parallel (as littermates) are shown together. For the vti1b null, we did not obtain WT littermates.
Bvii The total number of vesicles is reduced in the vti1a null and the vti1a/b DKOs.
Data information: Data are mean and error bars SEM. Number of cells: vti1a/b DHet: n = 20; vti1a/b DKO: n = 20; vti1a WT (wild type): n = 20; vti1a null: n = 20; vti1b null: n = 18. **P < 0.01, ***P < 0.001.
Long-, but not short-term expression of vti1a restores secretion
In conventional knockout animals, the deletion of the gene affects the whole organism. Therefore, our observations from chromaffin cells taken shortly after birth could theoretically be due to developmental defects that affected the creation of these cells at earlier stages, without vti1a playing a direct role in the biogenesis of vesicles at the time of the experiment. Therefore, we tested whether the acute re-expression of the protein rescued the knockout phenotype.
We first used the Semliki Forest Virus (SFV), which is widely used for rescue experiments in chromaffin cells [e.g., (Borisovska et al, 2005; Liu et al, 2008; Sorensen et al, 2003b; Tian et al, 2005; Walter et al, 2010)]. Infection with the virus resulted in robust expression of vti1a as early as 6 h after infection with protein levels in 20-fold excess of the endogenous wild-type levels. However, exocytosis from cells expressing the protein for 6–8 h showed no rescue (Fig9C); they were as impaired in their release as vti1a-deficient cells, while WT littermates displayed robust secretion in parallel experiments. At longer times, the health of the chromaffin cells suffered due to the transient nature of Semliki Forest infection, which eventually leads to the death of the cells.
Figure 9. Rescue of secretion in nulls requires long-term expression of vti1a.
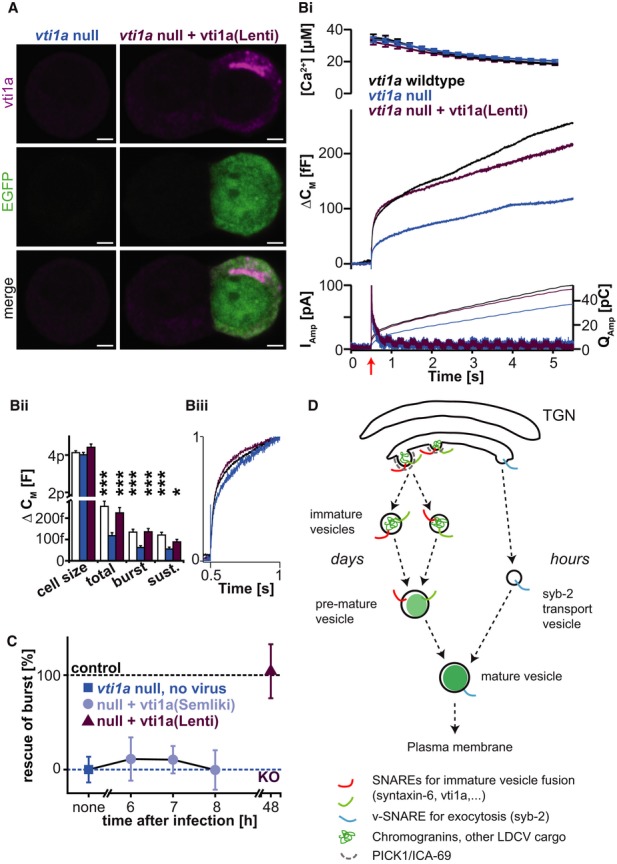
A Staining of vti1a nulls rescued with Lentiviruses expressing vti1a (magenta) and EGFP (green). The right panel shows two cells, one is infected with Lentivirus, one is not. Scale bars, 2 μm.
Bi Ca2+-uncaging experiment, panels arranged as in Fig5A. Shown are three groups: vti1a WT littermates (black traces), vti1a nulls (blue traces), and vti1a nulls rescued with Lentiviruses expressing vti1a (lilac trace). The wild-type and knockout data in (B) are the same as shown in Fig 5.
Bii Quantification of cell size, total-, burst- and sustained secretion reveals significant rescue of all components (total, burst, and sustained release) by lentiviral expression. *P < 0.05, ***P < 0.001.
Biii Release kinetics is unaltered in all groups: capacitance curves from (Bi) scaled to their respective values at 1 s have similar shapes.
C Rescue of burst component as a function of expression time, using Semlikivirus or Lentivirus. Data are means ± SEM. Number of cells: vti1a wild-type: n = 34; vti1a null: n = 30; vti1a null + vti1a (Lenti): n = 30; vti1a null + vti1a (Semliki, 6 h): n = 9; vti1a null + vti1a (Semliki, 7 h): n = 15; vti1a null + vti1a (Semliki, 8 h): n = 9. The wild-type and knockout data in (B) are the same as shown in Fig5. All three groups of cells were measured in parallel, from the same animals in the case of knockout and rescue, and from littermates in the case of wild types.
D This tentative model for secretory vesicle biogenesis postulates that sequential vesicle fusion of immature vesicles utilizing a full complement of SNAREs, at least including vti1a and syntaxin-6, and probably VAMP4, is a prerequisite for formation of secretory granules. Immature vesicles form by budding from the TGN using PICK1 and ICA69 (Cao et al, 2013; Holst et al, 2013). To account for the observation that synaptobrevin-2 can be re-supplied to synaptobrevin-2 knockout cells within several hours to create fully fusogenic vesicles, whereas vti1a requires long-term (days) re-expression, we suggest that synaptobrevin-2 is supplied to almost mature (‘pre-mature’) vesicles at a very late stage. The model does not show the return of vti1a/syntaxin-6/VAMP4 to the TGN.
Our previous (successful) use of the SFV system to induce rescue within 6–8 h was focused on proteins directly involved in exocytosis, including the SNAREs and syt-1. We suspected that rescue with vti1a might require longer times, because of its role in vesicle generation, which has a longer turnover time (Duncan et al, 2003). Therefore, we used the lentiviral (LV) expression system, which allows stable and long-term expression. Infection of vti1a knockout cells with LVs resulted in twofold expression of vti1a 48 h after infection, with similar localization of the protein as in the wild type (Fig9A). Re-expression of vti1a with LVs rescued the observed defect in secretion. Only the sustained component seemed to be still slightly depressed after rescue. However, statistical analysis showed significant rescue during all phases of exocytosis (Fig9B). This experiment demonstrates that the vti1a null phenotype is cell autonomous and reversible upon re-expression of the protein. The lack of rescue using a strong, transient expression system (like the SFV) appears inconsistent with a direct involvement of vti1a in exocytosis, but in line with the action on an upstream step involved in vesicle generation.
Discussion
We found that vti1a deletion results in a reduction of catecholamine exocytosis without changes in fusion kinetics or Ca2+-dependence of fusion. This indicates that not the exocytosis mechanism, but the number of fusing vesicles is changed by vti1a deletion. Indeed, electron microscopy demonstrated a proportional decrease in docked and total vesicle numbers in vti1a null cells, indicating vti1a involvement in upstream processes leading to the formation of vesicles. Furthermore, functional rescue required long-term (2 days) expression of vti1a, whereas short-term overexpression was inefficient. This points again to an upstream role of vti1a (see below). Finally, using 3D-structured illumination microscopy, we showed that vti1a is not present on mature chromaffin vesicles. The conclusion that vti1a acts on an upstream step aligns with previous findings that docking, priming and fusion in these cells depend on other SNAREs, namely syntaxin-1, synaptobrevin-2, and SNAP-25 together with the Ca2+-sensor synaptotagmin-1 (Sorensen et al, 2003b; Borisovska et al, 2005; de Wit et al, 2006, 2009).
Vti1a is found on a subset of synaptic vesicles (Antonin et al, 2000b; Hoopmann et al, 2010; Ramirez et al, 2012), and recent data implicated vti1a in spontaneous fusion (Ramirez et al, 2012), which is controversial (Hoopmann et al, 2010). Adrenal chromaffin cells show little spontaneous release, and we here show that vti1a does not localize to LDCVs and that release rates and Ca2+-sensitivities are unchanged in the vti1a null, ruling out a direct role for vti1a in fusion of these vesicles. However, our findings indicate three different ways in which vti1a affects release indirectly. First, by participating in vesicle biogenesis at or near the TGN, vti1a is a prerequisite for generating LDCVs in normal numbers. Second, vti1a also plays a role for the properties of generated vesicles, with LDCVs in the vti1a null being smaller, although interestingly their specific syb-2/VAMP2 density was maintained. Third, in vti1a null cells, fewer Ca2+-channels were present at the membrane, consistent with a trafficking defect of these channels. This finding is reminiscent of a previous report that vti1a participates in trafficking of Kv4 K+ channels and KChIPs (K+-channel-interacting proteins) to the plasma membrane (Flowerdew & Burgoyne, 2009).
Given our findings, it is possible that vti1a participates in the generation of neuropeptide-containing dense-core vesicles in neurons, and/or in trafficking of Ca2+-channels. Thus, elimination of vti1a might influence neurotransmission indirectly, by changing secretion of neuropeptides, as is the case for synaptotagmin-4 (Dean et al, 2009), or by reducing Ca2+-currents. Synaptotagmin-4 has been implicated in dense-core vesicle maturation via interaction with syntaxin-6 (Ahras et al, 2006), and it appears likely that vti1a is part of the same complex. Further studies will be required to understand the function of vti1a in neurons.
Our data clearly demonstrate that vti1a is involved in generation of LDCVs. In its absence, the total number of vesicles was reduced, resulting in fewer vesicles that were docked to the plasma membrane and in a reduction of the readily releasable pool. The role of vti1a in vesicle generation is in line with previous data showing impaired delivery of GLUT4 to the membrane following vti1a knockdown (Bose et al, 2005). Notably, the vti1a partner VAMP4 has been implicated in biosynthetic entry of GLUT4 into insulin-responsive vesicles (Williams & Pessin, 2008), whereas fusion of GLUT4 vesicles with the plasma membrane requires a different SNARE complex consisting of syntaxin-4, SNAP-23, and syb-2 (Kawanishi et al, 2000), which aligns well with our findings of an upstream function for vti1a in vesicle generation.
Immunofluorescence localized vti1a to a compartment near the TGN, which contains the vti1a-partner syntaxin-6, but not TGN38. A similar syntaxin-6-positive and TGN38-negative compartment was previously found to be involved in GLUT4 recycling (Shewan et al, 2003). Recently, the BAR-domain proteins PICK1 and ICA69 were found to be involved in dense-core vesicle generation in growth hormone secreting cells (Holst et al, 2013) and in pancreatic β-cells (Cao et al, 2013). Interestingly, PICK1 co-localized better with syntaxin-6 than with TGN38 (Holst et al, 2013), pointing to a similar localization as vti1a. Thus, a picture is emerging that a syntaxin-6-positive compartment close to the TGN is specifically involved in vesicle generation. This compartment has been referred to as ‘a subdomain of the TGN’ (Shewan et al, 2003), or—based on the colocalization with syntaxin-6 and experiments with brefeldin A—simply ‘immature vesicles’ (Cao et al, 2013; Holst et al, 2013). Experiments using immuno-EM will be required to characterize this compartment in more detail. Together with vti1a, this compartment then contains syntaxin-6 and possibly VAMP4 (Wendler et al, 2001). The final partner needed for a functional SNARE complex is likely syntaxin-13 or syntaxin-16, which are known partners of vti1a (Kreykenbohm et al, 2002; Mallard et al, 2002; Brandhorst et al, 2006; Zwilling et al, 2007). A full complement of SNAREs in this compartment prompts the question why a membrane fusion step is required during vesicle biogenesis?
An interesting finding was that long-term (2 days) re-expression of vti1a was necessary for rescue of the vti1a null phenotype, whereas short-term expression was ineffective. This contrasts with functional rescue within 8 h, which has been demonstrated for the integral vesicular membrane proteins syb-2 and synaptotagmin-1 that are directly involved in exocytosis triggering (Borisovska et al, 2005; Nagy et al, 2006; Walter et al, 2010). One idea, which would integrate this finding with the need for membrane fusion in vesicle biogenesis, is that mature vesicles are generated by several sequential fusion reactions between immature vesicles (Wendler et al, 2001), until the full vesicle complement is achieved (Fig9D). In this cascade, incorporation of syb-2 and synaptotagmin-1 might be the last events to occur, because they will only be needed for fusion with the plasma membrane and thus they can be supplied to almost mature vesicles within a few hours. However, the formation of vesicles through fusion of immature precursors might start further upstream and involve fusion reactions taking place over the course of days (Fig9D). Therefore, eliminating the basal fusion machinery between these precursor vesicles will also take days to remedy. This idea aligns well with the demonstrated need for syntaxin-6 in immature vesicle fusion (Wendler et al, 2001). It further accounts for the lack of co-localization between syb-2 and vti1a within the TGN area, which is hard to explain if syb-2 is incorporated into immature vesicles at the beginning of the biosynthetic cascade.
Alternatively to an anterograde function in homotypic fusion of immature vesicles, vesicle formation could be affected indirectly by deletion of vti1a, by impairing recycling of components of the fused vesicles back to the TGN (retrograde pathway). However, studying syt-1 cycling, we demonstrated that re-release is not a predominant mechanism. This suggests that a normal secretion capacity in chromaffin cells can be maintained without recycling constituents of the release machinery. This appears more consistent with a function of vti1a in an anterograde pathway, although recycling of components over longer times than resolved in our experiment cannot be ruled out.
Even in the absence of vti1a, homotypic fusion of immature vesicles must be able to proceed, but with decreased efficiency. This is reflected by the observation of mature—albeit fewer and slightly smaller—LDCVs and substantial exocytosis even in the vti1a null. Thus, other SNAREs must be able to compensate for vti1a loss, or alternatively this fusion reaction can be bypassed altogether during the formation of mature vesicles. Compensation of one SNARE by another is expected, because SNAREs display a certain degree of promiscuity, as long as the QabcR-rule of formation is obeyed (Jahn & Scheller, 2006). Thus, candidates for SNAREs compensating for vti1a are other Qb-SNAREs.
The closest related Qb-SNARE is vti1b, even though the two proteins only share 30% homology (Fischer von Mollard & Stevens, 1998). We found that vti1b knockout cells showed no defect in LDCV generation or release. The simultaneous loss of both vti1a and vti1b did not result in additional defects, with vesicle priming, vesicle numbers, and vesicle sizes similar to those in the vti1a single knockout. This shows that vti1b cannot compensate for vti1a in the secretory pathway and that the two proteins—which have a single homologue in yeast—have evolved to serve separate functions in mammals. Consequently, the neurodegenerative phenotype of the vti1a/vti1b double knockout mouse (Kunwar et al, 2011) in the absence of the same phenotype in the single knockouts (Atlashkin et al, 2003; Kunwar et al, 2011) might be a synergistic consequence of simultaneous defects in secretion (due to vti1a loss) and late endosomal or lysosomal function (vti1b loss, Atlashkin et al, 2003).
In conclusion, we have demonstrated that vti1a, but not vti1b, supports exocytosis in adrenal chromaffin cells by maintaining correct vesicle numbers, vesicle sizes, and number of Ca2+ channels in the plasma membrane. We suggest that vti1a acts together with syntaxin-6 in an intermediate fusion step near the TGN, which eventually leads to the formation of mature dense-core vesicles.
Materials and Methods
Mouse strains
We used mice of the vti1a and vti1b strains (Atlashkin et al, 2003; Kunwar et al, 2011). The mouse strains were kept heterozygous for the null allele, and heterozygote crosses were used to generate null animals (knockouts). Wild-type littermates were used for control unless noted otherwise. The double vti1a/vti1b strain was kept in the double heterozygous condition, and double knockouts were compared to double heterozygotes.
Expression viruses
The vti1a cDNA was ligated using BamHI and EcoRI sites into a plasmid containing an IRES2 (EMCV-IRES)-EGFP element. The resulting vti1a-IRES2-EGFP cassette was ligated into the pSFV1 plasmid using SmaI and AvrII sites. For the generation of the lenti viral plasmid, the vti1a-IRES2-EGFP cassette was ligated into the multiple-cloning site of pLenti. All constructs were verified by sequencing. Generation of Semliki Forest Virus (SFV) and lentiviral particles followed standard protocols.
Adrenal chromaffin cell cultures
Adrenal chromaffin cell cultures were prepared from P0-P1 pups, or occasionally from E18 embryos, as described previously (Sorensen et al, 2003b). The cells were incubated at 37°C and 8% CO2, and used within 4 days.
Immunoblotting
The following antibodies were used: HSP70 (as loading control; mouse nonoclonal, Synaptic systems, cat. no. 149011, dilution 1:1,000), SNAP-23 (rabbit, Synaptic Systems, cat. no. 111202, 1:500), SNAP-25 (rabbit, Synaptic Systems, cat. no. 111002, 1:1,000), SNAP-29 (rabbit, Synaptic Systems, cat. no. 111303, 1:1,000), SNAP-47 (rabbit, Synaptic Systems, cat no. 111403, 1:1,000), synaptobrevin-2 (mouse monoclonal 69.1, Synaptic Systems, cat. no. 104211, 1:250), syntaxin-6 (rabbit, Synaptic Systems, cat no. 110062, 1:1,000), syntaxin-16 (ODTH, custom made, 1:500), VAMP4 (136, custom made, 1:500). HRP-conjugated antibodies were from Jackson ImmunoResearch (rabbit: 112-035-143; mouse: 111-035-144) and diluted 1:10,000. The syntaxin-16 and VAMP4 antibodies have been described before (Kreykenbohm et al, 2002).
Four different experiments were performed; in each experiment, five pairs of adrenal glands per genotype (from newborn vti1a null or C57Bl/6 WT mice) were pooled to get enough material. Whole adrenal glands were homogenised with ceramic beads in 200 μl PBS+Triton X-100 (1%) with PMSF as protease inhibitor using Precellys 24 tissue homogenizer (Bertin Technologies; program: 2 × 15 s, 5,000 movements/min). The samples were incubated on ice for 1 h with short vortexing every 15 min, and then centrifugated (4°C, 10 min, 960 g). The protein concentration in the supernatant was determined using Bradford Assay and a Nanodrop spectrophotometer (ND-1000). If necessary, samples were diluted in homogenization buffer. 15–20 μg per sample were loaded on a 12.5% SDS gel. The gel was blotted (1 h, 50 mA per gel, semi-dry transfer) onto nitrocellulose membranes (Protran BA85; GE Healthcare Life Sciences) and blocked (45 min with 2% milk powder in PBS-T). The membranes were incubated for 2 h with the primary antibody in 2% milk powder in PBS-T and washed 3 × 5 min with PBS-T and then for 1 h with secondary HRP-conjugated antibody in PBS-T. The membranes were incubated with ECL reagent [Super Signal West Pico Chemiluminescenz Reagenz (Thermo Scientific) and SuperSignal West Femto Trial kit (Thermo Scientific)]. The ECL signal was detected with Fujifilm LAS 3000 ECL-camera. The signal was quantified with ImageJ and normalized to HSP70 (loading control). Finally, the signal from vti1a null glands was normalized to WT within the same experiment.
Immunofluorescence staining and confocal imaging
Primary antibodies were used against GM130 (mouse monoclonal 35, BD Transduction Laboratories 1:400), Lamp1 (rat monoclonal 1D4B, Abcam 1:100), Syntaxin-6 (mouse monoclonal 3D10, Abcam, 1:1,000), VAMP2/syb-2 (mouse monoclonal 69.1, Synaptic Systems, 1:1,000), TGN38 (rabbit polyclonal ab76282, Abcam, 1:250), Chromogranin B (polyclonal rabbit 259103, Synaptic Systems, 1:500) and vti1a (rabbit polyclonal, 1:200 (Antonin et al, 2000b), or—for costaining with chromogranin B or TGN38—mouse monoclonal 611220, BD Transduction Laboratories). As secondary antibodies, goat α-mouse, goat α-rabbit, goat α-rat Alexa Fluor 488, 546, and 647 were used (all Molecular Probes, 1:1,000).
For stainings on fixed cells, E18 or P1 chromaffin cells were fixed at DIV2 (2 days in vitro) by incubation in 2% paraformaldehyde (PFA) in PBS for 20 min. Afterward, the cells were incubated in 4% PFA in PBS for another 20 min, washed three times, and permeabilized for 5 min in PBS containing 0.5% Triton X-100 (Sigma), followed by 30 min block in D-PBS containing 0.1% Triton X-100 and 2% normal goat serum. The same solution was used for diluting antibodies. The chromaffin cells were incubated for 1 or 2 h in primary antibodies at room temperature, washed three times with PBS, and incubated in secondary antibodies for 1 h. After extensive washing, cells were mounted on microscopic slides with Prolong Gold (Invitrogen) or with Mowiol. Confocal images were acquired with a 63× Plan-Neofluar lens (Numerical aperture 1.4, Carl Zeiss b.v. Weesp) and a zoomfactor 5 on a Zeiss 510 Meta Confocal microscope (Carl Zeiss). 3D-structured illumination microscopy (3D-SIM) was performed using the Elyra PS.1 platform (Carl Zeiss) equipped with a 63× Plan-Apochromat lens (Numerical aperture 1.46, Carl Zeiss).
For live stainings of Ca2+-channels, chromaffin cells were cultured on poly-D-lysine (Sigma-Aldrich) coated coverslips, briefly washed with ice-cold PBS cells, and incubated in a blocking buffer (4% BSA in PBS cooled to 4°C) for 5 min. Cells were incubated with an antibody against voltage-dependent Ca2+ channel subunits (rabbit anti-Cavα2δ4; dilution 1:200, Alomone labs) at 4°C for 30 min, followed by washing and incubation with a secondary antibody (Alexa Fluor 488-conjugated goat anti-rabbit antibody; dilution 1:1,000; Invitrogen) at 4°C for 1 h. Finally the cells were fixed at room temperature with 4% paraformaldehyde for 15 min. Samples were mounted with Prolong Gold. Images were acquired using a Zeiss LSM710 point laser (Argon Lasos RMC781272) scanning confocal microscope with a Zeiss Plan-Apochromat 63×/NA 1.4 oil objective (Carl Zeiss, Germany).
Analysis of immunofluorescence imaging data
For quantification of chromaffin cells stained against Ca2+-channels, maximum projections of three confocal sections (0.7 μm) close to the center of the cell were used to generate maximum projections with ImageJ software. For all other confocal quantifications, the signal intensities in single-confocal plane images were analyzed with ImageJ software. After measuring the mean intensity per cell, the mean intensity of its nucleus was determined and subtracted from the mean intensity in order to correct for background signal.
For the 3D-SIM analysis, the images were exported from the ZEN software (Carl Zeiss). The z-stacks were re-opened in the ImageJ software, and a single-footprint plane was used to generate the line profiles of both channels. For the single-vesicle fluorescence analysis shown in Fig3C and D, a maximal projection of the 20 lowest optical slices (which excludes the TGN area) was analyzed. Vesicles were manually centered in sub-images of the syb-2 channel (22 × 22 pixel, pixel dimension: 40 nm). Images were extracted from both channels and averaged in ImageJ. Line profiles were extracted from the center line. For statistical analysis of fluorescence values, the average baseline of each group was subtracted from the individual single-vesicle line profiles.
Live cell imaging of syt-cycling
For antibody feeding experiments, cells were densely plated on 12-mm coverslips. Cells were first washed for a few seconds in extracellular solution A. They were then placed into a depolarizing solution (solution B) for 2.5 min containing a rabbit antibody against the luminal domain of mouse syt-1 coupled to a dye. To test the specificity of the antibody uptake, we used an Oyster550 version (cat. No. 105 103C3; Synaptic Systems) in 1:100 dilution. Specificity was tested by comparing the fluorescence values with and without the addition of the antigenic (blocking) peptide (sequence: MVASASRPE-C, cat. No. 105-10P, Synaptic Systems) in 1:20 dilution (of a 1 μg/μl stock in PBS). After depolarization, cells were transferred to an imaging buffer (Solution A) and imaged immediately. For CypHer experiments, the antibody (cat. no. 105103) was coupled to the pH-sensitive fluorescent probe CypHer5E by Synaptic Systems (custom made). Experiments were performed at 1:50 dilution. Cells were depolarized in the presence of the antibody for 2.5 min (solution B) at room temperature and then transferred for 5 min to solution A that contained the syt-1 CypHer antibody at 1:50 dilution. Cells were washed for a few seconds in solution A without antibody and then put back into culture medium in the incubator for 1 h prior to image acquisition.
To investigate the intracellular localization of the syt-1 CypHer antibody, five conditions were tested. Condition 1: an image was acquired in ordinary extracellular solution (solution A). Condition 2: a second image was acquired with the same settings (also solution A), to evaluate signal variation and photo-bleaching. Condition 3: cells were stimulated by depolarization with solution B. Condition 4: cells were acidified by a low-pH solution with acetic acid (solution C). Condition 5: cells were treated with NH4Cl, which quenches CypHer (solution D). All solutions were applied for 3 min prior to image acquisition, and the exact composition was as follows: Solution A (in mM): 145 NaCl, 2.8 KCl, 1 MgCl2, 10 NaOH-HEPES, 2 CaCl2, 11.1 glucose at pH = 7.4. Solution B (high-KCl solution, in mM): 60 NaCl, 80 KCl, 5 CaCl2, 1 MgCl2, 10 NaOH-HEPES, 11.1 glucose at pH = 7.4. Solution C (low-pH acetic acid, in mM): 130 NaCl, 2.8 KCl, 2 CaCl2, 1 MgCl2, 10 Mes-buffer, 50 Acetic acid, 11.1 glucose at pH = 5. Solution D (NH4Cl, in mM): 95 NaCl, 2.8 KCl, 2 CaCl2, 1 MgCl2, 10 NaOH-HEPES, 50 NH4Cl, 11.1 glucose, pH = 8.2.
All images were acquired on a Zeiss Axio Observer A1 with a 25× LC LCI-Plan-Apo NA 0.8 immersion objective. Oyster550 and CypHer were excited for 200 ms (Oyster550) and 500 ms (CypHer) at 546 nm with monochromatic light (Polychrome V, TILL Photonics) and detected on an EM-CCD (Andor 885, Andor) with the EM-gain set to 200, controlled by Live Acquisition Software (TILL Photonics). Fluorescence levels were quantified with ImageJ by measuring the integrated intensity values of a ROI surrounding the cells subtracted by the integrated intensity of the background determined by a ROI of identical size.
Electron microscopy
Electron microscopy of intact glands (Fig8): adrenal glands were removed on embryonic day 18 and emersion fixed for 2.5 h at room temperature with 2% paraformaldehyde, 2.5% glutaraldehyde in 0.1 M cacodylate buffer (pH 7.2), and further processed as previously described (Voets et al, 2001).
Electron microscopy of cultured cells (Fig6): chromaffin cells were cultured on rat tail type 1 collagen-coated coverslips (Cellocate, Eppendorf, Germany). Cells (DIV2) were fixed for 45 min at room temperature with 2.5% glutaraldehyde in 0.1 M cacodylate buffer (pH 7.4), washed, embedded, and analyzed as explained before (Toonen et al, 2006).
Analysis of secretory vesicle distribution was carried out blinded for the genotype of the animal. For each condition, the distribution of secretory vesicles was analyzed in ultrathin sections (˜90 nm) of randomly selected chromaffin cells from different animals (and three different grids per animal). Only cells with a visible nucleus and clear-cut plasma membrane were taken into account. Secretory vesicles were recognized by their round, dense core. Docked vesicles were without any measurable distance between granule and plasma membrane. Distances from the granule membrane to the plasma membrane were measured on digital images acquired at 20,000× magnification by a Kodak MegaPlus 1.4i camera controlled by analySIS (Soft Imaging Systems/Olympus, Germany).
Electrophysiology
All amperometry measurements except for the ones shown in Fig8A were performed with 5-μm-diameter carbon fibers (Thornel P-650/42; Cytec) that were insulated with polyethylene (Bruns, 2004). The data in Fig8A were obtained with 10-μm-diameter fibers (BP Amoco Chemical Co.), insulated by electropaint deposition (Schulte & Chow, 1996). A constant voltage of 700 mV was applied, and fibers were pressed gently against the cell. Currents were amplified by an EPC-7 amplifier (HEKA Elektronik, Lamprecht/Pfalz, Germany), filtered at 2.9 kHz, and sampled at 11.5 kHz.
Whole-cell patch-clamp measurements were conducted in parallel with 3–7 MΩ resistance pipettes. Cellular capacitance—which is proportional to the cell surface area and which increases upon exocytosis—was measured using the Lindau-Neher technique (Lindau & Neher, 1988). For this, the software lock-in extension of the Pulse Software (v 8.53) of an EPC-9 amplifier (HEKA Elektronik, Lamprecht/Pfalz, Germany) was used in ‘sine+dc’ mode. A 1 kHz sinusoidal voltage with a peak-to-peak amplitude of 70 mV was superimposed on a DC holding potential of −70 mV. Currents were filtered at 3 kHz and sampled at 11.5 kHz. Stimulation of exocytosis was achieved by membrane depolarization (with series resistance compensation to more than 80%) or by UV photolysis of the Ca2+ cage nitrophenyl-EGTA either by using UV light from a monochromator (Polychrome IV, TILL Photonics) or from a UV flash lamp (JML-C2; Rapp Optoelectronics), both controlled by the Pulse Software and triggered by the EPC-9.
Experiments were performed using a Zeiss Axiovert 10 (Carl Zeiss, Inc.) with a 40× Fluar objective (Carl Zeiss, Inc.). For Ca2+-measurements, dyes were excited at 350 and 380 nm, the illumination area was restricted to the cell. Emitted light was detected in an area around the cell, restricted by a View Finder (Till Photonics) by a photo diode (Till Photonics). The output of the photo diode was connected to an auxilliary input channel on the EPC-9 amplifier. The signal was filtered at 3 kHz and sampled at 11.5 kHz.
In order to be able to accurately measure absolute Ca2+-concentrations from the 100 nanomolar range at rest to the micromolar rage where exocytosis is triggered, we relied on a mixture of higher and lower affinity dyes. This requires the determination of the parameters of a calibration curve, which is a modified version of the Grynkiewicz equation (Grynkiewicz et al, 1985; Voets, 2000). For this purpose, chromaffin cells were patched with pipette solutions that contained the dye mix with Ca2+ buffered to known concentrations by BAPTA (Invitrogen) or 1,3-Diamino-2-hydroxy-propane-N,N,N′,N′-tetraacetic acid (DPTA; Sigma-Aldrich). The free Ca2+-concentrations in these solutions were calculated using a custom-written macro for IGOR Pro (Wavemetrics), assuming a KD of 0.222 μM for BAPTA and of 80 μM for DPTA while taking into account the additional buffering of Ca2+ by the dyes, nitrophenyl-EGTA, and ATP.
For capacitance measurements, the patch pipette solution contained (in mM) 100 Cs-glutamate, 8 NaCl, 4 CaCl2, 32 HEPES, 2 Mg-ATP, 0.3 NaGTP, 5 nitrophenyl-EGTA, 1 ascorbic acid (to prevent photo damage to the Ca2+-dyes), 0.4 fura-4f (Invitrogen), 0.4 furaptra (Invitrogen), adjusted to pH 7.2 with CsOH. This lead to a resting Ca2+-concentration of 700–900 nM, which is desirable for Ca2+-uncaging experiments because it causes maximal vesicle priming (Voets, 2000). For depolarization experiments, we wanted to investigate the role of vti1a at lower, more physiological conditions. This was achieved by not adding CaCl2. These experiments were also performed in the absence of nitrophenyl-EGTA and had a resting Ca2+ concentration of 60–80 nM. All intracellular solutions had an osmolarity of approximately 300 mOsm. The bath solution contained (in mM) 145 NaCl, 2.8 KCl, 2 CaCl2, 1 MgCl2, 10 HEPES, 11.1 glucose, adjusted to pH 7.2 with NaOH. The solution had an osmolarity of approximately 305 mOsm.
For Ca2+-channel analysis, the patch pipettes solution contained (in mM) 112.5 Cs-glutamate, 9 NaCl, 36 HEPES, 3 MgATP, 0.45 Na2GTP, 10 EGTA, 0.2 fura-2. The bath solution contained (in mM) 135 NaCl, 2.8 KCl, 10 BaCl2, 1 MgCl2, 10 HEPES, 11 glucose and 1 μM TTX adjusted to pH 7.2 with NaOH. The solution had an osmolarity of approximately 305 mOsm. Liquid junction potentials were not adjusted for.
Statistical analysis
Data are represented as mean ± SEM, with n denoting the number of cells, and statistical analysis was performed using two-tailed t-tests if not noted otherwise in the text; *P < 0.05, **P < 0.01, ***P < 0.001.
Acknowledgments
Super-resolution 3D-SIM images were obtained at the Center for Advanced Imaging (CAB), University of Copenhagen. This work was supported by EMBO (Long-term Fellowship to AMW), the Netherlands Organization for Scientific Research, NWO (MEERVOUD-836.10.002 to HdW), the European Union Seventh Framework Programme under grant agreements FP7-People-ITN-2008-238055 (‘BrainTrain'to HdW) and HEALTH-F2-2009-242167 (‘SynSys’ project to MV and JBS), the Novo Nordisk Foundation (JBS), and the Lundbeck Foundation (Junior Group Leader Fellowship, JBS).
Author contributions
AMW, JK, HdW, SS, TLT, JL, IZ, ANW carried out and analyzed experiments, AMW, AS, GFvM, MV, JBS designed experiments, AMW and JBS wrote the manuscript with input from all authors.
Conflict of interest
The authors declare that they have no conflict of interest.
Supplementary information for this article is available online: http://emboj.embopress.org
References
- Advani RJ, Bae HR, Bock JB, Chao DS, Doung YC, Prekeris R, Yoo JS, Scheller RH. Seven novel mammalian SNARE proteins localize to distinct membrane compartments. J Biol Chem. 1998;273:10317–10324. doi: 10.1074/jbc.273.17.10317. [DOI] [PubMed] [Google Scholar]
- Ahras M, Otto GP, Tooze SA. Synaptotagmin IV is necessary for the maturation of secretory granules in PC12 cells. J Cell Biol. 2006;173:241–251. doi: 10.1083/jcb.200506163. [DOI] [PMC free article] [PubMed] [Google Scholar]
- Antonin W, Holroyd C, Fasshauer D, Pabst S, Von Mollard GF, Jahn R. A SNARE complex mediating fusion of late endosomes defines conserved properties of SNARE structure and function. EMBO J. 2000a;19:6453–6464. doi: 10.1093/emboj/19.23.6453. [DOI] [PMC free article] [PubMed] [Google Scholar]
- Antonin W, Riedel D, von Mollard GF. The SNARE Vti1a-beta is localized to small synaptic vesicles and participates in a novel SNARE complex. J Neurosci. 2000b;20:5724–5732. doi: 10.1523/JNEUROSCI.20-15-05724.2000. [DOI] [PMC free article] [PubMed] [Google Scholar]
- Antonin W, Fasshauer D, Becker S, Jahn R, Schneider TR. Crystal structure of the endosomal SNARE complex reveals common structural principles of all SNAREs. Nat Struct Biol. 2002;9:107–111. doi: 10.1038/nsb746. [DOI] [PubMed] [Google Scholar]
- Atlashkin V, Kreykenbohm V, Eskelinen EL, Wenzel D, Fayyazi A, Fischer von Mollard G. Deletion of the SNARE vti1b in mice results in the loss of a single SNARE partner, syntaxin 8. Mol Cell Biol. 2003;23:5198–5207. doi: 10.1128/MCB.23.15.5198-5207.2003. [DOI] [PMC free article] [PubMed] [Google Scholar]
- Bock JB, Klumperman J, Davanger S, Scheller RH. Syntaxin 6 functions in trans-Golgi network vesicle trafficking. Mol Biol Cell. 1997;8:1261–1271. doi: 10.1091/mbc.8.7.1261. [DOI] [PMC free article] [PubMed] [Google Scholar]
- Borisovska M, Zhao Y, Tsytsyura Y, Glyvuk N, Takamori S, Matti U, Rettig J, Sudhof T, Bruns D. v-SNAREs control exocytosis of vesicles from priming to fusion. EMBO J. 2005;24:2114–2126. doi: 10.1038/sj.emboj.7600696. [DOI] [PMC free article] [PubMed] [Google Scholar]
- Bose A, Guilherme A, Huang S, Hubbard AC, Lane CR, Soriano NA, Czech MP. The v-SNARE Vti1a regulates insulin-stimulated glucose transport and Acrp30 secretion in 3T3-L1 adipocytes. J Biol Chem. 2005;280:36946–36951. doi: 10.1074/jbc.M508317200. [DOI] [PubMed] [Google Scholar]
- Brandhorst D, Zwilling D, Rizzoli SO, Lippert U, Lang T, Jahn R. Homotypic fusion of early endosomes: SNAREs do not determine fusion specificity. Proc Natl Acad Sci USA. 2006;103:2701–2706. doi: 10.1073/pnas.0511138103. [DOI] [PMC free article] [PubMed] [Google Scholar]
- Bruns D. Detection of transmitter release with carbon fiber electrodes. Methods. 2004;33:312–321. doi: 10.1016/j.ymeth.2004.01.004. [DOI] [PubMed] [Google Scholar]
- Burgoyne RD, Morgan A. Secretory granule exocytosis. Physiol Rev. 2003;83:581–632. doi: 10.1152/physrev.00031.2002. [DOI] [PubMed] [Google Scholar]
- Cao M, Mao Z, Kam C, Xiao N, Cao X, Shen C, Cheng KK, Xu A, Lee KM, Jiang L, Xia J. PICK1 and ICA69 control insulin granule trafficking and their deficiencies lead to impaired glucose tolerance. PLoS Biol. 2013;11:e1001541. doi: 10.1371/journal.pbio.1001541. [DOI] [PMC free article] [PubMed] [Google Scholar]
- Deak F, Shin OH, Kavalali ET, Sudhof TC. Structural determinants of synaptobrevin 2 function in synaptic vesicle fusion. J Neurosci. 2006;26:6668–6676. doi: 10.1523/JNEUROSCI.5272-05.2006. [DOI] [PMC free article] [PubMed] [Google Scholar]
- Dean C, Liu H, Dunning FM, Chang PY, Jackson MB, Chapman ER. Synaptotagmin-IV modulates synaptic function and long-term potentiation by regulating BDNF release. Nat Neurosci. 2009;12:767–776. doi: 10.1038/nn.2315. [DOI] [PMC free article] [PubMed] [Google Scholar]
- Duncan RR, Greaves J, Wiegand UK, Matskevich I, Bodammer G, Apps DK, Shipston MJ, Chow RH. Functional and spatial segregation of secretory vesicle pools according to vesicle age. Nature. 2003;422:176–180. doi: 10.1038/nature01389. [DOI] [PubMed] [Google Scholar]
- Fasshauer D, Sutton RB, Brunger AT, Jahn R. Conserved structural features of the synaptic fusion complex: SNARE proteins reclassified as Q- and R-SNAREs. Proc Natl Acad Sci USA. 1998;95:15781–15786. doi: 10.1073/pnas.95.26.15781. [DOI] [PMC free article] [PubMed] [Google Scholar]
- Fenwick EM, Marty A, Neher E. Sodium and calcium channels in bovine chromaffin cells. J Physiol. 1982;331:599–635. doi: 10.1113/jphysiol.1982.sp014394. [DOI] [PMC free article] [PubMed] [Google Scholar]
- Fischer von Mollard G, Stevens TH. A human homolog can functionally replace the yeast vesicle-associated SNARE Vti1p in two vesicle transport pathways. J Biol Chem. 1998;273:2624–2630. doi: 10.1074/jbc.273.5.2624. [DOI] [PubMed] [Google Scholar]
- Flowerdew SE, Burgoyne RD. A VAMP7/Vti1a SNARE complex distinguishes a non-conventional traffic route to the cell surface used by KChIP1 and Kv4 potassium channels. Biochem J. 2009;418:529–540. doi: 10.1042/BJ20081736. [DOI] [PMC free article] [PubMed] [Google Scholar]
- Ganley IG, Espinosa E, Pfeffer SR. A syntaxin 10-SNARE complex distinguishes two distinct transport routes from endosomes to the trans-Golgi in human cells. J Cell Biol. 2008;180:159–172. doi: 10.1083/jcb.200707136. [DOI] [PMC free article] [PubMed] [Google Scholar]
- Grynkiewicz G, Poenie M, Tsien RY. A new generation of Ca2+ indicators with greatly improved fluorescence properties. J Biol Chem. 1985;260:3440–3450. [PubMed] [Google Scholar]
- Holst B, Madsen KL, Jansen AM, Jin C, Rickhag M, Lund VK, Jensen M, Bhatia V, Sorensen G, Madsen AN, Xue Z, Moller SK, Woldbye D, Qvortrup K, Huganir R, Stamou D, Kjaerulff O, Gether U. PICK1 deficiency impairs secretory vesicle biogenesis and leads to growth retardation and decreased glucose tolerance. PLoS Biol. 2013;11:e1001542. doi: 10.1371/journal.pbio.1001542. [DOI] [PMC free article] [PubMed] [Google Scholar]
- Hoopmann P, Punge A, Barysch SV, Westphal V, Buckers J, Opazo F, Bethani I, Lauterbach MA, Hell SW, Rizzoli SO. Endosomal sorting of readily releasable synaptic vesicles. Proc Natl Acad Sci USA. 2010;107:19055–19060. doi: 10.1073/pnas.1007037107. [DOI] [PMC free article] [PubMed] [Google Scholar]
- Hua Y, Sinha R, Thiel CS, Schmidt R, Huve J, Martens H, Hell SW, Egner A, Klingauf J. A readily retrievable pool of synaptic vesicles. Nat Neurosci. 2011;14:833–839. doi: 10.1038/nn.2838. [DOI] [PubMed] [Google Scholar]
- Jahn R, Scheller RH. SNAREs–engines for membrane fusion. Nat Rev Mol Cell Biol. 2006;7:631–643. doi: 10.1038/nrm2002. [DOI] [PubMed] [Google Scholar]
- Kawanishi M, Tamori Y, Okazawa H, Araki S, Shinoda H, Kasuga M. Role of SNAP23 in insulin-induced translocation of GLUT4 in 3T3-L1 adipocytes. Mediation of complex formation between syntaxin4 and VAMP2. J Biol Chem. 2000;275:8240–8247. doi: 10.1074/jbc.275.11.8240. [DOI] [PubMed] [Google Scholar]
- Klumperman J, Kuliawat R, Griffith JM, Geuze HJ, Arvan P. Mannose 6-phosphate receptors are sorted from immature secretory granules via adaptor protein AP-1, clathrin, and syntaxin 6-positive vesicles. J Cell Biol. 1998;141:359–371. doi: 10.1083/jcb.141.2.359. [DOI] [PMC free article] [PubMed] [Google Scholar]
- Kreykenbohm V, Wenzel D, Antonin W, Atlachkine V, von Mollard GF. The SNAREs vti1a and vti1b have distinct localization and SNARE complex partners. Eur J Cell Biol. 2002;81:273–280. doi: 10.1078/0171-9335-00247. [DOI] [PubMed] [Google Scholar]
- Kuliawat R, Kalinina E, Bock J, Fricker L, McGraw TE, Kim SR, Zhong J, Scheller R, Arvan P. Syntaxin-6 SNARE involvement in secretory and endocytic pathways of cultured pancreatic beta-cells. Mol Biol Cell. 2004;15:1690–1701. doi: 10.1091/mbc.E03-08-0554. [DOI] [PMC free article] [PubMed] [Google Scholar]
- Kunwar AJ, Rickmann M, Backofen B, Browski SM, Rosenbusch J, Schoning S, Fleischmann T, Krieglstein K, Fischer von Mollard G. Lack of the endosomal SNAREs vti1a and vti1b led to significant impairments in neuronal development. Proc Natl Acad Sci USA. 2011;108:2575–2580. doi: 10.1073/pnas.1013891108. [DOI] [PMC free article] [PubMed] [Google Scholar]
- Lindau M, Neher E. Patch-clamp techniques for time-resolved capacitance measurements in single cells. Pflugers Arch. 1988;411:137–146. doi: 10.1007/BF00582306. [DOI] [PubMed] [Google Scholar]
- Liu Y, Schirra C, Stevens DR, Matti U, Speidel D, Hof D, Bruns D, Brose N, Rettig J. CAPS facilitates filling of the rapidly releasable pool of large dense-core vesicles. J Neurosci. 2008;28:5594–5601. doi: 10.1523/JNEUROSCI.5672-07.2008. [DOI] [PMC free article] [PubMed] [Google Scholar]
- Lupashin VV, Pokrovskaya ID, McNew JA, Waters MG. Characterization of a novel yeast SNARE protein implicated in Golgi retrograde traffic. Mol Biol Cell. 1997;8:2659–2676. doi: 10.1091/mbc.8.12.2659. [DOI] [PMC free article] [PubMed] [Google Scholar]
- Mallard F, Tang BL, Galli T, Tenza D, Saint-Pol A, Yue X, Antony C, Hong W, Goud B, Johannes L. Early/recycling endosomes-to-TGN transport involves two SNARE complexes and a Rab6 isoform. J Cell Biol. 2002;156:653–664. doi: 10.1083/jcb.200110081. [DOI] [PMC free article] [PubMed] [Google Scholar]
- Medigeshi GR, Schu P. Characterization of the in vitro retrograde transport of MPR46. Traffic. 2003;4:802–811. doi: 10.1034/j.1600-0854.2003.00136.x. [DOI] [PubMed] [Google Scholar]
- Mohrmann R, de Wit H, Connell E, Pinheiro PS, Leese C, Bruns D, Davletov B, Verhage M, Sorensen JB. Synaptotagmin interaction with SNAP-25 governs vesicle docking, priming, and fusion triggering. J Neurosci. 2013;33:14417–14430. doi: 10.1523/JNEUROSCI.1236-13.2013. [DOI] [PMC free article] [PubMed] [Google Scholar]
- von Mollard GF, Nothwehr SF, Stevens TH. The yeast v-SNARE Vti1p mediates two vesicle transport pathways through interactions with the t-SNAREs Sed5p and Pep12p. J Cell Biol. 1997;137:1511–1524. doi: 10.1083/jcb.137.7.1511. [DOI] [PMC free article] [PubMed] [Google Scholar]
- Nagy G, Kim JH, Pang ZP, Matti U, Rettig J, Sudhof TC, Sorensen JB. Different effects on fast exocytosis induced by synaptotagmin 1 and 2 isoforms and abundance but not by phosphorylation. J Neurosci. 2006;26:632–643. doi: 10.1523/JNEUROSCI.2589-05.2006. [DOI] [PMC free article] [PubMed] [Google Scholar]
- Pryor PR, Mullock BM, Bright NA, Lindsay MR, Gray SR, Richardson SC, Stewart A, James DE, Piper RC, Luzio JP. Combinatorial SNARE complexes with VAMP7 or VAMP8 define different late endocytic fusion events. EMBO Rep. 2004;5:590–595. doi: 10.1038/sj.embor.7400150. [DOI] [PMC free article] [PubMed] [Google Scholar]
- Raingo J, Khvotchev M, Liu P, Darios F, Li YC, Ramirez DM, Adachi M, Lemieux P, Toth K, Davletov B, Kavalali ET. VAMP4 directs synaptic vesicles to a pool that selectively maintains asynchronous neurotransmission. Nat Neurosci. 2012;15:738–745. doi: 10.1038/nn.3067. [DOI] [PMC free article] [PubMed] [Google Scholar]
- Ramirez DM, Khvotchev M, Trauterman B, Kavalali ET. Vti1a identifies a vesicle pool that preferentially recycles at rest and maintains spontaneous neurotransmission. Neuron. 2012;73:121–134. doi: 10.1016/j.neuron.2011.10.034. [DOI] [PMC free article] [PubMed] [Google Scholar]
- Rettig J, Neher E. Emerging roles of presynaptic proteins in Ca++-triggered exocytosis. Science. 2002;298:781–785. doi: 10.1126/science.1075375. [DOI] [PubMed] [Google Scholar]
- Schermelleh L, Heintzmann R, Leonhardt H. A guide to super-resolution fluorescence microscopy. J Cell Biol. 2010;190:165–175. doi: 10.1083/jcb.201002018. [DOI] [PMC free article] [PubMed] [Google Scholar]
- Schulte A, Chow RH. A simple method for insulating carbon-fiber microelectrodes using anodic electrophoretic deposition of paint. Anal Chem. 1996;68:3054–3058. doi: 10.1021/ac960210n. [DOI] [PubMed] [Google Scholar]
- Shewan AM, van Dam EM, Martin S, Luen TB, Hong W, Bryant NJ, James DE. GLUT4 recycles via a trans-Golgi network (TGN) subdomain enriched in Syntaxins 6 and 16 but not TGN38: involvement of an acidic targeting motif. Mol Biol Cell. 2003;14:973–986. doi: 10.1091/mbc.E02-06-0315. [DOI] [PMC free article] [PubMed] [Google Scholar]
- Sorensen JB, Matti U, Wei SH, Nehring RB, Voets T, Ashery U, Binz T, Neher E, Rettig J. The SNARE protein SNAP-25 is linked to fast calcium triggering of exocytosis. Proc Natl Acad Sci USA. 2002;99:1627–1632. doi: 10.1073/pnas.251673298. [DOI] [PMC free article] [PubMed] [Google Scholar]
- Sorensen JB, Fernandez-Chacon R, Sudhof TC, Neher E. Examining synaptotagmin 1 function in dense core vesicle exocytosis under direct control of Ca2+ J Gen Physiol. 2003a;122:265–276. doi: 10.1085/jgp.200308855. [DOI] [PMC free article] [PubMed] [Google Scholar]
- Sorensen JB, Nagy G, Varoqueaux F, Nehring RB, Brose N, Wilson MC, Neher E. Differential control of the releasable vesicle pools by SNAP-25 splice variants and SNAP-23. Cell. 2003b;114:75–86. doi: 10.1016/s0092-8674(03)00477-x. [DOI] [PubMed] [Google Scholar]
- Sudhof TC. The synaptic vesicle cycle. Annu Rev Neurosci. 2004;27:509–547. doi: 10.1146/annurev.neuro.26.041002.131412. [DOI] [PubMed] [Google Scholar]
- Sudhof TC, Rothman JE. Membrane fusion: grappling with SNARE and SM proteins. Science. 2009;323:474–477. doi: 10.1126/science.1161748. [DOI] [PMC free article] [PubMed] [Google Scholar]
- Sutton RB, Fasshauer D, Jahn R, Brunger AT. Crystal structure of a SNARE complex involved in synaptic exocytosis at 2.4 A resolution. Nature. 1998;395:347–353. doi: 10.1038/26412. [DOI] [PubMed] [Google Scholar]
- Tian JH, Wu ZX, Unzicker M, Lu L, Cai Q, Li C, Schirra C, Matti U, Stevens D, Deng C, Rettig J, Sheng ZH. The role of Snapin in neurosecretion: snapin knock-out mice exhibit impaired calcium-dependent exocytosis of large dense-core vesicles in chromaffin cells. J Neurosci. 2005;25:10546–10555. doi: 10.1523/JNEUROSCI.3275-05.2005. [DOI] [PMC free article] [PubMed] [Google Scholar]
- Toonen RF, Kochubey O, de Wit H, Gulyas-Kovacs A, Konijnenburg B, Sorensen JB, Klingauf J, Verhage M. Dissecting docking and tethering of secretory vesicles at the target membrane. EMBO J. 2006;25:3725–3737. doi: 10.1038/sj.emboj.7601256. [DOI] [PMC free article] [PubMed] [Google Scholar]
- Voets T, Neher E, Moser T. Mechanisms underlying phasic and sustained secretion in chromaffin cells from mouse adrenal slices. Neuron. 1999;23:607–615. doi: 10.1016/s0896-6273(00)80812-0. [DOI] [PubMed] [Google Scholar]
- Voets T. Dissection of three Ca2+-dependent steps leading to secretion in chromaffin cells from mouse adrenal slices. Neuron. 2000;28:537–545. doi: 10.1016/s0896-6273(00)00131-8. [DOI] [PubMed] [Google Scholar]
- Voets T, Toonen RF, Brian EC, de Wit H, Moser T, Rettig J, Sudhof TC, Neher E, Verhage M. Munc18-1 promotes large dense-core vesicle docking. Neuron. 2001;31:581–591. doi: 10.1016/s0896-6273(01)00391-9. [DOI] [PubMed] [Google Scholar]
- Walter AM, Wiederhold K, Bruns D, Fasshauer D, Sorensen JB. Synaptobrevin N-terminally bound to syntaxin-SNAP-25 defines the primed vesicle state in regulated exocytosis. J Cell Biol. 2010;188:401–413. doi: 10.1083/jcb.200907018. [DOI] [PMC free article] [PubMed] [Google Scholar]
- Weber JP, Reim K, Sorensen JB. Opposing functions of two sub-domains of the SNARE-complex in neurotransmission. EMBO J. 2010;29:2477–2490. doi: 10.1038/emboj.2010.130. [DOI] [PMC free article] [PubMed] [Google Scholar]
- Wendler F, Page L, Urbe S, Tooze SA. Homotypic fusion of immature secretory granules during maturation requires syntaxin 6. Mol Biol Cell. 2001;12:1699–1709. doi: 10.1091/mbc.12.6.1699. [DOI] [PMC free article] [PubMed] [Google Scholar]
- Williams D, Pessin JE. Mapping of R-SNARE function at distinct intracellular GLUT4 trafficking steps in adipocytes. J Cell Biol. 2008;180:375–387. doi: 10.1083/jcb.200709108. [DOI] [PMC free article] [PubMed] [Google Scholar]
- de Wit H, Cornelisse LN, Toonen RF, Verhage M. Docking of secretory vesicles is syntaxin dependent. PLoS ONE. 2006;1:e126. doi: 10.1371/journal.pone.0000126. [DOI] [PMC free article] [PubMed] [Google Scholar]
- de Wit H, Walter AM, Milosevic I, Gulyas-Kovacs A, Riedel D, Sorensen JB, Verhage M. Synaptotagmin-1 docks secretory vesicles to syntaxin-1/SNAP-25 acceptor complexes. Cell. 2009;138:935–946. doi: 10.1016/j.cell.2009.07.027. [DOI] [PubMed] [Google Scholar]
- Zwilling D, Cypionka A, Pohl WH, Fasshauer D, Walla PJ, Wahl MC, Jahn R. Early endosomal SNAREs form a structurally conserved SNARE complex and fuse liposomes with multiple topologies. EMBO J. 2007;26:9–18. doi: 10.1038/sj.emboj.7601467. [DOI] [PMC free article] [PubMed] [Google Scholar]
Associated Data
This section collects any data citations, data availability statements, or supplementary materials included in this article.