

Abstract
N-cadherin-mediated adhesion is essential for maintaining the tissue architecture and stem cell niche in the developing neocortex. N-cadherin expression level is precisely and dynamically controlled throughout development; however, the underlying regulatory mechanisms remain largely unknown. MicroRNAs (miRNAs) play an important role in the regulation of protein expression and subcellular localisation. In this study, we show that three miRNAs belonging to the miR379–410 cluster regulate N-cadherin expression levels in neural stem cells and migrating neurons. The overexpression of these three miRNAs in radial glial cells repressed N-cadherin expression and increased neural stem cell differentiation and neuronal migration. This phenotype was rescued when N-cadherin was expressed from a miRNA-insensitive construct. Transient abrogation of the miRNAs reduced stem cell differentiation and increased cell proliferation. The overexpression of these miRNAs specifically in newborn neurons delayed migration into the cortical plate, whereas the knockdown increased migration. Collectively, our results indicate a novel role for miRNAs of the miR379–410 cluster in the fine-tuning of N-cadherin expression level and in the regulation of neurogenesis and neuronal migration in the developing neocortex.
Keywords: microRNAs, N-cadherin, neural differentiation, neural migration
Introduction
Mammalian neocortical development is characterised by the differentiation of ventricular zone (VZ) neural stem cells into neurons that migrate from the VZ into the cortical plate (CP). These neurons migrate towards the pial surface of the neocortex to reach their final position just below the marginal zone (MZ) (Noctor et al, 2004; Gotz & Huttner, 2005; Cooper, 2008). Most radial glial cells (RGCs) differentiate into neurons indirectly via intermediate progenitor cells (IPCs). IPCs reside in the subventricular zone (SVZ) and divide symmetrically to produce either two neurons or two IPCs. After leaving the cell cycle, newborn neurons become multipolar and appear to migrate in a random motion (multipolar migration) within the SVZ and lower intermediate zone (IZ) (Tabata & Nakajima, 2003; LoTurco & Bai, 2006). In the IZ, neurons acquire a bipolar morphology characterised by a short trailing process and a long leading process that extends towards the CP. In the bipolar stage, neurons migrate radially by intertwining their leading process along RGCs processes (Noctor et al, 2004).
Radial glial cells, derived from neuroepithelial cells, retain some epithelial characteristics and are tightly interconnected by N-cadherin (Ncad)-mediated apical adherens junctions (AJ) (Hatta & Takeichi, 1986; Hatta et al, 1987; Gumbiner, 1996; Takeichi, 2007). Ncad is a type I cadherin that mediates calcium-dependent cell adhesion (Takeichi, 1995). The conditional knockout of Ncad in the developing neocortex results in the disorganisation of the tissue and internal structures of the cortex (Kadowaki et al, 2007). Furthermore, Ncad regulates the proliferation of RGCs by activating β-catenin signalling (Zhang et al, 2010).
In addition to RGC proliferation, Ncad regulates neuronal migration in the developing neocortex by mediating the interaction between migrating neurons and RGC fibres (Shikanai et al, 2011). Ncad is also crucial for polarising post-mitotic neurons (Gartner et al, 2012). It is clear that Ncad levels must be precisely regulated to achieve RGC differentiation, and during neuronal migration so that neurons reach their specific layer in the CP. Changes in the Ncad expression level result in neuronal differentiation (Zhang et al, 2010) and migration defects (Kawauchi et al, 2010; Zhang et al, 2010; Franco et al, 2011; Jossin & Cooper, 2011; Shikanai et al, 2011).
Recently, miRNA-mediated regulation of Ncad has been shown to be highly important for the suppression of tumour metastasis in vitro (Meng et al, 2010) and in vivo (Gao et al, 2013). miRNAs are short, non-coding RNAs of approximately 22 bases. They are synthesised in the nucleus as immature pre-miRNAs and exported to the cytoplasm where they are processed by Dicer to mature miRNAs and associate with the RISC silencing complex. This complex recognises portions of the 3′ untranslated region (3′UTR) in the target messenger RNAs (mRNAs), and this recognition results in either the degradation of the mRNA or the inhibition of its translation. miRNAs bind their target mRNAs through multiple imperfect base pairings. The complementarity of the so-called seed sequence, which comprises nucleotides 2–8, is largely responsible for determining the specificity of target recognition (Kim & Nam, 2006; Bartel, 2009). Several compelling studies indicate that miRNAs play important roles during mammalian brain development. miR134, a miRNA belonging to the miR379–410 cluster, promotes cell proliferation, reduces cell migration in vivo (Gaughwin et al, 2011) and negatively regulates the size of dendritic spines in vitro (Schratt et al, 2006; Fiore et al, 2009).
Even though it is widely accepted that the level of cell surface Ncad must be precisely regulated to ensure proper neurogenesis and neuronal migration, the underlying regulatory mechanisms are poorly understood. The aim of this study was to investigate the regulation of Ncad expression by miRNAs; therefore, we made use of an in vivo approach to show that at least three miRNAs belonging to the miR379–410 cluster are essential for proper mammalian neocortical development. miR369-3p, miR496 and miR543 bind directly to the 3′UTR of the Ncad transcript and fine-tune the expression level of Ncad in VZ progenitors and migrating neurons and control neuronal differentiation and migration. Additionally, miR369-3p regulates expression of Adam10 and TrappC8 during development of the neocortex, which suggests a regulatory network of this miRNA cluster.
Results
miRNAs belonging to the miR379–410 cluster are expressed in neural progenitors and neurons in the developing neocortex
Using the prediction softwares Targetscan, Miranda and PicTar, we identified 21 candidate miRNAs that were predicted to bind to conserved target sequences in the Ncad 3′UTR (Supplementary Table S2). Interestingly, five of the predicted miRNAs, namely miR329, miR369-3p, miR495, miR496 and miR543, belong to the miR379–410 cluster, which is conserved in mammals and located on chromosome 12 in mice. Other members of the miR379–410 cluster have been reported to be expressed in the central nervous system and to be essential for neurogenesis and neuronal function (Fiore et al, 2009; Christensen et al, 2010; Gao et al, 2010; Gaughwin et al, 2011). Thus, the miRNAs belonging to the miR379–410 cluster appear to be promising candidates for regulating Ncad expression in the developing brain. Therefore, we focused on these miRNAs for the remainder of this study.
We found that miR369-3p, miR495, miR496 and miR543 are present in the developing forebrain at high levels at embryonic day E13.5 and that their expression levels decrease later during embryonic development (Fig 1A). Notably, miR543 is approximately fifteen times more abundant than miR369-3p, miR495 and miR496 at E15.5 (Fig 1B). miR329 was not included in these analyses because we could not confirm the regulation of Ncad expression by this miRNA in subsequent experiments (data not shown).
Figure 1. miRNAs belonging to the miR379–410 cluster are expressed in cortical progenitors and neurons.
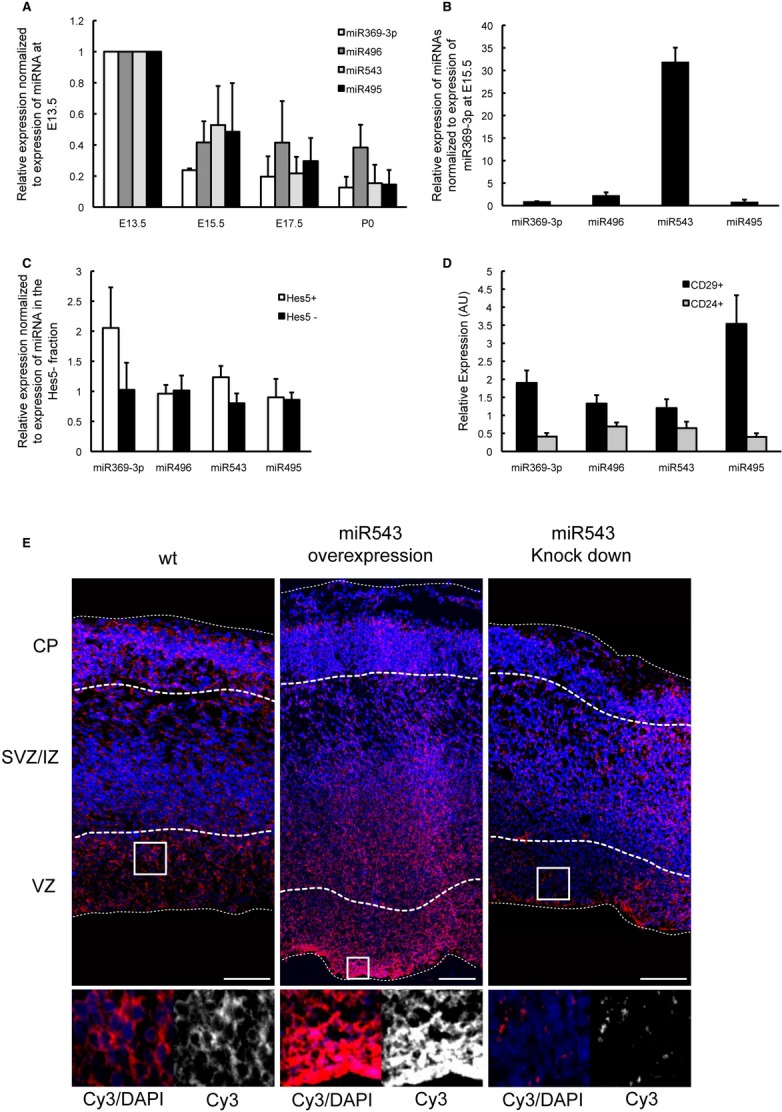
A, B The forebrains were collected at the indicated developmental stages. Small RNAs were extracted and subjected to qRT–PCR using specific primers that recognise mature miRNAs. The relative expression levels of the miRNAs normalised to their expression in the forebrain at E13.5 are shown in (A). The relative expression levels of the miRNAs normalised to the expression of miR369-3p at E15.5 are shown in (B). At E15.5, miR543 is fifteen times more abundant than miR369-3p, miR495 and miR496 in the developing forebrain.
C The forebrains of Hes5::GFP transgenic mice were collected, and single-cell suspensions were prepared and fluorescence-activated cell sorting (FACS)-sorted to isolate the GFP+ and GFP− cell fractions. The relative expression levels of the miRNAs in Hes5+ (GFP+) and Hes5− (GFP−) fractions are shown.
D The forebrains of E15.5 mice were collected, and single-cell suspensions were stained for CD29 and CD24 followed by FACS sorting. Small RNAs were isolated and subjected to qRT–PCR.
E In situ hybridisation was conducted to detect mature miR543. A miR543-specific locked nucleic acid (LNA) probe was hybridised on cryosections of E15.5 wt brains and E15.5 brains that had undergone in utero electroporation at E13.5 with either a pcDNA3.1-pre-miR543 construct or anti-miR543 LNAs. Images of the boxed regions are shown at a higher magnification. Scale bars, 100 μm. VZ: ventricular zone. SVZ/IZ, subventricular zone, intermediate zone; CP, cortical plate.
To determine which specific cell populations express the miR379–410 cluster miRNAs, we isolated Notch signalling neural progenitors from transgenic mice that express GFP under the control of the Hes5 regulatory elements (Basak & Taylor, 2007). We sorted GFP+ and GFP− cells from E15.5 embryos, isolated the small RNAs and performed specific qRT–PCR for four of the miR379–410 cluster miRNAs. Whereas the expression level of miR369-3p is approximately twofold higher in the neural progenitors (GFP+) compared with the differentiated cell populations (GFP−), miR495, miR496 and miR543 are expressed at approximately the same level in the neural progenitor and more differentiated cell (GFP−) populations (Fig 1C). Presumably, the more differentiated cell (GFP−) population represents a mixture of various cell types including Hes5− neural progenitors, IPCs and neurons. Similar to what has been described for the human neural lineage (Pruszak et al, 2009), we and others found that neural progenitors specifically express CD29, whereas neurons express CD24 (Supplementary Fig 1C; http://www.genepaint.org). To test whether the four miR379–410 cluster miRNAs are also expressed by neurons, in addition to neural progenitors, we made use of these surface markers to fluorescence-activated cell sorting (FACS)-sort neural precursor cells and differentiating neurons from E15.5 embryos. To confirm the specificity of the sorting, we analysed the fractions for the expression of the three nuclear markers Pax6 (RGCs), Tbr2 (IPCs) and Tbr1 (neurons) (Supplementary Fig S1A). We observed that all four miR379–410 cluster miRNAs are expressed in the neural precursor cell population as well as in the neuronal cell population; however, expression in neurons is lower than in precursors (Fig 1D). To further confirm these results, we took neocortical cells from E15.5 embryos into culture under either non-differentiating or differentiating conditions. In agreement with the in vivo data, we found a higher expression of all four miR379–410 cluster miRNAs in neural precursors than in neurons in vitro (Supplementary Fig S1B).
To further study the expression of miR543, the most abundant of the four miR379–410 cluster miRNAs in the developing forebrain, we performed in situ hybridisation on E13.5, E15.5 and E17.5 brain slices using a probe that specifically detects mature miR543. Consistent with the qRT–PCR results, we detected miR543 expression by neural progenitors (in the VZ), as well as by differentiating neurons (in the CP). In the IZ, which is mainly composed of migrating newborn neurons, miR543 expression is weaker but still detectable (Fig 1E, Supplementary Fig S1D). To determine the specificity of the in situ hybridisation signal, we used a scramble probe (Supplementary Fig S1D). Moreover, we overexpressed or knocked down the expression of miR543 in the developing neocortex by the in utero electroporation (Tabata & Nakajima, 2001). As expected, miR543 overexpression enhanced the in situ hybridisation signal, and miR543 depletion significantly decreased the signal (Fig 1E).
Taken together, these results show that miR369-3p, miR495, miR496 and miR543 are expressed in the neural progenitors and differentiating neurons of the developing neocortex, which suggests that these miRNAs may play important roles in multiple neurogenic processes.
miRNAs belonging to the miR379–410 cluster interact directly with the Ncad 3′UTR
To test for the direct binding of the predicted miRNAs to the Ncad 3′UTR, we performed luciferase reporter assays. The pGL3P reporter plasmid carrying the Ncad 3′UTR downstream of the firefly luciferase cDNA was co-transfected with the pcDNA3.1 vector expressing one of the 21 candidate miRNAs and the pRL vector containing the Renilla luciferase cDNA for normalisation. It was previously shown that one of the 21 candidate miRNAs, miR194-1, binds directly to Ncad 3′UTR, downregulating its expression in vitro and in vivo (Meng et al, 2010), and therefore, we used this as a positive control. Interestingly, three out of the five miR379–410 cluster miRNAs significantly downregulate the reporter gene expression compared with the empty vector control (Fig 2A). Quantitative RT-PCR confirmed the expression of all five miR379–410 cluster miRNAs at comparable levels (Supplementary Fig 2A). The overexpression of miR369-3p and miR496 decreases the luciferase expression level by approximately 50% comparable to the known Ncad regulator miR194-1. The overexpression of miR543 decreases reporter expression by approximately 35%. No significant decrease in reporter expression is observed following overexpression of miR495 (Fig 2A). Therefore, we used miR495 as a negative control in the remainder of the study. Additionally, overexpression of miR499 or miR129-1 also significantly decreases reporter expression (data not shown).
Figure 2. miRNAs belonging to the miR379–410 cluster regulate Ncad expression by binding directly to the Ncad 3′ untranslated region (UTR).

A–C Luciferase reporter assays were performed in HEK-293 cells. The entire Ncad 3′UTR was cloned into the pGL3P promoter vector. Pre-miRNA sequences were cloned into the pcDNA3.1 vector. Forty-eight hours after transfection, the cells were harvested, and the luciferase activity was measured. For normalisation, a Renilla luciferase plasmid was co-transfected (n = 4; ns, not significant; *P < 0.05; **P < 0.01; ***P < 0.001; ##P < 0.01). Three miRNAs belonging to the miR379–410 cluster significantly downregulated the luciferase activity (A). Direct interaction of miRNAs with the Ncad 3′UTR (B). The seed sequences of the miRNAs (miR seed mut) or the predicted binding sites within the Ncad 3′UTR (3′UTR site mut) were replaced with the corresponding complementary sequences by in vitro mutagenesis. The co-transfection of two miRNAs belonging to this cluster has an additive effect that decreases the reporter activity even more when compared with the transfections of single miRNAs (C).
D One week after transfecting with the indicated miRNA construct and selecting with G418, the NIH3T3 cells were lysed and subjected to immunoblot analysis using an Ncad-specific antibody. Bands were quantified using ImageJ software. Normalised intensity to GAPDH is plotted (n = 4; ns, not significant; **P < 0.01; ***P < 0.001).
To determine whether there is a direct interaction between the miRNAs and the Ncad 3′UTR, we replaced the miRNA seed sequence within the corresponding pcDNA3.1-pre-miRNA construct and the predicted miRNA binding sites within the pGL3P-Ncad-3′UTR construct with the corresponding complementary sequences (Supplementary Fig S2B). It is predicted that miR194-1 and miR543 bind to two different sites in the Ncad 3′UTR, and therefore, these sites were mutated separately. Mutation of either the seed sequence or the predicted binding sites abolishes reporter activity (Fig 2B). These results indicate that there is a direct interaction between these miRNAs and the Ncad 3′UTR.
The miRNAs, which are encoded in a genomic cluster, may be co-expressed in vivo. Therefore, these miRNAs may independently or cooperatively bind to their targets and act in a synergistic or additive manner. To determine whether the miRNAs belonging to the miR379–410 cluster act in this manner to regulate the Ncad expression level, we co-transfected different combinations of two of the three miRNAs and carried out the reporter assays. We found that the reporter activity is downregulated by approximately 70% when miR369-3p and miR496 are co-expressed (Fig 2C). These results suggest that this pair has an additive effect.
To determine whether miR369-3p, miR496 and miR543 downregulate the endogenous expression of Ncad, we overexpressed them in NIH3T3 fibroblasts and carried out an immunoblot analysis using specific antibodies. The overexpression of each miRNA significantly decreases the Ncad protein level compared with the overexpression of non-functional miRNAs containing mutations in their seed sequences, or the pcDNA empty vector (Fig 2D).
miR369-3p, miR496 and miR543 downregulate Ncad expression in vivo in the developing neocortex
To study the miRNA-dependent regulation of Ncad expression in the developing neocortex in vivo, we overexpressed or abrogated miR369-3p, miR496 and miR543 expression in RGCs in vivo. We co-expressed the miRNAs with pCAG-mCherry vector to identify transfected cells. We found that the overexpression of miR543 results in a reduction in Ncad protein, which is only evident in the areas containing transfected cells, but not in the adjacent areas (Supplementary Fig S3A and B). However, changes in Ncad expression are not detected when miR369-3p or miR496 is overexpressed (data not shown), suggesting that the overexpression of these two miRNAs alone is not sufficient for significant downregulation of the Ncad protein level in vivo. Nonetheless, the co-expression of miR369-3p with miR496 significantly reduces Ncad protein levels in the developing neocortex, supporting our earlier findings that specific pairs of these miRNAs have an additive effect (Fig 3A and B).
Figure 3. miR369-3p, miR496 and miR543 downregulate Ncad expression in the developing neocortex in vivo.

A, B Forty-eight hours after electroporating the brain tissue at E13.5, the brains were fixed, sectioned and subjected to immunostaining experiments with an Ncad- or PKCζ-specific antibody. The simultaneous overexpression of miR369-3p and miR496 downregulates the Ncad protein level, and the co-expression of an HA-tagged Ncad lacking its endogenous 3′ untranslated region (UTR) rescues this effect. Ventricular surfaces are shown at 40× magnification. Scale bars, 50 μm. Insets are indicated in dashed boxes in the original pictures. The bar graph in (B) shows the mean fluorescence intensity calculated from pictures of independent experiments for each treatment using the ZEN2010 software (Zeiss) (n = 4; ns, not significant; *P < 0.05).
C The simultaneous overexpression of miR369-3p and miR496 disrupts the AJ, as evidenced by the loss of the PKCζ protein, and the co-expression of an HA-tagged Ncad lacking its endogenous 3′UTR rescues this effect. Cortices are shown at 10× magnification. Scale bars, 50 μm.
D Quantification of the PKCζ intensity in the electroporated area is shown.
E, F Brains were electroporated with anti-miRs locked nucleic acids (LNAs) control (Anti-scr) against miR369-3p (Anti-369-3p), miR496 (Anti-496), miR543 (Anti-543) or all three together (Anti-miRs). Forty-eight hours later, the electroporated regions were micro-dissected and small RNAs or total mRNA was isolated. qRT–PCR that detects specifically mature miRNAs was conducted to determine the knockdown efficiency (E). qRT–PCR was performed to determine Ncad mRNA abundance (F). Data were normalised to HPRT expression.
G–K Knockdown of all three miRNAs, miR369-3p, miR496 and miR543, increases the Ncad protein level. Forty-eight hours after the electroporation of anti-miR control LNAs (Anti-scr) or anti-miR LNAs against miR369-3p, miR496 and miR543 (Anti-miRs), the brains were fixed, sectioned and subjected to immunohistochemistry with an Ncad-specific antibody. Ventricular surfaces are shown at 40 × magnification. Scale bars, 50 μm (G). Images of the VZ of electroporated brains stained for Ncad were subjected to 2.5D projection using the ZEN2010 software (Zeiss) (H). The mean fluorescence intensity was calculated from pictures of independent experiments for each treatment as in (G) using the ZEN2010 software (Zeiss) (n = 4; *P < 0.05) (I). Forty-eight hours after the electroporation of Anti-scr or Anti-miRs, the electroporated regions were micro-dissected and single-cell suspensions were stained for cell surface Ncad and analysed by fluorescence-activated cell sorting. The overexpression of Ncad served as a positive control (NcadHA) (J). The mean fluorescence intensity was calculated using the FlowJo software (Tree Star) (K) (n = 5; *P < 0.05; **P < 0.01).
The overexpression of miR543 alone or miR369-3p with miR496 severely disrupts the RGC AJs and results in the disorganisation of the developing neocortex (Supplementary Fig S3A and B). The lack of PKCζ staining, a polarity complex protein, at the apical membrane and the lower β-catenin level at the membrane of transfected cells confirmed disruption of the ventricular surface (Fig 3C and D, Supplementary Fig S3C and D). These results phenocopy the loss of Ncad (Kadowaki et al, 2007). Furthermore, this phenotype is rescued by expressing an exogenous HA-tagged Ncad that lacks the 3′UTR and is therefore resistant to miRNA-mediated regulation (Fig 3A–D, Supplementary Fig S3A–D). Anti-HA immunostaining confirmed that all transfected cells expressed the HA-Ncad rescue vector (Supplementary Fig S3E). Taken together, these results indicate that the disruption of the AJs at the ventricular surface is caused by the downregulation of Ncad and that Ncad is a primary target of miR543, miR369-3p and miR496 in the developing neocortex.
To test whether the endogenous miR369-3p, miR496 and miR543 regulate the expression of Ncad in the developing neocortex, we knocked down these miRNAs using commercially available anti-miRs locked nucleic acids (LNAs; GeneCopoeia) co-electroporated with pCAG-mCherry reporter construct. We confirmed that the LNAs can effectively downregulate the expression of the three miRNAs, by micro-dissecting the electroporated regions of the brains, isolating the small RNAs and performing qRT–PCR. We detected a miRNA knockdown efficiency of 65% to 70%. We used expression of miR495 as a specificity control (Fig 3E). Total mRNA was also isolated from the electroporated brain regions. Ncad mRNA levels do not change when miR369-3p, miR496 or miR543 is knocked down individually. Nevertheless, when all three miRNAs are knocked down simultaneously, levels of Ncad mRNA are significantly increased by 40% (Fig 3F). We used equal amounts of scramble LNA and control for the double or triple miRNA knockdown.
Immunostaining for Ncad confirmed these results. Only when all three miRNAs (miR369-3p, miR496 and miR543) are knocked down simultaneously is Ncad protein expression significantly increased compared with the scrambled control (Fig 3G–I).
To confirm our results, we performed FACS analysis to examine the surface expression of Ncad by mCherry+, miRNA-expressing cells using single-cell suspensions prepared from electroporated brains. Knockdown of all three miRNAs results in a significant increase of approximately 40% in the Ncad cell surface expression compared with the scrambled LNA control (Fig 3J and K). Overexpression of Ncad served as a positive control (Fig 3J and K). Next, we investigated which cell populations in the developing neocortex upregulated Ncad expression as a result of miRNA knockdown. Immunostaining showed an enhanced Ncad level mainly in the VZ, suggesting that the cell populations in this region are more affected by the miRNA knockdown (Fig 4A). A thorough analysis of the transfected areas of neocortex revealed that the electroporated cells with enhanced Ncad staining are Tbr2− putative progenitors, suggesting that Tbr2+ IPCs are not affected by the miRNA knockdown (Fig 4B). To analyse which cell populations upregulated Ncad expression as a result of miRNA knockdown in more detail, we performed FACS analysis of four different cell populations (RGCs, IPCs, newborn migrating neurons in the IZ and neurons in the CP) that were identified based on the expression of the nuclear markers Pax6 (RGCs), Tbr2 (IPCs), NeuroD1 (IZ neurons) and Tbr1 (CP neurons) (Englund et al, 2005). The depletion of each miRNA individually does not significantly affect Ncad expression (Supplementary Fig S4A and B), but the depletion of miR369-3p with miR496 and the depletion of all three miRNAs (miR369-3p, miR496 and miR543) simultaneously significantly upregulate the amount of Ncad at the cell surface in RGCs and IZ neurons, but not in IPCs or CP neurons (Fig 4C and D), as evidenced by the peak shift towards higher Ncad intensity. In summary, these results suggest that miR369-3p, miR496 and miR543 regulate Ncad expression mainly in the RGCs and migrating IZ neurons, but not in the IPCs or CP neurons of the developing neocortex, and that there is a partial redundancy in function and cooperation among these miRNAs.
Figure 4. miRNA knockdown increases the expression of Ncad at the cell surface in radial glial cells (RGCs) and IZ neurons, but not intermediate progenitor cells (IPCs) or cortical plate neurons.

A, B Forty-eight hours after electroporation of LNAs, brains were fixed, sectioned and subjected to immunostaining experiments with Ncad- and Tbr2-specific antibodies. Enhanced Ncad staining is more evident in the VZ within the electroporated region (red arrowhead) (A). Dashed box inset is shown in (B). Co-staining of Ncad and Tbr2 reveals higher Ncad intensity in Tbr2− electroporated cells than in Tbr2+ electroporated cells in the VZ (B). Insets are indicated in the original picture as dashed boxes. Scale bar, 50 μm.
C, D Forty-eight hours after electroporation, the electroporated regions were micro-dissected and single-cell suspensions were stained for cell surface Ncad. The cells were then fixed and stained for the nuclear markers Pax6 (RGCs), Tbr2 (IPCs) and Tbr1 (neurons). Profiles of Ncad intensity in the different cell populations are shown in (C). Histogram shows the average mean fluorescence intensity (D) (n = 4; *P < 0.05, **P < 0.01). Anti-scr, scrambled control; Anti-2miR, simultaneous knockdown of miR369-3p and miR496; Anti-3miR, simultaneous knockdown of miR369-3p, miR496 and miR543.
miR369-3p, miR496 and miR543 regulate neuronal differentiation in vivo
To determine whether miR369-3p, miR496 and miR543 regulate RGC proliferation and neuronal differentiation, we transfected RGCs in the mouse brain with miRNA overexpression constructs or anti-miR LNAs at E13.5 by in utero electroporation. Electroporated brains were analysed at E15.5 by immunostaining with antibodies against markers for RGCs (Pax6), IPCs (Tbr2) and differentiated neurons (Tbr1) (Englund et al, 2005).
The overexpression of miR543 or miR369-3p with miR496 results in premature neuronal differentiation, as shown by a significant decrease in Pax6+ RGCs and an increase in Tbr1+ neurons (Supplementary Fig S5, Fig 5A and B). Furthermore, co-electroporation of the plasmid encoding the HA-tagged Ncad without its endogenous 3′UTR at a low concentration rescues this differentiation phenotype (Fig 5A and B, Supplementary Fig S5). There is no evidence of increased apoptosis after miRNA overexpression (Supplementary Fig S6A).
Figure 5. miR379–410 cluster miRNAs regulate neuronal differentiation.

A, B Simultaneously overexpressing miR369-3p and miR496 results in early neuronal differentiation. miRNA expression constructs were co-electroporated with pCAG-eGFP at E13.5. Forty-eight hours later, the electroporated brains were analysed. Images double immunostained for GFP (green) and markers (red) for radial glial cells (RGCs) (Pax6), intermediate progenitor cells (Tbr2) and neurons (Tbr1) illustrate that miR369-3p and miR496 induce neuronal differentiation. The co-expression of an HA-tagged Ncad rescues this early differentiation phenotype. Images next to the respective immunostaining images show visual representations where all electroporated cells that also express Pax6, Tbr2 or Tbr1 are labelled red, while all electroporated cells that do not express Pax6, Tbr2 or Tbr1 are labelled white (A). Histogram showing the percentage of GFP+ Pax6+, GFP+ Tbr2+ and GFP+ Tbr1+ cells over the total population of GFP+ electroporated cells is given (B). Higher magnification images show a representative region of the VZ (Pax6+) and of the cortical plate (CP) (Tbr1+). Arrows indicate electroporated cells that express the respective marker. Scale bars: 50 μm for images at the left, 20 μm for magnified images (B).
C, D Knockdown of miR369-3p, miR496 and miR543 results in a decrease in cell differentiation. Anti-miR locked nucleic acids were co-electroporated with pCAG-mCherry at E13.5. The electroporated brains were analysed 48 h later. Immunostaining (green) for Pax6, Tbr2 and Tbr1 is shown. mCherry is shown in red. Representative pictures illustrating the delay in neuronal differentiation after knockdown of miR369-3p, miR496 and miR543. Overexpressing the HA-tagged Ncad results in a similar delay in cell differentiation. Scale bars: 50 μm (C). The histogram shows the percentage of mCherry+ Pax6+, mCherry+ Tbr2+ and mCherry+ Tbr1+ cells over the total population of mCherry+ cells. Higher magnification images show representative regions of the VZ (Pax6+) and the CP (Tbr1+). Arrows indicate those electroporated cells that express the respective marker. Scale bars: 50 μm for images at the left, 20 μm for magnified images (D).
The knockdown of the individual miRNAs did not result in significant changes in the proliferation or differentiation of RGCs (Supplementary Fig S6B). However, when miR369-3p, miR496 and miR543 are knocked down simultaneously, neuronal differentiation is significantly reduced at the time of analysis (Fig 5C and D), suggesting a redundant function of these three miRNAs. Furthermore, there is a significant increase in apical but not basal mitoses—which suggests an increase in RGC, but not IPC proliferation (Supplementary Fig S6C and D)—in agreement with the FACS results that show higher Ncad levels in RGCs, but not in IPCs. We observe similar effects when we overexpress Ncad. Taken together, these results indicate that by fine-tuning Ncad levels, miR369-3p, miR496 and miR543 regulate cell proliferation and differentiation.
miRNAs belonging to the miR379–410 cluster regulate neuronal migration in vivo
Because we observed that miR369-3p, miR496 and miR543 were also expressed in differentiating neurons (Fig 1C and D), we investigated whether these miRNAs regulate neuronal migration, in addition to neuronal differentiation.
We overexpress miR543 or miR369-3p with miR496 at E13.5 and analyse the distribution of electroporated cells 2 days later. We find an increase in the migration of cells out of the VZ, which we can rescue by expressing low amounts of the HA-tagged Ncad lacking the endogenous 3′UTR (Supplementary Fig S7A, Fig 6A). Conversely, the simultaneous knockdown of all three miRNAs results in a decreased migration of cells out of the VZ, which is phenocopied by overexpressing the HA-tagged Ncad (Fig 6A).
Figure 6. miR379–410 miRNAs regulate neuronal migration.
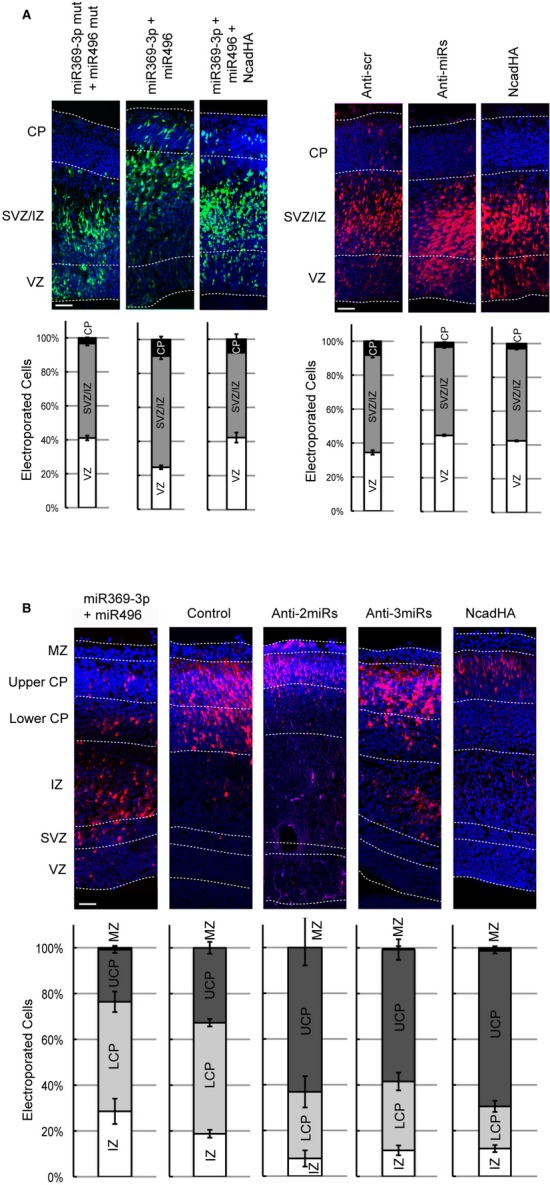
- The brains were electroporated at E13.5 and analysed at E15.5. miR369-3p and miR496 constructs were co-electroporated with pCAG-eGFP. The histograms show the percentage of GFP+ cells in each cortical area. miRNAs vs. mut miRNAs χ2 = 66.21, P < 0.001, miRNAs vs. miRNAs rescued with NcadHA χ2 = 80.61, P < 0.001 (mut miRNAs n = 3 brains, 1165 cells; miRNAs n = 4 brains, 1155 cells; miRNAs + NcadHA rescue n = 3 brains, 1031 cells). Knockdown of miR369-3p, miR496 and miR543 delays the cell migration towards the CP. Anti-miR locked nucleic acids (LNAs) were co-electroporated with pCAG-mCherry. The histograms show the percentage of mCherry+ cells in each cortical area. Scrambled control (Anti-scr) vs. anti-miR LNAs (Anti-miRs) χ2 = 49.83, P < 0.001, Anti-scr vs. NcadHA χ2 = 52.21, P < 0.001 (Anti-scr n = 4 brains, 1187 cells; Anti-miRs n = 4 brains, 1520 cells; NcadHA n = 4 brains, 1307 cells). Scale bars, 50 μm.
- The overexpression of miR369-3p with miR496 delays migration, whereas the knockdown of miR369-3p, miR496 and miR543 together enhances migration during later developmental stages. The overexpression of NcadHA under the control of the NeuroD1 promoter phenocopies the miRNA knockdown phenotype. The brains were electroporated at E13.5 with pNeuroD1-mCherry, pNeuroD1-miR369-3p and pNeuroD1-miR496, pNeuroD1-mCherry and the anti-miR LNAs or with pNeuroD1-mCherry and pNeuroD1-NcadHA as indicated, and analysed at E17.5. The electroporation of pNeuroD1-pre-miRNAs mutated in the seed sequence was used as a control. The histograms show the percentage of mCherry+ cells in each cortical area. Control vs. miR369-3p + miR496 χ2 = 88.21 P < 0.001, control vs. Anti-2miRs χ2 = 133.0, P < 0.001, control vs. Anti-3miRs χ2 = 97.15, P < 0.001, control vs. NcadHA χ2 = 229.6, P < 0.001 (control n = 6 brains, 1435 cells; miR369-3p + miR496 n = 7 brains, 1007 cells; Anti-2miRs n = 3 brains, 558 cells; Anti-3miRs n = 5 brains, 1112 cells; NcadHA n = 5 brains, 726 cells). Scale bar, 50 μm.
Data information: Images result from merging two different pictures of the same tissue sample. VZ, ventricular zone; SVZ/IZ, subventricular zone, intermediate zone; CP, cortical plate; MZ, marginal zone.
However, these migrational changes may be a secondary effect resulting from the differentiation defects previously described in our results. In addition, they may reflect changes in radial glia-independent VZ to IZ migration. To further investigate the relationship between the differentiation and migration defects and to analyse potential changes in radial glia-dependent migration from the IZ to the CP, we overexpressed the three miRNAs and the mCherry reporter under the control of the NeuroD1 promoter, which is active in newborn neurons, but not RGCs at E13.5, and analysed the distribution of the transfected cells at E17.5.
Although the overexpression of each miRNA has no effect, co-expression of miR369-3p and miR496 results in fewer cells migrating into the upper cortical plate (UCP) and more cells remaining in the lower cortical plate (LCP) and IZ (Supplementary Fig S7B and Fig 6B). Conversely, when miR369-3p with miR496 (Anti-2miR), or these together with miR543 (Anti-3miR) are knocked down simultaneously, more transfected cells migrate into the UCP and fewer electroporated cells migrate into the LCP. Of note, the overexpression of Ncad from the NeuroD1 promoter phenocopies this phenotype (Fig 6B). Furthermore, the migrating neurons appeared to have morphological abnormalities. We observed a higher proportion of rounded cells in the SVZ and a higher proportion of migrating neurons with branched leading processes in the CP compared with the scrambled control at E15.5. Additionally, the leading processes appear to be thicker at E17.5 when the expression of all three miRNAs was knocked down (Supplementary Fig S7C–E).
Taken together, these results suggest that miR369-3p, miR496 and miR543 regulate neuronal migration and that Ncad is an important target of these miRNAs in migrating neurons. This is in agreement with the previous results showing enhanced Ncad expression levels in NeuroD1+ cells (Fig 4C and D). Notwithstanding, we cannot rule out the possibility that the effects on migration and morphology of differentiating neurons could be caused by a misregulation of not only Ncad, but also other as yet to be identified miRNA targets.
Additional targets are only regulated in their expression by individual miRNAs, but not by miR369-3p, miR496 and miR543 together
miRNAs typically regulate the expression of numerous targets. Phenotypes that arise upon interfering with the expression of particular miRNAs might be a consequence of the misregulation of several of these targets. With an in silico approach, we identified 16 putative targets that were predicted to be regulated by at least two of the miRNAs (Supplementary Table S3). Of these, only genes with a known expression pattern in the developing neocortex were chosen for further analysis, namely Adam10, TrappC8, Cxadr, Pax6, PlxnA2 and Mbnl1.
The 3′UTRs of the selected target genes were cloned downstream of the Firefly luciferase gene in the pGL3P vector, and reporter assays were performed. Overexpression of miR369-3p significantly decreased luciferase expression of vectors containing the 3′UTRs of Adam10, a metalloprotease that regulates Ncad turnover on the cell surface (Reiss et al, 2005), PlxnA2, a receptor of the semaphorin signalling pathway that plays a role in neuronal migration (Renaud et al, 2008), and TrappC8, a member of the endocytic pathway trafficking complex (Zong et al, 2011). This was not the case, however, when miR496 or miR543 was overexpressed (Supplementary Fig S8A). To confirm the regulation of these targets in vivo in the developing neocortex, we micro-dissected brains electroporated with LNAs against each of the miRNAs and carried out qRT–PCR experiments. Only the knockdown of miR-369-3p significantly increased the expression of Adam10 and TrappC8, but not that of PlxnA2 (Supplementary Fig S8B).
In contrast to the simultaneous overexpression or knockdown of miR369-3p and miR496 in newborn neurons or RGCs, the overexpression or knockdown of miR369-3p alone in the respective cell population did not cause a neuronal migration defect or differentiation effect (Supplementary Fig S8C and data not shown). Together, these results suggest that the neuronal migration phenotype we observed upon the simultaneous knockdown or overexpression of miR369-3p, miR496 and miR543 in newborn neurons might not be caused primarily by changes in the expression of Adam10, PlxnA2 and TrappC8. Nevertheless, other targets of these miRNAs may also play a role during neuronal migration.
Discussion
In the developing neocortex, Ncad plays important roles, such as maintaining the tissue architecture and regulating neural stem cell proliferation, neuronal differentiation and neuronal migration. For the correct execution of all of these processes, the level of Ncad must be precisely regulated. Recently, it has been shown that Ncad activity is controlled by endocytosis and the Reelin pathway in migrating neurons, but much less is known about the transcriptional and post-transcriptional regulation of Ncad expression (Kawauchi et al, 2010; Franco et al, 2011; Jossin & Cooper, 2011). In this study, we show that three miRNAs belonging to the miR379–410 cluster, miR369-3p, miR496 and miR543, fine-tune the expression level of Ncad in the developing neocortex and regulate neural stem cell proliferation and neurogenesis as well as neuronal migration.
Similar to Ncad, these three miRNAs are expressed throughout the neocortex during development. They are expressed in neural stem cells and differentiating neurons, and their expression levels are higher during early developmental stages and lower during the late developmental stages. The overlapping expression patterns of Ncad and its regulatory miRNAs indicate that these do not function by turning Ncad expression on and off. Rather, our results suggest that miRNAs from the miR379–410 cluster form a regulatory network that keep the Ncad expression level within a physiological range that allows for proper neuronal differentiation and migration. Several studies highlight the importance of an accurate expression level in the developing neocortex. In the VZ, maintenance of the stem cell niche is achieved through adhesion-dependent β-catenin signalling. In this previous study, an insufficient Ncad level, generated by an shRNA-mediated knockdown technique, resulted in an increased number of cells exiting the cell cycle and premature neuronal differentiation (Zhang et al, 2010). In our study, overexpression of the three miR379–410 cluster miRNAs produces a phenotype similar to the premature neuronal differentiation described previously. More importantly, this phenotype can be rescued by co-expression of an Ncad variant that is resistant to miRNA-mediated regulation. On the other hand, the simultaneous knockdown of miR369-3p and miR496 or all three of these miRNAs results in an increase in the amount of Ncad at the cell surface of RGCs, an increase in RGC proliferation and a reduction in neuronal differentiation. This suggests that miR369-3p, miR496 and miR543 regulate RGCs proliferation and differentiation by repressing Ncad expression and that fine-tuned Ncad levels are required for proper neurogenesis to occur.
In previous studies, different effects on the migratory behaviour of newborn neurons were observed depending on the developmental stage and the specific cell type in which Ncad expression had been reduced. Zhang et al showed that neuronal migration increased 30 h after an shRNA inhibiting Ncad expression was expressed in RGCs, an effect we also observe 48 h after we overexpressed miR543 or miR369-3p together with miR496. This increase in neuronal migration may be a consequence of a premature exit from the cell cycle and premature neuronal differentiation. In contrast, when miR369-3p and miR496 were overexpressed together under the control of the NeuroD1 promoter, neuronal migration was impaired 4 days after electroporation. Specifically downregulating the Ncad expression level in migrating neurons may possibly delay the migration of neurons because of adhesion defects. Conversely, knocking down the expression of the miRNAs resulted in an increase in migration at later stages with a higher proportion of neurons migrating to the upper cortical plate. Overexpressing Ncad specifically in newborn neurons phenocopied this effect. These apparently opposite findings may be the result of the different functions of Ncad in different cell populations. While in RGCs it is required for stem cells niche maintenance, in migrating neurons it is required for motility of the cell towards the CP. Also, the different modes of migration that are affected may play a role. While the overexpression of the miRNAs in RGCs predominantly affects glia-independent VZ to IZ migration, the specific overexpression in newborn neurons affects glia-dependent migration into the CP. However, the regulation of different sets of targets of these miRNAs in RGCs versus migrating neurons cannot be ruled out.
It is widely accepted that miRNAs regulate the expression of numerous targets. Therefore, Ncad might not be the only target that is regulated in its expression by miR369-3p, miR496 and miR543. In this study, we identify two more targets of miR369-3p, namely Adam10 and TrappC8. None of these targets, however, is in addition regulated by one of the other two miRNAs. The sole action of miR369-3p seems to be insufficient to affect neuronal differentiation or migration in vivo. Nevertheless, changes in expression of these targets, together with other targets of miR496 yet to be identified, and in addition to changes in the expression of Ncad, might contribute to the neuronal differentiation and migration defects observed upon the simultaneous knockdown or overexpression of miR369-3p and miR496.
In contrast to Drosha- and Dicer-knockout studies, which showed no effect on RGCs proliferation, the knockdown of the three miRNAs of the miR379–410 cluster in our study enhanced RGCs proliferation (De Pietri Tonelli et al, 2008; Knuckles et al, 2012). This discrepancy might be due to the fact that mature miRNAs have been shown to be very stable in the developing neocortex (Knuckles et al, 2012). Therefore, a genetic depletion of components of the miRNA-processing machinery might not be as effective as a knockdown approach targeting mature miRNAs. However, it might as well be that compensatory mechanisms are activated in a genetic knockout but not in a system such as the in utero electroporation technique, which targets only a subset of cells.
The miR379–410 cluster, located within the Gtl2/Dlk1 locus, is composed of more than 50 miRNAs (Khudayberdiev et al, 2009), which are expressed in the developing and adult brain (Seitz et al, 2004). Three of these miR379–410 cluster miRNAs (miR134, miR329 and miR381) are necessary for activity-dependent dendritogenesis (Fiore et al, 2009), and miR134 negatively regulates the dendritic-spine size in hippocampal neurons (Schratt et al, 2006). During embryonic development, miR134 regulates neural stem cell proliferation and neuronal migration by repressing the expression of chordin-like 1 and doublecortin (Gaughwin et al, 2011). Taken together with our study, these results suggest that the miR379–410 cluster forms a large regulatory network that controls different aspects of neuronal development and function. Because the cluster encodes more miRNAs than the ones that have been currently investigated, other miRNAs belonging to this cluster may have additional functions that have not yet been identified. Future studies investigating which of these miR379–410 cluster miRNAs are necessary for specific aspects of neuronal development and function and which targets they regulate will be of great interest in this field.
Materials and Methods
Animals
Hes5::GFP mice have been described elsewhere (Basak & Taylor, 2007). All mice were on a C57BL/6J background and 8–12 weeks old. The mice were maintained on a 12-h day/night cycle with adequate food and water under specific pathogen-free conditions. They were treated according to Max Planck Institutional and German Federal regulations under licence numbers 0-06/02 and G-09/18 (Ethical Commission Freiburg, Germany).
In utero electroporation
In utero electroporation was performed exactly as described elsewhere (Knuckles et al, 2012). A brief description of the in utero electroporation experiments as well as plasmid and antibody information are given in Supplementary Materials and Methods.
Cell culture, reporter assays and immunoblot experiments
Neurons were cultured in neurobasal medium supplemented with 10% B27 and 200 μM of l-glutamine. Neural precursor cells were cultured in the same medium with the addition of 100 μg/ml of EGF and 100 μg/ml of FGF.
HEK-293 and NIH3T3 cells were cultured in DMEM supplemented with 10% FCS, 1% non-essential amino acids, 15 mM HEPES, 10 units/ml of penicillin and 10 μg/ml of streptomycin. For luciferase assays, 2.5 × 10⁴ cells/well were seeded and transfected with 100 ng of the constructs cloned in pGL3P vector, 20 ng of the pRL control vector and 200 ng of the pcDNA3.1-pre-miRNA plasmid using the calcium-phosphate method. After 48 h, the cells were lysed, and the enzymatic activity was analysed using a Centro LB 960 luminometer (Berthold Technologies).
For immunoblot analysis, NIH3T3 cells were transfected with Lipofectamine 2000 (Invitrogen) according to the manufacturer's instructions. After 1 week of selection with G418, the cells were lysed. Thirty micrograms of protein was resolved by electrophoresis on SDS–10% acrylamide gels. The gels were blotted on PVDF membranes, and Western blot analyses were performed with an antibody directed against Ncad (BD Transduction Laboratories). For normalisation, an antibody against GAPDH (Santa Cruz Biotechnology) was used. Quantification of the bands was performed with ImageJ and normalised to GAPDH band intensity. Plasmids and constructs are listed in Supplementary Materials and Methods. Primer sequences are given in Supplementary Table S1.
Real-time RT–PCR
Mice were sacrificed by cervical dislocation, and the embryos were collected. Embryonic brains were dissected, and the cortices were isolated. The tissue was homogenised using an Ultra-Turrax T25 homogeniser (IKA Labortechnik). Small RNAs were isolated using the miRPremier microRNA Isolation Kit, and total mRNA was isolated using the High Pure RNA Isolation Kit (Roche) according to the manufacturer's instructions.
Real-time RT–PCR experiments for miRNAs were performed using the TaqMan MicroRNA Assays (Applied Biosystems) according to the manufacturer's instructions. All miRNA quantities are relative to U6 snRNA.
In situ hybridisation and immunohistochemistry
For in situ hybridisation, the commercially available miR543 and scramble LNA probes, which are 5′-3′DIG labelled, were purchased from Exiqon. In situ hybridisation was performed on frozen brain sections using the EDC method as previously described (Pena et al, 2009). For immunohistochemistry, brains were dissected, fixed, cryosectioned and stained with the respective antibodies.
Fluorescence-activated cell sorting
For cell population sorting, E15.5 forebrains were homogenised and single-cell suspensions incubated with commercially available anti-CD29 (BD Transduction Laboratories) and anti-CD24 (Santa Cruz Biotechnology) antibodies for 1 h on ice. A secondary antibody (anti-rat-Alexa594, Invitrogen) was used to detect CD29.
Electroporated brains were dissected, and the tissue was disrupted. For cell surface Ncad staining, living cells were incubated in a mouse anti-Ncad antibody (BD Transduction Laboratories), fixed, permeabilised and incubated in the indicated primary and secondary antibodies (primary: rabbit anti-Pax6, rabbit anti-Tbr1, rabbit anti-Tbr2 from Abcam; secondary: anti-mouse-Alexa488, anti-rabbit-Cy5, Invitrogen). FACS analysis was performed with a LSR II Cytometer (BD) immediately after treatment.
Statistics
All statistical analyses were performed with Prism (GraphPad Softwares). For reporter assays, qRT–PCR experiments, mean fluorescence intensity plots and cell counting in the electroporated brains, treatments were compared with controls using Student's t-test. For the statistics on the cell distribution for the electroporated brains, a contingency test followed by a chi-squared test was applied. All the samples were tested for normality and equal variances, and correction tests were performed when necessary. All bar graphs represent mean + s.e.m.
Acknowledgments
We thank M.-J. Tsai for providing the pBS-Beta2 plasmid. We are grateful to R. Kemler for helpful discussions and for critically reading the manuscript. L.R. was a PhD student of the International Max Planck Research School Molecular and Cellular Biology and of the Faculty of Biology, University of Freiburg. This work was supported by the Swiss National Science Foundation and the SystemsX.ch project NeuroStemX (V.T.)
Author contribution
LR wrote the manuscript, conceived or designed the experiments, performed the experiments and analysed the data. RB performed the experiments. VT designed the experiments. JW wrote the manuscript and conceived or designed the experiments.
Conflict of interest
The authors declare that they have no conflict of interest.
Supplementary information for this article is available online: http://emboj.embopress.org
References
- Bartel DP. MicroRNAs: target recognition and regulatory functions. Cell. 2009;136:215–233. doi: 10.1016/j.cell.2009.01.002. [DOI] [PMC free article] [PubMed] [Google Scholar]
- Basak O, Taylor V. Identification of self-replicating multipotent progenitors in the embryonic nervous system by high Notch activity and Hes5 expression. Eur J Neurosci. 2007;25:1006–1022. doi: 10.1111/j.1460-9568.2007.05370.x. [DOI] [PubMed] [Google Scholar]
- Christensen M, Larsen LA, Kauppinen S, Schratt G. Recombinant adeno-associated virus-mediated microRNA delivery into the postnatal mouse brain reveals a role for mir-134 in dendritogenesis in vivo. Front Neural Circuits. 2010;3:16. doi: 10.3389/neuro.04.016.2009. [DOI] [PMC free article] [PubMed] [Google Scholar]
- Cooper JA. A mechanism for inside-out lamination in the neocortex. Trends Neurosci. 2008;31:113–119. doi: 10.1016/j.tins.2007.12.003. [DOI] [PubMed] [Google Scholar]
- De Pietri Tonelli D, Pulvers JN, Haffner C, Murchison EP, Hannon GJ, Huttner WB. miRNAs are essential for survival and differentiation of newborn neurons but not for expansion of neural progenitors during early neurogenesis in the mouse embryonic neocortex. Development. 2008;135:3911–3921. doi: 10.1242/dev.025080. [DOI] [PMC free article] [PubMed] [Google Scholar]
- Englund C, Fink A, Lau C, Pham D, Daza RA, Bulfone A, Kowalczyk T, Hevner RF. Pax6, Tbr2, and Tbr1 are expressed sequentially by radial glia, intermediate progenitor cells, and postmitotic neurons in developing neocortex. J Neurosci. 2005;25:247–251. doi: 10.1523/JNEUROSCI.2899-04.2005. [DOI] [PMC free article] [PubMed] [Google Scholar]
- Fiore R, Khudayberdiev S, Christensen M, Siegel G, Flavell SW, Kim TK, Greenberg ME, Schratt G. Mef2-mediated transcription of the miR379-410 cluster regulates activity-dependent dendritogenesis by fine-tuning Pumilio2 protein levels. EMBO J. 2009;28:697–710. doi: 10.1038/emboj.2009.10. [DOI] [PMC free article] [PubMed] [Google Scholar]
- Franco SJ, Martinez-Garay I, Gil-Sanz C, Harkins-Perry SR, Muller U. Reelin regulates cadherin function via Dab1/Rap1 to control neuronal migration and lamination in the neocortex. Neuron. 2011;69:482–497. doi: 10.1016/j.neuron.2011.01.003. [DOI] [PMC free article] [PubMed] [Google Scholar]
- Gao J, Wang WY, Mao YW, Graff J, Guan JS, Pan L, Mak G, Kim D, Su SC, Tsai LH. A novel pathway regulates memory and plasticity via SIRT1 and miR-134. Nature. 2010;466:1105–1109. doi: 10.1038/nature09271. [DOI] [PMC free article] [PubMed] [Google Scholar]
- Gao P, Xing AY, Zhou GY, Zhang TG, Zhang JP, Gao C, Li H, Shi DB. The molecular mechanism of microRNA-145 to suppress invasion-metastasis cascade in gastric cancer. Oncogene. 2013;32:491–501. doi: 10.1038/onc.2012.61. [DOI] [PubMed] [Google Scholar]
- Gartner A, Fornasiero EF, Munck S, Vennekens K, Seuntjens E, Huttner WB, Valtorta F, Dotti CG. N-cadherin specifies first asymmetry in developing neurons. EMBO J. 2012;31:1893–1903. doi: 10.1038/emboj.2012.41. [DOI] [PMC free article] [PubMed] [Google Scholar]
- Gaughwin P, Ciesla M, Yang H, Lim B, Brundin P. Stage-specific modulation of cortical neuronal development by Mmu-miR-134. Cereb Cortex. 2011;21:1857–1869. doi: 10.1093/cercor/bhq262. [DOI] [PubMed] [Google Scholar]
- Gotz M, Huttner WB. The cell biology of neurogenesis. Nat Rev Mol Cell Biol. 2005;6:777–788. doi: 10.1038/nrm1739. [DOI] [PubMed] [Google Scholar]
- Gumbiner BM. Cell adhesion: the molecular basis of tissue architecture and morphogenesis. Cell. 1996;84:345–357. doi: 10.1016/s0092-8674(00)81279-9. [DOI] [PubMed] [Google Scholar]
- Hatta K, Takagi S, Fujisawa H, Takeichi M. Spatial and temporal expression pattern of N-cadherin cell adhesion molecules correlated with morphogenetic processes of chicken embryos. Dev Biol. 1987;120:215–227. doi: 10.1016/0012-1606(87)90119-9. [DOI] [PubMed] [Google Scholar]
- Hatta K, Takeichi M. Expression of N-cadherin adhesion molecules associated with early morphogenetic events in chick development. Nature. 1986;320:447–449. doi: 10.1038/320447a0. [DOI] [PubMed] [Google Scholar]
- Jossin Y, Cooper JA. Reelin, Rap1 and N-cadherin orient the migration of multipolar neurons in the developing neocortex. Nat Neurosci. 2011;14:697–703. doi: 10.1038/nn.2816. [DOI] [PMC free article] [PubMed] [Google Scholar]
- Kadowaki M, Nakamura S, Machon O, Krauss S, Radice GL, Takeichi M. N-cadherin mediates cortical organization in the mouse brain. Dev Biol. 2007;304:22–33. doi: 10.1016/j.ydbio.2006.12.014. [DOI] [PubMed] [Google Scholar]
- Kawauchi T, Sekine K, Shikanai M, Chihama K, Tomita K, Kubo K, Nakajima K, Nabeshima Y, Hoshino M. Rab GTPases-dependent endocytic pathways regulate neuronal migration and maturation through N-cadherin trafficking. Neuron. 2010;67:588–602. doi: 10.1016/j.neuron.2010.07.007. [DOI] [PubMed] [Google Scholar]
- Khudayberdiev S, Fiore R, Schratt G. MicroRNA as modulators of neuronal responses. Commun Integr Biol. 2009;2:411–413. doi: 10.4161/cib.2.5.8834. [DOI] [PMC free article] [PubMed] [Google Scholar]
- Kim VN, Nam JW. Genomics of microRNA. Trends Genet. 2006;22:165–173. doi: 10.1016/j.tig.2006.01.003. [DOI] [PubMed] [Google Scholar]
- Knuckles P, Vogt MA, Lugert S, Milo M, Chong MM, Hautbergue GM, Wilson SA, Littman DR, Taylor V. Drosha regulates neurogenesis by controlling Neurogenin 2 expression independent of microRNAs. Nat Neurosci. 2012;15:962–969. doi: 10.1038/nn.3139. [DOI] [PubMed] [Google Scholar]
- LoTurco JJ, Bai J. The multipolar stage and disruptions in neuronal migration. Trends Neurosci. 2006;29:407–413. doi: 10.1016/j.tins.2006.05.006. [DOI] [PubMed] [Google Scholar]
- Meng Z, Fu X, Chen X, Zeng S, Tian Y, Jove R, Xu R, Huang W. miR-194 is a marker of hepatic epithelial cells and suppresses metastasis of liver cancer cells in mice. Hepatology. 2010;52:2148–2157. doi: 10.1002/hep.23915. [DOI] [PMC free article] [PubMed] [Google Scholar]
- Noctor SC, Martinez-Cerdeno V, Ivic L, Kriegstein AR. Cortical neurons arise in symmetric and asymmetric division zones and migrate through specific phases. Nat Neurosci. 2004;7:136–144. doi: 10.1038/nn1172. [DOI] [PubMed] [Google Scholar]
- Pena JT, Sohn-Lee C, Rouhanifard SH, Ludwig J, Hafner M, Mihailovic A, Lim C, Holoch D, Berninger P, Zavolan M, Tuschl T. miRNA in situ hybridization in formaldehyde and EDC-fixed tissues. Nat Methods. 2009;6:139–141. doi: 10.1038/nmeth.1294. [DOI] [PMC free article] [PubMed] [Google Scholar]
- Pruszak J, Ludwig W, Blak A, Alavian K, Isacson O. CD15, CD24, and CD29 define a surface biomarker code for neural lineage differentiation of stem cells. Stem Cells. 2009;27:2928–2940. doi: 10.1002/stem.211. [DOI] [PMC free article] [PubMed] [Google Scholar]
- Reiss K, Maretzky T, Ludwig A, Tousseyn T, de Strooper B, Hartmann D, Saftig P. ADAM10 cleavage of N-cadherin and regulation of cell-cell adhesion and beta-catenin nuclear signalling. EMBO J. 2005;24:742–752. doi: 10.1038/sj.emboj.7600548. [DOI] [PMC free article] [PubMed] [Google Scholar]
- Renaud J, Kerjan G, Sumita I, Zagar Y, Georget V, Kim D, Fouquet C, Suda K, Sanbo M, Suto F, Ackerman SL, Mitchell KJ, Fujisawa H, Chedotal A. Plexin-A2 and its ligand, Sema6A, control nucleus-centrosome coupling in migrating granule cells. Nat Neurosci. 2008;11:440–449. doi: 10.1038/nn2064. [DOI] [PubMed] [Google Scholar]
- Schratt GM, Tuebing F, Nigh EA, Kane CG, Sabatini ME, Kiebler M, Greenberg ME. A brain-specific microRNA regulates dendritic spine development. Nature. 2006;439:283–289. doi: 10.1038/nature04367. [DOI] [PubMed] [Google Scholar]
- Seitz H, Royo H, Bortolin ML, Lin SP, Ferguson-Smith AC, Cavaille J. A large imprinted microRNA gene cluster at the mouse Dlk1-Gtl2 domain. Genome Res. 2004;14:1741–1748. doi: 10.1101/gr.2743304. [DOI] [PMC free article] [PubMed] [Google Scholar]
- Shikanai M, Nakajima K, Kawauchi T. N-cadherin regulates radial glial fiber-dependent migration of cortical locomoting neurons. Commun Integr Biol. 2011;4:326–330. doi: 10.4161/cib.4.3.14886. [DOI] [PMC free article] [PubMed] [Google Scholar]
- Tabata H, Nakajima K. Efficient in utero gene transfer system to the developing mouse brain using electroporation: visualization of neuronal migration in the developing cortex. Neuroscience. 2001;103:865–872. doi: 10.1016/s0306-4522(01)00016-1. [DOI] [PubMed] [Google Scholar]
- Tabata H, Nakajima K. Multipolar migration: the third mode of radial neuronal migration in the developing cerebral cortex. J Neurosci. 2003;23:9996–10001. doi: 10.1523/JNEUROSCI.23-31-09996.2003. [DOI] [PMC free article] [PubMed] [Google Scholar]
- Takeichi M. Morphogenetic roles of classic cadherins. Curr Opin Cell Biol. 1995;7:619–627. doi: 10.1016/0955-0674(95)80102-2. [DOI] [PubMed] [Google Scholar]
- Takeichi M. The cadherin superfamily in neuronal connections and interactions. Nat Rev Neurosci. 2007;8:11–20. doi: 10.1038/nrn2043. [DOI] [PubMed] [Google Scholar]
- Zhang J, Woodhead GJ, Swaminathan SK, Noles SR, McQuinn ER, Pisarek AJ, Stocker AM, Mutch CA, Funatsu N, Chenn A. Cortical neural precursors inhibit their own differentiation via N-cadherin maintenance of beta-catenin signaling. Dev Cell. 2010;18:472–479. doi: 10.1016/j.devcel.2009.12.025. [DOI] [PMC free article] [PubMed] [Google Scholar]
- Zong M, Wu XG, Chan CW, Choi MY, Chan HC, Tanner JA, Yu S. The adaptor function of TRAPPC2 in mammalian TRAPPs explains TRAPPC2-associated SEDT and TRAPPC9-associated congenital intellectual disability. PLoS One. 2011;6:e23350. doi: 10.1371/journal.pone.0023350. [DOI] [PMC free article] [PubMed] [Google Scholar]
Associated Data
This section collects any data citations, data availability statements, or supplementary materials included in this article.