

Abstract
The Golgi complex and ER are dynamically connected by anterograde and retrograde trafficking pathways. To what extent and by what mechanism outward-bound cargo proteins escape retrograde trafficking has been poorly investigated. Here, we analysed the behaviour of several membrane proteins at the ER/Golgi interface in live cells. When Golgi-to-plasma membrane transport was blocked, vesicular stomatitis virus glycoprotein (VSVG), which bears an ER export signal, accumulated in the Golgi, whereas an export signal-deleted version of VSVG attained a steady state determined by the balance of retrograde and anterograde traffic. A similar behaviour was displayed by EGF receptor and by a model tail-anchored protein, whose retrograde traffic was slowed by addition of VSVG's export signal. Retrograde trafficking was energy- and Rab6-dependent, and Rab6 inhibition accelerated signal-deleted VSVG's transport to the cell surface. Our results extend the dynamic bi-directional relationship between the Golgi and ER to include surface-directed proteins, uncover an unanticipated role for export signals at the Golgi complex, and identify recycling as a novel factor that regulates cargo transport out of the early secretory pathway.
Keywords: live cell imaging, Rab6, retrograde transport, secretory pathway, VSV glycoprotein
Introduction
The early secretory pathway is composed of subcompartments—ER, intermediate compartment and Golgi complex—that are dynamically interconnected by vesicle or tubule-mediated transport. Anterograde transport out of the ER, effected by COPII-coated transport vesicles, is balanced by retrograde transport from the Golgi and the intermediate compartment back to the ER (Spang, 2013). The latter process recycles proteins of the export machinery (such as vSNARE proteins) and retrieves escaped ER resident proteins, guaranteeing maintenance of the size and identity of each compartment of the early secretory pathway in the face of constant outward-bound traffic. By retrieving chaperone-bound unfolded cargo proteins and incompletely assembled oligomeric complexes, retrograde transport also participates in the quality control of exported proteins, allowing completion of cargo folding/assembly in the efficient folding environment of the ER (Yamamoto et al, 2001; Spasic et al, 2007; Vavassori et al, 2013).
In addition to its function in retrieval of ER components, retrograde traffic between the Golgi and the ER also involves recycling of the Golgi resident proteins themselves. Recycling of Golgi sugar transferases was first observed in cells treated with the fungal antibiotic brefeldin A (Doms et al, 1989; Lippincott-Schwartz et al, 1989) and later demonstrated under other conditions of inhibition of ER export, which lead to the accumulation of Golgi proteins in the ER in the absence of new protein synthesis (Cole et al, 1998; Storrie et al, 1998).
Two mechanisms of Golgi-to-ER transport have been described. The best characterized one, which relies on the Arf1 GTPase and COPI coatomer (Bremser et al, 1999), retrieves retrograde membrane cargoes that carry COPI recognition motifs (Cosson & Letourneur, 1994; Cosson et al, 1998); among these, the KDEL receptor and Rer1p function as receptors to bind and retrieve escaped ER residents. The second pathway is Arf1-/COPI-independent and relies instead on the Rab6 GTPase. This pathway appears to involve tubules rather than vesicles and is responsible for cycling of glycosylating enzymes between the Golgi and the ER, as well as for the retrograde transport of Shiga and Shiga-like toxins (Girod et al, 1999; White et al, 1999).
Poorly investigated so far has been how Golgi/ER backward flux affects the forward transport of cargo proteins. Do correctly folded/assembled forward-directed cargo proteins escape from this backward flux, which would otherwise delay their transit through the Golgi? In particular, given the high surface-to-volume ratio in vesicles and tubules, one might expect that cargo membrane proteins could easily enter the retrograde carriers. If they do not, by what mechanism are they excluded?
Here, we have applied live cell imaging to investigate the behaviour at the ER/Golgi interface of a number of outward-directed cargo membrane proteins. We have compared the behaviour of a type I membrane protein equipped with a known COPII-interacting export signal (Vesicular Stomatitis Virus Glycoprotein, VSVG) (Nishimura et al, 1999; Sevier et al, 2000) with that of membrane proteins with signal-independent, transmembrane domain (TMD)-dependent, export. As representatives of the latter category, we analysed the following: (i) a model tail-anchored (TA) protein, whose export depends exclusively on the length of its TMD (Pedrazzini et al, 1996; Bulbarelli et al, 2002; Ronchi et al, 2008), and which we refer to here as Fluorescent Protein (FP)-22, because of its 22-residue TMD; (ii) an export signal-deleted mutant of VSVG, whose export, like the one of FP-22, depends on its TMD characteristics (Dukhovny et al, 2009). In addition, we analysed two membrane proteins [synaptobrevin 2 (Syb2) and epidermal growth factor receptor (EGFR)], whose export mechanisms have not been previously investigated.
Our observations reveal that shuttling of outward-directed membrane protein between the Golgi and the ER may be a much more common phenomenon than previously suspected and that positive, signal-mediated, mechanisms are required to prevent cargo from engaging this seemingly futile recycling. The results indicate that, in addition to the efficiency of recruitment into COPII-coated vesicles, recycling from the Golgi back to the ER is an additional factor that regulates cargo transport out of the early secretory pathway, providing an explanation for the vastly different reported rates of protein transport through the Golgi complex (e.g. Yeo et al, 1985; Bamberger & Lane, 1988; Mironov et al, 2001; Boncompain et al, 2012).
Results
VSVG and FP-22 display a different steady-state distribution at 20°C
To investigate whether and how Golgi-to-ER backward flux affects the transit of transmembrane cargoes through the early secretory pathway, we first checked that the conditions of live cell imaging used in our experiments allow normal transport of our constructs. We used a GFP-tagged form of the temperature-sensitive variant of VSVG (Supplementary Fig S1A), which at the restrictive temperature of 39°C is misfolded and retained in the ER (Gallione & Rose, 1985), and which we refer to as VSVG-EGFP or simply VSVG. In the case of FP-22 (Supplementary Fig S1A), which at steady state localizes to the plasma membrane (Bulbarelli et al, 2002; Supplementary Fig S2C) and which cannot be retained in the ER by high temperature, we imaged cells at short times (70–75 min) after microinjection of the corresponding cDNA, so as to catch the newly synthesized protein exiting the ER (Ronchi et al, 2008). In all experiments, a protein synthesis inhibitor was added at the beginning of the imaging, and the Golgi was identified by co-transfection or co-microinjection of the Golgi marker GalNacT2 tagged with mCherry, referred to here as GalNAc, or GalNAc-mCherry.
As shown in Supplementary Fig S1B and C, after shifting NRK cells to the permissive temperature of 32°C, VSVG rapidly cleared the ER and simultaneously reached the Golgi region, with maximum accumulation at 12–15 min; at subsequent time points, it progressively localized to the plasma membrane with concomitant emptying of the Golgi complex. FP-22 displayed a somewhat different behaviour: as soon as it was detectable, it appeared distributed between the ER and the Golgi region (60 min after cDNA microinjection, Supplementary Fig S1D); at later times, the construct appeared at the plasma membrane, while intracellular fluorescence slowly decreased during the 2-h observation period (Supplementary Fig S1D and E, Supplementary Movie S1). Thus, both VSVG and FP-22 are transported to the cell surface under our conditions; however, in agreement with our previous observations on CV1 cells (Ronchi et al, 2008), transport of FP-22 is less well synchronized than that of VSVG.
To restrict our analysis to transport at the ER/Golgi interface, we analysed the distribution of FP-22 and VSVG after incubation of the cells for 2 h at 20°C, a temperature at which export from the trans-Golgi network (TGN) is strongly slowed (Matlin & Simons, 1983). As shown in Fig1A, after incubation at 20°C, VSVG was detected exclusively in the Golgi apparatus, whereas FP-22 was distributed between the ER and the Golgi. This distribution did not change with increasing time of incubation (see Fig2C), leading us to hypothesize that either FP-22's anterograde transport to the Golgi is impaired at 20°C or that, after export from the ER, the protein is included into a retrograde pathway, resulting in the steady-state distribution visualized in Fig1A.
Figure 1. Characterization of ER-to-Golgi anterograde transport of FP-22 at 20°C.

- NRK cells, co-microinjected with mEGFP-22 and GalNAc-mCherry (upper row), or co-transfected with VSVG-EGFP and GalNAc-mCherry at 39.3°C (lower row), were incubated for 2 h at 20°C before fixation. Images are maximum intensity projections of z-stacks. Scale bars, 10 μm.
- Representative FRAP experiment of Golgi regions (arrowheads) or of a portion of the ER (asterisk) in co-microinjected cells allowed to express mCerulean-22 and GalNAc-mCherry, incubated for 60 min at 20°C before imaging. Lower row: magnifications of the boxed area (rotated clockwise by 90°) in the upper row, showing a Golgi apparatus and a portion of the ER that were bleached (red contours; see Supplementary Movie S2). Scale bars, 20 (upper and middle rows) and 10 (lower row) μm.
- Recovery curves of mCerulean-22 in the Golgi apparatus and in the ER in the presence or absence of energy together with the curves fitted to one-phase (ER, green and violet traces) and two-phase (Golgi, red and blue traces) exponential functions. Data points represent means ± SEM, and the 95% confidence limits of the fitted curves are indicated by the surrounding lightly coloured areas (n = 17, 7, 8 and 10 cells, for Golgi, ER, Golgi minus ATP, and ER–ATP, respectively; number of experiments ≥ 5).
- Representative line scans (yellow) crossing the Golgi apparatus and portions of surrounding ER in FRAP experiments performed as described in (B), under control conditions (upper panel) and in the absence of energy (lower panel), before bleaching (red), immediately after bleaching (blue), and after 60 min of recovery (green) (related to Supplementary Movie S3). Scale bars, 10 μm.
- FRAP of a portion of the ER (yellow contour) was performed on energy-depleted NRK cells, microinjected and incubated as described in (B). Scale bar, 15 μm.
Figure 2. FP-22 is included in a Golgi-to-ER retrograde transport pathway at 20 and 37°C.

- Loss of Golgi fluorescence after bleaching of the ER in NRK cells co-microinjected with mCerulean-22 and mRFP-KDEL. Cells were incubated for 1 h at 20°C and imaged alive at 20°C for 30 min, before ER bleaching (red and yellow contours). Enlargements (lower row) of the boxed area (upper row) in the mCerulean-22 channel show Golgi emptying in more detailed temporal resolution. Red arrowhead indicates a thin FP-22-positive tubule emanating from the Golgi apparatus (see Supplementary Movie S4). Scale bars, 15 (upper and middle rows) and 3 (lower row) μm.
- Inhibition of loss of Golgi fluorescence by energy depletion. Cells were microinjected and incubated as in (A). The mCerulean channel is shown. Bleached ROIs are indicated by the yellow contours. Scale bars, 20 μm.
- Quantitative analysis of fluorescence loss from the Golgi after ER bleaching in the presence or absence of ATP, and recovery of the ER in the same conditions (n = 12 cells, number of experiments ≥ 5). Data points represent means ± SEM. The coloured lines show the fitted two-phase exponential decay and association curves.
- Bleaching of the ER, as described in (A), was performed at 37°C on microinjected cells. The red contour (upper panel) indicates the bleached ER ROI; the red arrowhead in the enlargement (lower row) of the boxed area highlights an FP-22-positive tubule originating from the Golgi. Scale bars, 10 (upper two rows) and 5 (lower row) μm.
- Time course of fluorescence loss from the Golgi after ER bleaching at 37°C (n = 8 cells). Data points represent means ± SEM.
FP-22 is transported from the ER to the Golgi complex at 20°C
To investigate transport of FP-22 from the ER to the Golgi at 20°C, we performed Fluorescence Recovery After Photobleaching (FRAP) experiments. After bleaching the Golgi complex in GalNAc and FP-22 co-microinjected cells, we observed a progressive recovery of FP-22's fluorescence signal over time (Fig1B and C, Supplementary Movie S2). Analysis of FP-22's recovery revealed the presence of two phases, a rapid (t1/2 of ˜1 min) and a slower (t1/2 of ˜20 min) one (Fig1C). A bleached area of ER outside of the Golgi area recovered with a time course similar to the rapid phase (Fig1B and C), reaching maximum recovery within 10 min, suggesting that this first phase is due to diffusion of FP-22 from the bulk ER into the juxtanuclear ER contained in the bleached ROI of our experiments.
The slow recovery phase could instead be correlated with an increase in Golgi staining (Fig1B and C, Supplementary Movie S2). We confirmed that this phase is due to vesicular transport of FP-22 by probing for its energy dependence. As illustrated in Fig1D, under conditions of energy depletion, recovery of fluorescence in the Golgi area was limited to values matching the surrounding ER; the slow phase, which under normal conditions continues for the entire period of registration, was strongly reduced in the ATP-depleted cells (Fig1C and D, Supplementary Movie S3). Recovery of a bleached area of the ER was, instead, energy independent, as expected for a diffusion-mediated process (Fig1C and E). These results indicate that vesicular transport of FP-22 from the ER to the Golgi occurs at 20°C.
FP-22, but not VSVG, is recruited into a Golgi-to-ER retrograde transport pathway
To explore the possible retrograde transport of FP-22, the entire ER (identified by the ER resident protein mRFP-KDEL) of microinjected cells pre-incubated at 20°C was photobleached, and fluorescence variations in the Golgi (inverted FRAP or iFRAP) and in the ER were measured over time. After bleaching of the ER, FP-22's Golgi signal progressively diminished while the ER recovered (Fig2A and C). FP-22-containing tubular/vesicular elements leaving the Golgi and dispersing into the mRFP-KDEL positive region were frequently observed (Supplementary Movie S4, Fig2A, inset).
Like in the case of the recovery analysis of Fig1, Golgi emptying could be described by two phases (Fig2C), a rapid one, due to FP-22's diffusion from the ER of the non-bleached area to the bleached ER, and a second slower phase determined by energy-dependent retrograde transport. In this, and subsequent experiments, we calculated an apparent first-order rate constant for Golgi emptying by fitting the data points between 20 and 30 min (a time period at which ER diffusion no longer contributes to fluorescence recovery) to a monoexponential decay curve (see Supplementary Methods) and found that Golgi emptying was reduced by approximately 90% in the energy-depleted cells (Fig2B and C, Table1). In contrast, the rapid phase of recovery in the ER was not affected by energy depletion, as expected for a diffusion-mediated process (Fig2C).
Table 1.
Apparent first-order rate constants of Golgi emptying at 20°C determined from inverted FRAP experimentsa
| Construct | k (min−1) × 102 | 95% confidence intervals |
|---|---|---|
| mCerulean-22 | 1.811 | 1.601–2.021 |
| mCerulean-22 minus energy | 0.1522 | 0.07426–0.2301 |
| mCerulean-22 co-expressed with VSVG | 1.536 | 1.398–1.675 |
| mCerulean22-YTDIE | 0.791 | 0.724–0.858 |
| VSVGAxA-EGFP | 2.029 | 1.980–2.078 |
| EGFR-EGFP | 2.087 | 1.636–2.538 |
| VSVGAxA-EGFP in HeLa cells | 1.287 | 1.186–1.388 |
| VSVGAxA-EGFP in HeLa cells + Rab6 T27N | 0.5599 | 0.3986–0.7212 |
See Supplementary Methods for the procedure of determination of the decay constants.
To investigate whether FP-22's recycling occurs also at physiological temperature, we repeated the same FRAP experiment at 37°C. Similarly to our observations at 20°C, after bleaching the ER, FP-22's fluorescence in the Golgi progressively decreased and tubular elements emerging from the Golgi were observed (Fig2D and E). At 37°C, part of the Golgi emptying could be due to anterograde transport to the plasma membrane; however, the slow acquisition of plasma membrane fluorescence at 37°C (Supplementary Fig S1) and the stability of Golgi fluorescence in a neighbouring non-bleached cell suggest that much of the observed Golgi fluorescence loss was due to retrograde transport.
As shown in Fig1, VSVG is hardly detectable in the ER after incubation at 20°C. Assuming first-order kinetics for both anterograde and retrograde transport, the steady-state ratio of Golgi-to-ER concentration is predicted to be equal to the ratio of first order rate constants of transport (kER→Golgi/kGolgi→ER). Thus, both accelerated anterograde and slowed retrograde transport could in principle contribute to the strong accumulation of VSVG in the Golgi at 20°C. To investigate possible retrograde transport of VSVG, we performed photobleaching of the ER at 20°C on NRK cells transfected at the restrictive temperature. Cells were briefly incubated at 32°C to allow a partial accumulation of VSVG in the Golgi complex and then photobleached and imaged at 20°C. As shown in Fig3A and B, bleaching of the ER revealed that the first rapid diffusional phase is similar in VSVG and FP-22-expressing cells; however, the second, transport-related, phase has a reduced slope in the case of VSVG, suggesting that this protein is poorly recruited to the retrograde pathway (Fig3B).
Figure 3. VSVG is poorly recruited into Golgi-to-ER retrograde trafficking pathways.
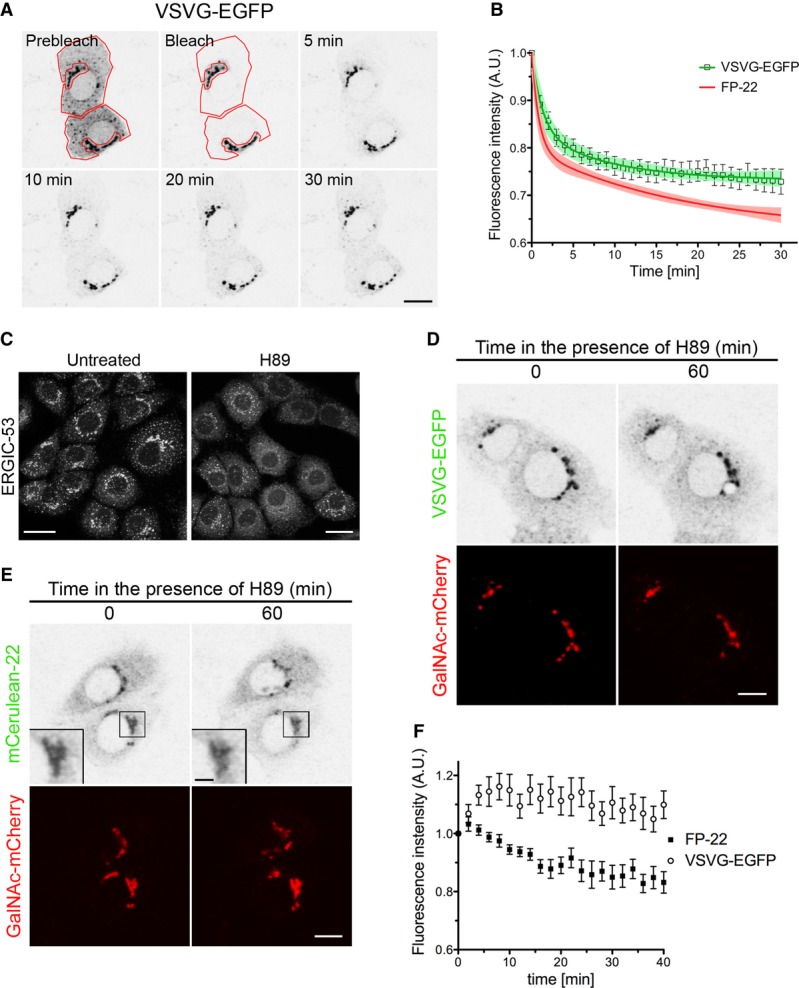
A NRK cells, co-transfected with VSVG-EGFP and mRFP-KDEL at 39.3°C and then incubated 15 min at 32°C, were imaged alive at 20°C before or after bleaching the ER, as indicated by the red contours. The GFP channel is shown. Scale bar, 10 μm.
B Quantitative analysis of VSVG fluorescence loss from the Golgi after ER bleaching. Data points represent means ± SEM, and the 95% confidence limits of the fitted curves are indicated by the surrounding lightly coloured areas. The green trace shows the fitted two-phase exponential decay curve (n = 16). The corresponding curve of FP-22 (see Fig2C) is displayed for comparison.
C–F Effect of H89 treatment on the distribution of FP-22 and VSVG. ERGIC-53 (p58) distribution in NRK cells treated (right) or not (left) with H89 for 60 min at 20°C (C). NRK cells, transfected at 39.3°C with VSVG-EGFP and GalNAc-mCherry, were incubated for 15 min at 32°C and imaged alive for 60 min at 20°C in the presence of H89 (D). The same protocol was carried out on NRK cells microinjected with mCerulean-22 and GalNAc-mCherry (E). The inset shows an enlargement of the boxed area. Time course of Golgi fluorescence loss (F) in the presence of H89 of FP-22 and VSVG-EGFP (FP-22, n = 9; VSVG-EGFP, n = 12). Data points represent means ± SEM. Scale bars: 20 mm (C), 10 mm (D), 10 and 2 mm (E, inset).
Since the apparent rate of retrograde transport could be reduced by ongoing anterograde transport, we adopted an alternative approach to iFRAP: cells were treated with the PKA inhibitor H89, which is known to block ER-to-Golgi anterograde transport and to result in the gradual accumulation of Golgi proteins in the ER (Lee & Linstedt, 2000). We first checked the effect of H89 on NRK cells at 20°C by analysing the intracellular distribution of the recycling protein ERGIC-53 (known as p58 in rodents). As shown in Fig3C, treatment with H89 for 1 h at 20°C caused a redistribution of ERGIC-53 from a perinuclear and punctate pattern to a typical ER localization, consistent with a block in anterograde-, but ongoing retrograde traffic. We then compared loss of Golgi fluorescence of VSVG and FP-22 in H89-treated cells. After allowing partial accumulation of each of the two proteins in the Golgi by incubation at 32 or 37°C, cells were imaged at 20°C in the presence of the drug. Under these conditions, the two proteins displayed a different behaviour: whereas VSVG's fluorescence in the Golgi was almost unchanged during imaging, FP-22's signal progressively diminished (Fig3D–F). These results indicate that VSVG is largely excluded from the retrograde pathway into which FP-22 is recruited.
Shifting the temperature from the restrictive to the permissive temperature results in a wave of transport of VSVG to the Golgi complex, which initiates signalling cascades that affect Golgi function (Giannotta et al, 2012). We therefore considered the possibility that VSVG, rather than being itself excluded from Golgi-to-ER transport, might inhibit the retrograde pathway while transiting through the Golgi. If this were the case, FP-22 expressed alone or co-expressed with VSVG would display different behaviours at the ER/Golgi interface. To test this possibility, cells co-microinjected with the cDNAs coding for the two constructs and kept at 39°C, were shifted to 20°C for 90 min. As expected, VSVG appeared concentrated in the Golgi region under this condition, while FP-22 was distributed between the ER and the Golgi in the same way as when it is expressed alone (Fig4A), suggesting that the retrograde transport pathway is not affected by the synchronous anterograde flux of VSVG. This was confirmed by direct measurement of FP-22's retrograde transport in the presence of co-expressed VSVG (Fig4B and C, Table1).
Figure 4. FP-22 retrograde transport is not affected by co-expression of VSVG.

- Intracellular distribution of VSVG-EGFP and tdTomato-22 in co-microinjected NRK cells incubated for 90 min at 20°C before fixation. Scale bar, 10 μm.
- NRK cells microinjected with Cerulean-22 and VSVG-Venus cDNAs were incubated 75 min at 39.3°C followed by 60 min at 20°C before live cell imaging at the same temperature. The ER was bleached in the Cerulean channel (yellow contour), and the loss of Golgi fluorescence was recorded for 60 min after bleaching. Scale bar, 10 μm.
- Quantitative analysis of the iFRAP illustrated in (B). Data points represent means ± SEM. The fitted two-phase exponential decay curve is also shown (n = 10 cells).
We then compared the distribution within the Golgi stack of the two cargoes with TGN38, a marker of the TGN, and of GalNAc-mCherry, which has a wider intra-Golgi distribution (Rottger et al, 1998). As previously reported (Matlin & Simons, 1983), upon incubation at 20°C, VSVG preferentially co-localized with TGN38 (Fig5B). In contrast, FP-22 was excluded from the TGN (Fig5A), confirming the different intra-Golgi trafficking of the two cargoes.
Figure 5. Distribution of FP-22 and VSVG-EGFP within the Golgi apparatus.

- NRK cells were co-microinjected with mCerulean-22 and GalNAc-mCherry and then incubated for 90 min at 20°C before fixation and immunostaining with anti-TGN38 mAb. A maximum intensity projection of a representative z-stack is shown. The boxed area is enlarged in the images of the lower row.
- NRK cells were co-transfected with VSVG-EGFP and GalNAc-mCherry plasmids at 39.3°C and then incubated and processed as described in (A).
Data information: In (A) and (B), the graphs on the right report fluorescence intensities for each channel along the yellow arrow drawn in the enlargements. Scale bars: 15 μm and 5 μm in upper and lower row, respectively.
The DxE export signal prevents cargo recruitment into the Golgi-to-ER retrograde pathway
VSVG is endowed with a tyrosine- and di-acidic (DxE)-based export signal that, by binding to the Sec24 subunit of COPII, mediates efficient recruitment to ER exit sites (Nishimura & Balch, 1997; Sevier et al, 2000). In addition to its role in export from the ER, this signal has also been implicated in mediating VSVG's exit from the Golgi, by binding to the δ subunit of the clathrin adaptor 3 (AP3) complex (Nishimura et al, 2002). To evaluate a possible role of the export signal in exclusion from Golgi-to-ER retrograde traffic, we analysed an export signal-deficient form of VSVG, in which the export sequence YTDIE was replaced with YTAIA (VSVGAxA-EGFP, Supplementary Fig S1A). The mutated protein is poorly concentrated in ER exit sites, but nevertheless is still able to reach the cell surface at reduced rate (Nishimura & Balch, 1997; Nishimura et al, 1999) (Supplementary Fig S2A).
We first analysed the intracellular distribution of VSVGAxA in cells co-transfected at 39°C with GalNAc-mCherry, followed by an incubation at 20°C for 90 min. Under this condition, differently from the signal-bearing form, but similar to FP-22, VSVGAxA was distributed between the ER and the Golgi, suggesting a steady state determined by the balance between anterograde and retrograde transport (Fig6A). This altered distribution was not due to a folding problem of VSVG's lumenal domain, as a conformation-specific anti-VSVG antibody revealed a staining pattern similar to that of GFP fluorescence (Supplementary Fig S2B). To directly assess ongoing retrograde traffic, we photobleached the ER at 20°C and observed that the fluorescence intensity in the Golgi progressively decreased concomitantly with partial ER signal recovery (Fig6B and C, Supplementary Movie S5). As in the case of FP22, Golgi emptying of VSVGAxA could be fit by a double exponential function (Fig6C); the value of the decay constant of the slow phase (0.02 min−1, Table1) was close to the one estimated for FP-22. To further demonstrate VSVGAxA recycling, fluorescence intensity variations in the Golgi complex were measured at 20°C in the presence of H89 (Fig6D). While in untreated cells at 20°C fluorescence in the Golgi is stable (see the pre-bleaching data points in Fig6C), cells treated with H89 displayed a progressive Golgi emptying in the investigated time window (Fig6D and E). Thus, the di-acidic export signal of VSVG is the feature that prevents Golgi-to-ER retrograde transport.
Figure 6. Signal-deleted VSVG is recruited into a Golgi-to-ER retrograde transport pathway.
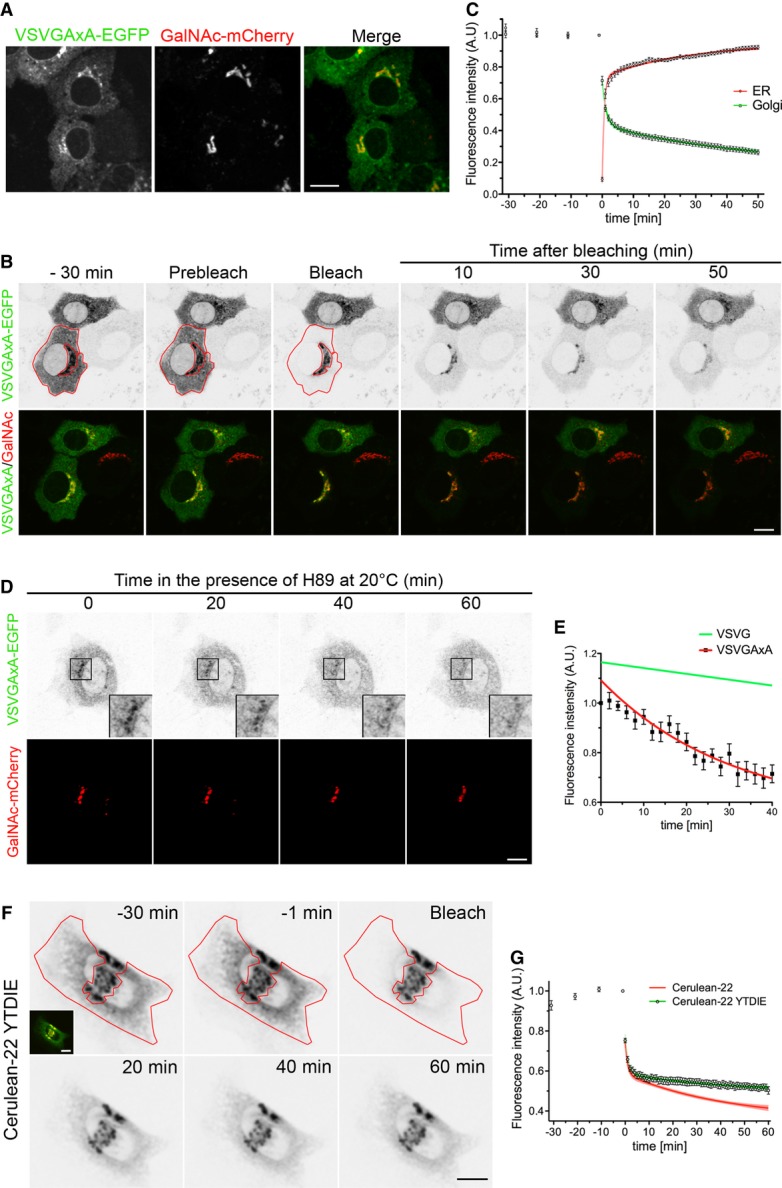
- Localization of VSVGAxA-EGFP in NRK cells co-transfected with GalNAc-mCherry at 39.3°C and incubated for 2 h at 20°C before fixation. Scale bar, 15 μm.
- Loss of VSVGAxA-EGFP Golgi fluorescence after bleaching of the ER. NRK cells, transfected as in (A), were incubated for 60 min at 20°C and then imaged alive at 20°C. The red contour indicates the bleached area (see Supplementary Movie S5). Scale bar, 15 μm.
- Time course of fluorescence loss in the Golgi and recovery in the ER after ER bleaching (n = 13). The data were fitted to two-phase exponential equations.
- NRK cells, transfected as in (B) and incubated for 60 min at 32°C, were imaged at 20°C in the presence of H89. Scale bar, 10 μm.
- Time course of VSVGAxA-EGFP Golgi fluorescence loss in cells treated with H89 (n = 9). Data points represent means ± SEM. The data points were fitted to a mono-exponential decay function. The trace for VSVG-EGFP, obtained by fitting the data points of Fig4D to a monoexponential function, is also reported.
- iFRAP of NRK cells microinjected with Cerulean-22 YTDIE and GalNAc-mCherry. Cells were incubated for 1 h at 20°C and then imaged at the same temperature for 30 min before and 60 min after ER bleaching (red contour). The unbleached region corresponding to the Golgi apparatus was chosen based on co-localization with the Golgi marker, GalNAc-mCherry (inset). Scale bar, 15 μm.
- Quantitative analysis of Golgi fluorescence intensities before and after bleaching as in (F). Data points represent means ± SEM. The green line represents the fitted two-phase exponential decay equation (n = 11 cells). Golgi emptying of the parent construct FP-22 is also shown for comparison (red trace from Fig2C).
To investigate the site within the Golgi stack from which signal-deleted VSVG is recycled back to the ER, we analysed the time course of resistance acquisition to N-linked glycan removal by Endoglycosidase H (EndoH). As shown in Supplementary Fig S3, at 20°C VSVGAxA remained sensitive to EndoH even after 4 h of incubation, indicating that the majority of this cargo has limited access the medial cisternae of the Golgi (where α-mannosidase II confers EndoH-resistance to glycoproteins). In contrast, the WT protein became nearly totally EndoH resistant within 2 h at 20°C, in agreement with its TGN localization assessed by confocal analysis (Fig5A).
The experiments of Fig6A–E indicate that the YTDIE sequence is required to reduce VSVG's recruitment into the retrograde pathway. To investigate whether this signal is also sufficient to prevent recycling, we transplanted it onto the cytosolic domain of FP-22 (FP22-YTDIE— Supplementary Fig S1A). Like the parent construct, FP22-YTDIE was expressed at the plasma membrane of transfected cells (Supplementary Fig S2C). We then determined its rate of retrograde transport by iFRAP, which we found to be severely reduced in comparison to the parent protein FP-22 (Fig6F and G, Table1).
The experiments presented here suggest that the YTDIE sequence in the cytosolic domain of VSVG could be involved in binding to putative receptor(s) in the Golgi that remove it from the retrograde pathway. To attempt identification of such receptors, cells transfected or not with VSVG-EGFP were released from the 39°C block, incubated at 20°C and then lysed and subjected to immunoprecipitation with anti-GFP antibodies. SDS–PAGE analysis revealed several bands that co-precipitated with VSVG-EGFP and that were absent in immunoprecipitates from non-transfected cells or from transfected cells exposed to unrelated antibodies (Supplementary Fig S4A). Among these, a band migrating between the 40 and 50 kDa size markers caught our attention, as clathrin adaptor μ chains are within this molecular mass range. VSVG's export sequence has been reported to interact with the adaptin AP3 (Nishimura et al, 2002), and the tyrosine residue within it is required for targeting to the basolateral surface in polarized cells (Thomas et al, 1993), a phenomenon mediated by AP1. We therefore considered the possibility that binding of the cytoplasmic tail of VSVG to adaptor complexes might keep it from entering the retrograde pathway. A possible interaction between AP1/AP3 and VSVG was tested by co-immunoprecipitation experiments, as shown in Supplementary Fig S4B; however, neither AP1 nor AP3 co-precipitated with VSVG-EGFP. We also analysed co-localization between AP1 and 3 and VSVG-EGFP after incubation of the cells at 20°C (Supplementary Fig S4C) and found that the distributions of both AP1 and 3 were distinct from the one of VSVG, with only some co-localizing puncta.
EGFR and Syb2 behave differently at the ER/Golgi interface
To investigate whether Golgi/ER recycling of transmembrane cargoes destined to the plasma membrane is a general phenomenon, we analysed two other proteins, EGFR and Syb2 (Supplementary Fig S1A), whose export from the ER has not been investigated in depth. In these experiments, we used an untagged form of Syb2 and a GFP-tagged form of EGFR that has previously been shown to be fully functional (Carter & Sorkin, 1998).
After transfection of the cDNAs, both Syb2 and EGFR localized to the plasma membrane, the latter showing also some intracellular staining (Fig7A). A clear difference between the two proteins was observed when we analysed their intracellular distribution at a short time after their expression (75 min after cDNA microinjection); under this condition, EGFR was distributed between the ER and the Golgi, whereas Syb-2 was predominantly in the Golgi complex (Fig7B). This distribution of EGFR was almost unchanged upon a further incubation at 20°C for 90 min (Fig7C), favouring the hypothesis that EGFR, like FP-22 and VSVGAxA, is recycled from the Golgi back to the ER. This possibility was directly tested by photobleaching of the ER in microinjected NRK cells at 20°C, which caused a progressive decrease of Golgi fluorescence during the investigated time window (Fig7D), again with a rapid diffusion phase, and a slow phase (Fig7E). The rate constant determined for the slow phase (0.021 min−1) was similar to those of FP-22 and VSVGAxA (Table1).
Figure 7. EGFR, but not Syb2, is recruited into a retrograde transport pathway from the Golgi to the ER.
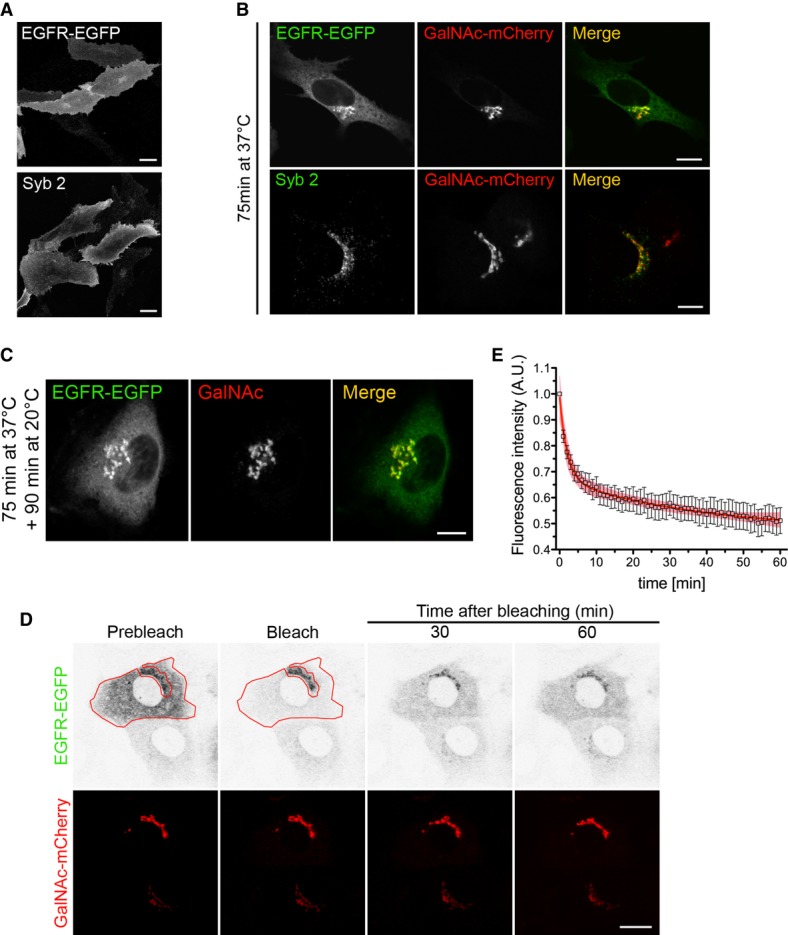
- Steady-state distribution of EGFR-EGFP and Syb2 after transfection at 37°C. Scale bars, 10 μm.
- Intracellular localization of EGFR-EGFP and Syb2 75 min after microinjection of each of the two plasmids together with GalNAc-mCherry. Scale bars, 15 μm.
- NRK cells, co-microinjected with EGFR-EGFP and GalNAc-mCherry, were incubated for 90 min at 20°C and then fixed. Scale bar, 10 μm.
- Loss of EGFR-EGFP fluorescence from the Golgi region after bleaching of the ER. Cells co-microinjected with EGFR-EGFP and GalNAc-mCherry were incubated for 60 min at 20°C and then imaged alive at the same temperature. The red contour indicates the bleached ER region. Scale bar, 15 μm.
- Quantitative analysis of Golgi emptying by EGFR-EGFP after ER bleaching (n = 9 cells). Data points represent means ± SEM, and the 95% confidence limits of the fitted curves are indicated by the surrounding lightly coloured areas. Values were fitted to a two-phase exponential decay function.
Signal-deficient cargoes are recycled from the Golgi to the ER through the Rab6-dependent pathway
Two Golgi-to-ER retrograde pathways have been identified: one is Arf1-/COPI-dependent, and the other Arf1-independent and Rab6-dependent (Girod et al, 1999; White et al, 1999). To identify which of these pathways is involved in the recycling of signal-deficient membrane cargoes, dominant-negative constructs of the two retrograde routes, Arf1 Q71L (Tanigawa et al, 1993) and Rab6 T27N (Storrie et al, 1998; Girod et al, 1999), were co-transfected with VSVGAxA at the restrictive temperature and the intracellular distribution of the cargo was then analysed after a short incubation at the permissive temperature. In both situations, the efficacy of inhibition was tested by analysing the localization of two known substrates of the two pathways: endogenous ERGIC-53 and the fluorescently tagged B subunit of Shiga toxin (Cy3-STxB) for the Arf1-dependent and independent pathways, respectively. Since NRK cells do not express the GB3 (globotriasoylceramide) Shiga toxin receptor on their cell surface, these experiments were performed on HeLa cells.
As expected, in Arf1 Q71L-overexpressing cells, ERGIC-53 became more concentrated in the Golgi region with a decrease in peripheral puncta, compared to both adjacent untransfected cells or to cells transfected with WT Arf1 (Fig8A). In HeLa cells, under the conditions used, concentration of VSVGAxA cargo in the Golgi region was more difficult to discern than in NRK cells. Importantly, however, expression of Arf1 Q71L did not increase VSVGAxA's concentration in the Golgi region, as it did for ERGIC-53 (Fig8A and B); rather, compared to cells expressing WT Arf1 and for reasons that we presently do not understand, mutant Arf1 caused a small decrease in VSVGAxA Golgi fluorescence.
Figure 8. The signal-deficient form of VSVG is recycled from the Golgi to the ER through the Rab6-dependent pathway.
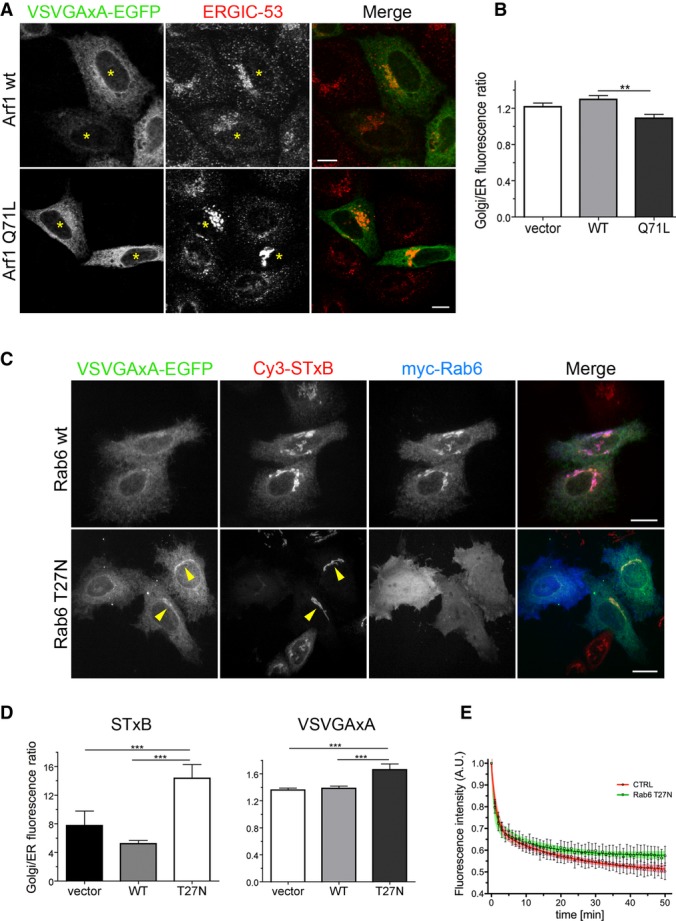
- Intracellular localization of VSVGAxA-EGFP and endogenous ERGIC-53 in HeLa cells co-transfected at 39.3°C with Arf1 (WT or Q71L) and incubated for 3 h at 32°C. Asterisks indicate transfected cells. Cells transfected with the GTP-locked Arf1 show a redistribution of ERGIC-53. Scale bars, 15 μm.
- Golgi/ER mean fluorescence ratio of VSVGAxA-EGFP in HeLa cells transfected and incubated as described in (A) (n = 29, 25 and 23 cells transfected with empty vector, WT or Q71L Arf1, respectively). **P = 0.002 determined by one-way ANOVA followed by Dunn's post-test.
- HeLa cells were co-transfected with VSVGAxA-EGFP and myc-Rab6 (WT or T27N), exposed to Cy3-STxB at 4°C for 20 min, followed by washing and incubation for 5 h at 32°C to allow toxin internalization and, concomitantly, VSVGAxA export from the ER. Yellow arrowheads indicate two transfected cells where Rab6 T27N inhibits the arrival of STxB to the ER and causes an increased concentration of VSVGAxA in the Golgi. Maximum intensity projections of z-stacks are shown. Scale bars, 15 μm.
- Golgi/ER fluorescence ratio of Cy3-STxB and VSVGAxA-EGFP in HeLa cells transfected and incubated as described in (C). ***P < 0.0001 determined by one-way ANOVA followed by Dunn's post-test (STxB quantitation (left): n = 46, 44 and 28 cells transfected with empty vector, myc-Rab6 WT and myc-Rab6 T27N, respectively; VSVGAxA quantitation (right): n = 51, 48 and 49 cells transfected with empty vector, myc-Rab6 WT and myc-Rab6 T27N, respectively).
- Analysis of Golgi emptying by VSVGAxA in HeLa cells co-transfected with VSVGAxA-EGFP and either GalNAc-mCherry (CTRL) or Rab6 T27N and incubated as in (C) before live cell imaging at 20°C. The Rab6 T27N-transfected cells were exposed to Cy3-STxB during the 4°C incubation, to check the efficacy of the dominant-negative mutant (n = 9 and 7 for CTRL and Rab6 T27N, respectively). Data points represent means ± SEM, and the 95% confidence limits of the fitted curves are indicated by the surrounding lightly coloured areas.
A different result was obtained when Rab6 T27N was overexpressed. As expected, in these cells, Cy3-STxB was not able to reach the ER and remained blocked in the Golgi complex (Fig8C and D). In cells expressing Rab6 T27N, VSVGAxA was significantly more enriched in the Golgi complex than in control cells (Fig8C and D), suggesting an involvement of the Rab6-dependent pathway in its recycling. To directly assess the effect of Rab6 inhibition on retrograde traffic of VSVGAxA, we measured Golgi emptying of VSVGAxA at 20°C by photobleaching the ER in control cells or cells co-transfected with Rab6 T27N. Like in NRK cells, after ER bleaching, the Golgi fluorescence intensity of VSVGAxA progressively diminished (Fig8E and Supplementary Fig S5A), demonstrating that the recycling of cargoes that lack the export signal is not restricted to NRK cells, but is a more general phenomenon. In Rab6 T27N-overexpressing cells, the initial ER diffusion phase of the control and Rab6 T27N-expressing cells was similar; however, at later time points, the slope of the curve was strongly reduced in the Rab6 T27N cells (Fig8E and Supplementary Fig S5A and B), with a first-order decay constant reduced by 60% compared to control cells (Table1).
To assess the weight of Rab6-dependent recycling on the rate of transport of cargo to the cell surface, we evaluated the surface expression of VSVG and VSVGAxA in cells co-transfected at 39°C with WT or dominant-negative Rab6. After returning the cells to the permissive temperature, surface expression of VSVG was evaluated in non-permeabilized cells with an antibody against the extracellular domain. Based on the time course of transport of the two proteins (Supplementary Fig S1B and C and Fig S2A), the analysis was carried out after 30 and 120 min of incubation at 32°C in the case of the WT and the AxA mutant, respectively. As shown in Fig9, cell surface expression of WT VSVG, at 30 min after release of the temperature block, was inhibited by dominant-negative Rab, in agreement with Rab6's reported role also in post-Golgi traffic (Storrie et al, 2012). In striking contrast, VSVGAxA's surface expression was modestly, but significantly, increased in the cells transfected with dominant-negative Rab6. This result both confirms the role of this GTPase in retrograde transport of signal-deficient cargo and indicates that Golgi-to-ER recycling slows transit of such cargoes through the secretory pathway.
Figure 9. Inhibition of Rab6 function accelerates the transport of VSVGAxA-EGFP, but not of VSVG-EGFP, to the cell surface.
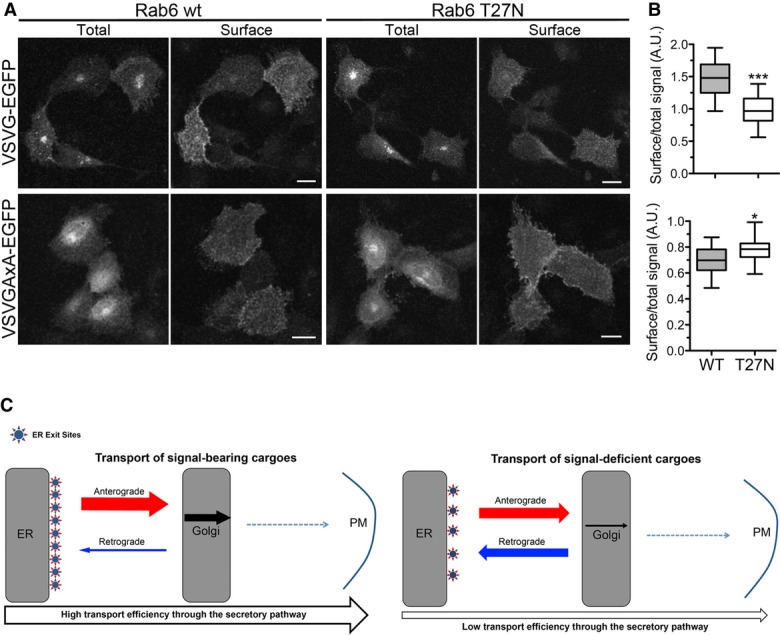
- NRK cells were co-transfected with VSVG-EGFP (upper panel) or VSVGAxA-EGFP (lower panel) and either WT Rab6 or T27N Rab6 at 39°C; 24 h after transfection, the cells were incubated at 32°C for 30 min or 2 h, in the case of WT or signal-deficient VSVG, respectively, before surface labelling of non-permeabilized cells. Images are maximum intensity projections of z-stacks. Scale bars, 15 μm.
- Box blots of cell surface expression of VSVG-EGFP or VSVGAxA-EGFP expressed as ratio of antibody-revealed surface fluorescence to total EGFP-VSVG fluorescence (n = 20 images, for a total number of cells of ˜150). ***P < 0.0001 and *P = 0.024 determined by Student's t-test.
- Working model of transport of signal-bearing or signal-deficient cargoes along the secretory pathway. See text for explanation.
Discussion
In this study, we analysed the behaviour of cargo membrane proteins in the early secretory pathway, addressing the problem of whether and how forward-directed proteins escape from Golgi-to-ER retrograde trafficking pathways. We found that three unrelated membrane proteins—a TA protein that we previously used as model to study TMD-dependent export from the ER (Bulbarelli et al, 2002; Ronchi et al, 2008); a viral glycoprotein with deleted export signal (Nishimura et al, 1999); and the native EGFR—all underwent recycling from the Golgi to the ER at similar rates.
Previous work had raised the possibility that recycling of outward-bound cargo can occur (Cole et al, 1998; Bannykh et al, 2000); our work directly demonstrates this phenomenon, shows that recruitment of cargo into the retrograde pathway delays its transport to the cell surface and suggests that cargo recycling may be a more common phenomenon than was suspected. Furthermore, we show that positive signals are required to escape from retrograde Golgi-to-ER transport and that the Rab6-dependent pathway (Girod et al, 1999; White et al, 1999) underlies this seemingly futile recycling phenomenon. These results modify current views of cargo transport along the secretory pathway.
The role of VSVG's di-acidic export signal
In agreement with previous studies (Cole et al, 1998; Mironov et al, 2001), we found that VSVG is transported unidirectionally through the secretory pathway, with no or low backward flux after its exit from the ER. Unexpectedly, however, we observed that substitution of the two acidic residues, which constitute the core of VSVG's ER export signal (Nishimura et al, 1999; Sevier et al, 2000), with alanines, generated a protein that did engage in recycling, indicating that positive signals are required to keep cargo proteins out of this pathway and to help them progress through the Golgi. Furthermore, introduction of this same YTDIE signal into the cytosolic domain of FP-22 reduced its rate of retrograde transport. Thus, with our model cargoes, the same signal that mediates recruitment to ER exit sites also favours progression through the Golgi. Although less extensively investigated, our observations suggest that Syb2 behaves similarly to VSVG; however, we have so far not investigated the feature that allows it to escape from recycling.
In addition to its role in recruitment to ER exit sites, the tyrosine within VSVG's export signal has been implicated in its polarized sorting to the basolateral surface of epithelial cells (Thomas & Roth, 1994). Our results uncover a third role for this region of VSVG's tail, that of restraining its backward flux to the ER. The molecular interactions underlying this third function are presently unclear. We considered the possibility that the previously reported interaction of VSVG's di-acidic motif with adaptin subunits (Nishimura et al, 2002) might be responsible for the observed exclusion from the retrograde pathway. However, under our conditions, we were unable to demonstrate an interaction of VSVG with any of the four adaptin complexes (Supplementary Fig S4 and unpublished results). Other candidate interactors one might consider are the Sec24A or B component of the COPII coat, which bind the YTDxE motif (Mancias & Goldberg, 2008); these proteins could have a second, COPII-independent, role in the Golgi complex. We consider it more likely, however, that the di-acidic motif binds other, so far unidentified, proteins. One might speculate that even low-affinity binding of the DxE motif to one or more components enriched in Golgi domains dedicated to processing and export (Patterson et al, 2008) would result in its preferential partitioning into these domains with consequent rapid progression through the Golgi and exclusion from a third, recycling domain, suggested by our data to be more represented in early Golgi cisternae. Such low-affinity interactions would be consistent with the previously reported diffusional mobility of VSVG accumulated in the Golgi complex at 20°C (Storrie et al, 1994).
While our work uncovers a novel role for the di-acidic export sequence, it is likely that diverse signals or features operate to assist other cargo proteins to progress rapidly through the Golgi. These may or may not coincide with their COPII recognition motifs. A number of ER export signals have been identified based on the ER retention of mutants (e.g. Ma et al, 2001; Farhan et al, 2004; Wang et al, 2004; D'Angelo et al, 2009; Duvernay et al, 2009; Zhang et al, 2011; Mazzo et al, 2013; Otsu et al, 2013), but in most cases, the precise site of their activity within the early secretory pathway has not been determined. It is interesting that in one well-studied case (D'Angelo et al, 2009), the signal (a C-terminal valine residue) mediates interaction with the Golgi proteins GRASP65 and -55, and not with COPII, suggesting that it promotes transport at the level of the Golgi, perhaps by restraining backward flux, and not at ER exit sites. Whether in other cases the ER distribution seen upon mutation of identified signals is caused by the deletion of recruitment to ER exit sites or, additionally or alternatively, by increased backward transport from the Golgi remains to be determined. In the light of the results presented here, it will be important to consider recycling as an additional important rate-limiting factor for cargo clearance of the early secretory pathway.
The role of membrane cargo protein cycling in the early secretory pathway: a futile or a useful phenomenon?
A general view of ER-to-plasma membrane transport that incorporates the observations of this study is presented in Fig9C. According to this view, rapid, synchronized, transport of cargo through the Golgi depends on the summation of two signal-mediated events: a signal that drives recruitment to ER exit sites and a signal that determines rapid transit through the Golgi and prevents recruitment into the retrograde pathway (Fig9C, left panel). In contrast, in the case of proteins lacking a Sec24-binding motif, the recruitment to COPII-coated vesicles is poor, but nonetheless can occur, unless exclusion mechanisms come into play (Ronchi et al, 2008). Once in the Golgi, in the absence of a positive signal, these proteins may access different Golgi domains by simple partitioning; the consequent inclusion into retrograde carriers further delays their forward transport through the Golgi (Fig9C, right panel). Because of the high surface-to-volume ratio in tubules, this phenomenon is probably more important for membrane than for soluble cargo. The fraction of cargo that partitions into Golgi domains dedicated to export exits to downstream compartments, and, once out of the Golgi, these molecules will have irreversibly escaped the early secretory pathway. Thus, we suggest that transport of such signal-deficient cargoes to the cell surface occurs by a mechanism akin to a Brownian ratchet.
Does this constitutive recycling play any useful role for the cell? One might speculate that revisiting the ER could be beneficial in some cases, giving cargo proteins that escape quality control at ER exit ports more than one chance to reach a mature folding status. The phenomenon of secondary quality control, involving return to the ER from the Golgi, is well known, but has been considered up till now to be signal-mediated (Yamamoto et al, 2001; Spasic et al, 2007; Vavassori et al, 2013). On the basis of the results reported here, such recycling may be common and not signal-mediated, so that many membrane proteins would have multiple chances to achieve correct folding/assembly. It is interesting to note that constitutive recycling of Golgi enzymes, which has been proposed to serve a quality control function (Cole et al, 1998; Storrie et al, 1998), proceeds through the Rab6-dependent pathway (Girod et al, 1999), as found here for outward-bound cargo. A further possible benefit of recycling is that this rate-limiting step in cargo export could provide an additional target for regulation: for example, post-translational modification of cargo as a consequence of signalling transduction pathways could result in alterations in their propensity to engage in cycling within the early secretory pathway.
Although it is reasonable to hypothesize a useful function for the recycling phenomenon that we have observed here, we also suggest that Golgi-to-ER retrograde cargo transport may be neither beneficial nor harmful, but may simply reflect the absence of selective pressure on many membrane proteins to evolve efficient export features. By simple partitioning, proteins that lack specific “transport-dedicated” features will reach the plasma membrane in any case, and, if they are stable, their steady-state distribution will be strongly skewed towards the cell surface. In this view, the presence of signals that determine efficient export would be restricted to those proteins that the cell (or an infecting virus) needs to remove from the ER rapidly. This could be the case, for example, for proteins that are badly tolerated by the ER, or for viral proteins, with the consequent optimization of release of new viral particles, or for proteins that the cell must rapidly ship to the surface in response to signalling pathways. For many other proteins, wasting time in the Golgi/ER circuit may be harmless, as long as in the end they reach their final destination. Future studies will further elucidate the relative weight of recycling in the forward transport of cargoes, as well as the mechanisms of signal-mediated avoidance of this pathway.
Materials and Methods
Antibodies and plasmids
The plasmids and primary antibodies used in this study are described in Supplementary Methods and in Table2, respectively. Anti-rabbit and anti-mouse Alexa 488 and anti-mouse Alexa 633 secondary antibodies were purchased from Life Technologies (Carlsbad, CA), anti-mouse DyLight 549-IgG from Jackson ImmunoResearch Laboratories (West Grove, PA). Anti-mouse and anti-rabbit peroxidase-conjugated secondary antibodies were from Thermo Scientific, Inc. (Rockford, IL) and Sigma-Aldrich, respectively.
Table 2.
Sources of primary antibodies used in this study
| Antibody | Source | Use |
|---|---|---|
| GFP—polyclonal | MBL International (Woburn, MA) | Immunoprecipitation |
| GFP—polyclonal | Abcam (Cambridge, UK) | Western blot |
| γ Adaptin—mAb | Sigma-Aldrich (St. Louis, MO) | Immunofluorescence and Western blot |
| δ Adaptin—mAb | DSHB (University of Iowa, Iowa) | Immunofluorescence and Western blot |
| Myc—mAb (clone 9e10) | Sigma-Aldrich (St. Louis, MO) | Immunofluorescence |
| Conformation-specific anti-VSVG mAb (clone IE9F9) | KeraFAST (Boston, MA) | Immunofluorescence |
| VAMP2/synaptobrevin2 polyclonal | Synaptic Systems (Goettingen, Germany) | Immunofluorescence |
| TGN38 mAb (clone 2/TGN38) | BD Transduction Laboratories | Immunofluorescence |
| ERGIC53 mAb | H.P. Hauri (Biozentrum, Basel, Switzerland) (Schweizer et al, 1988) | Immunofluorescence on HeLa cells |
| p58 polyclonal | Randy Scheckman (University of California at Berkeley) (Fromme et al, 2007) | Immunofluorescence on NRK cells |
Transfection, microinjection and temperature blocks
NRK and HeLa cells were either transiently transfected with the jetPEI system (Polyplus transfection, Illkirch, France), and analysed 24 h after exposure to the DNA, or microinjected in the nucleus, as previously described (Ronchi et al, 2008). Microinjected cells were incubated for 60–75 min to allow time for expression of the encoded protein; they were then either fixed with 4% paraformaldehyde (PFA), or further incubated at 20°C and then fixed, or imaged alive at the temperature indicated in the figure legends. For the temperature block experiments, cells were incubated in a refrigerated circulating water bath in Hepes-containing DMEM (Sigma-Aldrich). All experiments were performed in the presence of a protein synthesis inhibitor (50 μg/ml cycloheximide or 100 μg/ml puromycin, both from Sigma-Aldrich).
Fluorescence microscopy and photobleaching experiments
Imaging was performed with an LSM 510 Meta confocal microscope (Carl Zeiss, Inc.) equipped with an on-stage thermostated and humidified CO2 incubator and with autofocus software or an Axiovert 200M (Carl Zeiss) attached to a spinning disc confocal unit (UltraVIEW LCI, Perkin Elmer, Waltham, MA). All imaging was performed with a 63× Plan Apochromat lens (NA = 1.4). Unless otherwise specified, single confocal sections are shown in the figures.
PFA-fixed cells were processed for immunofluorescence as previously described (Bulbarelli et al, 2002). For live cell imaging, cells were kept in Imaging medium (DMEM without phenol red, 10% foetal bovine serum, 1% penicillin/streptomycin, 2 mM l-glutamine, 25 mM Hepes) supplemented with 0.3 units/ml OxyFluor (Oxyrase Inc., Mansfield, Ohio) and 15 mM dl-succinate. Photobleaching of fluorescent proteins was accomplished by scanning, with the pinhole wide open, 20–25 times, using, for EGFP the 488 nm line of the Argon laser at 100% power combined with the Diode 405 nm laser at 60% power, for mCerulean the 458 nm line of the Argon laser and the Diode 405 nm laser line both at 100%. Illustrations were prepared with the use of Adobe Photoshop software.
Energy depletion and H89 treatment
ATP was depleted from microinjected NRK cells by incubation for 10 min at 20°C in Hepes-containing DMEM supplemented with 10 mM NaN3 plus 10 mM 2-Deoxy-D-glucose (Sigma-Aldrich); cells were then imaged alive at 20°C in Imaging medium supplemented as above.
For H89 treatment, cell transfected with VSVG-EGFP or VSVGAxA-EGFP for 24 h at 39°C were pre-incubated at 32°C for 15 and 60 min, respectively, to obtain a partial accumulation of the proteins in the Golgi, and then imaged at 20°C in Imaging medium supplemented with 50 μM H89 (Sigma-Aldrich) for 1 h. In the case of FP-22, microinjected cells were incubated 75 min at 37°C and then imaged at 20°C in the presence of H89, as above.
Cy3-STxB internalization and VSVG surface labelling
Internalization of Cy3-STxB (a generous gift of L. Johannes, Institut Curie, Paris, France) was assayed as described in Johannes et al 1997. Briefly, HeLa cells transfected for 24 h at 39°C with VSVGAxA-EGFP were incubated for 20 min at 4°C in Hepes-containing DMEM in the presence of 20 nM Cy3-STxB to allow binding to the Gb3 receptor, washed three times and then incubated for a further 5 h at 32°C in DMEM to allow STxB internalization before fixation or live cell imaging.
To quantitatively assess VSVG surface labelling, NRK cells, transfected for 24 h at 39°C with either the WT or mutant VSVG-EGFP construct together with either WT or T27N Rab6, were brought to the permissive temperature, and surface expression of VSVG was monitored on non-permeabilized cells with an antibody against the lumenal domain (mAb clone IE9F9). At the time points indicated in Fig9, the cells were brought to 0°C, rinsed twice on ice with PBS++ (PBS plus 0.5 mM CaCl2 and 1 mM MgCl2), followed by a 20-min blocking step in the cold (PBS++ plus 1 mg/ml BSA), and subsequent incubation for 1 h at 4°C with the antibody. After three washes with PBS++, cells were fixed with 4% PFA for 10 min at 4°C and further 20 min at room temperature. After fixation, cells were exposed to secondary antibody according to standard procedures (Bulbarelli et al, 2002).
EndoH treatment
Transfected cells were lysed in 50 mM Tris–HCl pH 6.8, 2% SDS supplemented with a protease inhibitor cocktail and incubated for 3 min in a boiling water bath. A total of 10 μg of protein (determined by the BCA assay, Pierce) were diluted fourfold to obtain final concentrations of 50 mM Tris–HCl pH 6.8, 0.5% SDS and 40 mM DTT, heated again for 10 min at 100°C and digested with 1 unit of EndoH (New England Biolabs, Ipswich, MA). Samples were analysed by SDS–PAGE/Western blotting/ECL (Western Lightning Plus-ECL, Perkin Elmer).
Immunoprecipitation
HeLa cells, transfected with VSVG-EGFP at 39.3°C, were incubated for 90 min at 20°C in DMEM supplemented with Hepes, scraped on ice, pelleted and lysed in 150 mM NaCl, 50 mM Tris–HCl, pH 7.4, 1% NP-40 (Sigma-Aldrich) supplemented with protease inhibitors. After centrifugation at 12,000 g for 10 min, the supernatant was incubated with 2.4 μg of anti-GFP antibodies for 2 h at 4°C and then with protein G-conjugated agarose beads (GE Healthcare) for a further 2 h. Samples were analysed by silver staining of SDS-PA gels and for adaptin subunits and GFP by Western Blot/ECL.
Acknowledgments
In addition to the colleagues who kindly provided the reagents listed in the Materials and Methods section, we would like to thank Dino Fesce (Università dell'Insubria) for assistance with data analysis, Pietro De Camilli (Yale University School of Medicine) for critically reading the manuscript and the Monzino Foundation (Milano, Italy) for its generous gift of the LSM 510 Meta and Perkin Elmer Ultraview confocal microscopes. This work was supported by Investigator Grant 2009 from the Italian Association for Cancer Research (AIRC), the CNR Research Project on Aging, Regione Lombardia Project MbMM-convenzione no. 18099/RCC. MF was a doctoral student supported by the University of Milan and subsequently recipient of a postdoctoral fellowship from the Fondazione Confalonieri (Milan).
Author contributions
MF: planned experiments, carried out experiments, analysed data, wrote the manuscript. SFC: planned experiments, carried out experiments, analysed data, wrote the manuscript. NB: planned experiments, analysed data, wrote the manuscript.
Conflict of interest
The authors declare that they have no conflict of interest.
Supplementary information for this article is available online: http://emboj.embopress.org
References
- Bamberger MJ, Lane MD. Assembly of very low density lipoprotein in the hepatocyte. Differential transport of apoproteins through the secretory pathway. J Biol Chem. 1988;263:11868–11878. [PubMed] [Google Scholar]
- Bannykh SI, Bannykh GI, Fish KN, Moyer BD, Riordan JR, Balch WE. Traffic pattern of cystic fibrosis transmembrane regulator through the early exocytic pathway. Traffic. 2000;1:852–870. doi: 10.1034/j.1600-0854.2000.011105.x. [DOI] [PubMed] [Google Scholar]
- Boncompain G, Divoux S, Gareil N, de Forges H, Lescure A, Latreche L, Mercanti V, Jollivet F, Raposo G, Perez F. Synchronization of secretory protein traffic in populations of cells. Nat Methods. 2012;9:493–498. doi: 10.1038/nmeth.1928. [DOI] [PubMed] [Google Scholar]
- Bremser M, Nickel W, Schweikert M, Ravazzola M, Amherdt M, Hughes CA, Sollner TH, Rothman JE, Wieland FT. Coupling of coat assembly and vesicle budding to packaging of putative cargo receptors. Cell. 1999;96:495–506. doi: 10.1016/s0092-8674(00)80654-6. [DOI] [PubMed] [Google Scholar]
- Bulbarelli A, Sprocati T, Barberi M, Pedrazzini E, Borgese N. Trafficking of tail-anchored proteins: transport from the endoplasmic reticulum to the plasma membrane and sorting between surface domains in polarised epithelial cells. J Cell Sci. 2002;115:1689–1702. doi: 10.1242/jcs.115.8.1689. [DOI] [PubMed] [Google Scholar]
- Carter RE, Sorkin A. Endocytosis of functional epidermal growth factor receptor-green fluorescent protein chimera. J Biol Chem. 1998;273:35000–35007. doi: 10.1074/jbc.273.52.35000. [DOI] [PubMed] [Google Scholar]
- Cole NB, Ellenberg J, Song J, DiEuliis D, Lippincott-Schwartz J. Retrograde transport of Golgi-localized proteins to the ER. J Cell Biol. 1998;140:1–15. doi: 10.1083/jcb.140.1.1. [DOI] [PMC free article] [PubMed] [Google Scholar]
- Cosson P, Letourneur F. Coatomer interaction with di-lysine endoplasmic reticulum retention motifs. Science. 1994;263:1629–1631. doi: 10.1126/science.8128252. [DOI] [PubMed] [Google Scholar]
- Cosson P, Lefkir Y, Démollière C, Letourneur F. New COP1-binding motifs involved in ER retrieval. EMBO J. 1998;17:6863–6870. doi: 10.1093/emboj/17.23.6863. [DOI] [PMC free article] [PubMed] [Google Scholar]
- D'Angelo G, Prencipe L, Iodice L, Beznoussenko G, Savarese M, Marra P, Di Tullio G, Martire G, De Matteis MA, Bonatti S. GRASP65 and GRASP55 sequentially promote the transport of C-terminal valine-bearing cargos to and through the Golgi complex. J Biol Chem. 2009;284:34849–34860. doi: 10.1074/jbc.M109.068403. [DOI] [PMC free article] [PubMed] [Google Scholar]
- Doms RW, Russ G, Yewdell JW. Brefeldin A redistributes resident and itinerant Golgi proteins to the endoplasmic reticulum. J Cell Biol. 1989;109:61–72. doi: 10.1083/jcb.109.1.61. [DOI] [PMC free article] [PubMed] [Google Scholar]
- Dukhovny A, Yaffe Y, Shepshelovitch J, Hirschberg K. The length of cargo-protein transmembrane segments drives secretory transport by facilitating cargo concentration in export domains. J Cell Sci. 2009;122:1759–1767. doi: 10.1242/jcs.039339. [DOI] [PubMed] [Google Scholar]
- Duvernay MT, Dong C, Zhang X, Robitaille M, Hebert TE, Wu G. A single conserved leucine residue on the first intracellular loop regulates ER export of G protein-coupled receptors. Traffic. 2009;10:552–566. doi: 10.1111/j.1600-0854.2009.00890.x. [DOI] [PMC free article] [PubMed] [Google Scholar]
- Farhan H, Korkhov VM, Paulitschke V, Dorostkar MM, Scholze P, Kudlacek O, Freissmuth M, Sitte HH. Two discontinuous segments in the carboxyl terminus are required for membrane targeting of the rat gamma-aminobutyric acid transporter-1 (GAT1) J Biol Chem. 2004;279:28553–28563. doi: 10.1074/jbc.M307325200. [DOI] [PubMed] [Google Scholar]
- Fromme JC, Ravazzola M, Hamamoto S, Al-Balwi M, Eyaid W, Boyadjiev SA, Cosson P, Schekman R, Orci L. The genetic basis of a craniofacial disease provides insight into COPII coat assembly. Dev Cell. 2007;13:623–634. doi: 10.1016/j.devcel.2007.10.005. [DOI] [PMC free article] [PubMed] [Google Scholar]
- Gallione CJ, Rose JK. A single amino acid substitution in a hydrophobic domain causes temperature-sensitive cell-surface transport of a mutant viral glycoprotein. J Virol. 1985;54:374–382. doi: 10.1128/jvi.54.2.374-382.1985. [DOI] [PMC free article] [PubMed] [Google Scholar]
- Giannotta M, Ruggiero C, Grossi M, Cancino J, Capitani M, Pulvirenti T, Consoli GM, Geraci C, Fanelli F, Luini A, Sallese M. The KDEL receptor couples to Galphaq/11 to activate Src kinases and regulate transport through the Golgi. EMBO J. 2012;31:2869–2881. doi: 10.1038/emboj.2012.134. [DOI] [PMC free article] [PubMed] [Google Scholar]
- Girod A, Storrie B, Simpson JC, Johannes L, Goud B, Roberts LM, Lord JM, Nilsson T, Pepperkok R. Evidence for a COP-I-independent transport route from the Golgi complex to the endoplasmic reticulum. Nature Cell Biol. 1999;1:423–430. doi: 10.1038/15658. [DOI] [PubMed] [Google Scholar]
- Johannes L, Tenza D, Antony C, Goud B. Retrograde transport of KDEL-bearing B-fragment of Shiga toxin. J Biol Chem. 1997;272:19554–19561. doi: 10.1074/jbc.272.31.19554. [DOI] [PubMed] [Google Scholar]
- Lee TH, Linstedt AD. Potential role for protein kinases in regulation of bidirectional endoplasmic reticulum-to-Golgi transport revealed by protein kinase inhibitor H89. Mol Biol Cell. 2000;11:2577–2590. doi: 10.1091/mbc.11.8.2577. [DOI] [PMC free article] [PubMed] [Google Scholar]
- Lippincott-Schwartz J, Yuan LC, Bonifacino JS, Klausner RD. Rapid redistribution of Golgi proteins into the ER in cells treated with brefeldin A: evidence for membrane cycling from Golgi to ER. Cell. 1989;56:801–813. doi: 10.1016/0092-8674(89)90685-5. [DOI] [PMC free article] [PubMed] [Google Scholar]
- Ma DK, Zerangue N, Lin YF, Collins A, Yu M, Jan YN, Jan LY. Role of ER export signals in controlling surface potassium channel numbers. Science. 2001;291:316–319. doi: 10.1126/science.291.5502.316. [DOI] [PubMed] [Google Scholar]
- Mancias JD, Goldberg J. Structural basis of cargo membrane protein discrimination by the human COPII coat machinery. EMBO J. 2008;27:2918–2928. doi: 10.1038/emboj.2008.208. [DOI] [PMC free article] [PubMed] [Google Scholar]
- Matlin KS, Simons K. Reduced temperature prevents transfer of a membrane glycoprotein to the cell surface but does not prevent terminal glycosylation. Cell. 1983;34:233–243. doi: 10.1016/0092-8674(83)90154-x. [DOI] [PubMed] [Google Scholar]
- Mazzo F, Pistillo F, Grazioso G, Clementi F, Borgese N, Gotti C, Colombo SF. Nicotine-modulated subunit stoichiometry affects stability and trafficking of alpha3beta4 nicotinic receptor. J Neurosci. 2013;33:12316–12328. doi: 10.1523/JNEUROSCI.2393-13.2013. [DOI] [PMC free article] [PubMed] [Google Scholar]
- Mironov AA, Beznoussenko GV, Nicoziani P, Martella O, Trucco A, Kweon HS, Di Giandomenico D, Polishchuk RS, Fusella A, Lupetti P, Berger EG, Geerts WJ, Koster AJ, Burger KN, Luini A. Small cargo proteins and large aggregates can traverse the Golgi by a common mechanism without leaving the lumen of cisternae. J Cell Biol. 2001;155:1225–1238. doi: 10.1083/jcb.200108073. [DOI] [PMC free article] [PubMed] [Google Scholar]
- Nishimura N, Balch WE. A di-acidic signal required for selective export from the endoplasmic reticulum. Science. 1997;277:556–558. doi: 10.1126/science.277.5325.556. [DOI] [PubMed] [Google Scholar]
- Nishimura N, Bannykh S, Slabough S, Matteson J, Altschuler Y, Hahn K, Balch WE. A di-acidic (DXE) code directs concentration of cargo during export from the endoplasmic reticulum. J Biol Chem. 1999;274:15937–15946. doi: 10.1074/jbc.274.22.15937. [DOI] [PubMed] [Google Scholar]
- Nishimura N, Plutner H, Hahn K, Balch WE. The delta subunit of AP-3 is required for efficient transport of VSV-G from the trans-Golgi network to the cell surface. Proc Natl Acad Sci USA. 2002;99:6755–6760. doi: 10.1073/pnas.092150699. [DOI] [PMC free article] [PubMed] [Google Scholar]
- Otsu W, Kurooka T, Otsuka Y, Sato K, Inaba M. A new class of endoplasmic reticulum export signal PhiXPhiXPhi for transmembrane proteins and its selective interaction with Sec24C. J Biol Chem. 2013;288:18521–18532. doi: 10.1074/jbc.M112.443325. [DOI] [PMC free article] [PubMed] [Google Scholar]
- Patterson GH, Hirschberg K, Polishchuk RS, Gerlich D, Phair RD, Lippincott-Schwartz J. Transport through the Golgi apparatus by rapid partitioning within a two-phase membrane system. Cell. 2008;133:1055–1067. doi: 10.1016/j.cell.2008.04.044. [DOI] [PMC free article] [PubMed] [Google Scholar]
- Pedrazzini E, Villa A, Borgese N. A mutant cytochrome b5 with a lengthened membrane anchor escapes from the endoplasmic reticulum and reaches the plasma membrane. Proc Natl Acad Sci USA. 1996;93:4207–4212. doi: 10.1073/pnas.93.9.4207. [DOI] [PMC free article] [PubMed] [Google Scholar]
- Ronchi P, Colombo S, Francolini M, Borgese N. Transmembrane domain-dependent partitioning of membrane proteins within the endoplasmic reticulum. J Cell Biol. 2008;181:105–118. doi: 10.1083/jcb.200710093. [DOI] [PMC free article] [PubMed] [Google Scholar]
- Rottger S, White J, Wandall HH, Olivo JC, Stark A, Bennett EP, Whitehouse C, Berger EG, Clausen H, Nilsson T. Localization of three human polypeptide GalNAc-transferases in HeLa cells suggests initiation of O-linked glycosylation throughout the Golgi apparatus. J Cell Sci. 1998;111(Pt 1):45–60. doi: 10.1242/jcs.111.1.45. [DOI] [PubMed] [Google Scholar]
- Schweizer A, Fransen JAM, Bachi T, Ginsel L, Hauri H-P. Identification, by a monoclonal antibody, of a 53kD protein associated with a tubulo-vesicular compartment at the cis-side of the Golgi apparatus. J Cell Biol. 1988;107:1643–1653. doi: 10.1083/jcb.107.5.1643. [DOI] [PMC free article] [PubMed] [Google Scholar]
- Sevier CS, Weisz OA, Davis M, Machamer CE. Efficient export of the vesicular stomatitis virus G protein from the endoplasmic reticulum requires a signal in the cytoplasmic tail that includes both tyrosine-based and di-acidic motifs. Mol Biol Cell. 2000;11:13–22. doi: 10.1091/mbc.11.1.13. [DOI] [PMC free article] [PubMed] [Google Scholar]
- Spang A. Retrograde traffic from the Golgi to the endoplasmic reticulum. Cold Spring Harb Perspect Biol. 2013;5:a013391. doi: 10.1101/cshperspect.a013391. [DOI] [PMC free article] [PubMed] [Google Scholar]
- Spasic D, Raemaekers T, Dillen K, Declerck I, Baert V, Serneels L, Fullekrug J, Annaert W. Rer1p competes with APH-1 for binding to nicastrin and regulates gamma-secretase complex assembly in the early secretory pathway. J Cell Biol. 2007;176:629–640. doi: 10.1083/jcb.200609180. [DOI] [PMC free article] [PubMed] [Google Scholar]
- Storrie B, Pepperkok R, Stelzer EH, Kreis TE. The intracellular mobility of a viral membrane glycoprotein measured by confocal microscope fluorescence recovery after photobleaching. J Cell Sci. 1994;107(Pt 5):1309–1319. doi: 10.1242/jcs.107.5.1309. [DOI] [PubMed] [Google Scholar]
- Storrie B, White J, Rottger S, Stelzer EH, Suganuma T, Nilsson T. Recycling of golgi-resident glycosyltransferases through the ER reveals a novel pathway and provides an explanation for nocodazole-induced Golgi scattering. J Cell Biol. 1998;143:1505–1521. doi: 10.1083/jcb.143.6.1505. [DOI] [PMC free article] [PubMed] [Google Scholar]
- Storrie B, Micaroni M, Morgan GP, Jones N, Kamykowski JA, Wilkins N, Pan TH, Marsh BJ. Electron tomography reveals Rab6 is essential to the trafficking of trans-Golgi clathrin and COPI-coated vesicles and the maintenance of Golgi cisternal number. Traffic. 2012;13:727–744. doi: 10.1111/j.1600-0854.2012.01343.x. [DOI] [PMC free article] [PubMed] [Google Scholar]
- Tanigawa G, Orci L, Amherdt M, Ravazzola M, Helms JB, Rothman JE. Hydrolysis of bound GTP by ARF protein triggers uncoating of Golgi-derived COP-coated vesicles. J Cell Biol. 1993;123:1365–1371. doi: 10.1083/jcb.123.6.1365. [DOI] [PMC free article] [PubMed] [Google Scholar]
- Thomas DC, Brewer CB, Roth MG. Vesicular stomatitis virus glycoprotein contains a dominant cytoplasmic basolateral sorting signal critically dependent upon a tyrosine. J Biol Chem. 1993;268:3313–3320. [PubMed] [Google Scholar]
- Thomas DC, Roth MG. The basolateral targeting signal in the cytoplasmic domain of glycoprotein G from vesicular stomatitis virus resembles a variety of intracellular targeting motifs related by primary sequence but having diverse targeting activities. J Biol Chem. 1994;269:15732–15739. [PubMed] [Google Scholar]
- Vavassori S, Cortini M, Masui S, Sannino S, Anelli T, Caserta IR, Fagioli C, Mossuto MF, Fornili A, van Anken E, Degano M, Inaba K, Sitia R. A pH-regulated quality control cycle for surveillance of secretory protein assembly. Mol Cell. 2013;50:783–792. doi: 10.1016/j.molcel.2013.04.016. [DOI] [PMC free article] [PubMed] [Google Scholar]
- Wang X, Matteson J, An Y, Moyer B, Yoo JS, Bannykh S, Wilson IA, Riordan JR, Balch WE. COPII-dependent export of cystic fibrosis transmembrane conductance regulator from the ER uses a di-acidic exit code. J Cell Biol. 2004;167:65–74. doi: 10.1083/jcb.200401035. [DOI] [PMC free article] [PubMed] [Google Scholar]
- White J, Johannes L, Mallard F, Girod A, Grill S, Reinsch S, Keller P, Tzschaschel B, Echard A, Goud B, Stelzer EH. Rab6 coordinates a novel Golgi to ER retrograde transport pathway in live cells. J Cell Biol. 1999;147:743–760. doi: 10.1083/jcb.147.4.743. [DOI] [PMC free article] [PubMed] [Google Scholar]
- Yamamoto K, Fujii R, Toyofuku Y, Saito T, Koseki H, Hsu VW, Aoe T. The KDEL receptor mediates a retrieval mechanism that contributes to quality control at the endoplasmic reticulum. EMBO J. 2001;20:3082–3091. doi: 10.1093/emboj/20.12.3082. [DOI] [PMC free article] [PubMed] [Google Scholar]
- Yeo KT, Parent JB, Yeo TK, Olden K. Variability in transport rates of secretory glycoproteins through the endoplasmic reticulum and Golgi in human hepatoma cells. J Biol Chem. 1985;260:7896–7902. [PubMed] [Google Scholar]
- Zhang X, Dong C, Wu QJ, Balch WE, Wu G. Di-acidic motifs in the membrane-distal C termini modulate the transport of angiotensin II receptors from the endoplasmic reticulum to the cell surface. J Biol Chem. 2011;286:20525–20535. doi: 10.1074/jbc.M111.222034. [DOI] [PMC free article] [PubMed] [Google Scholar]
Associated Data
This section collects any data citations, data availability statements, or supplementary materials included in this article.