

Abstract
Affymetrix GeneChips were used to measure RNA abundance for ≈13,500 Drosophila genes in young, old, and 100% oxygen-stressed flies. Data were analyzed by using a recently developed background correction algorithm and a robust multichip model-based statistical analysis that dramatically increased the ability to identify changes in gene expression. Aging and oxidative stress responses shared the up-regulation of purine biosynthesis, heat shock protein, antioxidant, and innate immune response genes. Results were confirmed by using Northerns and transgenic reporters. Immune response gene promoters linked to GFP allowed longitudinal assay of gene expression during aging in individual flies. Immune reporter expression in young flies was partially predictive of remaining life span, suggesting their potential as biomonitors of aging.
One of the proximal causes of aging may be oxidative damage (1–3). Oxidatively damaged macromolecules accumulate in every aging organism examined, and oxidative damage is implicated in the etiology of virtually every human aging-related disease. Overexpression of the antioxidant enzyme superoxide dismutase is sufficient to extend the life span of Drosophila (4–6), and certain single gene mutations that increase life span in Caenorhabditis elegans, Drosophila, and mouse correlate with increased oxidative stress resistance (3, 7–10). Advances in microarray technology coupled with recently developed bioinformatics techniques prompted a reexamination of the relationship between aging and oxidative stress responses in Drosophila (11, 12).
Materials and Methods
Microarray Data Analyses. Seventeen Affymetrix GeneChip Drosophila Genome Array DrosGenome1 were used to monitor the expression of 13,500 predicted transcripts from the annotation of the Drosophila genome, by measuring fluorescence from genespecific oligos. After background correction and normalization, transcripts abundance was estimated by using fluorescence signal intensities. The Affymetrix microarray consists of 196,000 oligos of 25 base pairs with a perfect match (PM) sequence, each corresponding to a specific region of a gene. For each PM sequence, there is also a corresponding mismatch (MM) oligo that differs by one base (13). Background correction is one of the key issues in analyzing microarray data. Affymetrix GeneChip technology uses MM oligos to estimate the background signal. Previous studies have shown that the information content of the mismatch oligos is not well defined, and therefore a direct subtraction of MM is unlikely to be useful. For this reason, a background correction method based on oligo sequence information was developed and implemented.
The key idea of the proposed background correction is the ability to estimate the nonspecific components of PM and MM signals directly from complete oligos sequence information, available at the Affymetrix NetAffx Analysis Center (www.affymetrix.com/analysis/index.affx).
It has been shown that the Langmuir absorbtion isotherm thoroughly captures the kinetics of GeneChip hybridization (14). The average interfeature distance along with the Affymetrix GeneChip probe selection criteria prohibit significant oligo–oligo interactions. Steric hindrance effects are negligible for working concentration range (15). Thus, these effects are assumed to be insignificant. Forman et al. (15) found that saturation occurs within the 200–1,000 pm concentration range, which greatly exceeds the average working concentration range used for Affymetrix GeneChips. Considering the linear regime region of the isotherm, we split the PM and MM signals into specific and nonspecific components and propose the following model:
 |
[1] |
where K = exp(- ΔG/RT) is the reaction rate constant, ΔGi is the free energy of duplex formation, [c] is the specific concentration, [ns] is the nonspecific concentration, R is a Boltzmann constant, T is temperature, and ε is a random term.
Introducing ratios of specific and nonspecific signals on PM and MM, we obtain
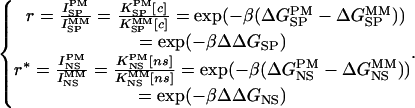 |
[2] |
Free energies of heteroduplex formation were calculated by using a nearest-neighbor model (16), where the total difference in the free energy of the zipped and unzipped states of a DNA duplex can be approximated by
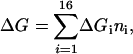 |
where each oligonucleotide duplex is given by subscript i, the number of dinucleotides of ith type is ni, and ΔGi are the free energies for 16 possible nearest-neighbor stacking interactions. Although nearest-neighbor base pair effects in solution have been extensively studied in the past, direct application of thermodynamic parameters obtained from solution is not suitable for microarray data because of the numerous uncounted factors such as steric effects, RNA secondary structure, and probe–probe interactions. Instead, we directly estimate these ΔGi parameters by fitting them to a publicly available spike-in study data set conducted by GeneLogic (Gaithersburg, MD). The GeneLogic spike-in study consists of a Latin square design with triplicates using 11 bacterial controls on a human HG-u95A version 1 chip with concentrations ranging from 0 to 100 pM (http://qolotus02.genelogic.com/datasets.nsf). Two sets of 18 parameters (16 free energies plus two initiation terms) were separately fitted to the spike-in study data set. At maximum concentration, the background effects are assumed to be insignificant, so that most of the observed intensity is caused by the specific component of the signal. Therefore; the set of specific (SP) nearest-neighbor parameters was extracted from the maximum concentration point of the GeneLogic spike-in study data set. Nonspecific (NS) nearest-neighbor parameters were extracted at zero concentration spike-in data assuming that the specific component of the signal is absent.
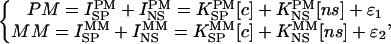
When determining ΔΔGSP, the difference in gene-specific binding free energy of PM and MM, a set of SP parameters was used:  , where
  is free energy of nearest-neighbor stacking interaction at the 13th position of the mismatch. To estimate ΔΔGNS, the difference in nonspecific binding free energy of PM and MM, NS parameters were used and the difference in the free energy of heteroduplex formation in PM and MM was directly calculated as
 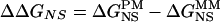 .
.
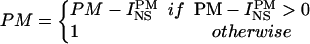
Once r and r* were estimated, the nonspecific fraction of PM signal was subtracted according to the following rule:
 |
[3] |
The purpose of normalization was to identify and remove systematic sources of variation so that comparisons between chips could be obtained. The obscuring sources of variation can have many different effects on the data. Unless arrays are appropriately normalized, comparing data from different arrays can lead to misleading results. A quantile normalization method proposed by Bolstad et al. (17) was used, as implemented in bioconductor (18). The purpose of the quantile method was to make the distribution of oligo intensities for each chip in the experiment the same.
Robust Model-Based Gene Expression Data Analysis. Currently, several competing measures of expression have been developed, including Affymetrix mas 5.1 expression values, the dChip model-based expression index, which is a multiplicative linear model (19), and the robust multiarray average (RMA), which is an additive linear model (20). RMA is based on a model fit that is more robust than ANOVA for examining the significance of the various factors in a multifactor model that is highly resistant to extreme values. The specific model used was log2(corrected PM) = grand effect + chip effect + oligo effect + error.
A robust linear model procedure rlm() was used, as available in the open R-project, a language and environment for statistical computing and graphics (www.r-project.org). A 17 (no. of chips) × 14 (no. of oligos) matrix was constructed for each gene, and the average measure of gene expression was calculated for each group (Y, Old, O2).
Gene Expression Data Analysis. Significance analysis of microarrays (21), a supervised learning software for genomic expression data mining, was applied to the extracted gene expression measures to test for differentially expressed genes. Results were subjected to strict corrections to control for false discovery rate (FDR). FDR in the 25° experiment was in [0.26, 1.39], leading to false significant numbers in the [11, 61] range. FDR in 29° experiment was in [0.24, 1.09], leading to false significant numbers in the [21, 114] range.
A total of 913 genes were found to change with age, 593 were changed in the O2 condition, and 251 changed in both O2 and old. The significance of the O2 vs. Old overlap was calculated by using Monte Carlo simulations. In each simulation, we randomly assigned observed intensities were made to a set of D. melanogaster genes for two conditions, and the overlap was determined. The probability of the observed overlap arising by chance is infinitesimal under the assumption that all genes are liable to age-specific changes. To assess the potential contribution of a smaller gene pool, one can diminish the number of genes that are capable of going up/down with age while simulating the overlap. If the set of these genes is reduced to 3,000 (≈ 21% of the whole genome) the P value is still highly significant at 1.5 E-10.
Additional details are available in Supporting Text, Tables 1–12, and Figs. 5–7, which are published as supporting information on the PNAS web site.
Results and Discussion
To reduce inbreeding depression of longevity, flies were male hybrid progeny of two common laboratory strains. Young flies (“Y”) were 10 days old, old flies (“Old”) were 61 days old (≈50% survival of the cohort, Fig. 7). Oxygen-stressed (“O2”) were 3-day-old flies subjected to 100% oxygen atmosphere for 7 days (≈50% survival of the cohort). The 100% oxygen stress was chosen because it appears to be a more specific oxidative stress than paraquat, which may also deplete NADPH (22, 23). Each condition (Y, O2, Old) had five to six replicates of 30 flies each. RNA was isolated from each replicate and used to prepare probe for one GeneChip.
On the GeneChip each gene is represented by 14 oligos (of 25 nucleotides each) that correspond to selected regions of the gene's transcript (called PM oligos). For each PM oligo, there is a corresponding MM oligo that differs by one base near the center. Fluorescently labeled probe was generated from the fly RNA samples, and hybridized with the chips. The amount of fluorescence intensity (“signal”) associated with each oligo will therefore have a specific component due to binding of the specific gene's sequences in the probe, as well as a nonspecific component due to the binding of other (background) probe sequences. Because the MM oligo will have a lower affinity for the specific gene's sequence, its signal can be used to estimate background. However, the MM oligo will also have an altered affinity for background RNAs, and this must be taken into account. For example, some MM oligos will bind total probe sequences better than the corresponding PM oligos. Therefore, if one simply subtracts the MM signal from the PM signal (PM - MM), it leads to negative expression values (24). By applying a physical model of the hybridization process to complete oligo sequence information available at the Affymetrix web site, it is possible to calculate and subtract only the nonspecific component of PM (PM - bg).
The effect of the background correction is presented for four representative genes (Fig. 1 A–D). A robust linear model was applied to each of the initial models (PM, PM - MM, and PM - bg) and the resultant gene expression levels are plotted for each chip. Chips 1–6 are Y, 7–12 are O2, and 13–17 are Old. For the shsp gene l (2)Efl, PM - bg is more sensitive to gene expression changes than either PM or PM - MM (Fig. 1 A). For the hsp40-class gene DnaJ-like-1, PM - MM and PM - bg performed similarly, suggesting that, in this case, MM was a fairly good estimate of the nonspecific component of PM (Fig. 1C). For the immune peptide gene Defensin (Fig. 1B), the PM - MM signal is very noise-prone because of variance in MM, whereas PM is insensitive to the increased expression in O2 (chips 7–12). In contrast, PM - bg reveals increased Defensin expression in both O2 and Old. Finally, for Alkaline phosphatase-4, PM - bg reveals changes in gene expression that are not pronounced in PM only, and are likely to be overestimated by PM - MM (Fig. 1D).
Fig. 1.

GeneChip analysis of gene expression changes during aging and oxidative stress. Shown are values predicted from background correction algorithm (red), PM-only (blue) and PM-MM (green). (A) l (2)Efl.(B) Defensin.(C) DNAJ-like-1.(D) Alkaline phosphatase 4.(E) Venn diagram of differential gene expression in O2 and Old flies; data are from Table 1.
Pairwise comparisons between Y and Old and between Y and O2 for all 13,600 genes identified genes that were up-regulated, down-regulated, or unchanged in each case. Comparison of the responses to aging and oxidative stress revealed common and unique features (Table 1), and results are summarized in a Venn diagram (Fig. 1E). An almost identical aging response was observed with flies cultured at 29°C, where life span is much shorter (Fig. 2B and additional data not shown). Expression levels for 12 representative genes were confirmed by Northern blot, and no discrepancies were observed (Fig. 2 and Table 11).
Fig. 2.

Northern analysis of selected genes (even-numbered lanes, 5 μgofRNA = 1×; odd-numbered lanes, 10 μgofRNA = 2×). (A) Flies cultured at 25°C. Shown are Y (lanes 1 and 2), O2 (lanes 3 and 4), and Old (lanes 5 and 6), as indicated. (B) Flies cultured at 29°C. Shown are Y (lanes 1 and 2) and Old (lanes 3 and 4). (C) Time course Northern of flies cultured at 25°C. RNA isolated from the same cohort of flies at increasing ages, as indicated (lanes 1–12). 60′ is 60-day-old flies from an independent cohort (lanes 13 and 14). Quantitation is presented in Materials and Methods and Table 11.
Both aging and oxidative stress were characterized by upregulation of hsp genes, antioxidant genes and immune response genes (Figs. 1 and 2, and Tables 1, 2, and 12). The increased expression of hsp70, hsp22, and hsp23 during aging has been previously analyzed (25–28). Both hsp22 and hsp70 are transcriptionally up-regulated during aging, and this requires heat shock elements (HSEs) in the promoters. The time course of hsp70 induction during aging is accelerated by mutations in catalase or Cu/ZnSOD, suggesting that it is a response to oxidative stress. Hsp22 exhibits one of the largest known increases in expression during aging, but its response to oxidative stress had not been previously tested. Among the largest increases in expression observed during aging were those for immune peptide genes, including Metchnikowin, Defensin, and Attacin A, as identified by GeneChip analysis (29). Aging-related induction of the PGRP-LC gene involved in immune response had previously been suggested by studies of a P element “enhancer trap” inserted at that locus (30). Strikingly, in the present study, the majority of the known immune response genes were found to be induced during aging, and many of these immune response genes were also induced in response to oxidative stress.
The computational approaches revealed additional features of the aging response that were shared by oxidative stress. These included the up-regulation of the entire purine biosynthetic pathway (12 genes) including ade3 and Nmdmc (Figs. 2 and 5 and Table 3). In contrast, pyrimidine pathway enzymes were unchanged. Purine biosynthesis may be increased due to the preferential susceptibility of purines to oxidative damage and a need to replace them, and/or may reflect a particular need for additional purines, such as in production of ATP or NAD(P)H, in old and oxidatively stressed cells. The purine derivative urate is an antioxidant required for normal oxidative stress resistance and life span in Drosophila (31), and the purine nicotinamide has recently been implicated in life span regulation in yeast (32). Aging and oxidative stress both caused up-regulation of Cct-1, which encodes the rate limiting enzyme in phosphatidylcholine synthesis (33). Cct-1 enzyme is activated by oxidized lipids (34), and Cct-1 gene expression level may affect Drosophila life span (35). Aging and oxidative stress responses also shared the down-regulation of numerous proteasome subunits and other proteases (41 genes), alkaline phosphatases (eight genes), and triacylglycerol lipases (four genes). The decrease in protease expression might be related to the decreased rate of protein synthesis and turnover with age reported for Drosophila and other organisms.
The data demonstrate a large overlap in the aging and oxidative stress responses (Fig. 1E), and are therefore consistent with the hypothesis that oxidative stress is a significant component of aging. If every gene is considered, the probability of observing this overlap by chance is infinitesimal (Materials and Methods). Many of the changes in gene expression during Drosophila aging are conserved in other species, where the same (or related) genes exhibit the same response. Examples include the up-regulation of stress response genes, including GSTs, hsp70-, hsp60-, hsp40-, and small hsp-class genes, in Drosophila (refs. 11 and 29 and this study), C. elegans (36), mouse (37, 38), and human (39).
The total percentage of tested genes found to change during aging was 7%, which is similar to the 9% recently reported for another GeneChip analysis of aging (29). The overlap between the aging and oxidative stress responses is indicated by the fact that 38% of the genes whose expression changed during aging were also affected by 100% oxygen in the same direction. This is similar to the 33% overlap reported in an earlier DNA microarray comparison of the aging and paraquat responses that surveyed about one-third of the genome (11). However, the latter study reported that only 0.6% of genes tested changed during aging. This difference is likely due to advances in technology and statistical methods.
In a recent GeneChip study of aging and dietary restriction, 50% of the genes affected by aging were also affected by dietary restriction in the opposite direction (29). One way to interpret these data are that the gene expression pattern characteristic of aging is accelerated by treatments that accelerate aging (i.e., oxidative stressors), and delayed by treatments that delay aging such as dietary restriction. One of the current models for the mechanism of dietary restriction is that it reduces oxidative stress (3).
Differences in the aging and oxidative stress responses were also observed (Fig. 1E). Unique to aging was a small (1.5–2 fold), but across-the-board, down-regulation of energy metabolism genes. These included oxidative phosphorylation (42 genes), ATP synthetase (nine genes), and the tricarboxylic acid (TCA) cycle (13 genes). This might be related to the reported loss of normal and functional mitochondria with age (40–42). Decreases in energy metabolism gene expression with age have been reported for Drosophila and mouse (11, 29, 37). Other differences were the down-regulation of different sets of transporters and the down-regulation of additional proteases in O2. There are at least two nonexclusive possibilities for the differences observed between the aging and oxidative stress responses: first, the acute stress of 100% oxygen will be an imperfect model for the chronic oxidative stress of aging; there are several different types of ROS with various subcellular sources, targets and defenses. Second, the aging pattern of gene expression may include changes due to additional, as-yet-unknown causes of aging in addition to oxidative stress.
Aging in Drosophila has been reported to be associated with the increased expression of innate immune response genes as assayed by GeneChips or an enhancer trap (29, 30), and that result was confirmed by GeneChips and Northern blots in these experiments (Fig. 2 and Table 1). Aging was characterized by the dramatic induction of antimicrobial peptide genes, with increases ranging from 5- to 100-fold. Oxygen stress samples had a smaller but significant increase in many of these genes, typically 2- to 5-fold. Time course Northerns confirmed the progressive induction of heat shock protein and immune response genes with age, and revealed slightly different patterns of accumulation (Fig. 2C).
Reporter constructs consisting of the hsp22 promoter (-314 to +275) and the hsp70 promoter (-194 to +276) linked to lacZ have previously been analyzed for their expression during aging (25, 27, 28). This hsp22 reporter is abundantly expressed and exhibits a large induction during aging, whereas the hsp70 reporter is expressed at low level and yields a small induction. The same relative pattern of expression was produced by 100% oxygen (Fig. 3A), thereby providing additional evidence for the similarity between the aging and O2 responses. In contrast, heat stress causes a preferential induction of the hsp70 reporter (Fig. 3B).§
Fig. 3.

hsp-LacZ reporter activity in heat-shocked and oxygen-stressed flies. Three independent transgenic lines each with hsp22 promoter sequences -314 to +275 fused to lacZ, and three with hsp70 promoter sequences -194 to +276 fused to lacZ, were assayed as indicted. β-Galactosidase activity was quantitated in extracts of control flies (filled bars) and stressed flies (open bars) for each strain. (A) One hundred percent oxygen-stressed flies. (B) Heat-shocked flies.
One motivation for the current study was that changes in gene expression characteristic of aging might prove to be useful as an independent measure of aging rate, perhaps one faster and more convenient than measuring life span. Immune response genes exhibited the largest fold change in expression during aging, and were chosen for in vivo analysis. Immune response gene promoters (Drosomycin, Drocosin, and Metchnikowin) linked to GFP (43) allowed longitudinal assay of expression during aging in individual flies. Each fly was assayed at three time points for total body levels of GFP fluorescence by using video image capture. The assay itself was found to have no significant effect on life span (Fig. 6). Reporter expression in young flies was negatively correlated with remaining life span in the Drosomycin–GFP and Metchnikowin–GFP strains, as determined by using both ANOVA and regression analyses (Fig. 4 and Materials and Methods). Addition of antibiotics to the culture medium decreased reporter expression, particularly in young animals; however, reporter expression was still negatively correlated with life span (data not shown).
Fig. 4.

Survival and GFP fluorescence in Drosomycin, Drosocin, and Metchnikowin reporter strains. Time points for GFP assay were chosen to partition the life span roughly into thirds. Experiments were done in absence of antibiotics (red) and presence of antibiotics ampicillin and doxycycline (blue). Black bars indicate the median. (A) Drosomycin survival. (B) Drosomycin GFP activity. (C) Drosocin survival. (D) Drosocin GFP activity. (E) Metchnikowin survival. (F) Metchnikowin GFP activity.
The Drosophila innate immune response has been well characterized (43, 44), and essentially the same set of genes induced by infection was up-regulated during aging. This may reflect an increased pathogen load with aging, caused by loss of function of the immune system, and/or breakdown of other barriers and defenses against pathogens such as the lining of the gut and tracheoles. Consistent with this idea, old Drosophila are less able to suppress growth of introduced Escherichia coli (45). Pathogens and immune gene expression have recently been implicated in the regulation of life span in C. elegans (46–48). Also possible is a more direct stimulation of the immune response signal transduction pathways by reaction oxygen species and/or heat shock proteins as has been observed with the homologous mammalian NF-κB pathways (49–51). This would be consistent with the low-level immune peptide gene induction observed in the oxygen-stressed samples, as discussed above. The identification of immune response gene reporters that are partially predictive for life span in live Drosophila may facilitate a number of future experiments, including genetic screens to identify modifiers of aging rate and immune system function.
Supplementary Material
Acknowledgments
This work was supported by Department of Health and Human Services Grants AG11644 and AG11833 (to J.T.) and GM67243 (to S.T.). S.T. is a Royal Society–Wolfson Research Merit Award holder.
This paper was submitted directly (Track II) to the PNAS office.
Abbreviations: PM, perfect match; MM, mismatch.
Footnotes
The -194 to +276 hsp70 reporter yields a smaller fold induction in response to O2 stress and aging than is observed here for the endogenous hsp70 genes in the GeneChip and Northern data. This difference may be caused by the deletion of some distal promoter element(s) in this -194 to +276 hsp70 reporter construct, and/or the fact that the GeneChip and Northern assay all five endogenous hsp70 genes, whereas the reporter is single copy and generated specifically from hsp70-87C1.
References
- 1.Finkel, T. & Holbrook, N. J. (2000) Nature 408, 239-247. [DOI] [PubMed] [Google Scholar]
- 2.Harman, D. J. (1956) J. Gerontol. 11, 298-300. [DOI] [PubMed] [Google Scholar]
- 3.Hekimi, S. & Guarente, L. (2003) Science 299, 1351-1354. [DOI] [PubMed] [Google Scholar]
- 4.Sun, J. & Tower, J. (1999) Mol. Cell. Biol. 19, 216-228. [DOI] [PMC free article] [PubMed] [Google Scholar]
- 5.Parkes, T. L., Elia, A. J., Dickson, D., Hilliker, A. J., Phillips, J. P. & Boulianne, G. L. (1998) Nat. Genet. 19, 171-174. [DOI] [PubMed] [Google Scholar]
- 6.Sun, J., Folk, D., Bradley, T. J. & Tower, J. (2002) Genetics 161, 661-672. [DOI] [PMC free article] [PubMed] [Google Scholar]
- 7.Migliaccio, E., Giorgio, M., Mele, S., Pelicci, G., Reboldi, P., Pandolfi, P. P., Lanfrancone, L. & Pelicci, P. G. (1999) Nature 402, 309-313. [DOI] [PubMed] [Google Scholar]
- 8.Larsen, P. L. (1993) Proc. Natl. Acad. Sci. USA 90, 8905-8909. [DOI] [PMC free article] [PubMed] [Google Scholar]
- 9.Tatar, M., Bartke, A. & Antebi, A. (2003) Science 299, 1346-1351. [DOI] [PubMed] [Google Scholar]
- 10.Lin, Y.-J., Seroude, L. & Benzer, S. (1998) Science 282, 943-946. [DOI] [PubMed] [Google Scholar]
- 11.Zou, S., Meadows, S., Sharp, L., Jan, L. Y. & Jan, Y. N. (2000) Proc. Natl. Acad. Sci. USA 97, 13726-13731. [DOI] [PMC free article] [PubMed] [Google Scholar]
- 12.Scandalios, J. G. (2002) Genome Biol 3, REVIEWS1019. [DOI] [PMC free article] [PubMed]
- 13.Lipshutz, R. J., Fodor, S. P., Gingeras, T. R. & Lockhart, D. J. (1999) Nat. Genet. 21, 20-24. [DOI] [PubMed] [Google Scholar]
- 14.Hekstra, D., Taussig, A. R., Magnasco, M. & Naef, F. (2003) Nucleic Acids Res. 31, 1962-1968. [DOI] [PMC free article] [PubMed] [Google Scholar]
- 15.Forman, J. E., Walton, I. D., Stern, D., Rava, R. P. & Trulson, M. O. (1998) Am. Chem. Soc. Symp. Ser. 682, 206-228. [Google Scholar]
- 16.SantaLucia, J., Jr. (1998) Proc. Natl. Acad. Sci. USA 95, 1460-1465. [DOI] [PMC free article] [PubMed] [Google Scholar]
- 17.Bolstad, B. M., Irizarry, R. A., Astrand, M. & Speed, T. P. (2003) Bioinformatics 19, 185-193. [DOI] [PubMed] [Google Scholar]
- 18.Dudoit, S., Gentleman, R. C. & Quackenbush, J. (2003) BioTechniques Suppl., 45-51. [PubMed]
- 19.Li, C. & Hung Wong, W. (2001) Genome Biol. 2, RESEARCH0032. [DOI] [PMC free article] [PubMed]
- 20.Irizarry, R. A., Hobbs, B., Collin, F., Beazer-Barclay, Y. D., Antonellis, K. J., Scherf, U. & Speed, T. P. (2003) Biostatistics 4, 249-264. [DOI] [PubMed] [Google Scholar]
- 21.Tusher, V. G., Tibshirani, R. & Chu, G. (2001) Proc. Natl. Acad. Sci. USA 98, 5116-5121. [DOI] [PMC free article] [PubMed] [Google Scholar]
- 22.Bus, J. S., Cagen, S. Z., Olgaard, M. & Gibson, J. E. (1976) Toxicol. Appl. Pharmacol. 35, 501-513. [DOI] [PubMed] [Google Scholar]
- 23.Richmond, R. & Halliwell, B. (1982) J. Inorg. Biochem. 17, 95-107. [DOI] [PubMed] [Google Scholar]
- 24.Naef, F., Lim, D. A., Patil, N. & Magnasco, M. (2002) Phys. Rev. E Stat. Nonlin. Soft. Matter Phys. 65, 040902, 1-4. [DOI] [PubMed] [Google Scholar]
- 25.King, V. & Tower, J. (1999) Dev. Biol. 207, 107-118. [DOI] [PubMed] [Google Scholar]
- 26.Kurapati, R., Passananti, H. B., Rose, M. R. & Tower, J. (2000) J. Gerontol. 55, B1-B8. [DOI] [PubMed] [Google Scholar]
- 27.Wheeler, J. C., Bieschke, E. T. & Tower, J. (1995) Proc. Natl. Acad. Sci. USA 92, 10408-10412. [DOI] [PMC free article] [PubMed] [Google Scholar]
- 28.Wheeler, J. C., King, V. & Tower, J. (1999) Neurobiol. Aging 20, 545-553. [DOI] [PubMed] [Google Scholar]
- 29.Pletcher, S. D., Macdonald, S. J., Marguerie, R., Certa, U., Stearns, S. C., Goldstein, D. B. & Partridge, L. (2002) Curr. Biol. 12, 712-723. [DOI] [PubMed] [Google Scholar]
- 30.Seroude, L., Brummel, T., Kapahi, P. & Benzer, S. (2002) Aging Cell 1, 47-56. [DOI] [PubMed] [Google Scholar]
- 31.Hilliker, A. J., Duyf, B., Evans, D. & Phillips, J. P. (1992) Proc. Natl. Acad. Sci. USA 89, 4343-4347. [DOI] [PMC free article] [PubMed] [Google Scholar]
- 32.Anderson, R. M., Bitterman, K. J., Wood, J. G., Medvedik, O. & Sinclair, D. A. (2003) Nature 423, 181-185. [DOI] [PMC free article] [PubMed] [Google Scholar]
- 33.Gupta, T. & Schupbach, T. (2003) Development (Cambridge, U.K.) 130, 6075-6087. [DOI] [PubMed] [Google Scholar]
- 34.Drobnies, A. E., van Der Ende, B., Thewalt, J. L. & Cornell, R. B. (1999) Biochemistry 38, 15606-15614. [DOI] [PubMed] [Google Scholar]
- 35.Landis, G. N., Bhole, D. & Tower, J. (2003) Genome Biol. 4, R8; 1-14. [DOI] [PMC free article] [PubMed] [Google Scholar]
- 36.Lund, J., Tedesco, P., Duke, K., Wang, J., Kim, S. K. & Johnson, T. E. (2002) Curr. Biol. 12, 1566-1573. [DOI] [PubMed] [Google Scholar]
- 37.Lee, C.-K., Klopp, R. G., Weindruch, R. & Prolla, T. A. (1999) Science 285, 1390-1393. [DOI] [PubMed] [Google Scholar]
- 38.Lee, C. K., Weindruch, R. & Prolla, T. A. (2000) Nat. Genet. 25, 294-297. [DOI] [PubMed] [Google Scholar]
- 39.Ly, D. H., Lockhart, D. J., Lerner, R. A. & Schultz, P. G. (2000) Science 287, 2486-2492. [DOI] [PubMed] [Google Scholar]
- 40.Calleja, M., Pena, P., Ugalde, C., Ferreiro, C., Marco, R. & Garesse, R. (1993) J. Biol. Chem. 298, 18891-18897. [PubMed] [Google Scholar]
- 41.Fleming, J. E., Melnikoff, P. S., Latter, G. I., Chandra, D. & Bensch, K. G. (1986) Mech. Ageing Dev. 34, 63-72. [DOI] [PubMed] [Google Scholar]
- 42.Yui, R., Ohno, Y. & Matsuura, E. T. (2003) Genes Genet. Syst. 78, 245-251. [DOI] [PubMed] [Google Scholar]
- 43.Tzou, P., Ohresser, S., Ferrandon, D., Capovilla, M., Reichhart, J. M., Lemaitre, B., Hoffmann, J. A. & Imler, J. L. (2000) Immunity 13, 737-748. [DOI] [PubMed] [Google Scholar]
- 44.De Gregorio, E., Spellman, P. T., Rubin, G. M. & Lemaitre, B. (2001) Proc. Natl. Acad. Sci. USA 98, 12590-12595. [DOI] [PMC free article] [PubMed] [Google Scholar]
- 45.Kim, Y. S., Nam, H. J., Chung, H. Y., Kim, N. D., Ryu, J. H., Lee, W. J., Arking, R. & Yoo, M. A. (2001) J. Am. Aging Assoc. 24, 187-194. [DOI] [PMC free article] [PubMed] [Google Scholar]
- 46.Garsin, D. A., Villanueva, J. M., Begun, J., Kim, D. H., Sifri, C. D., Calderwood, S. B., Ruvkun, G. & Ausubel, F. M. (2003) Science 300, 1921. [DOI] [PubMed] [Google Scholar]
- 47.Murphy, C. T., McCarroll, S. A., Bargmann, C. I., Fraser, A., Kamath, R. S., Ahringer, J., Li, H. & Kenyon, C. (2003) Nature 424, 277-283. [DOI] [PubMed] [Google Scholar]
- 48.Garigan, D., Hsu, A. L., Fraser, A. G., Kamath, R. S., Ahringer, J. & Kenyon, C. (2002) Genetics 161, 1101-1112. [DOI] [PMC free article] [PubMed] [Google Scholar]
- 49.Vabulas, R. M., Wagner, H. & Schild, H. (2002) Curr. Top. Microbiol. Immunol. 270, 169-184. [DOI] [PubMed] [Google Scholar]
- 50.Asea, A., Rehli, M., Kabingu, E., Boch, J. A., Bare, O., Auron, P. E., Stevenson, M. A. & Calderwood, S. K. (2002) J. Biol. Chem. 277, 15028-15034. [DOI] [PubMed] [Google Scholar]
- 51.Kim, H. J., Jung, K. J., Yu, B. P., Cho, C. G., Choi, J. S. & Chung, H. Y. (2002) Mech. Ageing Dev. 123, 1589-1595. [DOI] [PubMed] [Google Scholar]
Associated Data
This section collects any data citations, data availability statements, or supplementary materials included in this article.