

Abstract
The science of taxonomy is constantly improving as new techniques are developed. Current practice is to construct phylogenetic trees based on the analysis of the DNA sequence of single genes, or parts of single genes. However, this approach has recently been brought into question as several tree topologies may be produced for the same clade when the sequences for various different genes are used. The availability of complete genome sequences for several organisms has seen the adoption of microarray technology to construct molecular phylogenies of bacteria, based on all of the genes. Similar techniques have been used to reveal the relationships between different strains of the yeast Saccharomyces cerevisiae. We have exploited microarray technology to construct a molecular phylogeny for the Saccharomyces sensu stricto complex of yeast species, which is based on all of the protein-encoding genes revealed by the complete genome sequence of the paradigmatic species, S. cerevisiae. We also analyze different strains of S. cerevisiae itself, as well as the putative species S. boulardii. We show that in addition to the phylogeny produced, we can identify and analyze individual ORF traits and interpret the results to give a detailed explanation of evolutionary events underlying the phylogeny.
Taxonomy is a science that attempts to achieve two aims: (1) to develop a “natural” classification that reflects the evolutionary history and phylogenetic relationships of contemporary organisms, and (2) to develop procedures whereby specimens of individual species may be unambiguously identified. Early in its history, taxonomy relied exclusively on phenotypic characteristics. For higher organisms, this usually meant morphology, whereas, for microorganisms, biochemical characteristics were used together with such morphological features as were discernible. Biologically, species were defined as “a group of organisms that can interbreed with one another” (Brown 2002). However, for many microorganisms, and particularly a number of groups of yeasts and fungi, no sexual stage could be discovered in their life cycles, so the biological definition of a species proved unworkable. The availability of facile methods to sequence first proteins and then genes led to the rapid growth of molecular phylogenetics and the use of sequence comparisons to both define and identify species (McCullough et al. 1998; Mathews et al. 2000; Porwollik et al. 2002; Thao et al. 2003). This molecular phylogeny allows the twin aims of the taxonomist to be achieved. Gene sequences permit the construction of phylogenetic trees that reflect the evolutionary history of the species in a given clade and thus provide a natural taxonomy. Moreover, the ready acquisition of such sequences from individual specimens, using the polymerase chain reaction (PCR), means that this approach also facilitates identification. The problem is that these phylogenies are based on a single sequence, either a protein-encoding gene or (more frequently) a sequence encoding all or part of a ribosomal RNA. This means that molecular taxonomy is subject to the same variation as were the biochemical tests previously used to discriminate between species. The problem can be seen when several trees, each for the same group of species but based on a different gene sequence, are compared (Sicheritz-Ponten and Andersson 2001; Kurtzman and Robnett 2003). The variation in tree structure is typical of single-sequence analysis, and it has been suggested that a larger group of core genes could be used for a more accurate reference (Daubin et al. 2002; Kurtzman and Robnett 2003; Rokas et al. 2003). Those ORFs contained within the genome that are known to be transferred or rearranged, such as the structural genes in bacteria (Daubin et al. 2002) or those telomeric or highly repeated sequences in yeast (Fischer et al. 2000; Winzeler et al. 2003), would be avoided in these core groups.
Whole-genome methods of phylogeny reconstruction are generally considered to avoid the limitations of constructing phylogenies from sequence data from just a few loci. Gene duplication followed by divergence in sequence between the duplicate gene copies is usually cited as a typical mechanism whereby a “gene tree” constructed from any single gene may differ considerably from the “species tree” (Page and Holmes 2002). At the level of genotype, it may not necessarily make sense to talk of a species tree because one would expect portions of the genome to have different evolutionary histories (Seoighe and Wolfe 1998). However, as a means of classifying a species within a phylogeny, genome-wide methods have the advantage of taking into account all of the differences between species. For microbial eukaryotes, such as the yeasts, the best method would be to construct phylogenetic trees from complete (or near-complete) genome sequences. This is currently being done by using techniques such as whole-genome shotgun sequencing (Cliften et al. 2003; Kellis et al. 2003). Although this method allows robust phylogenies to be constructed, it will not be a comprehensive approach for any taxonomic group in the near future and does not address the second aim of the taxonomist—that of facile identification of species. Similarly, the sequencing of a core set of ≥20 genes (Rokas et al. 2003) is not a practicable approach to routine species identification. An alternative method is comparative genomic hybridization (CGH), which is the comparison of whole genomic DNA to reference DNA, by hybridization. The term CGH is usually applied to the cytogenetic method of screening genetic changes in immobilized metaphase chromosomes from tumor samples by comparison to a reference. However, with the advent of microarray technology, this term now incorporates studies based on hybridizations to microarrays (Lage et al. 2003). In addition to tissue analysis, this method has recently been applied, as a taxonomic tool, to several microorganisms (Salama et al. 2000; Dorrell et al. 2001; Murray et al. 2001; Porwollik et al. 2002; Winzeler et al. 2003) in order to compare intra- and inter-specific genetic diversity. An advantage of this method of taxonomy is that it “circumvents the need for sequencing multiple closely related genomes” (Murray et al. 2001) and could be used for routine identification of specimens.
The taxonomic history of the yeast Saccharomyces reveals the influence of genotypic analysis on our view of a particular microbial genus. An industrially important organism, Saccharomyces has been used for centuries in brewing and baking (Mortimer 2000) and was initially classified by morphological, sexual, and physiological characteristics (Kurtzman and Robnett 2003). Following the development of yeast genetics and molecular biology from the 1930s onward (Mortimer 2000), Saccharomyces has become one of the most significant eukaryotic model systems for molecular genetic research (Botstein and Fink 1988; Lage et al. 2003). By using the techniques developed by molecular geneticists, new phylogenetic relationships were recognized, the number of separate species groups was reduced, and the diversity within them increased (McCullough et al. 1998). The heterogeneity of strains within these groups has been highlighted when comparing the industrial, brewing, and baking strains to standard laboratory stocks of the S. cerevisiae species (Querol et al. 1992; Codon et al. 1998; McCullough et al. 1998; Hennequin et al. 2001; Mitterdorfer et al. 2002; Granchi et al. 2003; Winzeler et al. 2003). The main regions of diversity of the strains and species of Saccharomyces are the telomeric regions and retrotransposons (Cohn et al. 1998; Nakazato et al. 1998; Rachidi et al. 1999; Fischer et al. 2000; Lockhart et al. 2002; Winzeler et al. 2003). Transposable (Ty) elements make up ∼3% of the total sequenced genome of S. cerevisiae S288c (Kim et al. 1998), and the variation of these elements between different species of Saccharomyces is well reported (Zou et al. 1995; Neuveglise et al. 2002; Fingerman et al. 2003). In addition to the variation between species, the varying distribution of Ty elements has also been identified within the strains of S. cerevisiae (Wicksteed et al. 1994; Zou et al. 1995; Codon et al. 1998; Rachidi et al. 1999). The rearrangements caused by recombination events between Ty elements or other repeated sequences have been shown to aid, if not cause, speciation events (Cohn et al. 1998; Fischer et al. 2000; Delneri et al. 2003).
The diversity of strains within species groups, and the small amount of genetic material being sampled in order to construct each phylogenetic tree, has led to variations in our view of the relatedness of the entire Saccharomyces species complex (Fischer et al. 2000; Naumov et al. 2000; Kurtzman and Robnett 2003; Rokas et al. 2003). Whole-genome comparisons would give a clearer indication of relatedness, and as genome sequencing projects are undertaken (Kellis et al. 2003), this will eventually be achieved. Previous CGH comparisons using Affymetrix arrays (Winzeler et al. 2003) showed the genetic diversity within a single species. These arrays are fabricated with specially designed S. cerevisiae–specific oligonucleotides covering the whole genome. Consequently, this specificity may limit their utility for analysis of species spanning greater evolutionary distances. With the availability of a fully annotated genome sequence for the reference strain S. cerevisiae S288c (Goffeau et al. 1996) and with microarray technology at our disposal, we have attempted to assess the utility and validity of CGH for performing phylogenetic analyses and taxonomic identifications on microbial eukaryotes. We have chosen Saccharomyces as our test genus, and have used DNA/DNA hybridizations with spotted microarrays that include full-length PCR products for all of the S. cerevisiae open reading-frames (ORFs), thereby sampling the entire protein-encoding portion of the genome (Dujon 1996). We have compared members of the Saccharomyces sensu stricto complex (S. cerevisiae, S. paradoxus, S. cariocanus, S. mikatae, S. kudriavzevii, S. bayanus, and S. pastorianus; Naumov et al. 2000; Kurtzman and Robnett 2003) and the out-group species S. castellii to the sequenced strain, S. cerevisiae FY1679 (a direct derivative of S288c; Winston et al. 1995). We then chose to compare S. cerevisiae Σ1278b, a strain with a significantly different genetic background to that of S288c (Kron 1997), and the highly contested “species” S. boulardii (McFarland 1996; McCullough et al. 1998; Mitterdorfer et al. 2001) in order to examine the ability of CGH to delineate intra- and interspecific relationships. In this report, we present the first eukaryotic whole-genome phylogeny, and show that it is generally in accordance with previous data on the phylogeny of the Saccharomyces sensu stricto complex. However, the availability of data on all of the ORFs has allowed us to make specific predictions about the molecular basis of differences between individual strains or species and to verify these predictions by using independent methods of analysis.
RESULTS AND DISCUSSION
Comparative Genomic Hybridizations Enable Construction of Phylogenetic Trees
The availability of the entire annotated genome sequence of S. cerevisiae (Goffeau et al. 1996) has made it possible to make full-genome comparisons of various yeast strains by using microarray technology (Winzeler et al. 2003). In this study, we attempted to assess the versatility and utility of this approach, by comparing species within the Saccharomyces sensu stricto complex and the out-group species S. castellii against S. cerevisiae spotted microarrays (Table 1 gives a full list of the yeast strains used). Genomic DNA isolated from each of these species was cohybridized with that of the S. cerevisiae S288c–derived strain, FY1679 (Winston et al. 1995). Whole-genome spotted microarrays with 6277 PCR products (Hayes et al. 2002), each representing individual ORFs based on the S. cerevisiae S288c annotated sequence, were used for genomic comparisons. Genomic DNA from the Saccharomyces sensu stricto species and FY1679 was fluorescently labeled with either Cy3 or Cy5 and cohybridized with that of FY1679, labeled with the opposite Cy dye. Reciprocal dye-binding experiments were carried out for each strain, and in total, six experiments were carried out for each species. The hybridizations were carried out overnight at room temperature, and the microarray slides were then washed and scanned by a Genepix scanner (see Methods). The raw data can be accessed online at http://www.cogeme.man.ac.uk/Facilities/projects.html. Ratios of the intensities from the two Cy dyes were evaluated, and then natural logarithms were taken to produce raw, unnormalized log. ratios. For each species, the raw log. ratios were normalized (see Methods). For a given species and ORF, the normalized log. ratio gives a measure of sequence divergence in that ORF between the species considered and the S. cerevisiae reference strain FY1679. To construct a phylogeny, the normalized log. ratios were converted to a binary form by using a threshold (Fig. 1). The threshold was determined from the self–self hybridizations and was calculated to be –0.395 (i.e. 3 SD below zero; see Methods for details of the calculation). Maximum parsimony was then applied to the binary data. The resulting phylogeny (Fig. 2A) shows that the general structure of our tree is in agreement with those produced before, on the basis of single-gene sequences. Bootstrap support values were 100% at each node, evaluated from a consensus of 1000 trees (see Methods). From the phylogeny constructed, it was clear that CGH using glass-slide spotted microarrays was stringent enough to distinguish between species within the Saccharomyces clade.
Table 1.
Strains Used in This Study
| Strain/species | Characteristics | Source/reference |
|---|---|---|
| S. cerevisiae FY1679 | MATa/α ura3-52/ura3-52 leu2Δ1/LEU2 trp1Δ1/TRP1 HIS3/his3Δ200 | (Winston et al. 1995) |
| S. cerevisiae Σ1278b | Wild type | S.G. Oliver |
| S. boulardii UL | Wild type | P. Niederberger (Nestlé, Switzerland) |
| S. cariocanus JFR | Wild type | NCYC |
| S. paradoxus | Wild type | NCYC |
| S. mikatae IFO 1816 | Wild type | NCYC |
| S. kudriavzevii NCYC 2926 | Wild type | NCYC |
| S. bayanus var. uvarum 2007 | Wild type | NCYC |
| S. castellii | Wild type | NCYC |
| S. cerevisiae FY23 | MATa ura3-52 leu2Δ1 trp1Δ1 | (Winston et al. 1995) |
Figure 1.

Stages of phylogeny construction. (A) A histogram of log. ratios (normalized) from the self–self hybridizations. The normalized log. ratio is used as a measure of divergence, for each particular ORF, from the reference species S. cerevisiae FY1679. The threshold, shown by the solid arrow, is chosen so that few ORFs in the self–self hybridizations have a normalized log. ratio below the threshold. (B) Histograms of normalized log. ratios from other species in comparison to the self–self data.
Figure 2.

Phylogenetic tree of the Saccharomyces sensu stricto complex, including strains of S. cerevisiae.(A) Construction with the full data set for each species. (B) Rearrangement that occurred when Ty-related ORFs were removed from the data sets of all species.
To further assess the stringency of this method, the Σ1278b strain of S. cerevisiae (which does not come from the S288c background of the sequenced strain, FY1679; Mortimer and Johnston 1986) and the probiotic “species” S. boulardii were also cohybridized with FY1679. As seen in Figure 2A, the alternative strain of S. cerevisiae was positioned in the phylogeny nearest to the control FY1679. S. boulardii was shown to be more distantly related than was the alternative strain, possibly indicating that this was a separate species. However, S. boulardii appeared to be more closely related to S. cerevisiae than the other Saccharomyces sensu stricto species.
Variations Between Genomes of Different Species Can Be Identified by CGH
Using CGH has many advantages over the conventional methods of phylogeny construction. In addition to the construction of a tree, this method provides greater detail about species-specific variation in the whole genome. Following construction of the tree, the data sets for each species were further analyzed. A second positive-valued threshold, equal in magnitude to the first, was similarly applied to filter the normalized log. ratios. Two sets of data were produced for each species, those ORFs within the thresholds and those outside them. ORFs that were within the thresholds were considered to have similar hybridization efficiency in each channel and therefore to be similar to the self–self data. The ORFs that were outside the thresholds were further analyzed for features that may signify strain or species differences. The ORFs outside the thresholds fall into two groups: those that are overrepresented (the positive log. ratios) or that are divergent (negative) compared with the paradigmatic species/strain. The overrepresented ORFs were believed to be sequences that were present in their respective genomes at a higher copy number than that found in S. cerevisiae S288c. Those that were divergent were considered to be sequences that were either completely missing in the genome of the test species, or to be present but to have a sequence so different from that found in S. cerevisiae S288c that no significant hybridization signal can be detected, or to be present at a much lower copy number in the genome of the test species than in S288c (Kellis et al. 2003). Table 2 shows the number of ORF identities outside the thresholds for each species. With the exception of the S. boulardii data, the table reveals a steady progression from ∼13% genomic differences to S. cerevisiae S288c, in the case of S. cariocanus increasing to ∼89% outside the thresholds for S. castellii (a member of the Saccharomyces sensu lato), corresponding to the relative positions of the species in the tree.
Table 2.
Distribution of ORFs Outside the Threshold
| Strain/species | Number of ORFs outside the threshold | Total number of normalized ORFs | ORFs outside as % of total normalized |
|---|---|---|---|
| S. boulardii | 233 | 6089 | 3.83 |
| S. cerevisiae Σ1278b | 289 | 6139 | 4.71 |
| S. cariocanus | 809 | 6063 | 13.34 |
| S. paradoxus | 2628 | 6114 | 42.98 |
| S. kudriavzevii | 2716 | 5535 | 49.07 |
| S. mikatae | 3583 | 5951 | 60.21 |
| S. castellii | 4784 | 5398 | 88.63 |
The data are shown as the actual number of ORFs outside the threshold and then as a percentage of the normalized data for that species.
We next analyzed the functional class and chromosomal position of all ORFs that fell outside of the thresholds set from the self–self hybridization data from S288c. Those ORFs that belonged to the overrepresented group in each species were analyzed first. Table 3 shows that the majority of the overrepresented ORFs were telomere-associated and/or orphans (genes of undetermined function). The parameter set to assign an ORF to the telomeric region was 50 kb from either chromosome end. This is greater than that previously used for analysis of strains within the S. cerevisiae species alone (Winzeler et al. 2003), but was considered to be more suitable for our analysis of the entire clade. Fifty kilobases is at the upper boundary of the telomeric regions defined by reciprocal translocation events (Kellis et al. 2003) or by the distance between the telomere and the first essential gene (this interval can be as much as 75 kb, and an interval of 58 kb is found for the distance between PTA1 and the left end of chromosome I, the shortest S. cerevisiae chromosome; Giaever et al. 2002). Known ORFs that appeared to be overrepresented compared with S. cerevisiae S288c included many that belong to large gene families such as HXT and PAU. The presence of these ORFs could be due to cross-hybridization between close family members. However, genome sequencing within the Saccharomyces sensu stricto complex (Kellis et al. 2003) has demonstrated that the variation in these ORFs could be due to changes in gene copy number. Given the importance of repeated sequences in promoting chromosome rearrangements during the evolution of the Saccharomyces sensu stricto (Fischer et al. 2000), it is important to consider such copy number variations when constructing phylogenies.
Table 3.
The Overrepresented ORFs Present in the Data Sets of Each Species
| Strain/species | Total overrepresented | Orphans | Telomeric | Ty elements | Deleted |
|---|---|---|---|---|---|
| S. boulardii | 23 | 8 | 7 | 0 | 0 |
| S. cerevisiae Σ1278b | 133 | 67 | 78 | 0 | 1 |
| S. cariocanus | 14 | 8 | 3 | 0 | 0 |
| S. paradoxus | 13 | 7 | 10 | 1 | 0 |
| S. kudriavzevii | 32 | 13 | 17 | 0 | 0 |
| S. mikatae | 10 | 5 | 7 | 0 | 0 |
| S. castellii | 51 | 11 | 3 | 0 | 0 |
The second group contained ORFs that are either absent in the test species or have sequence that diverged significantly from that of their S. cerevisiae counterparts. Once again, for each species, many telomeric sequences were identified, as well as orphans and genes belonging to large paralogous gene families. Figure 3 shows the distribution of the first 100 ORFs on the absent/divergent side of the threshold for each species. These ORFs are the most distant from the threshold and should therefore represent the most significant differences between the test species/strains and S. cerevisiae S288c. The high frequency of Ty elements and orphans in these first 100 ORF groups was not unexpected, as genetic variation of highly repetitive or nonessential sequences is well known. Full lists of the ORFs used to construct these tables may be found in the Supplemental data.
Figure 3.

Distribution of the first 100 ORFs in the absent/diverged data set for each species. The histograms represent the first 100 ORFs furthest from the threshold. These ORFs fall into three main categories: known ORFs, orphans, and Ty elements.
Previously Published Data and Additional Tests Can Validate the CGH Data
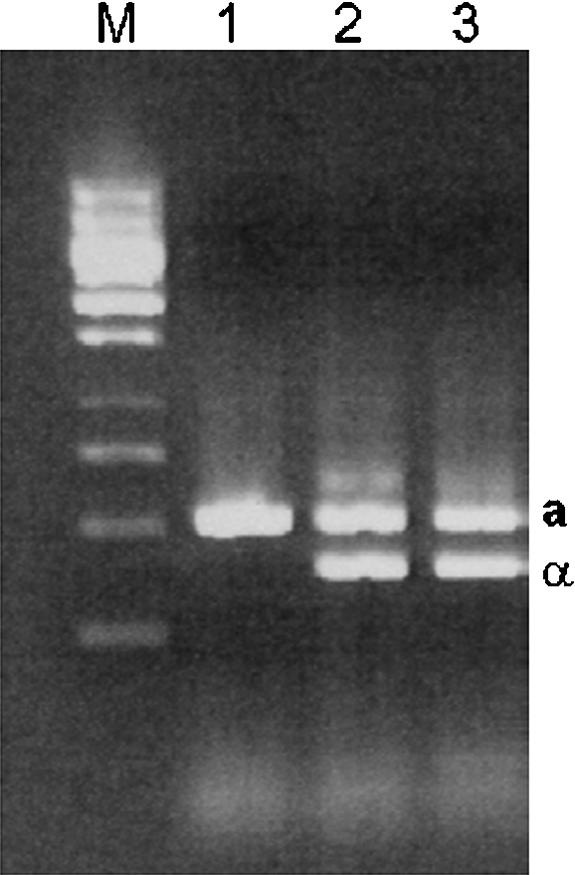
The phylogeny that was produced was generally in agreement with previous trees. However, the data that were produced from the microarray experiment had to be validated in order to support phylogenetic construction by this method. The Ty elements and long terminal repeats (LTRs) collectively make up a large proportion of the genome, estimated at ∼3% in total (Kim et al. 1998). For a full list of all Ty ORFs identified from http://www.yeastgenome.org/, see the Supplemental data. It has previously been reported that these sequences vary in type, number, and position between species and even strains of Saccharomyces (Codon et al. 1998; Rachidi et al. 1999; Neuveglise et al. 2002; Fingerman et al. 2003). Fingerman et al. (2003) stated that when S. paradoxus DNA was hybridized with various Ty probes, the results implied that Ty1 homologs were present and Ty2 was lacking (Naumov et al. 1992), but a Ty3-like element was present. No data on Ty4 have been published, but Ty5 elements have been identified in numerous copies (Zou et al. 1995). By using CGH, we have been able to define distribution patterns for the Ty elements in each of the species studied. Our first observation was that Ty elements were found in both the diverged/absent and overrepresented groups. However, most of the Ty outliers were in the diverged/absent group (Table 4). The Ty ORF that appeared in the overrepresented group was a Ty5 element found only in S. paradoxus, a species known to have numerous active copies of this transposon (Zou et al. 1995). As can be seen in Table 4, Ty1, Ty2, and Ty4 also showed variation between the species studied. We used primers to separately amplify the GAG and δ (LTR) regions of the Ty1 retrotransposon. It was shown (Fig. 4) that S. boulardii, S. mikatae, S. kudriavzevii, and S. bayanus all lacked the GAG sequence, but (as previously reported) S. paradoxus does contain Ty1. In addition, by using the LTR primers, it was seen that S. boulardii did contain δ sequences (data not shown).
Table 4.
Distribution of Ty ORFs Outside the Threshold
|
Ty elements outside the threshold
|
||||||
|---|---|---|---|---|---|---|
| Strain/species | Ty1 | Ty2 | Ty3 | Ty4 | Ty5 | Total |
| S. boulardii | 56 | 1 | 0 | 3 | 0 | 60 |
| S. cerevisiae Σ1278b | 0 | 0 | 0 | 5 | 0 | 5 |
| S. cariocanus | 14 | 12 | 0 | 0 | 0 | 26 |
| S. paradoxus | 28 | 16 | 0 | 4 | (+)1 | 49 |
| S. kudriavzevii | 35 | 5 | 0 | 2 | 0 | 42 |
| S. mikatae | 20 | 2 | 0 | 0 | 0 | 22 |
| S. castellii | 43 | 11 | 0 | 0 | 0 | 54 |
The number of ORFs is that found in the first 100 ORFs of the absent/diverged data set. Those indicated (+) were found in the overrepresented data.
Figure 4.

PCR amplification of the Ty1 element using the Ty-Gag primers: S. cerevisiae FY1679 (lane 1), S. boulardii (lane 2), S. cerevisiae Σ1278b (lane 3), S. cariocanus (lane 4), S. paradoxus (lane 5), S. kudriavzevii (lane 6), S. mikatae (lane 7), S. bayanus (lane 8), and S. pastorianus (lane 9). Note that S. castellii was not tested.
The literature on S. boulardii provided more interesting questions with which to test our data sets. Originally classified as a separate species (McFarland 1996), the current view of this organism is that it is a strain of S. cerevisiae (McCullough et al. 1998; Hennequin et al. 2001; Mitterdorfer et al. 2002). During the phylogeny construction, S. boulardii was positioned outside the two alternative strains of S. cerevisiae but closer to these than any of the other Saccharomyces sensu stricto species (Fig. 2A). However, when the data sets were studied, it was observed that S. boulardii contained fewer ORFs outside the thresholds than all the other Saccharomyces sensu stricto species and fewer even than S. cerevisiae Σ1278b (Table 2). Further analysis of the data sets revealed previously unreported features of the S. boulardii genome. The first 100 ORFs in the absent/diverged category from the S. boulardii data set contains many ORFs from Ty elements (Fig. 3; Table 4), and most of these were identified as Ty1/2 (the lack of discrimination between the two Ty elements is discussed further in the Methods section). In contrast, S. cerevisiae Σ1278b was shown to only contain five Ty ORFs in this category, all belonging to the Ty4 family. This high proportion of Ty elements in the absent/diverged class for S. boulardii was unexpected and particularly noteworthy, as the total number of ORFs in this category was lower than in any other species or strain examined. To assess the contribution that this lack of Ty1/2 elements has on the position of S. boulardii in the phylogenetic tree, all Ty-related ORFs were removed from the data sets of all of the species examined. The results, seen in Figure 2B, reveal that there was no change in the position of any species other than S. boulardii, which moves to a position in the tree that is significantly closer to S. cerevisiae FY1679 (the sequenced strain) than the conspecific strain, Σ1278b. Therefore, we conclude that S. boulardii is not a distinct species but is a strain of S. cerevisiae that has lost all intact Ty1/2 elements.
To address the question of how an S. cerevisiae strain could arise that lacked any intact Ty1/2 elements, we investigated the mating-type status of S. boulardii. This is relevant because the transcription of these mobile elements is under diploid control (Dubois et al. 1982; Warmington and Oliver 1988), which means that they are not transcribed in MATa/MATα cells. Moreover, the rate of transposition of Ty1/2 is elevated during meiosis (Ribeiro-dos-Santos et al. 1997). S. boulardii is a wild-type strain that is reportedly unable to sporulate (McFarland 1996; McCullough et al. 1998), but its ploidy and mating type have never been published. We postulated that replenishment of Ty elements via transposition during sporulation and haploid mitotic growth would maintain the numbers of Ty elements in other species, but the absence of these stages in the life cycle of S. boulardii could have led to the complete loss of intact Ty elements from its genome as a result of recombination events between the long terminal repeats of individual elements (Warmington et al. 1986, 1987). Such δ × δ recombination events result in the complete excision of the coding sequences of the Ty element from the chromosome, leaving a single copy of the δ sequence at the original chromosomal location of the intact Ty. To assess the mating type, PCR amplification was carried out as described by Huxley et al. (1990), and the results, shown in Figure 5, reveal that S. boulardii does have both mating types, which would support our theory of loss of Ty elements by recombination.
Figure 5.
The mating-type PCR of S. cerevisiae strains and S. boulardii. (Lane 1) FY23, a known MATa haploid. (Lane 2) FY1679, a known MATa/α diploid. (Lane 3) S. boulardii.
Finally, to confirm the accuracy of the hybridizations, alignment of DNA sequences was carried out and comparison made with the normalized log. ratios. The precise relationship between signal intensity and sequence similarity is currently not fully understood. However, from the Whitehead/MIT sequences obtained from http://www.yeastgenome.org/ (Kellis et al. 2003), we found statistically significant but low correlations between the sequence similarity of coding regions and normalized log. ratios (Pearson correlation = 0.3, P < 0.0001 and 0.28, P < 0.0001 for S. paradoxus and S. mikatae, respectively). This was supported further when we compared genes within the threshold, including essential (PSA1), conditional (PKC1), and nonessential (CHS1 and CHS3) genes. The homology of these genes was tested by PCR amplification followed by direct sequencing or by comparison to those sequences available on the Synteny Viewer facility at http://www.yeastgenome.org/. The results for several genes are shown in Table 5. An unexpectedly high variation in DNA sequence identity (from 97% to 84%) was observed in the genes compared. Although there is only a low correlation between sequence similarity and the normalized log. ratios, we remain confident that our data are valid due to the support provided from the literature for the other features observed.
Table 5.
Sequence Homology Comparisons of Various Known ORFs
|
% Homology of DNA sequence to S. cerevisiae ORFs in SGD database
|
||||
|---|---|---|---|---|
| Strain/species | PSA1 | PKC1 | CHS1 | CHS3 |
| S. boulardii | 95 | 96 | 94 | 97 |
| S. paradoxus | 94 | 90 | 88 | 91 |
| S. mikatae | 91 | 85 | 84 | Data not available |
The percentage homology was calculated by amplification and direct sequencing or by analysis of sequences available at SGD.
Problems and Prospects
There are a number of limitations to the use of CGH for species identification and phylogeny construction of the Saccharomyces clade. S. pastorianus was not included in the phylogeny because it is a hybrid species that contains a set of S. cerevisiae chromosomes and S. bayanus chromosomes (Tamai et al. 1998), and the hybridization of the chromosomes of the former species to the microarray completely dominates the data set. Another problem was observed with S. bayanus; the Cy3 dye would not label the DNA of this species, thereby making it impossible to use dye-swap information in normalization. For this reason, this species was excluded from our phylogenetic analysis. We have no explanation for this anomaly in DNA labeling, and it is currently under investigation.
Other issues concerning the use of CGH in phylogenetic studies of yeasts need to be resolved. How precisely should the raw microarray data be normalized? In practice, using a different normalization method—such as just simple averaging over forward and reciprocal labeled hybridizations (Yang et al. 2001)— had little effect on the normalized log. ratios. For species that are evolutionarily distant from S. cerevisiae, accurate subtraction of the background also becomes increasingly important, as reduced hybridization intensities are observed. However, this is not an issue that we have attempted to resolve in this article. Once the raw hybridization data have been normalized, the question of how to reconstruct the phylogeny remains. One approach is to use clustering based on a matrix of pairwise distances. However, the implicit assumptions (such as the existence of a molecular clock or additive tree), made by the commonly used clustering algorithms, are unlikely to hold for these data sets. Given these concerns, we followed previous work (Porwollik et al. 2002) and converted the normalized log. ratios to two binary classes (zero and one), to which maximum parsimony could be applied. Conversion to a binary form automatically acted to reduce the influence of small, noise-dominated fold-changes on the resultant phylogeny. Clearly, a reasonable number of both ones and zeros was required. In practice, we also wanted a classification of zero to reflect the idea that the nucleotide sequence of a particular ORF had been detected as having changed from that in S. cerevisiae. Consequently, a threshold was selected such that few ORFs in S. cerevisiae FY1679 would be classified as zero. A total of 38% of all probes in non–self–self hybridizations were classified as zero. However, only 4% of S. cerevisiae FY1679 ORFs also fell below this threshold. We also constructed phylogenies using neighbor-joining applied to a distance matrix of euclidean distances between profiles of normalized log. ratios for the various species. The resulting phylogenies were almost identical to those obtained when using maximum parsimony, in that S. cerevisiae FY1679, S. cerevisiae Σ1278b, and S. boulardii form a monophyletic group, with S. cerevisiae Σ1278b and S. boulardii identified as neighbors.
In conclusion, we have shown that CGH is a useful method for phylogeny construction based on whole-genome data and have presented an example of how a detailed analysis of the hybridization data can reveal particular strain and species differences that throw light on the evolutionary history of the genomes studied. We have shown that this method allows analysis of a clade and its outlying species but is also sensitive enough to distinguish between strains. As well as the ongoing review of the method and to address its limitations, the data sets are currently being studied for additional species characteristics. As with the Ty element distribution, any features found must be confirmed by independent alternative analytical methods.
METHODS
Strains and Media
The Saccharomyces strains used in this study are shown in Table 1. Routine media (Yeast Extract Peptone Dextrose [YEPD], presporulation, sporulation, minimal Synthetic Dextrose [SD] with appropriate supplements) were prepared as described previously (Sherman et al. 1986).
Microarray Sample Preparation
Genomic DNA was isolated from 50 mL of stationary phase YEPD cultures by using the yeast DNA miniprep (40 mL) protocol (Adams et al. 1997). Modifications included 14 mM β-mercaptoethanol added in addition to Zymolyase prior to a 1-h incubation at 30°C and, following the addition of two volumes of 95% (v/v) ethanol, a 1-h incubation at –20°C was applied before centrifugation. To label the DNA, a modified version of the genomic DNA labeling protocol (Stanford Web site) was used. Isolated genomic DNA (100 μg) was digested with TaqI restriction enzyme. Digested DNA was purified by phenol/chloroform extraction and precipitated with 2.5 volumes of absolute ethanol, 0.3 M NaOAc; quantification was made by gel electrophoresis and absorbance at 260 nm/280 nm. Purified digest (5 μg) was used for each labeling reaction, and the primers used were random hexamers (Amersham). The concentrations of dCTP and dTTP were 1.2 mM and 0.6 mM, respectively, as Cy-dUTP dyes (Amersham) were used. DNA was purified with the GFX PCR DNA and Gel band Purification Kit (Amersham), examined by gel electrophoresis, and scanned with a Storm PhosphorImager to check the labeling efficiency of Cy5. The labeled DNA was dried to 10 μL final volume.
DNA Microarray Hybridizations
Microarrays fabricated in the COGEME Transcriptome Resource Facility (Hayes et al. 2002) were used, and six reciprocal dye-binding experiments were carried out per strain in order to generate statistically significant data. These PCR-generated whole-ORF microarrays have insufficient discriminatory capacity to resolve closely related gene sequences. Consequently, genes within such families as the Ty1 and Ty2 elements and the HXT genes are not differentiated in this study. The microarrays were prehybridized in 5× SSC, 0.1% (w/v) SDS, and 1% (w/v) bovine serum albumin for 40 min at 42°C. Slides were washed five times in sterile double-distilled H2O and once in isopropanol and then allowed to dry. The two-labeled target DNA preparations (10 μL each of Cy3 and Cy5) were combined with 20 μL 50% (v/v) formamide, 10× SSC, and 0.2% (w/v) SDS. This hybridization mixture was incubated for 3 min at 100°C, and the total volume was applied to the prehybridized microarray slide. The slides were sealed in hybridization chambers and left overnight at room temperature. Following hybridization, the slides were washed for 15 min in 2× SSC and 1% (w/v) SDS, 8 min in 1× SSC and 0.2% (w/v) SDS, and 5 min in 0.1× SSC and 0.2% (w/v) SDS before being spun dry and scanned with the Axon GenePix 4000A scanner (Axon Instruments). Raw array-data files were produced, following preliminary quantification of the scanned images by the GenePix Pro v.3.0 software.
Data Acquisition and Analysis
The raw microarray data from a number of replicate hybridizations, including reciprocal dye-binding experiments, consisted of (median value) background-corrected red and green channel intensities. Ratios of the channel intensities were calculated for each spot and logarithms taken to obtain raw log. ratios. However, these contained a number of systematic errors. It is often assumed (Yang et al. 2001) that by averaging over hybridizations and reciprocal dye-binding experiments, the systematic errors are approximately canceled out, resulting in appropriately normalized log. ratios even when the true mean log. ratio is not zero. Thus, we averaged over all the hybridizations to estimate the true mean log. ratio. M-A plots from forward-labeled hybridizations and reciprocal dye-binding experiments generally showed a similar form, and therefore, we considered the majority of the intensity dependence of the unnormalized raw log. ratios to be due to a bias of nonbiological origin. We corrected this more formally by robust whole-array LOWESS (Locally Weighted regreSSion) smoothing (Yang et al. 2002) while maintaining the previous estimated true mean log. ratio. Finally, we centered the mean log. ratio of each print block to the mean log. ratio of the whole array, to account for possible print-tip/spatial biases. A single log. ratio was obtained for each ORF by averaging normalized log. ratios from all the replicate hybridizations.
Phylogeny Reconstruction
Following the method of Powollik et al. (2002), we preferred to discretize the log. ratios into a number of states. We chose a simple binary classification, that is, assigning a value of one or zero to a log. ratio dependent upon whether it is above or below a threshold that was predetermined from the self–self hybridization data. Experimental error results in a distribution of values about zero (and standard deviation, σ) of normalized log. ratios from the self–self hybridizations. The threshold was set to –0.395, corresponding to –3σ, so that only a small percentage of ORFs from the self–self hybridizations had a normalized log. ratio below this threshold. These ORFs were removed from further analysis. Consequently, we could be confident that any normalized log. ratios from other species that fall below this threshold represented genuine sequence differences. The actual value of σ was a trimmed estimate, which has excluded the upper and lower 5% of the self–self normalized log. ratios. We then used maximum parsimony (Page and Holmes 2002) to construct the phylogeny of Saccharomyces species. In particular, we applied Camin-Sokal parsimony by using the PHYLIP (http://evolution.genetics.washington.edu/phylip.html) phylogeny software package. To test the consistency of the constructed phylogenies, we evaluated bootstrap values at each node. We bootstrapped both by resampling (with replacement) from the binary data, and separately by resampling (with replacement) from the replicate hybridizations for each ORF and for each species. The latter resampling was to evaluate the stability of the constructed phylogeny to the residual noise in the normalized log. ratios, in particular, those log. ratios that lie close to the threshold used for conversion to a binary form. In both cases, bootstrap support values were 100% at each node (evaluated from a consensus of 1000 trees). The consensus phylogenetic trees produced represent only the phylogenetic relationships between the various Saccharomyces species. The trees are displayed as phenograms—the branch lengths depicted do not denote any information.
DNA Manipulations
Primers for PCR were designed by using the design facility on the Saccharomyces Genome Database (SGD) Web site, and all were obtained from MWG Biotech, Ltd. The mating-type PCR was carried out as described (Huxley et al. 1990), and all other PCR amplifications were optimized (Sambrook et al. 1989) and checked by gel electrophoresis. DNA for sequencing was purified with the Qiagen PCR Purification Kit. Sequencing was carried out with an ABI PRISM and the dye terminator cycle sequencing ready reaction kit (ABI Prism Ready Reaction Kit version 3.1). Sequence data were compared to the genome data available for other Saccharomyces sensu stricto species on the Synteny Viewer facility at the SGD Web site.
Acknowledgments
We thank Daniela Delneri for useful discussions and her critical reading of the manuscript. L.C.E.-I. is the grateful recipient of a BBSRC studentship. D.C.H. holds an MRC Bioinformatics Fellowship. This work was supported by a grant from the Biotechnology & Biological Sciences Research Council (BBSRC) (to L.I.S. and S.G.O.), a grant from the Bioarray Consortium of the North-West Science Initiative (to S.G.O.), and a research contract from Genencor International (to S.G.O.). The facilities of the Transcriptome Resource Facility of COGEME (Coordinator, S.G.O.) are gratefully acknowledged.
The publication costs of this article were defrayed in part by payment of page charges. This article must therefore be hereby marked “advertisement” in accordance with 18 USC section 1734 solely to indicate this fact.
Article and publication are at http://www.genome.org/cgi/doi/10.1101/gr.2114704.
Footnotes
[Supplemental material is available online at www.genome.org and http://www.cogeme.man.ac.uk/Facilities/projects.html.]
References
- Adams, A., Gottschling, D.E., Kaiser, C.A., and Stearns, T. 1997. Methods in yeast genetics. Cold Spring Harbor Laboratory Press, Cold Spring Harbor, NY.
- Botstein, D. and Fink, G.R. 1988. Yeast: An experimental organism for modern biology. Science 240: 1439–1443. [DOI] [PubMed] [Google Scholar]
- Brown, T.A. 2002. Genomes. BIOS Scientific Publishers, New York.
- Cliften, P., Sudarsanam, P., Desikan, A., Fulton, L., Fulton, B., Majors, J., Waterston, R., Cohen, B.A., and Johnston, M. 2003. Finding functional features in Saccharomyces genomes by phylogenetic footprinting. Science 301: 71–76. [DOI] [PubMed] [Google Scholar]
- Codon, A.C., Benitez, T., and Korhola, M. 1998. Chromosomal polymorphism and adaptation to specific industrial environments of Saccharomyces strains. Appl. Microbiol. Biotechnol. 49: 154–163. [DOI] [PubMed] [Google Scholar]
- Cohn, M., McEachern, M.J., and Blackburn, E.H. 1998. Telomeric sequence diversity within the genus Saccharomyces. Curr. Genet. 33: 83–91. [DOI] [PubMed] [Google Scholar]
- Daubin, V., Gouy, M., and Perriere, G. 2002. A phylogenomic approach to bacterial phylogeny: Evidence of a core of genes sharing a common history. Genome Res. 12: 1080–1090. [DOI] [PMC free article] [PubMed] [Google Scholar]
- Delneri, D., Colson, I., Grammenoudi, S., Roberts, I.N., Louis, E.J., and Oliver, S.G. 2003. Engineering evolution to study speciation in yeasts. Nature 422: 68–72. [DOI] [PubMed] [Google Scholar]
- Dorrell, N., Mangan, J.A., Laing, K.G., Hinds, J., Linton, D., Al-Ghusein, H., Barrell, B.G., Parkhill, J., Stoker, N.G., Karlyshev, A.V., et al. 2001. Whole genome comparison of Campylobacter jejuni human isolates using a low-cost microarray reveals extensive genetic diversity. Genome Res. 11: 1706–1715. [DOI] [PMC free article] [PubMed] [Google Scholar]
- Dubois, E., Jacobs, E., and Jauniaux, J.C. 1982. Expression of the ROAM mutations in Saccharomyces cerevisiae: Involvement of trans-acting regulatory elements and relation with the Ty1 transcription. EMBO J. 1: 1133–1139. [DOI] [PMC free article] [PubMed] [Google Scholar]
- Dujon, B. 1996. The yeast genome project: What did we learn? Trends Genet. 12: 263–270. [DOI] [PubMed] [Google Scholar]
- Fingerman, E.G., Dombrowski, P.G., Francis, C.A., and Sniegowski, P.D. 2003. Distribution and sequence analysis of a novel Ty3-like element in natural Saccharomyces paradoxus isolates. Yeast 20: 761–770. [DOI] [PubMed] [Google Scholar]
- Fischer, G., James, S.A., Roberts, I.N., Oliver, S.G., and Louis, E.J. 2000. Chromosomal evolution in Saccharomyces. Nature 405: 451–454. [DOI] [PubMed] [Google Scholar]
- Giaever, G., Chu, A.M., Ni, L., Connelly, C., Riles, L., Veronneau, S., Dow, S., Lucau-Danila, A., Anderson, K., Andre, B., et al. 2002. Functional profiling of the Saccharomyces cerevisiae genome. Nature 418: 387–391. [DOI] [PubMed] [Google Scholar]
- Goffeau, A., Barrell, B.G., Bussey, H., Davis, R.W., Dujon, B., Feldmann, H., Galibert, F., Hoheisel, J.D., Jacq, C., Johnston, M., et al. 1996. Life with 6000 genes. Science 274: 546, 563–567. [DOI] [PubMed] [Google Scholar]
- Granchi, L., Ganucci, D., Viti, C., Giovannetti, L., and Vincenzini, M. 2003. Saccharomyces cerevisiae biodiversity in spontaneous commercial fermentations of grape musts with “adequate” and “inadequate” assimilable-nitrogen content. Lett. Appl. Microbiol. 36: 54–58. [DOI] [PubMed] [Google Scholar]
- Hayes, A., Zhang, N., Wu, J., Butler, P.R., Hauser, N.C., Hoheisel, J.D., Lim, F.L., Sharrocks, A.D., and Oliver, S.G. 2002. Hybridization array technology coupled with chemostat culture: Tools to interrogate gene expression in Saccharomyces cerevisiae. Methods 26: 281–290. [DOI] [PubMed] [Google Scholar]
- Hennequin, C., Thierry, A., Richard, G.F., Lecointre, G., Nguyen, H.V., Gaillardin, C., and Dujon, B. 2001. Microsatellite typing as a new tool for identification of Saccharomyces cerevisiae strains. J. Clin. Microbiol. 39: 551–559. [DOI] [PMC free article] [PubMed] [Google Scholar]
- Huxley, C., Green, E.D., and Dunham, I. 1990. Rapid assessment of S. cerevisiae mating type by PCR. Trends Genet. 6: 236. [DOI] [PubMed] [Google Scholar]
- Kellis, M., Patterson, N., Endrizzi, M., Birren, B., and Lander, E.S. 2003. Sequencing and comparison of yeast species to identify genes and regulatory elements. Nature 423: 241–254. [DOI] [PubMed] [Google Scholar]
- Kim, J.M., Vanguri, S., Boeke, J.D., Gabriel, A., and Voytas, D.F. 1998. Transposable elements and genome organization: A comprehensive survey of retrotransposons revealed by the complete Saccharomyces cerevisiae genome sequence. Genome Res. 8: 464–478. [DOI] [PubMed] [Google Scholar]
- Kron, S.J. 1997. Filamentous growth in budding yeast. Trends Microbiol. 5: 450–454. [DOI] [PubMed] [Google Scholar]
- Kurtzman, C.P. and Robnett, C.J. 2003. Phylogenetic relationships among yeasts of the “Saccharomyces complex” determined from multigene sequence analyses. FEM Yeast Res. 3: 417–432. [DOI] [PubMed] [Google Scholar]
- Lage, J.M., Leamon, J.H., Pejovic, T., Hamann, S., Lacey, M., Dillon, D., Segraves, R., Vossbrinck, B., Gonzalez, A., Pinkel, D., et al. 2003. Whole genome analysis of genetic alterations in small DNA samples using hyperbranched strand displacement amplification and array-CGH. Genome Res. 13: 294–307. [DOI] [PMC free article] [PubMed] [Google Scholar]
- Lockhart, L., Oliver, S.G., and Delneri, D. 2002. Tools for the study of genome rearrangements in laboratory and industrial yeast strains. Yeast 19: 441–448. [DOI] [PubMed] [Google Scholar]
- Mathews, C.K., van Holde, K.E., and Ahern, K.G. 2000. Biochemistry. Benjamin/Cummings, San Francisco, CA.
- McCullough, M.J., Clemons, K.V., McCusker, J.H., and Stevens, D.A. 1998. Species identification and virulence attributes of Saccharomyces boulardii (nom. inval.). J. Clin. Microbiol. 36: 2613–2617. [DOI] [PMC free article] [PubMed] [Google Scholar]
- McFarland, L.V. 1996. Saccharomyces boulardii is not Saccharomyces cerevisiae. Clin. Infect. Dis. 22: 200–201. [DOI] [PubMed] [Google Scholar]
- Mitterdorfer, G., Kneifel, W., and Viernstein, H. 2001. Utilization of prebiotic carbohydrates by yeasts of therapeutic relevance. Lett. Appl. Microbiol. 33: 251–255. [DOI] [PubMed] [Google Scholar]
- Mitterdorfer, G., Mayer, H.K., Kneifel, W., and Viernstein, H. 2002. Clustering of Saccharomyces boulardii strains within the species S. cerevisiae using molecular typing techniques. J. Appl. Microbiol. 93: 521–530. [DOI] [PubMed] [Google Scholar]
- Mortimer, R.K. 2000. Evolution and variation of the yeast (Saccharomyces) genome. Genome Res. 10: 403–409. [DOI] [PubMed] [Google Scholar]
- Mortimer, R.K. and Johnston, J.R. 1986. Genealogy of principal strains of the yeast genetic stock center. Genetics 113: 35–43. [DOI] [PMC free article] [PubMed] [Google Scholar]
- Murray, A.E., Lies, D., Li, G., Nealson, K., Zhou, J., and Tiedje, J.M. 2001. DNA/DNA hybridization to microarrays reveals gene-specific differences between closely related microbial genomes. Proc. Natl. Acad. Sci. 98: 9853–9858. [DOI] [PMC free article] [PubMed] [Google Scholar]
- Nakazato, A., Kadokura, T., Amano, M., Harayama, T., Murakami, Y., Takeda, M., Ohkuma, M., Kudo, T., and Kaneko, T. 1998. Comparison of the structural characteristics of chromosome VI in Saccharomyces sensu stricto: The divergence, species-dependent features and uniqueness of sake yeasts. Yeast 14: 723–731. [DOI] [PubMed] [Google Scholar]
- Naumov, G.I., Naumova, E.S., Lantto, R.A., Louis, E.J., and Korhola, M. 1992. Genetic homology between Saccharomyces cerevisiae and its sibling species S. paradoxus and S. bayanus: Electrophoretic karyotypes. Yeast 8: 599–612. [DOI] [PubMed] [Google Scholar]
- Naumov, G.I., James, S.A., Naumova, E.S., Louis, E.J., and Roberts, I.N. 2000. Three new species in the Saccharomyces sensu stricto complex: Saccharomyces cariocanus, Saccharomyces kudriavzevii and Saccharomyces mikatae. Int. J. Syst. Evol. Microbiol. 50: 1931–1942. [DOI] [PubMed] [Google Scholar]
- Neuveglise, C., Feldmann, H., Bon, E., Gaillardin, C., and Casaregola, S. 2002. Genomic evolution of the long terminal repeat retrotransposons in hemiascomycetous yeasts. Genome Res. 12: 930–943. [DOI] [PMC free article] [PubMed] [Google Scholar]
- Page, R.D.M. and Holmes, E.C. 2002. Molecular evolution: A phylogenetic approach. Blackwell, Oxford, UK.
- Porwollik, S., Wong, R.M., and McClelland, M. 2002. Evolutionary genomics of Salmonella: Gene acquisitions revealed by microarray analysis. Proc. Natl. Acad. Sci. 99: 8956–8961. [DOI] [PMC free article] [PubMed] [Google Scholar]
- Querol, A., Barrio, E., Huerta, T., and Ramon, D. 1992. Molecular monitoring of wine fermentations conducted by active dry yeast strains. Appl. Environ. Microbiol. 58: 2948–2953. [DOI] [PMC free article] [PubMed] [Google Scholar]
- Rachidi, N., Barre, P., and Blondin, B. 1999. Multiple Ty-mediated chromosomal translocations lead to karyotype changes in a wine strain of Saccharomyces cerevisiae. Mol. Gen. Genet. 261: 841–850. [DOI] [PubMed] [Google Scholar]
- Ribeiro-dos-Santos, G., Schenberg, A.C., Gardner, D.C.J., and Oliver, S.G. 1997. Enhancement of Ty transposition at the ADH4 and ADH2 loci in meiotic yeast cells. Mol. Gen. Genet. 254: 555–561. [DOI] [PubMed] [Google Scholar]
- Rokas, A., Williams, B.L., King, N., and Carroll, S.B. 2003. Genome-scale approaches to resolving incongruence in molecular phylogenies. Nature 425: 798–804. [DOI] [PubMed] [Google Scholar]
- Salama, N., Guillemin, K., McDaniel, T.K., Sherlock, G., Tompkins, L., and Falkow, S. 2000. A whole-genome microarray reveals genetic diversity among Helicobacter pylori strains. Proc. Natl. Acad. Sci. 97: 14668–14673. [DOI] [PMC free article] [PubMed] [Google Scholar]
- Sambrook, J., Fritsh, E.F., and Maniatis, T. 1989. Molecular cloning: A laboratory manual. Cold Spring Harbor Laboratory Press, Cold Spring Harbor, NY.
- Seoighe, C. and Wolfe, K.H. 1998. Extent of genomic rearrangement after genome duplication in yeast. Proc. Natl. Acad. Sci. 95: 4447–4452. [DOI] [PMC free article] [PubMed] [Google Scholar]
- Sherman, F., Fink, G.R., and Hicks, J.B. 1986. Methods in yeast genetics. Cold Spring Harbor Laboratory Press, Cold Spring Harbor, NY.
- Sicheritz-Ponten, T. and Andersson, S.G. 2001. A phylogenomic approach to microbial evolution. Nucleic Acids Res. 29: 545–552. [DOI] [PMC free article] [PubMed] [Google Scholar]
- Tamai, Y., Momma, T., Yoshimoto, H., and Kaneko, Y. 1998. Co-existence of two types of chromosome in the bottom fermenting yeast, Saccharomyces pastorianus. Yeast 14: 923–933. [DOI] [PubMed] [Google Scholar]
- Thao, M.L., Baumann, L., Hess, J.M., Falk, B.W., Ng, J.C., Gullan, P.J., and Baumann, P. 2003. Phylogenetic evidence for two new insect-associated Chlamydia of the family Simkaniaceae. Curr. Microbiol. 47: 46–50. [DOI] [PubMed] [Google Scholar]
- Warmington, J.R. and Oliver, S.G. 1988. A downstream activator sequence regulates the expression of the yeast transposon. Curr. Genet. 13: 357–362. [DOI] [PubMed] [Google Scholar]
- Warmington, J.R., Anwar, R., Newlon, C.S., Waring, R.B., Davies, R.W., Indge, K.J., and Oliver, S.G. 1986. A “hot-spot” for Ty transposition on the left arm of yeast chromosome III. Nucleic Acids Res. 14: 3475–3485. [DOI] [PMC free article] [PubMed] [Google Scholar]
- Warmington, J.R., Green, R.P., Newlon, C.S., and Oliver, S.G. 1987. Polymorphisms on the right arm of yeast chromosome III associated with Ty transposition and recombination events. Nucleic Acids Res. 15: 8963–8982. [DOI] [PMC free article] [PubMed] [Google Scholar]
- Wicksteed, B.L., Collins, I., Dershowitz, A., Stateva, L.I., Green, R.P., Oliver, S.G., Brown, A.J., and Newlon, C.S. 1994. A physical comparison of chromosome III in six strains of Saccharomyces cerevisiae. Yeast 10: 39–57. [DOI] [PubMed] [Google Scholar]
- Winston, F., Dollard, C., and Ricupero-Hovasse, S.L. 1995. Construction of a set of convenient Saccharomyces cerevisiae strains that are isogenic to S288C. Yeast 11: 53–55. [DOI] [PubMed] [Google Scholar]
- Winzeler, E.A., Castillo-Davis, C.I., Oshiro, G., Liang, D., Richards, D.R., Zhou, Y., and Hartl, D.L. 2003. Genetic diversity in yeast assessed with whole-genome oligonucleotide arrays. Genetics 163: 79–89. [DOI] [PMC free article] [PubMed] [Google Scholar]
- Yang, Y.H., Dudoit, S., Luu, P., and Speed, T.P. 2001. Microarrays: Optical technologies and informatics. SPIE, Bellingham, WA.
- Yang, Y.H., Dudoit, S., Luu, P., Lin, D.M., Peng, V., Ngai, J., and Speed, T.P. 2002. Normalization for cDNA microarray data: A robust composite method addressing single and multiple slide systematic variation. Nucleic Acids Res. 30: e15. [DOI] [PMC free article] [PubMed] [Google Scholar]
- Zou, S., Wright, D.A., and Voytas, D.F. 1995. The Saccharomyces Ty5 retrotransposon family is associated with origins of DNA replication at the telomeres and the silent mating locus HMR. Proc. Natl. Acad. Sci. 92: 920–924. [DOI] [PMC free article] [PubMed] [Google Scholar]