Abstract
Balancing quiescence, self-renewal, and differentiation in adult stem cells is critical for tissue homeostasis. The underlying mechanisms, however, remain incompletely understood. Here we identify Fezf2 as a novel regulator of fate balance in adult zebrafish dorsal telencephalic neural stem cells (NSCs). Transgenic reporters show intermingled fezf2-GFPhi quiescent and fezf2-GFPlo proliferative NSCs. Constitutive or conditional impairment of fezf2 activity demonstrates its requirement for maintaining quiescence. Analyses of genetic chimeras reveal a dose-dependent role of fezf2 in NSC activation, suggesting that the difference in fezf2 levels directionally biases fate. Single NSC profiling coupled with genetic analysis further uncovers a fezf2-dependent gradient Notch activity that is high in quiescent and low in proliferative NSCs. Finally, fezf2-GFPhi quiescent and fezf2-GFPlo proliferative NSCs are observed in postnatal mouse hippocampus, suggesting possible evolutionary conservation. Our results support a model in which fezf2 heterogeneity patterns gradient Notch activity among neighbors that is critical to balance NSC fate.
Keywords: adult neurogenesis, hippocampus, radial glia, self-renewal, single-cell analysis, vivo morpholino
Introduction
Adult stem cells (ASCs) are largely quiescent yet retain the potential to self-renew and differentiate upon normal turnover or injury (Gage, 2000; Weissman et al., 2001; Morrison and Kimble, 2006; Morrison and Spradling, 2008; Blanpain and Fuchs, 2009; Fuchs, 2009; Miller and Gauthier-Fisher, 2009; Li and Clevers, 2010). Classically, SC balance is thought to occur through asymmetric division of individual SCs. Recent evidence suggests that the balance can also be achieved at the SC population level (Simons and Clevers, 2011). However, the underlying mechanisms remain incompletely understood.
In postembryonic mammals, neural stem cells (NSCs) are primarily restricted to the subventricular zone (SVZ) of the lateral ventricles and the subgranular zone (SGZ) of the hippocampal dentate gyrus (Temple and Alvarez-Buylla, 1999; Zhao et al., 2008; Bonaguidi et al., 2011). By contrast, both quiescent and proliferative NSCs are detected in the ventricular zones throughout the adult zebrafish CNS (Zupanc et al., 2005; Adolf et al., 2006; Chapouton et al., 2006; Grandel et al., 2006; Rothenaigner et al., 2011). The cellular compositions of zebrafish neurogenic periventricular niches are similar to that of the mammalian SVZ and SGZ in both heterogeneity and richness of cellular states (März et al., 2010; Lindsey et al., 2012). These features make zebrafish an invaluable comparative model for uncovering core and novel mechanisms underlying NSC maintenance and fate.
Both extrinsic and intrinsic mechanisms regulate postembryonic vertebrate NSC fate (Ming and Song, 2011). It is commonly thought that extracellular niche-derived signals instruct specific receptors, which regulate intracellular proteins (e.g., transcription regulators) that in turn control NSC fate. It is not known whether transcription regulators expressed in NSCs can regulate their fate both cell-autonomously and nonautonomously.
Fezf2 is an evolutionarily conserved forebrain-enriched zinc finger transcription factor (Shimizu and Hibi, 2009). Its role in patterning the developing diencephalon (Hirata et al., 2006; Jeong et al., 2007) and specifying distinct forebrain neuronal subtypes (Guo et al., 1999; Levkowitz et al., 2003; Chen et al., 2005a, b; Molyneaux et al., 2005; Jeong et al., 2006; Rouaux and Arlotta, 2010; Yang et al., 2012) has been reported, although mechanistic insights remain sketchy. Recently, fezf2 expression is detected in the adult zebrafish dorsal telencephalic (DTel) radial glia-like progenitors (RGLs) (Berberoglu et al., 2009). Little is known about whether and how fezf2 might regulate the behavior of adult NSCs.
Here, by using transgenic reporters, we discovered that DTel NSCs intermingled in fezf2-GFPhi quiescent and fezf2-GFPlo proliferative states. Using the too few (tof) mutant, adult-specific knockdown, and ex vivo clonal culture, we determined that fezf2 is intrinsically required to maintain NSC quiescence. Through constructing and analyzing in vivo genetic chimeras, we unearthed a surprising cell-nonautonomous role of fezf2 in NSC activation. This intriguing phenomenon was further explainable by our single-cell profiling, which revealed a requirement of fezf2 to regulate Notch activity. Finally, we observed that fezf2 levels in the postnatal mouse hippocampus were, as in zebrafish, high among quiescent and low in active NSCs. Together, these findings illuminate a critical role of fezf2 in regulating adult vertebrate neurogenesis and patterning gradient Notch activity among neighboring cells.
Materials and Methods
Animals.
Three- to 14-month old adult zebrafish (Danio rerio, of either sex) were used in this study, including wild-type (WT) zebrafish of the AB strain, fezf2-GFP transgenic fish (Berberoglu et al., 2009), vglut2a-GFP transgenic fish (Bae et al., 2009), and tof/fezf2 mutant zebrafish (Guo et al., 1999). Adult and larval tof/fezf2 mutant zebrafish were identified by genotyping (Levkowitz et al., 2003). The GENSAT BAC transgenic Fezf2-GFP mouse (stock #000293-UNC) was obtained from Mutant Mouse Regional Resource Centers, and mice of either sex were used in this study. Zebrafish and mice were maintained at University of California, San Francisco in accordance with National Institutes of Health and University of California, San Francisco guidelines.
BrdU and EdU labeling.
BrdU and EdU labeling was performed as previously described (Berberoglu et al., 2009). For EdU, the click chemistry reaction was performed according to the manufacturer's instructions (Click-iT EdU AlexaFluor-594 Imaging Kit, Catalog #C10339, Invitrogen).
Immunohistochemistry, imaging, and processing.
Immunohistochemistry was performed as previously described (Berberoglu et al., 2009; Li et al., 2013). Antibodies used in this study are the following: chicken anti-GFP (Abcam), mouse anti-HuC/D (Invitrogen), rabbit anti-BLBP (Abcam), rabbit anti-Sox3 (A gift from Dr. M. Klymkowsky), mouse anti-proliferative cell nuclear antigen (PCNA; Dako), mouse anti-acetylated tubulin (Sigma), rat anti-BrdU (Abcam), mouse anti-BrdU (Sigma), and rabbit anti- Notch Intracellular Domain (NICD; Cell Signaling Technology) (Table 1). TUNEL for cell death was performed as described in In Situ Cell Death Detection Kit, TMR red (Roche, catalog #12156792910). Images were obtained using Leica or Zeiss confocal microscopes. Brain sections of similar anatomical levels from three to five brains were chosen for quantification. One to four optical z-sections covering 0.5 to 4 μm thickness were used whenever appropriate to assess colocalization of markers. Adobe photoshop and National Institutes of Health ImageJ were used for image processing and analysis. GraphPad Prism 5 software was used for statistical analysis.
Table 1.
List of antibodies used for immunohistochemistry
| Immunogen | Host species | Vendor | Working concentration |
|---|---|---|---|
| GFP | Chicken | Abcam | 1:2500 |
| HuC/D | Mouse | Invitrogen | 1:1000 |
| BLBP | Rabbit | Abcam | 1:400 |
| Sox3 | Rabbit | Gift from Dr. M. Klymkowsky | 1:1000 |
| PCNA | Mouse | Dako | 1:500 |
| Acetylated tubulin | Mouse | Sigma | 1:2000 |
| BrdU | Rat | Abcam | 1:2000 |
| BrdU | Mouse | Sigma | 1:600 |
| NICD | Rabbit | Cell Signaling Technology | 1:500 |
Generation of in vivo genetic chimeras.
Forty cells from the animal pole of 3–4 hpf (hour post fertilization) donor embryos (carrying the transgene fezf2-GFP, lineage tracer Rhodamine-Dextran [RD]) were transplanted into host embryos of an equivalent stage. Hosts were screened for GFP expression at 24 hpf and raised to either 2-week-old or adulthood. Corresponding donors (or hosts) were genotyped to identify whether they are WT, heterozygous, or homozygous for the fezf2 mutation.
Ex vivo clonal culture.
The dorsal telencephalic periventricular region of the adult Tg[fezf2-GFP] animals was acutely dissected and washed with Hank's balanced salt solution (Invitrogen). Tissues were disassociated in TrypLE (catalog #12536, Invitrogen). FACS was performed following dissociation using FACSAria III (BD Biosciences). GFP+ cells were cultured in neurosphere proliferative medium with EGF and bFGF as previously described (Sugiarto et al., 2011). Cells were plated at a clonal density in 6-well plate (∼40 cells per mm2) and cultured for 48 h.
Single-cell nanofluidic real-time PCR on Fluidigm dynamic arrays.
FACS sorted cells were preselected by semiquantitative RT-PCR for fezf2 expression and then subjected to nanofluidic real-time PCR using the Fluidigm 48.48 Dynamic Array Chips following the manufacturer's instructions (Spurgeon et al., 2008). The single-cell gene expression data were analyzed using hierarchical clustering (Eisen et al., 1998). The expression for each gene in the WT and mutant RGL populations was compared by a modified version of t test with variations of gene expression estimated from a set of genes with similar expression levels (Collins et al., 2006).
Results
fezf2-GFPhi and fezf2-GFPlo NSCs intermingle in the DTel periventricular zone (PVZ)
We previously reported that fezf2 is expressed in the adult zebrafish DTel RGLs, exclusively colocalizing with NSC markers in the PVZ (Berberoglu et al., 2009). Characterizations of these RGLs by other groups suggest that they are largely quiescent but can also be activated during normal homeostasis (Adolf et al., 2006; Grandel et al., 2006; Rothenaigner et al., 2011) or upon injury (Kroehne et al., 2011; Baumgart et al., 2012; Kizil et al., 2012), thus behaving like NSCs. We therefore will refer to them as putative NSCs (NSCs in short) throughout this article.
Because all anti-Fezf2 antibodies that we generated failed to detect the protein by immunofluorescence, we resorted to a transgenic reporter line for characterizing fezf2-expressing NSCs. The reporter line was driven by conserved genomic fragments that well recapitulated fezf2 expression in the adult zebrafish DTel NSCs (Berberoglu et al., 2009) (see also single-cell profiling data in subsequent paragraphs). In addition to cell bodies, GFP also highlighted the striking spine-like processes in these RGLs (Fig. 1A, arrows). Intriguingly, we observed intercellular heterogeneity in GFP intensity, with fezf2-GFPhi and fezf2-GFPlo cells intermingled (Fig. 1A). Double-labeling with PCNA, which marks cells with proliferative potential (Wullimann and Puelles, 1999), further showed that the fezf2-GFPhi cells were PCNA− (quiescent, red arrowheads), and PCNA+ cells were either fezf2-GFPlo (yellow arrowheads) or fezf2-GFPundetectable (possibly intermediate progenitors, white arrowheads). However, some fezf2-GFPlo cells did not have detectable PCNA, implying that downregulation of fezf2 precedes the induction of PCNA (Fig. 1A–C). Scatter plotting of fezf2-GFPhiPCNA− and fezf2-GFPloPCNA+ cells revealed an inverse relationship between GFP and PCNA immunoreactivity (Fig. 1D). These results suggest that fezf2 level distinguishes different cellular states in the DTel NSCs: It is high in quiescent, low in proliferative NSCs, and becomes undetectable in differentiating lineages.
Figure 1.
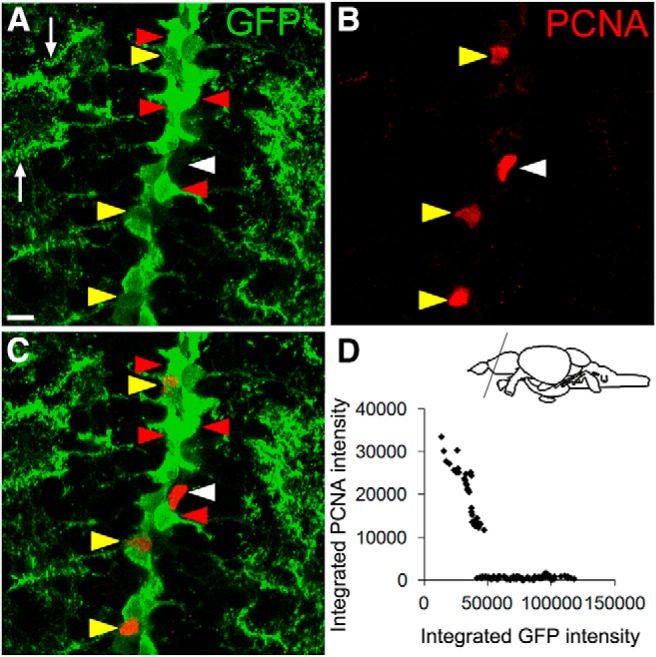
fezf2-GFPhi and fezf2-GFPlo NSCs intermingle in the DTel PVZ. A–C, Representative images show correlation between GFP and PCNA immunoreactivity. White arrow indicates spine-like processes of RGLs; red arrowhead indicates fezf2-GFPhi PCNA−, yellow arrowhead indicate fezf2-GFPlo PCNA+; white arrowhead indicates fezf2-GFPundetectable PCNA+. Scale bar, 10 μm. D, Scatter plot shows an inverse correlation of GFP and PCNA in fezf2-GFPhi PCNA− and fezf2-GFPlo PCNA+ cells (fezf2-GFPlo PCNA− cells were not included). In total, 136 cells were analyzed. Spearman correlation test, r = −0.530, p < 0.001.
fezf2 Is required to maintain NSC quiescence and promote neuronal maturation in the adult zebrafish DTel
To determine whether fezf2 is essential to regulate the fate of adult DTel NSCs, we analyzed the too few (tofm808) mutant, which is adult viable (Guo et al., 1999; Levkowitz et al., 2003). A strikingly smaller telencephalon was observed in the mutant compared with WT and heterozygous siblings, whereas other brain regions, such as the optic tectum and cerebellum, were unaffected (Fig. 2A–D). Because reduced telencephalic size was not apparent in the 2-week-old homozygous mutant (data not shown), this observation reveals a postlarval telencephalic expansion that is dependent on fezf2.
Figure 2.
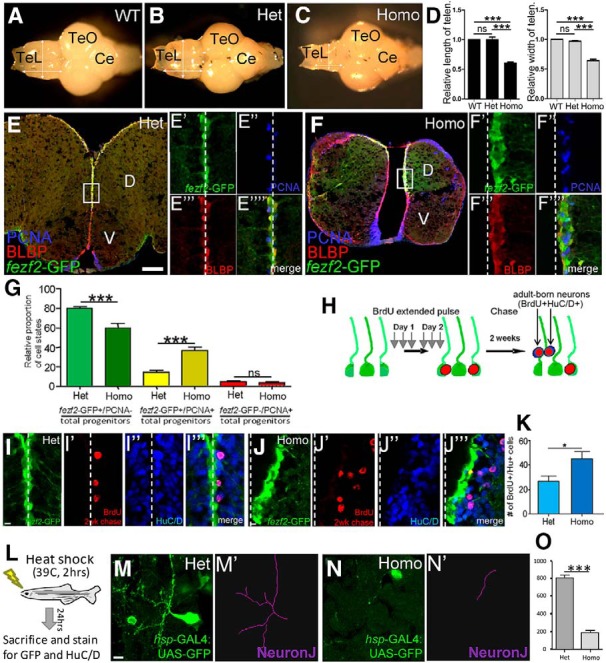
fezf2 is required for maintaining adult NSC quiescence and promoting the maturation of adult-born neurons. A–D, tof/fezf2 homozygous adult telencephalon is significantly smaller in size (C) compared with WT (A) and heterozygous (B) siblings, whereas the size of optic tectum (TeO) and cerebellum (Ce) is normal. D, Quantification of relative size of telencephalon compared with the rest of the brain (n = 6 brains for each genotype). Values are mean ± SEM. **p < 0.01 (one-way ANOVA followed by Tukey's Post Hoc Test). ***p < 0.001 (one-way ANOVA followed by Tukey's Post Hoc Test). E–E′′′′, Analysis of adult Tg[fezf2-GFP];fezf2+/m808 telencephalon with labeling for fezf2-GFP/BLBP/PCNA. Scale bar, 100 μm. F–F′′′′, Analysis of adult Tg[fezf2-GFP];fezf2m808/m808 telencephalon reveals a smaller telencephalon and often unaligned fezf2-expressing domains. Immunohistochemistry shows an increase in fezf2-GFP+/BLBP+ cells, as well as an increase in proliferation of these cells (PCNA+). G, Quantification of relative cell states shows a decrease of percentage quiescent fezf2-GFP+ cells and an increase of percentage proliferative fezf2-GFP+ cells in the mutant. No change in proliferation is observed for fezf2-GFP−PCNA+ (likely intermediate progenitor) cells (n = 3 heterozygous and 3 homozygous brains). Values are mean ± SEM. ***p < 0.001 (two-way ANOVA followed by Tukey's Post Hoc Test). H, A schematic diagram illustrating the experiment performed to assess adult neurogenesis. I–I‴, Labeling for fezf2-GFP, BrdU, and HuC/D shows adult-born neurons in the fezf2+/m808 DTel. Scale bar, 10 μm. J–J‴, Increase in adult-born neurons is observed in the fezf2m808/m808 DTel. K, Quantification shows a significant increase in adult neurogenesis in the fezf2m808/m808 DTel (n = 3 heterozygous and 3 homozygous brains). *p < 0.05 (Student's t test). Values are mean ± SEM. L–O, Analysis of neurite branching in individual DTel neurons with the NeuronJ program shows that the homozygous mutant neurons display a significant reduction in neurite extension per neuron. ***p < 0.001 (Student's t test). Values are mean ± SEM.
We next analyzed DTel NSCs by crossing the Tg[fezf2-GFP] reporter into the fezf2 mutant background and immunostaining brain sections for GFP/PCNA/BLBP (BLBP demarcates RGL NSCs). Compared with the heterozygous sibling, the adult homozygous mutant DTel often suffered an enlarged brain ventricle and distorted fezf2-expressing domain in one hemisphere (Fig. 2E,F), which was also observable in the 2-week-old mutant (data not shown), suggesting a developmental requirement of fezf2 in telencephalic dorsoventral patterning. Intriguingly, an increase of fezf2-GFP+ cells was observed in the adult mutant DTel (compare Fig. 2F′–F′′′′ with Fig. 2E′–E′′′′; white dotted lines indicate the midline). Remarkably, when we quantified the relative proportion of cell states, we observed a proportional increase of proliferative (fezf2-GFP+PCNA+) NSCs at the expense of quiescent (fezf2-GFP+PCNA−) ones in the mutant, whereas the fezf2-GFP−PCNA+ intermediate progenitors appeared unaffected (Fig. 2G).
To determine how the increased NSC proliferation might impact neurogenesis in the fezf2 mutant, we performed immunolabeling with the pan-neuronal marker Hu. A significant increase of Hu+ neurons was observed in the mutant adjacent to fezf2-GFP+ NSCs (data not shown). To verify whether the increase in neurons is an ongoing phenomenon in the adult mutant brain, we administered an extended pulse of BrdU followed by 2-week chase. These experiments revealed significantly more adult-born neurons in the mutant DTel (Fig. 1H–K). Thus, concomitant with an increased proliferation, there is an increased adult neurogenesis in the mutant DTel.
With both increased proliferation and neurogenesis, why were the mutant DTel much smaller than that of their siblings? Although a comparable level of cell death was detected in the mutant and sibling DTel (data not shown), we noted that the supernumerary Hu+ neurons in the mutant DTel appeared smaller in size, suggesting that they might not be fully mature. Thus, the reduction in the mutant DTel size might be due to the loss of white matter (neuropils). To test this idea, we used the Tg[hsp-Gal4;UAS-EGFP] animals to sparsely mark neurons through delivery of a brief heat pulse (Fig. 2L). Single-neuron morphological analysis revealed a much reduced neurite complexity in the mutant DTel (Fig. 2M–O). These findings suggest that, in addition to maintaining DTel NSC quiescence, fezf2 is needed for proper maturation of newborn neurons in the region. Because its expression becomes undetectable in differentiating lineages of the DTel by both RNA in situ and GFP reporter analysis (Berberoglu et al., 2009), fezf2 might act in progenitors to prime the expression of genes that is necessary for differentiation.
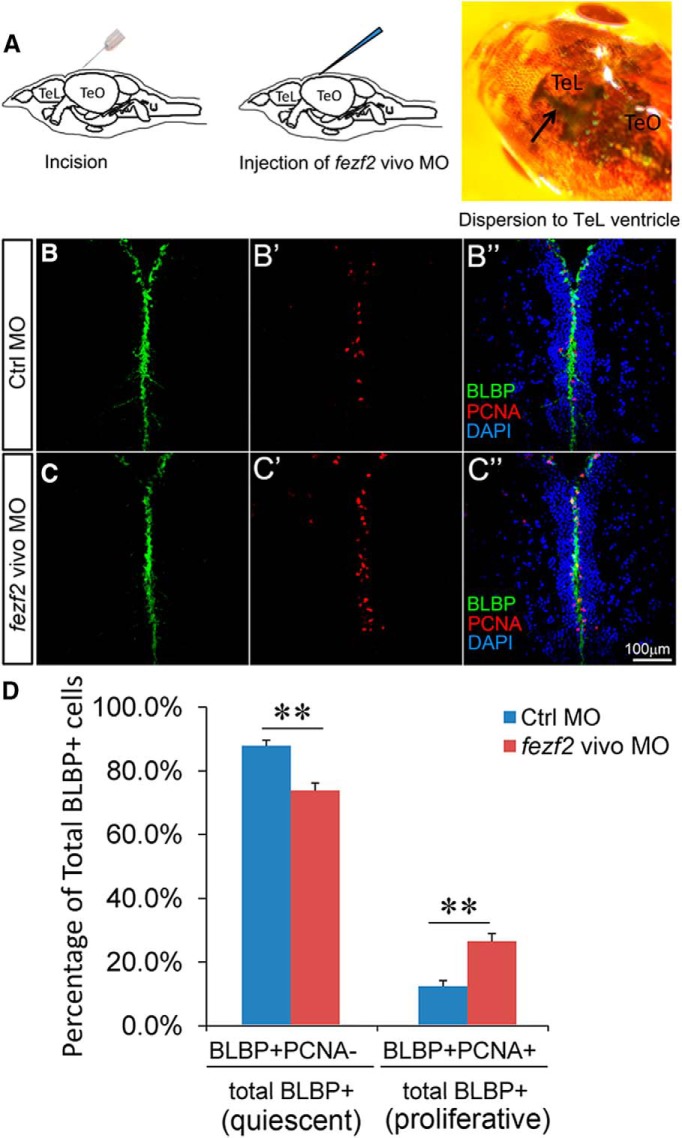
To discern whether fezf2 activity is indeed required at adult stages to regulate NSC fate, we used the vivo morpholino (MO) technology (Kizil et al., 2013) to knock down fezf2 activity specifically in the adult brain. A vivo MO antisense oligonucleotide was synthesized based on the previously validated MO (Jeong et al., 2006; Jeong et al., 2007) and delivered into the DTel ventricle via intracranial microinjection. Three days later, the brains were harvested for analysis (Fig. 3A). Compared with the control MO-injected animals, fezf2 MO-injected animals displayed significantly increased BLBP+ PCNA+ proliferative NSCs in the DTel PVZ at the expense of BLBP+ PCNA− quiescent ones (Fig. 3B–D). These findings establish an essential role of fezf2 in maintaining adult NSC quiescence in the zebrafish DTel.
Figure 3.
Adult-specific knockdown of fezf2 activity leads to NSC overproliferation. A, A schematic diagram describing the injection of fezf2 vivo MO into adult forebrain ventricles. B, C, Adult DTel from vivo MO-injected brains labeled with BLBP (B,C), PCNA (B′,C′), and DAPI (merged images B″,C″) shows increased expression of the proliferation marker PCNA (C′) compared with control (B′). D, Quantification shows an increase of BLBP+PCNA+ proliferative NSCs at the expense of BLBP+PCNA+ quiescent NSCs. N = 3 for both Ctrl MO group and fezf2 vivo MO group. Values represent mean ± SEM. **p < 0.01 (Student's t test).
Ex vivo clonal culture suggests a cell-autonomous requirement of fezf2 in maintaining adult DTel NSC quiescence
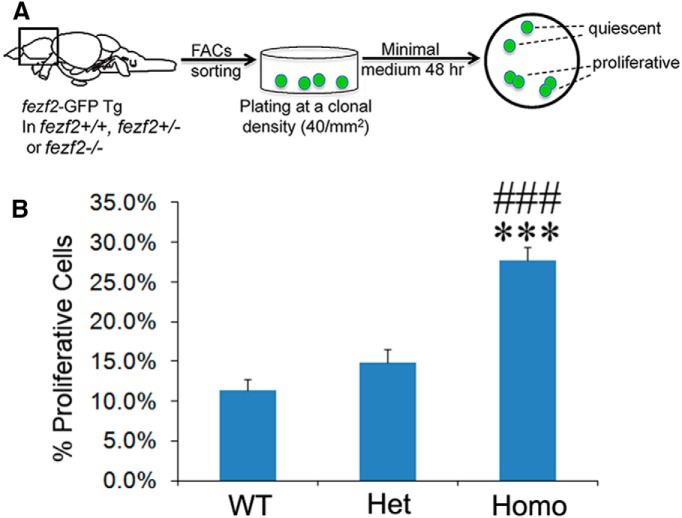
Loss of DTel NSC quiescence in vivo could reflect an intrinsic requirement of fezf2 in these cells or might be an indirect effect due to the surrounding brain environment. To determine whether fezf2 is required cell-autonomously, we established an ex vivo clonal culture system. Acutely dissociated and FACS sorted DTel PVZ fezf2-GFP+ cells were plated at a clonal density (∼40 cells per mm2) and cultured in minimal medium for 48 hours. Cells were subsequently fixed and processed for immunofluorescence labeling with GFP/PCNA/DAPI. Cells that remained singletons were considered quiescent, whereas those that divided to form paired daughters were deemed proliferative (Fig. 4A). Ex vivo clonal analysis was performed on the following genotypes harboring the fezf2-GFP transgene: fezf2+/+, fezf2+/−, and fezf2−/−. We found that the mutant culture had a significantly increased proportion of proliferative fezf2-GFP+ cells compared with those from WT and heterozygous siblings (Fig. 4B). Together, these results suggest that fezf2 is intrinsically required in the adult DTel NSCs to maintain their quiescence.
Figure 4.
fezf2 is intrinsically required to maintain NSC quiescence. A, A schematic diagram describing the process of ex vivo clonal culture. B, Quantification shows significantly increased proliferation of the fezf2m808/m808 mutant NSCs ex vivo. Thirteen wells were analyzed in WT (n = 13), 12 wells in Het (n = 12), and 13 wells in Homo (n = 13). Values represent mean ± SEM. ***p<0.001 versus WT (one-way ANOVA followed by Tukey's Post Hoc Test). ###p<0.001 versus Het (one-way ANOVA followed by Tukey's Post Hoc Test).
In vivo genetic chimeras reveal a cell-nonautonomous role of fezf2 in NSC activation
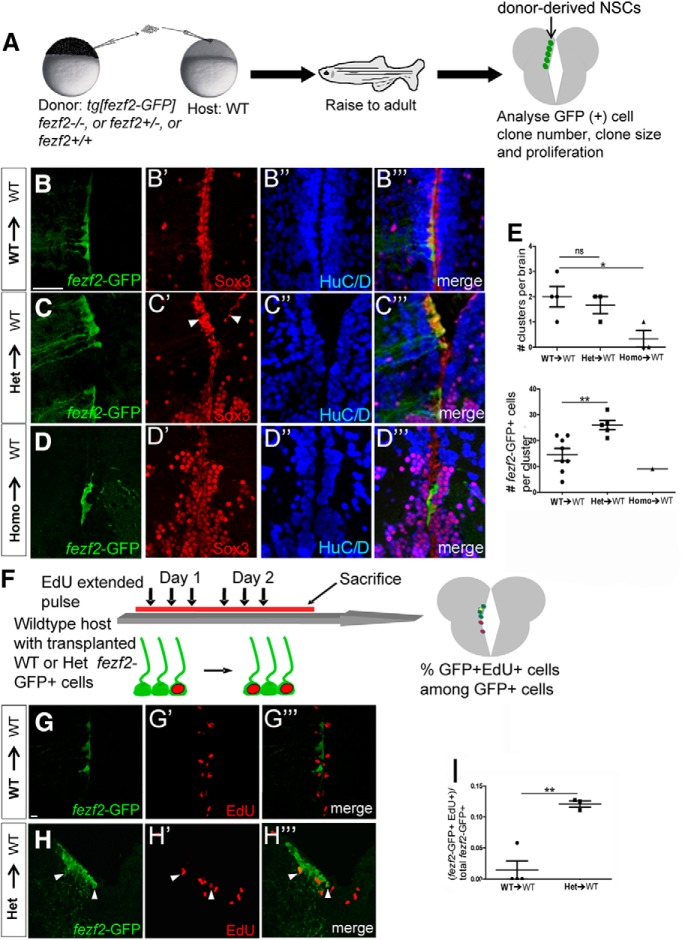
The most rigorous way to establish an exclusively intrinsic action of a gene is to generate genetic chimeras or mosaics, in which the mutant cell behavior can be analyzed in a WT host (or vice versa). We therefore transplanted ∼40 cells from a ∼4 hpf donor embryo into a WT host embryo of equivalent stages. The donor cells carried Tg[fezf2-GFP] (for marking DTel NSCs) and one of the following genotypes: fezf2+/+ (referred to as WT), fezf2+/− (referred to as heterozygous or Het), or fezf2−/− (referred to as homozygous, Homo, or mutant) (Fig. 5A). Transplantation was performed at an early developmental stage to enable seamless integration of transplanted cells into host tissues. After transplantation, the donor embryos were killed for genotyping analysis, whereas the host embryos were raised to adulthood and their brains were analyzed for the number, size, and proliferative properties of fezf2-GFP+ clones. It is worth pointing out that the Tg[fezf2-GFP] allowed us to track donor-derived NSCs but not all donor-derived cells, as fezf2 expression turns off when cells embark on differentiation.
Figure 5.
In vivo genetic chimeras uncover a cell-nonautonomous role of fezf2 in NSC activation. A, A schematic diagram illustrating the construction and analysis of in vivo genetic chimera. B–B‴, fezf2-GFP/fezf2+/+ WT cells transplanted into WT hosts show integration of donor-derived NSCs into the host DTel PVZ, and are Sox3+ and HuC/D−. Scale bar, 50 μm. C–C‴, fezf2-GFP/fezf2+/m808 heterozygous cells transplanted into WT hosts yield larger NSC clones. C′, Arrowheads indicate the difference in Sox3 expression between donor-derived NSC clones and host NSCs on the opposing hemisphere. D–D‴, fezf2-GFP/fezf2m808/m808 homozygous cells transplanted into WT hosts were largely devoid of GFP, except for one small clone in one brain. E, Quantification shows a significant decrease in the number of mutant donor-derived NSCs compared with Het or WT donor-derived clones (top). Total brains analyzed: n = 4 (WT to WT), 3 (Het to WT), and 3 (Homo to WT). p = 0.0394 (one-way ANOVA followed by Tukey's Post Hoc Test). Values represent mean ± SEM. *p < 0.05 (Student's t test). Het donor-derived clones contain significantly more NSCs compared with WT donor-derived clones (bottom). All clusters analyzed are from n = 4 (WT to WT), 3 (Het to WT), and 3 (Homo to WT) brains described above. Total numbers of clusters analyzed are as follows: n = 8 (WT to WT), 5 (Het to WT), and 1 (Homo to WT). Values are mean ± SEM. **p < 0.01. F, A schematic diagram illustrating the analysis of proliferative properties of WT versus Het donor-derived NSCs. G–G‴, None of the WT donor-derived NSCs were EdU+ in the image. H–H‴, A few Het donor-derived NSCs were EdU+ in the image (arrowheads). I, Quantification shows an increase in EdU+ NSCs that are Het donor-derived. Total numbers of clusters analyzed are as follows: n = 4 (WT to WT) and 3 (Het to WT). Values are mean ± SEM. **p < 0.01 (Student's t test).
On average, no more than three sparsely distributed donor-derived GFP+ clones were detected per host DTel PVZ. Overproliferation of mutant NSCs both in vivo and ex vivo predicted larger mutant fezf2-GFP+ clones than those from either WT or heterozygous donors, if fezf2 acts in an exclusively intrinsic manner in NSCs. However, this was not observed. In contrast, few mutant fezf2-GFP+ clones were detected in the WT brain environment (Fig. 5D, showing the only GFP clone detected in all three Homo → WT brains; Fig. 5E, top). Such clone also contained significantly fewer GFP+ cells than the WT or heterozygous counterparts (compare Fig. 5D with Fig. 5B,E, bottom).
Strikingly also, heterozygous GFP clones were significantly larger than their WT counterparts (compare Fig. 5C with Fig. 5B,E, bottom). As shown with immunolabeling for Sox3 (a marker for both ventricular NSCs and more distally located differentiating neurons), heterozygous donor-derived GFP clones expanded more than the endogenous host cells on the contralateral side (Fig. 5C′, arrowheads). No such expansion was observed with WT donor-derived GFP clones (Fig. 5B′). These results suggest that heterozygous NSCs have a proliferative advantage over neighboring WT host cells. To test this, we performed an EdU extended pulse and quantified the ratio of EdU+fezf2-GFP+ cells to total fezf2-GFP+ cells (Fig. 5F). The data showed that heterozygous GFP cells were significantly more proliferative than WT GFP cells in the WT host brains (Fig. 5G–I).
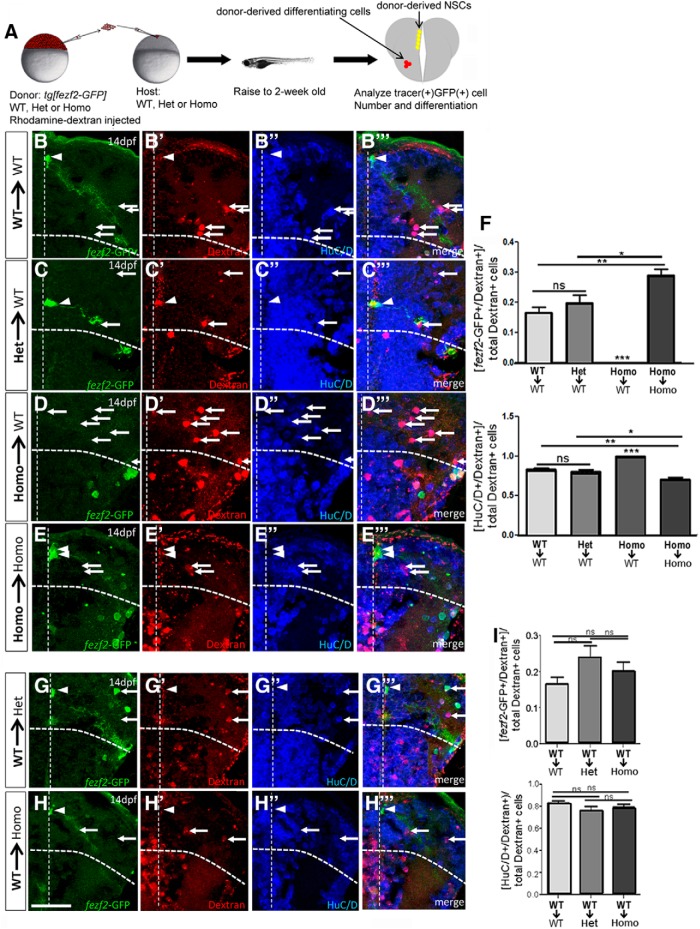
Several reasons might account for the loss of mutant NSCs in the WT environment: First, mutant clones might be less fit than WT cells and were thus outcompeted altogether by WT. If this were the case, we would expect to see the elimination of all mutant cells (not only fezf2-GFP+ NSCs) from the WT host brain. Second, mutant NSCs might be hyperproliferative at early stages, resulting in depletion at adult stages. Finally, mutant NSCs, when surrounded by WT cells, might change their fate. To discern these possibilities, we analyzed 2-week-old chimeras. Donor-derived cells were marked with the lineage tracer RD in addition to marking donor-derived NSCs with GFP (Fig. 6A). The total number of RD+ donor cells in the 2-week-old WT host brain was comparable among three different donor genetic backgrounds (Table 2), suggesting that the loss of mutant NSCs in the WT environment was not due to a loss of mutant donor cells (Fig. 6D,F, top). Moreover, quantification of Hu+RD+ cells revealed a significant increase of mutant neurons at the expense of NSCs (Fig. 6F, bottom). Precocious differentiation of mutant NSCs is due to the WT environment and not due to transplantation per se because they remained as RGLs when transplanted into the homozygous mutant host (Fig. 6E,F, top). These results suggest that mutant NSCs undergo precocious differentiation in the WT environment.
Figure 6.
Analyses of early-stage chimeras reveal precocious differentiation of fezf2 mutant NSCs when surrounded by WT cells. A, A schematic diagram showing the procedure, with donor-derived NSCs in yellow (both RD+GFP+) and donor-derived differentiating cells in red (RD+). B–E, Analyses of genotypically different donor cells in the WT host brain. Donor-derived NSCs are GFP+ (B–E) and lineage tracer RD+ (B′–E′), whereas donor-derived neurons are HuC/D+ (B″–E″) and RD+ (merged images, B′″–E′″). Depending on the rounds of divisions, some NSCs may be strongly RD+ (few divisions), whereas others may be weakly RD+ (many divisions leading to dilution). Because not every transplanted RD+ donor cells will survive the procedure, there are some extracellular RD+ speckles contributing to background signals in red. Additionally, fezf2-GFP+ progenitors and neurons are reportedly present in the subpallium (VTel) (Berberoglu et al., 2009) (see also C–E) and are therefore not counted as DTel NSCs in our analysis. F, Quantification shows a significant decrease of mutant donor-derived NSCs (left) and a corresponding increase of mutant donor-derived neurons (right) in the WT host brain. Total brains analyzed: n = 3 (WT to WT), 4 (Het to WT), 4 (Homo to WT), and 3 (Homo to Homo). Values are mean ± SEM. *p < 0.05 (one-way ANOVA followed by Tukey's Post Hoc Test). **p < 0.01 (one-way ANOVA followed by Tukey's Post Hoc Test). ***p < 0.001 (one-way ANOVA followed by Tukey's Post Hoc Test). G, H, Reciprocal transplantation of WT donor cells into the Het or the mutant brain. GFP+ (G–H), RD+ (G′–H′), HuC/D+ (G″–H″), and merged images (G′″–H′″) are shown. I, Quantification indicates that no significant differences are observed among WT cells when placed in different host environments. Total brains analyzed: n = 3 (WT to WT), 3 (WT to Het), and 3 (WT to Homo). p = 0.2517 (one-way ANOVA followed by Tukey's Post Hoc Test). Values are mean ± SEM. Scale bar, 50 μm.
Table 2.
RD+ donor cells derived from different genotypes are present in the host brain
| Donor genotype | Host genotype | Average numbers of RD+ cells per DTel |
|---|---|---|
| WT | WT | 15.330 ± 4.117 (n = 3) |
| Heterozygote | WT | 8.500 ± 1.500 (n = 4) |
| Homozygote | WT | 17.000 ± 4.796 (n = 4) |
| Homozygote | Homozygote | 7.500 ± 0.500 (n = 3) |
To follow-up on the observed hyperproliferation of heterozygous NSCs in the adult WT environment, we examined 2-week-old chimeras with heterozygous cells transplanted into WT. At this larval stage, the number of heterozygous donor NSCs showed a trend of increase but were not significantly different from that of the WT donor (Fig. 6B,C,F, top), suggesting that the hyperproliferative property of heterozygous NSCs in the WT environment is either a cumulative effect or occurs at later stages.
To determine whether WT NSCs change fate in fezf2 heterozygous or mutant environment, we performed reciprocal transplantation and analyzed the state of WT donor cells in the 2-week-old fezf2+/+, fezf2+/−, or fezf2−/− host brains. Although a trend of increase was observed for WT NSCs in the heterozygous or mutant environment, it did not reach statistical significance. No difference in neurons was detected among different host environments (Fig. 6G–I). Together, analyses of in vivo genetic chimeras suggest that, in addition to cell-autonomously maintaining quiescence, fezf2 also plays a cell-nonautonomous role in NSC activation: WT (mimicking Fezf2hi) cells appear to be capable of influencing the fate of heterozygous (mimicking Fezf2lo) and mutant (mimicking Fezf2undetectable) cells, but not vice versa.
Single and population NSC analyses identify Notch signaling as a target of Fezf2
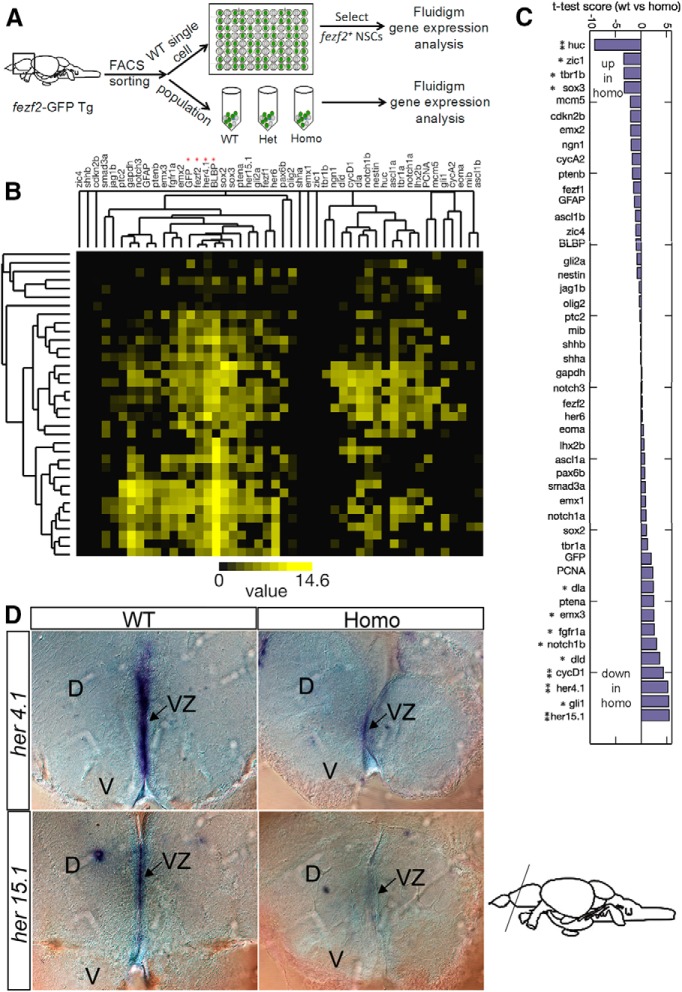
How does the impairment of fezf2 lead to increased NSC proliferation in a mutant environment but causes NSCs to differentiate in a WT environment (with an added twist of heterozygous cells becoming hyperproliferative in the WT environment)? To address the mechanisms, we performed single and population NSC gene expression analysis using nanofluidic real-time PCR on Fluidigm dynamic arrays (Fig. 7A). Forty-eight genes were selected, including those of major signaling pathways (e.g., FGF, Notch, Shh, and TGF-β), cell cycle regulators, and transcription factors. The adult DTel PVZ from Tg[fezf2-GFP] animals were dissected, and acutely dissociated. The fezf2-GFP+ cells were FACS sorted into individual wells of 96-well plates. After semiquantitative RT-PCR on individual cells (n = 192), a subset (n = 55) that expressed detectable levels of fezf2 was selected for Fluidigm qPCR analysis.
Figure 7.
Single and population NSC analyses identify Notch signaling as a target of fezf2. A, A schematic diagram illustrating the procedure of single and population NSC profiling. B, Hierarchical clustering reveals the genes whose expression is correlated in individual NSCs. C, Population NSC profiling shows genes that are upregulated or downregulated in the mutant. D, In situ hybridization reveals the reduction of her4.1 and her 15.1 in the adult DTel PVZ of the mutant compared with WT siblings.
The data showed that gene expression is heterogeneous at the individual NSC level. This is not unexpected, given the documented heterogeneity in stem cell and progenitor properties (Merkle et al., 2007; Bonaguidi et al., 2011; Simons and Clevers, 2011) and the reported stochastic nature of transcriptional bursts in single cells (Raj and van Oudenaarden, 2008). Intriguingly, despite the seemingly heterogeneous nature of individual gene expression, hierarchical clustering uncovered remarkably correlated expression among different genes (Fig. 7B). First, fezf2 and gfp transcript levels showed strong correlation, thereby validating the fezf2-GFP transgene expression. Second, in agreement with the colocalization pattern detected by immunofluorescence (Berberoglu et al., 2009), the expression of fezf2 and the RGL marker blbp displayed strong correlation. Third, we detected a strong new correlation between the expression of fezf2 and her4.1 (Fig. 7B), a member of the hes family serving as a downstream target of Notch signaling (Takke and Dornseifer, 1999). Finally, it is of interest to note that the clustering generally segregated markers that are more prominent in quiescent RGLs (e.g., notch3, GFAP, fezf2, BLBP, sox2, sox3) from those that are mainly in proliferative RGLs (e.g., dla, notch1b, nestin) (März et al., 2010).
Correlated gene expression might suggest control by common upstream factors or regulation of one another. To identify genes that are regulated by fezf2, we performed gene expression analysis using FACS purified adult DTel fezf2-GFP+ NSCs from homozygous mutant and control siblings. Remarkably, among the nine genes that were significantly downregulated in the mutant (Fig. 7C), five (her4.1, her15.1, dla, dld, and notch1b) were Notch pathway genes. Other Notch pathway genes, including notch3, jag1b, and her6, were unaffected. We were particularly interested in her4.1 because it showed strongest expression correlation with fezf2 in the single NSC analysis. In situ hybridization validated the reduction of her4.1 in the adult DTel PVZ of the mutant (Fig. 7D). her15.1 was also validated in situ (Fig. 7D), suggesting high reliability of our profiling data. Other genes that were significantly downregulated in the mutant include emx3, fgfr1a, cycD1, and gli1, whereas genes that were significantly upregulated in the mutant included huc, zic1, tbr1b, and sox3 (Fig. 7C). The pathway relevance of these genes remains to be fully understood. Together, single and population NSC analyses identify the Notch signaling pathway as a target of fezf2.
Analysis of endogenous NICD levels reveals a gradient Notch activity between neighboring NSCs that is dependent on fezf2
Whereas Notch signaling promotes NSC self-renewal in the developing brain (Gaiano and Fishell, 2002; Mizutani et al., 2007; Dong et al., 2012), paradoxically, Notch activation in the adult brain promotes NSC quiescence (Carlén et al., 2009; Chapouton et al., 2010; Imayoshi et al., 2010). Interestingly, a recent study shows that, in the adult zebrafish brain, impairment of notch3 activity primarily induces NSC proliferation, whereas abrogation of notch1b function results in the generation of neurons at the expense of NSCs (Alunni et al., 2013). However, it remains unclear whether different Notch receptors mediate distinct cellular responses through qualitative or quantitative differences in signaling. Using transgenic reporters for Notch signaling, it has been shown that, in larval zebrafish pancreatic progenitors, different levels of Notch signaling regulate distinct cellular outcomes (Ninov et al., 2012).
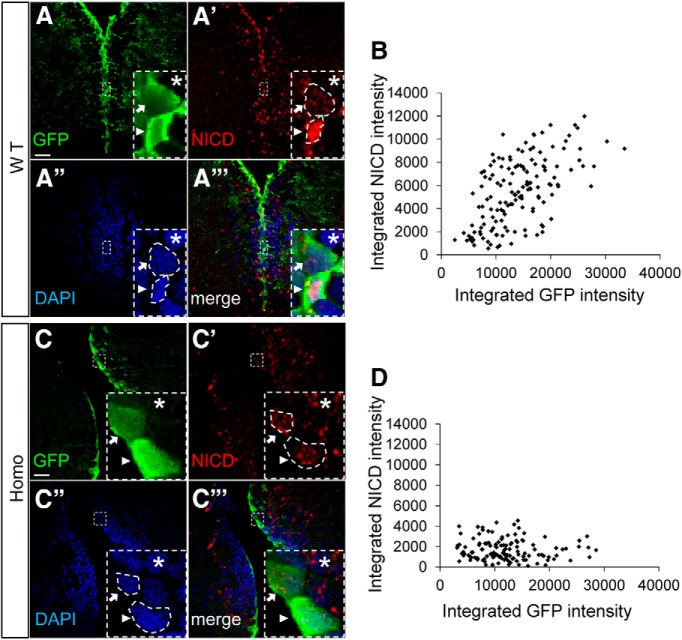
We sought to determine whether different levels of Notch signaling are detectable in the DTel NSCs. Rather than using transgenic reporters, which is less direct for assessing Notch activity due to possible contribution of other signaling pathways to reporter regulation, we chose to monitor endogenous Notch activation. It has been well established that the activation of Notch receptor by ligand binding triggers a series of proteolytic events that lead to the accumulation of the NICD in the nucleus (Selkoe and Kopan, 2003). To detect NICD, we used an antibody that has been previously validated in zebrafish (Yang et al., 2009). Our data showed that NICD immunoreactivity was higher and concentrated in the nuclei of fezf2-GFPhi NSCs but appeared low and diffuse in the nuclei of the fezf2-GFPlo NSCs. Intriguingly, the nuclei of fezf2-GFPhi NSCs appeared more condensed, consistent with being in a quiescent state (Fig. 8A–A‴). At the population level, we measured the integrated optical intensities of GFP and NICD immunoreactivity in 146 cells and observed a highly significant positive correlation between fezf2-GFP and NICD levels (Fig. 8B; Spearman correlation test, r = 0.574, p < 0.001). These results reveal a gradient Notch activity that is high in quiescent and low in proliferative NSCs.
Figure 8.
Notch activity is high in quiescent and low in proliferative NSCs. A–A‴, Representative images show NICD expression level in Fezf2hi and Fezf2lo NSCs in WT. Scale bar, 50 μm. B, Scatter plot shows that GFP and NICD expressions are positively correlated in WT. In total, 146 cells were analyzed in WT (n = 146). Spearman correlation test, r = 0.574, p < 0.001. C–C‴, Representative images show NICD expression level in Fezf2hi and Fezf2lo NSCs in fezf2m808/m808 mutant. Scale bar, 50 μm. D, Scatter plot shows that GFP and NICD expressions are not correlated in fezf2m808/m808 mutant. In total, 128 cells were analyzed in fezf2m808/m808 mutant (n = 128). Spearman correlation test, r = −0.0733, p = 0.411.
We next asked how the disruption of fezf2 activity might affect such gradient Notch activity. In the fezf2−/− mutant, fezf2-GFPhi and fezf2-GFPlo NSCs remained detectable, suggesting that fezf2 activity is not required for patterning its own expression heterogeneity. However, the difference in NICD levels between neighbors was abolished, resulting in overall low levels (Fig. 8C–C‴). At the population level, NICD displayed no correlation with that of fezf2-GFP (Fig. 8D, n = 128 cells, Spearman correlation test, r = −0.0733, p = 0.411). Together, our single-cell and population NSC analyses suggest that fezf2 functions to establish a gradient Notch activity among neighboring NSCs.
Differential fezf2 expression level is detected in quiescent and proliferative NSCs of the mammalian hippocampal dentate gyrus
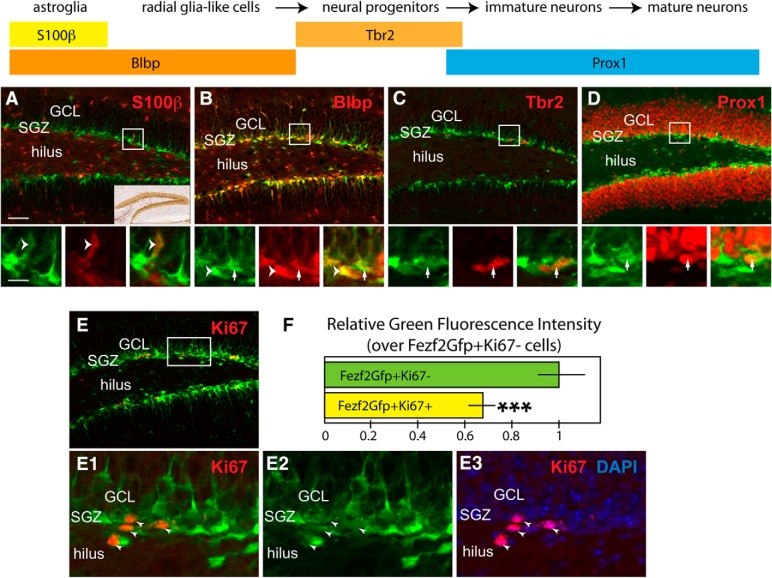
Intrigued by the differential fezf2 expression level in the quiescent versus proliferative NSCs, we asked whether fezf2 heterogeneity might be observable in mammalian NSCs. We searched the Allen Brain Atlas for the expression of fezf2 mRNA (http://developingmouse.brain-map.org/experiment/show/100022558) in the mouse brain at postnatal day 28 (P28). In addition to the well-documented expression in the layer 5 of the cortex, intriguingly, fezf2 mRNA shown in the database is also expressed in the mouse SGZ (Fig. 9A, inset), the neurogenic niche in the hippocampus where neurogenesis persists in adulthood (Mu et al., 2010). To further characterize these fezf2-expressing cells, we analyzed the BAC transgenic line Tg[fezf2-GFP] (from GENSAT) in which GFP expression was driven by the fezf2 regulatory sequences. At P21, the GFP expression showed a similar pattern as fezf2 mRNA in the SGZ. Whereas <1% GFP+ cells in the SGZ were colabeled by the mature astrocyte marker S100β (Fig. 9A, bottom, arrowheads), >95% overlapped with the RGL cell marker Blbp for both radially and horizontally oriented cells (Type 1 and Type 2 NSCs) (Fig. 9B, bottom, arrows and arrowheads). Few Tbr2+ intermediate progenitors (or transit amplifying cells) (Fig. 9C, bottom, arrows) and Prox1+ immature granule cells close to SGZ (Fig. 9D, bottom, arrows) showed GFP expression. Therefore, in this Tg[fezf2-GFP] line, the GFP+ cells in the SGZ are mostly NSCs. To explore the relationship between the expression level of GFP and the activation of NSCs from quiescence, we examined the colocalization of proliferation marker Ki67 with GFP. We found that, among the GFP+ cells in the SGZ, the Ki67+ cells (Fig. 9E–E‴, bottom, arrowheads) had lower levels of GFP (67.8 ± 4.5%) than the Ki67− cells (Fig. 9H). These results suggest that, consistent with the observation in fish, fezf2 levels display heterogeneity and the downregulation of fezf2 expression tends to associate with the activation of NSCs.
Figure 9.
Differential fezf2 expression level in quiescent and proliferative NSCs of the mammalian hippocampal dentate gyrus. A–D, At postnatal day 21 (P21), the fezf2-GFP-expressing cells in the SGZ of the dentate gyrus were characterized with markers S100β and Blbp for the astrocytes (A), Blbp for NSCs (B), Tbr2 for neural transit amplifying cells (or neural progenitors) (C), or Prox1 for granule cells (D). The boxed area for individual top was shown at higher magnification for different channels in the corresponding bottom. Fezf2 mRNA expression was clearly seen in the SGZ (A, inset, from Allen Brain Atlas database). Only rarely GFP-positive cells in the SGZ were labeled by S100β (A, bottom, arrowheads), but most of them, including horizontal (B, arrowheads in bottom) and radial (B, bottom, arrows) oriented neural stem cells were labeled by Blbp (B). Few Tbr2-positive cells showed a low level of GFP expression (C, bottom, arrows). Similarly, low level of GFP expression could only be occasionally found in the Prox1-positive granule cells located near the SGZ (D, bottom, arrows), which most likely were immature granule cells. E, F, The correlation between GFP expression level and cell proliferation. E, Boxed area was shown at higher magnification in E1–E3 for different channel combinations. E, In general, there was much lower GFP expression level for the Ki67+ proliferative cells than Ki67− cells (E1–E3, arrowheads). F, The relative GFP fluorescent intensity for GFP+Ki67+ cells was 67.8 ± 4.5% of the GFP+Ki67− cells (total brains analyzed n = 4). ***p < 0.001 (Student's t test). Scale bars: A–D (top), E, 100 μm; A–D (bottom), E1–E3, 30 μm. F, Values represent mean ± SEM. GCL, Granule cell layer.
Discussion
In this study, using a combination of genetic, in vivo chimera, and single as well as population NSC analyses, we have discovered a cell-autonomous requirement of fezf2 in maintaining adult zebrafish DTel NSC quiescence and a cell-nonautonomous role of fezf2 in NSC activation. We have further unveiled the expression heterogeneity of fezf2 in the NSC population and shown that it is essential to drive her4.1 expression in a highly correlated manner. Based on these findings, we propose that fezf2 plays a critical role in biasing the directionality of Notch signaling and hence determining the outcome of cell fates (Fig. 10).
Figure 10.
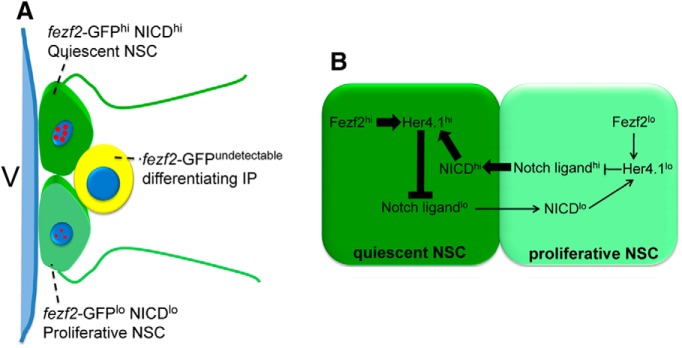
A schematic model summarizes the role of fezf2 in regulating Notch activity and NSC fate. A, In the DTel PVZ, heterogeneous cellular states are marked by a heterogeneous level of fezf2 expression, which further orchestrates a gradient Notch signaling activity among neighbors. B, At the molecular level, heterogeneous fezf2 levels control the levels of her4.1 in NSCs. This difference biases the directionality of Notch signaling and determines the fate outcomes.
The role of fezf2 in maintaining NSC quiescence
Multiple lines of evidence indicate that fezf2 plays a critical role in maintaining adult NSC quiescence. First, in the adult tof/fezf2 mutant DTel, there is an increase of proliferative NSCs at the expense of quiescent ones. Second, adult-specific knockdown of fezf2 using vivo morpholino antisense oligonucleotides increases NSC proliferation and decreases quiescent NSCs. Third, ex vivo clonal analysis reveals an increased proliferation of mutant NSCs. Such hyperproliferative phenotype in isolation suggests that fezf2 is cell-autonomously required to maintain NSC quiescence.
What is the mechanism by which fezf2 maintains adult NSC quiescence? Single and population NSC analyses suggest that fezf2 maintains quiescence through promoting high Notch signaling activity. First, the expression of fezf2 shows significant positive correlation with that of her4.1 in individual NSCs. Second, fezf2 is required to maintain her4.1 expression. Third, fezf2 is required to promote high NICD levels. It would be interesting to determine in the future whether direct activation of her4.1 by fezf2 is the underlying biochemical mechanism. Also, it is worth noting that other signaling pathway genes, such as gli1, are regulated by fezf2. The importance and mechanism of such regulation await future investigation.
The role of fezf2 in NSC activation
In addition to maintaining quiescence, our data also reveal an unexpected role of fezf2 in NSC activation. In vivo genetic chimera show that fezf2 mutant NSCs undergo precocious differentiation in WT but hyperproliferation in the mutant brain environment. Such observation suggests that NSC-environment interaction influences cell fate in a fezf2 dosage-dependent manner. Given the finding of fezf2-dependent Notch signaling activity, one prominent difference between the WT and the mutant brain environment would be the level of Notch signaling activity. Because a blockade of Notch signaling has been shown to liberate NSCs from quiescence (Chapouton et al., 2010; Alunni et al., 2013), an overall reduction of Notch activity in the fezf2 mutant DTel PVZ would conceivably cause an increased propensity of NSCs to exit quiescence and undergo proliferation. In contrast, the fezf2 mutant NSCs, when put in a WT brain environment, would have lower Notch activity than their neighboring WT cells. Such initial difference would bias the directionality of Notch signaling, further reducing Notch activity in mutant NSCs and propelling them toward differentiation. The observation that fezf2 heterozygous NSCs become hyperproliferative in the WT brain environment is intriguing and further suggests the importance of graded fezf2 level in NSC fate outcomes. In this case, fezf2 heterozygous NSCs would have lower Notch activity than WT but higher than mutant cells. Such quantitative difference might cause them to overproliferate rather than differentiate in the WT brain environment. Together, these findings suggest that fezf2 regulates NSC activation cell-nonautonomously, using differences in its own expression level to bias the directionality of Notch signaling among neighboring cells.
Establishing gradient Notch activity in NSC fate balance
Graded Notch signaling activity has been previously reported in the developing zebrafish retina (Del Bene et al., 2008) and pancreas (Ninov et al., 2012). Interestingly, a recent report in adult NSCs shows the involvement of distinct Notch receptors in regulating quiescence versus differentiation, suggesting that either qualitative or quantitative differences in the signaling efficiencies can encode different cellular responses (Alunni et al., 2013). Our observed difference of her4.1 levels in individual NSCs and difference of NICD levels in quiescent versus proliferative NSCs favor the latter possibility. Interestingly, in the mammary epithelial cell system, overexpression of NICD either leads to hyperproliferation or cell cycle arrest, depending on the levels of NICD overexpression: high levels trigger cell cycle arrest and induce the expression of p21, a cell cycle inhibitor, whereas low levels interact with JAK/STAT3 and EGF, thereby exerting a mitogenic response (Mazzone et al., 2010). Whether differences in Notch signaling activity drive different fate outcomes in the adult NSCs as in mammary epithelial cells remains to be established.
How might the graded level of fezf2 establish gradient Notch signaling activity among neighbors? Based on the observed tight correlation between fezf2 and her4.1 expression in single-cell analysis, we hypothesize that fezf2 controls the transcription of her4.1 in a concentration-dependent manner. Higher level of her4.1 in a given cell would then decrease the Notch ligand expression, in turn activating less Notch in neighboring cells. In this scenario, the increased NICD level in fezf2-GFPhi NSCs would be secondary to the increase of her4.1. Additionally, our population NSC profiling data also reveal a fezf2-dependent notch1b (but not notch 3) expression, suggesting differences in regulatory mechanisms of these Notch receptors.
Establishing the heterogeneity of fezf2 expression level
How is the heterogeneity of fezf2 expression established? One possibility is that it is due to stochastic fluctuation. Another possibility is that the expression of fezf2 is decreased following cell division in one or both daughter cells. Given that the transgenic reporters recapitulate well fezf2 expression, future interrogation of the function of flanking genomic sequences will reveal new insights into this question.
A conserved role of fezf2 in regulating NSC fate balance?
Our observation that fezf2 is expressed in the mouse hippocampal NSCs in a similar manner to that in the zebrafish DTel suggests possible functional conservation. A constitutive knock-out of fezf2 has been generated in mice, but its impact on adult neurogenesis has not been examined (Hirata et al., 2004). Given the reported role of Fezf2 in the developing mammalian cortex and hippocampus (Shimizu and Hibi, 2009; Eckler and Chen, 2014), conditional knock-outs are likely required to address the adult-specific function of Fezf2 in mammalian forebrain homeostasis.
Our discovery that fezf2 is expressed differentially in quiescent (Fezf2hi) and active (Fezf2lo) RGL NSCs in both zebrafish and mice is one of the most intriguing findings of this study. Given the recent report of fezf2-expressing multipotent RGLs in the cerebral cortex (Guo et al., 2013), it would be of great interest to determine whether graded expression of Fezf2 is also detectable in the cortical progenitors, and what might be its functional significance in both cortical and hippocampal neurogenesis.
We show that the heterogeneous level of Fezf2 is critical for patterning directional Notch signaling among neighboring cells, thereby regulating differential cell fate: Fezf2hiNICDhi NSCs remain quiescent, whereas Fezf2loNICDlo NSCs are proliferative. A previous study in the developing mouse Tel suggests that fezf2 directly represses (rather than activates) hes5 (orthologous to her4.1) (Shimizu et al., 2010). This is different from the requirement of fezf2 to promote her4.1 expression in the adult zebrafish DTel as shown in this study. Indeed, sequence and functional studies of fezf2 suggest that it can act as both transcription activator and repressor in a context-dependent manner (Shimizu and Hibi, 2009; Chen et al., 2011). It will be interesting to determine whether the context is due to the difference in age (embryonic vs adult), species (zebrafish vs mice), or gene dosage.
Footnotes
This work was supported by National Institutes of Health Grants NS042626 and DA035680 to S.G. and Grant R01 MH077694 to S.J.P., including a Ruth L. Kirschstein NRSA Predoctoral Fellowship to M.A.B. We thank Arturo Alvarez-Buylla and John Ngai for scientific discussions and exchange of ideas; Bill Hyun and Jane Gordon for assistance with FACS; Bingwei Lu and members of the S.G. laboratory for discussions and helpful comments on the manuscript; and Michael Klymkowsky who provided us with the anti-Sox3 antibody as a kind gift.
The authors declare no competing financial interests.
References
- Adolf B, Chapouton P, Lam CS, Topp S, Tannhäuser B, Strähle U, Götz M, Bally-Cuif L. Conserved and acquired features of adult neurogenesis in the zebrafish telencephalon. Dev Biol. 2006;295:278–293. doi: 10.1016/j.ydbio.2006.03.023. [DOI] [PubMed] [Google Scholar]
- Alunni A, Krecsmarik M, Bosco A, Galant S, Pan L, Moens CB, Bally-Cuif L. Notch3 signaling gates cell cycle entry and limits neural stem cell amplification in the adult pallium. Development. 2013;140:3335–3347. doi: 10.1242/dev.095018. [DOI] [PMC free article] [PubMed] [Google Scholar]
- Bae YK, Kani S, Shimizu T, Tanabe K, Nojima H, Kimura Y, Higashijima S, Hibi M. Anatomy of zebrafish cerebellum and screen for mutations affecting its development. Dev Biol. 2009;330:406–426. doi: 10.1016/j.ydbio.2009.04.013. [DOI] [PubMed] [Google Scholar]
- Baumgart EV, Barbosa JS, Bally-Cuif L, Götz M, Ninkovic J. Stab wound injury of the zebrafish telencephalon: a model for comparative analysis of reactive gliosis. Glia. 2012;60:343–357. doi: 10.1002/glia.22269. [DOI] [PubMed] [Google Scholar]
- Berberoglu MA, Dong Z, Mueller T, Guo S. fezf2 expression delineates cells with proliferative potential and expressing markers of neural stem cells in the adult zebrafish brain. Gene Expr Patterns. 2009;9:411–422. doi: 10.1016/j.gep.2009.06.002. [DOI] [PMC free article] [PubMed] [Google Scholar]
- Blanpain C, Fuchs E. Epidermal homeostasis: a balancing act of stem cells in the skin. Nat Rev Mol Cell Biol. 2009;10:207–217. doi: 10.1038/nrm2636. [DOI] [PMC free article] [PubMed] [Google Scholar]
- Bonaguidi MA, Wheeler MA, Shapiro JS, Stadel RP, Sun GJ, Ming GL, Song H. In vivo clonal analysis reveals self-renewing and multipotent adult neural stem cell characteristics. Cell. 2011;145:1142–1155. doi: 10.1016/j.cell.2011.05.024. [DOI] [PMC free article] [PubMed] [Google Scholar]
- Carlén M, Meletis K, Göritz C, Darsalia V, Evergren E, Tanigaki K, Amendola M, Barnabé-Heider F, Yeung MS, Naldini L, Honjo T, Kokaia Z, Shupliakov O, Cassidy RM, Lindvall O, Frisén J. Forebrain ependymal cells are Notch-dependent and generate neuroblasts and astrocytes after stroke. Nat Neurosci. 2009;12:259–267. doi: 10.1038/nn.2268. [DOI] [PubMed] [Google Scholar]
- Chapouton P, Adolf B, Leucht C, Tannhäuser B, Ryu S, Driever W, Bally-Cuif L. her5 expression reveals a pool of neural stem cells in the adult zebrafish midbrain. Development. 2006;133:4293–4303. doi: 10.1242/dev.02573. [DOI] [PubMed] [Google Scholar]
- Chapouton P, Skupien P, Hesl B, Coolen M, Moore JC, Madelaine R, Kremmer E, Faus-Kessler T, Blader P, Lawson ND, Bally-Cuif L. Notch activity levels control the balance between quiescence and recruitment of adult neural stem cells. J Neurosci. 2010;30:7961–7974. doi: 10.1523/JNEUROSCI.6170-09.2010. [DOI] [PMC free article] [PubMed] [Google Scholar]
- Chen B, Schaevitz LR, McConnell SK. Fezl regulates the differentiation and axon targeting of layer 5 subcortical projection neurons in cerebral cortex. Proc Natl Acad Sci U S A. 2005a;102:17184–17189. doi: 10.1073/pnas.0508732102. [DOI] [PMC free article] [PubMed] [Google Scholar]
- Chen JG, Rasin MR, Kwan KY, Sestan N. Zfp312 is required for subcortical axonal projections and dendritic morphology of deep-layer pyramidal neurons of the cerebral cortex. Proc Natl Acad Sci U S A. 2005b;102:17792–17797. doi: 10.1073/pnas.0509032102. [DOI] [PMC free article] [PubMed] [Google Scholar]
- Chen L, Zheng J, Yang N, Li H, Guo S. Genomic selection identifies vertebrate transcription factor Fezf2 binding sites and target genes. J Biol Chem. 2011;286:18641–18649. doi: 10.1074/jbc.M111.236471. [DOI] [PMC free article] [PubMed] [Google Scholar]
- Collins SR, Schuldiner M, Krogan NJ, Weissman JS. A strategy for extracting and analyzing large-scale quantitative epistatic interaction data. Genome Biol. 2006;7:R63. doi: 10.1186/gb-2006-7-7-r63. [DOI] [PMC free article] [PubMed] [Google Scholar]
- Del Bene F, Wehman AM, Link BA, Baier H. Regulation of neurogenesis by interkinetic nuclear migration through an apical-basal notch gradient. Cell. 2008;134:1055–1065. doi: 10.1016/j.cell.2008.07.017. [DOI] [PMC free article] [PubMed] [Google Scholar]
- Dong Z, Yang N, Yeo SY, Chitnis A, Guo S. Intra-lineage directional Notch signaling regulates self-renewal and differentiation of asymmetrically dividing radial glia. Neuron. 2012;74:65–78. doi: 10.1016/j.neuron.2012.01.031. [DOI] [PMC free article] [PubMed] [Google Scholar]
- Eckler MJ, Chen B. Fez family transcription factors: controlling neurogenesis and cell fate in the developing mammalian nervous system. Bioessays. 2014;36:788–797. doi: 10.1002/bies.201400039. [DOI] [PMC free article] [PubMed] [Google Scholar]
- Eisen MB, Spellman PT, Brown PO, Botstein D. Cluster analysis and display of genome-wide expression patterns. Proc Natl Acad Sci U S A. 1998;95:14863–14868. doi: 10.1073/pnas.95.25.14863. [DOI] [PMC free article] [PubMed] [Google Scholar]
- Fuchs E. The tortoise and the hair: slow-cycling cells in the stem cell race. Cell. 2009;137:811–819. doi: 10.1016/j.cell.2009.05.002. [DOI] [PMC free article] [PubMed] [Google Scholar]
- Gage FH. Mammalian neural stem cells. Science. 2000;287:1433–1438. doi: 10.1126/science.287.5457.1433. [DOI] [PubMed] [Google Scholar]
- Gaiano N, Fishell G. The role of notch in promoting glial and neural stem cell fates. Annu Rev Neurosci. 2002;25:471–490. doi: 10.1146/annurev.neuro.25.030702.130823. [DOI] [PubMed] [Google Scholar]
- Grandel H, Kaslin J, Ganz J, Wenzel I, Brand M. Neural stem cells and neurogenesis in the adult zebrafish brain: origin, proliferation dynamics, migration and cell fate. Dev Biol. 2006;295:263–277. doi: 10.1016/j.ydbio.2006.03.040. [DOI] [PubMed] [Google Scholar]
- Guo C, Eckler MJ, McKenna WL, McKinsey GL, Rubenstein JL, Chen B. Fezf2 expression identifies a multipotent progenitor for neocortical projection neurons, astrocytes, and oligodendrocytes. Neuron. 2013;80:167–174. doi: 10.1016/j.neuron.2013.09.037. [DOI] [PMC free article] [PubMed] [Google Scholar]
- Guo S, Wilson SW, Cooke S, Chitnis AB, Driever W, Rosenthal A. Mutations in the zebrafish unmask shared regulatory pathways controlling the development of catecholaminergic neurons. Dev Biol. 1999;208:473–487. doi: 10.1006/dbio.1999.9204. [DOI] [PubMed] [Google Scholar]
- Hirata T, Suda Y, Nakao K, Narimatsu M, Hirano T, Hibi M. Zinc finger gene fez-like functions in the formation of subplate neurons and thalamocortical axons. Dev Dyn. 2004;230:546–556. doi: 10.1002/dvdy.20068. [DOI] [PubMed] [Google Scholar]
- Hirata T, Nakazawa M, Muraoka O, Nakayama R, Suda Y, Hibi M. Zinc-finger genes Fez and Fez-like function in the establishment of diencephalon subdivisions. Development. 2006;133:3993–4004. doi: 10.1242/dev.02585. [DOI] [PubMed] [Google Scholar]
- Imayoshi I, Sakamoto M, Yamaguchi M, Mori K, Kageyama R. Essential roles of Notch signaling in maintenance of neural stem cells in developing and adult brains. J Neurosci. 2010;30:3489–3498. doi: 10.1523/JNEUROSCI.4987-09.2010. [DOI] [PMC free article] [PubMed] [Google Scholar]
- Jeong JY, Einhorn Z, Mercurio S, Lee S, Lau B, Mione M, Wilson SW, Guo S. Neurogenin1 is a determinant of zebrafish basal forebrain dopaminergic neurons and is regulated by the conserved zinc finger protein Tof/Fezl. Proc Natl Acad Sci U S A. 2006;103:5143–5148. doi: 10.1073/pnas.0600337103. [DOI] [PMC free article] [PubMed] [Google Scholar]
- Jeong JY, Einhorn Z, Mathur P, Chen L, Lee S, Kawakami K, Guo S. Patterning the zebrafish diencephalon by the conserved zinc finger protein Fezl. Development. 2007;134:127–136. doi: 10.1242/dev.02705. [DOI] [PubMed] [Google Scholar]
- Kizil C, Kyritsis N, Dudczig S, Kroehne V, Freudenreich D, Kaslin J, Brand M. Regenerative neurogenesis from neural progenitor cells requires injury-induced expression of Gata3. Dev Cell. 2012;23:1230–1237. doi: 10.1016/j.devcel.2012.10.014. [DOI] [PubMed] [Google Scholar]
- Kizil C, Iltzsche A, Kaslin J, Brand M. Micromanipulation of gene expression in the adult zebrafish brain using cerebroventricular microinjection of morpholino oligonucleotides. J Vis Exp. 2013;75:e50415. doi: 10.3791/50415. [DOI] [PMC free article] [PubMed] [Google Scholar]
- Kroehne V, Freudenreich D, Hans S, Kaslin J, Brand M. Regeneration of the adult zebrafish brain from neurogenic radial glia-type progenitors. Development. 2011;138:4831–4841. doi: 10.1242/dev.072587. [DOI] [PubMed] [Google Scholar]
- Levkowitz G, Zeller J, Sirotkin HI, French D, Schilbach S, Hashimoto H, Hibi M, Talbot WS, Rosenthal A. Zinc finger protein too few controls the development of monoaminergic neurons. Nat Neurosci. 2003;6:28–33. doi: 10.1038/nn979. [DOI] [PubMed] [Google Scholar]
- Li G, Fang L, Fernández G, Pleasure SJ. The ventral hippocampus is the embryonic origin for adult neural stem cells in the dentate gyrus. Neuron. 2013;78:658–672. doi: 10.1016/j.neuron.2013.03.019. [DOI] [PMC free article] [PubMed] [Google Scholar]
- Li L, Clevers H. Coexistence of quiescent and active adult stem cells in mammals. Science. 2010;327:542–545. doi: 10.1126/science.1180794. [DOI] [PMC free article] [PubMed] [Google Scholar]
- Lindsey BW, Darabie A, Tropepe V. The cellular composition of neurogenic periventricular zones in the adult zebrafish forebrain. J Comp Neurol. 2012;520:2275–2316. doi: 10.1002/cne.23065. [DOI] [PubMed] [Google Scholar]
- März M, Chapouton P, Diotel N, Vaillant C, Hesl B, Takamiya M, Lam CS, Kah O, Bally-Cuif L, Strähle U. Heterogeneity in progenitor cell subtypes in the ventricular zone of the zebrafish adult telencephalon. Glia. 2010;58:870–888. doi: 10.1002/glia.20971. [DOI] [PubMed] [Google Scholar]
- Mazzone M, Selfors LM, Albeck J, Overholtzer M, Sale S, Carroll DL, Pandya D, Lu Y, Mills GB, Aster JC, Artavanis-Tsakonas S, Brugge JS. Dose-dependent induction of distinct phenotypic responses to Notch pathway activation in mammary epithelial cells. Proc Natl Acad Sci U S A. 2010;107:5012–5017. doi: 10.1073/pnas.1000896107. [DOI] [PMC free article] [PubMed] [Google Scholar]
- Merkle FT, Mirzadeh Z, Alvarez-Buylla A. Mosaic organization of neural stem cells in the adult brain. Science. 2007;317:381–384. doi: 10.1126/science.1144914. [DOI] [PubMed] [Google Scholar]
- Miller FD, Gauthier-Fisher A. Home at last: neural stem cell niches defined. Cell Stem Cell. 2009;4:507–510. doi: 10.1016/j.stem.2009.05.008. [DOI] [PubMed] [Google Scholar]
- Ming GL, Song H. Adult neurogenesis in the mammalian brain: significant answers and significant questions. Neuron. 2011;70:687–702. doi: 10.1016/j.neuron.2011.05.001. [DOI] [PMC free article] [PubMed] [Google Scholar]
- Mizutani K, Yoon K, Dang L, Tokunaga A, Gaiano N. Differential Notch signalling distinguishes neural stem cells from intermediate progenitors. Nature. 2007;449:351–355. doi: 10.1038/nature06090. [DOI] [PubMed] [Google Scholar]
- Molyneaux BJ, Arlotta P, Hirata T, Hibi M, Macklis JD. Fezl is required for the birth and specification of corticospinal motor neurons. Neuron. 2005;47:817–831. doi: 10.1016/j.neuron.2005.08.030. [DOI] [PubMed] [Google Scholar]
- Morrison SJ, Kimble J. Asymmetric and symmetric stem-cell divisions in development and cancer. Nature. 2006;441:1068–1074. doi: 10.1038/nature04956. [DOI] [PubMed] [Google Scholar]
- Morrison SJ, Spradling AC. Stem cells and niches: mechanisms that promote stem cell maintenance throughout life. Cell. 2008;132:598–611. doi: 10.1016/j.cell.2008.01.038. [DOI] [PMC free article] [PubMed] [Google Scholar]
- Mu Y, Lee SW, Gage FH. Signaling in adult neurogenesis. Curr Opin Neurobiol. 2010;20:416–423. doi: 10.1016/j.conb.2010.04.010. [DOI] [PMC free article] [PubMed] [Google Scholar]
- Ninov N, Borius M, Stainier DY. Different levels of Notch signaling regulate quiescence, renewal and differentiation in pancreatic endocrine progenitors. Development. 2012;139:1557–1567. doi: 10.1242/dev.076000. [DOI] [PMC free article] [PubMed] [Google Scholar]
- Raj A, van Oudenaarden A. Nature, nurture, or chance: stochastic gene expression and its consequences. Cell. 2008;135:216–226. doi: 10.1016/j.cell.2008.09.050. [DOI] [PMC free article] [PubMed] [Google Scholar]
- Rothenaigner I, Krecsmarik M, Hayes JA, Bahn B, Lepier A, Fortin G, Götz M, Jagasia R, Bally-Cuif L. Clonal analysis by distinct viral vectors identifies bona fide neural stem cells in the adult zebrafish telencephalon and characterizes their division properties and fate. Development. 2011;138:459–469. doi: 10.1242/dev.058156. [DOI] [PubMed] [Google Scholar]
- Rouaux C, Arlotta P. Fezf2 directs the differentiation of corticofugal neurons from striatal progenitors in vivo. Nat Neurosci. 2010;13:1345–1347. doi: 10.1038/nn.2658. [DOI] [PMC free article] [PubMed] [Google Scholar]
- Selkoe D, Kopan R. Notch and Presenilin: regulated intramembrane proteolysis links development and degeneration. Annu Rev Neurosci. 2003;26:5697. doi: 10.1146/annurev.neuro.26.041002.131334. [DOI] [PubMed] [Google Scholar]
- Shimizu T, Hibi M. Formation and patterning of the forebrain and olfactory system by zinc-finger genes Fezf1 and Fezf2. Dev Growth Differ. 2009;51:221–231. doi: 10.1111/j.1440-169X.2009.01088.x. [DOI] [PubMed] [Google Scholar]
- Shimizu T, Nakazawa M, Kani S, Bae YK, Kageyama R, Hibi M. Zinc finger genes Fezf1 and Fezf2 control neuronal differentiation by repressing Hes5 expression in the forebrain. Development. 2010;137:1875–1885. doi: 10.1242/dev.047167. [DOI] [PubMed] [Google Scholar]
- Simons BD, Clevers H. Strategies for homeostatic stem cell self-renewal in adult tissues. Cell. 2011;145:851–862. doi: 10.1016/j.cell.2011.05.033. [DOI] [PubMed] [Google Scholar]
- Spurgeon SL, Jones RC, Ramakrishnan R. High throughput gene expression measurement with real time PCR in a microfluidic dynamic array. PLoS One. 2008;3:e1662. doi: 10.1371/journal.pone.0001662. [DOI] [PMC free article] [PubMed] [Google Scholar]
- Sugiarto S, Persson A, Munoz EG, Waldhuber M, Lamagna C, Andor N, Hanecker P, Ayers-Ringler J, Phillips J, Siu J, Lim DA, Vandenberg S, Stallcup W, Berger MS, Bergers G, Weiss WA, Petritsch C. Asymmetry-defective oligodendrocyte progenitors are glioma precursors. Cancer Cell. 2011;20:328–340. doi: 10.1016/j.ccr.2011.08.011. [DOI] [PMC free article] [PubMed] [Google Scholar]
- Takke C, Dornseifer P, v Weizsäcker E, Campos-Ortega JA. her4, a zebrafish homologue of the Drosophila neurogenic gene E (spl), is a target of NOTCH signalling. Development. 1999;126:1811–1821. doi: 10.1242/dev.126.9.1811. [DOI] [PubMed] [Google Scholar]
- Temple S, Alvarez-Buylla A. Stem cells in the adult mammalian central nervous system. Curr Opin Neurobiol. 1999;9:135–141. doi: 10.1016/S0959-4388(99)80017-8. [DOI] [PubMed] [Google Scholar]
- Weissman IL, Anderson DJ, Gage F. Stem and progenitor cells: origins, phenotypes, lineage commitments, and transdifferentiations. Annu Rev Cell Dev Biol. 2001;17:387–403. doi: 10.1146/annurev.cellbio.17.1.387. [DOI] [PubMed] [Google Scholar]
- Wullimann MF, Puelles L. Postembryonic neural proliferation in the zebrafish forebrain and its relationship to prosomeric domains. Anat Embryol (Berl) 1999;199:329–348. doi: 10.1007/s004290050232. [DOI] [PubMed] [Google Scholar]
- Yang J, Chan CY, Jiang B, Yu X, Zhu GZ, Chen Y, Barnard J, Mei W. hnRNP I inhibits Notch signaling and regulates intestinal epithelial homeostasis in the zebrafish. PLoS Genet. 2009;5:e1000363. doi: 10.1371/journal.pgen.1000363. [DOI] [PMC free article] [PubMed] [Google Scholar]
- Yang N, Dong Z, Guo S. Fezf2 regulates multi-lineage neuronal differentiation through activating bHLH and HD genes in the zebrafish ventral forebrain. J Neurosci. 2012;32:10940–10948. doi: 10.1523/JNEUROSCI.2216-12.2012. [DOI] [PMC free article] [PubMed] [Google Scholar]
- Zhao C, Deng W, Gage FH. Mechanisms and functional implications of adult neurogenesis. Cell. 2008;132:645–660. doi: 10.1016/j.cell.2008.01.033. [DOI] [PubMed] [Google Scholar]
- Zupanc GK, Hinsch K, Gage FH. Proliferation, migration, neuronal differentiation, and long-term survival of new cells in the adult zebrafish brain. J Comp Neurol. 2005;488:290–319. doi: 10.1002/cne.20571. [DOI] [PubMed] [Google Scholar]


