

Background: Changes in Ca2+ handling in tumor cells might provide novel targets for cancer.
Results: Colon carcinoma cells show enhanced store-operated Ca2+ entry and currents and depleted Ca2+ stores associated with changes in STIM1/STIM2 ratio and TRPC1.
Conclusion: Ca2+ remodeling in colon cancer is driven by a reciprocal shift in TRPC1 and STIM2.
Significance: STIM1/STIM2 and TRPC1 should be investigated further as novel targets for colon cancer.
Keywords: Calcium, Calcium Imaging, Calcium Release-activated Calcium Channel Protein 1 (ORAI1), Cell Proliferation, Colon Cancer, Stromal Interaction Molecule 1 (STIM1)
Abstract
We have investigated the molecular basis of intracellular Ca2+ handling in human colon carcinoma cells (HT29) versus normal human mucosa cells (NCM460) and its contribution to cancer features. We found that Ca2+ stores in colon carcinoma cells are partially depleted relative to normal cells. However, resting Ca2+ levels, agonist-induced Ca2+ increases, store-operated Ca2+ entry (SOCE), and store-operated currents (ISOC) are largely enhanced in tumor cells. Enhanced SOCE and depleted Ca2+ stores correlate with increased cell proliferation, invasion, and survival characteristic of tumor cells. Normal mucosa cells displayed small, inward Ca2+ release-activated Ca2+ currents (ICRAC) mediated by ORAI1. In contrast, colon carcinoma cells showed mixed currents composed of enhanced ICRAC plus a nonselective ISOC mediated by TRPC1. Tumor cells display increased expression of TRPC1, ORAI1, ORAI2, ORAI3, and STIM1. In contrast, STIM2 protein was nearly depleted in tumor cells. Silencing data suggest that enhanced ORAI1 and TRPC1 contribute to enhanced SOCE and differential store-operated currents in tumor cells, whereas ORAI2 and -3 are seemingly less important. In addition, STIM2 knockdown decreases SOCE and Ca2+ store content in normal cells while promoting apoptosis resistance. These data suggest that loss of STIM2 may underlie Ca2+ store depletion and apoptosis resistance in tumor cells. We conclude that a reciprocal shift in TRPC1 and STIM2 contributes to Ca2+ remodeling and tumor features in colon cancer.
Introduction
Critical cancer hallmarks include enhanced cell proliferation, apoptosis resistance, and acquired ability to migrate and invade foreign tissues (1), cell functions that are regulated by intracellular Ca2+ signals. Increasing evidence suggests that tumor cells may undergo a deep remodeling of their Ca2+ homeostasis (2, 3), likely contributing to cancer features. However, mechanisms and contribution of Ca2+ deregulation are largely unknown (4), and no data are available in many types of cancer, including colon cancer. Store-operated Ca2+ entry (SOCE),4 a ubiquitous Ca2+ entry pathway involved in many physiological functions, particularly in nonexcitable cells, has been proposed to be remodeled in some cancers (5). This pathway is triggered by the release of Ca2+ from intracellular stores induced by phospholipase C activation after receptor stimulation. SOCE is believed to be mediated by the interaction of Stim1 (6), a Ca2+ sensor at the endoplasmic reticulum (ER), and Orai1, a pore-forming protein of store-operated channels (SOCs) at the plasma membrane that enables Ca2+ influx (7, 8). It is also widely accepted that STIM1/ORAI1 interactions are responsible for ICRAC activation underlying SOCE in some cell types (8). However, other store-operated currents (ISOC) less selective for Ca2+ might be mediated by canonical transient receptor potential (TRPC) channels, particularly TRPC1 and TRPC4 (2, 9).
Some of the above proteins have been reported to be up-regulated in cancer. For instance, TRP channels, including several TRPCs, TRPV6, and TRPM8, are overexpressed in several tumor cells, thus suggesting they may have oncogenic potential (10–13). SOCE and TRPC6 have been reported to control human hepatoma cell proliferation, and their blockade inhibits cell migration and invasion (10, 14). STIM1 and ORAI1 underlie ICRAC and regulate glioblastoma cell proliferation, apoptosis, and invasion (15, 16) and are involved in neuroblastoma proliferation as well (17). ORAI3 may form Ca2+-permeable channels with roles in breast cancer (18) and in non-small cell lung adenocarcinoma (19). The Ca2+ sensor STIM1 may also play an important role in cervical cancer growth, migration, and angiogenesis (20), and its knockdown suppresses SOCE, cell proliferation, and tumorigenesis in human epidermoid carcinoma cells (21). Stim2 is overexpressed in glioblastoma multiforme and colon cancer, but no functional data are available yet (22, 23). Here, we have investigated the deep remodeling of Ca2+ handling in human colon carcinoma, one of the most widespread and deadly forms of cancer. In addition, we have addressed the mechanisms involved in the remodeling and their contribution to the hallmarks of cancer.
EXPERIMENTAL PROCEDURES
Materials
NCM460 and NCM356 cells were obtained after a material transfer agreement with INCELL Corp. (San Antonio, TX). HT29 cells were donated by Dr. J. C. Fernández-Checa (Consejo Superior de Investigaciones Científicas, Barcelona, Spain), and SW480-ADH and SW480-R cells were donated by Prof. A. Muñoz (Consejo Superior de Investigaciones Científicas, Madrid, Spain). Dulbecco's modified Eagle's medium (DMEM), penicillin, streptomycin, l-glutamine, and fetal bovine serum were from Lonza (Basel, Switzerland). M3:10TM medium was from INCELL Corp. Detachin was from Gelantis (San Diego). Fura2/AM, Fura4F/AM, and Fluo4/AM were from Invitrogen. 2-Aminoethoxydiphenylborate and H2O2 were from Calbiochem. Thapsigargin and antibodies against TRPC1, ORAI1, ORAI2, and STIM1 were from Alomone Labs (Jerusalem, Israel). Antibodies against STIM2 and ORAI3 were from Santa Cruz Biotechnology. Anti-β-actin was from Abcam (Cambridge, UK). Caged-IP3 was from Sachem GmbH (Bremen, Germany). Glass bottom culture dishes were from MatTek (Ashland, MA). FITC annexin V was from BD Biosciences. Propidium iodide was from Sigma. SYBR Green I was from Kappa Biosystems (Boston, MA). Primers were obtained from Thermo Scientific (Ulm, Germany).
Cell Culture
Cells were cultured in DMEM 1 g/liter glucose or in M3:10TM medium as reported previously (24, 25) and supplemented with 1% penicillin/streptomycin, 1% l-glutamine, and 10% fetal bovine serum. Cells were maintained under standard conditions (37 °C, 10% CO2) and subcultured once a week. All cells were used at passages 3–10.
Cytosolic Ca2+ Imaging
[Ca2+]cyt was monitored as reported previously (25) by fluorescence imaging of cells using an inverted Zeiss Axiovert microscope equipped with an OrcaER Hamamatsu digital camera (Hamamatsu Photonics France). Cells were loaded with Fura2/AM (4 μm, 60 min) in external saline solution containing (in mm) the following: 145 NaCl, 5 KCl, 1 CaCl2, 1 MgCl2, glucose 10, Hepes/Na 10, pH 7.42. For SOCE, cells were washed twice and treated with thapsigargin (1 μm, 10 min) in the same medium except that it was devoid of Ca2+ and also contained 0.5 mm EGTA. Cells were located on a PH1 platform (Warner Instruments) attached on the stage of an inverted microscope and subjected to fluorescence imaging while continuously perfused with external medium at 37 °C. Cells were epi-illuminated alternately at 340 and 380 nm using bandpass filters, and light emitted above 520 nm at both excitation lights was filtered by the dichroic mirror, collected every 5–10 s with a ×40, 1.4 NA, oil objective. For estimation of Ca2+ store content, we assessed the effects of cyclopiazonic acid or ionomycin on [Ca2+]cyt in the absence of extracellular Ca2+. In the case of ionomycin, the increases in [Ca2+]cyt tended to saturate Fura2 signals. Accordingly, experiments with ionomycin were performed using the low affinity probe Fura4F/AM.
Cell Proliferation
Cells were seeded in 6-well plates at about 10 × 105 cells and incubated with supplemented DMEM or containing test solutions. Wells were counted by triplicate at time 0 and after 72 or 96 h. Cell viability was estimated using trypan blue staining.
Flash Photolysis of Caged-IP3 and Confocal Microscopy
Cells were plated in glass bottom culture dishes and loaded with Fluo4/AM (2 μm) and caged-IP3 (0.5 μm) for 1 h. Images were taken using a Leica TCS SP5 confocal microscope (Leica Microsystems, Mannheim, Germany) using a ×40 objective. Fluo4 was excited at 488 nm, and emissions between 503 and 571 nm were collected every 3 s. Photolysis of caged-IP3/acetoxymethyl ester was performed at 405 nm. The images were analyzed in LAS AF Lite software (Leica Microsystems, Mannheim, Germany). Background was subtracted from all images, and fluorescence intensity (F) was normalized to the resting fluorescence intensity (F0).
Invasion Assay
Cell invasion assay was performed using BD BiocoatTM MatrigelTM invasion chambers (BD Biosciences) containing a membrane with 8-μm pores. HT29 cells (1 × 10⁶ cells) in DMEM were seeded to the upper chamber. DMEM containing 20% FBS was added in the lower chamber as chemoattractant. After 48 h, noninvading cells were removed with a cotton swab from the upper chamber. Cells invading the outer side of the insert were fixed in methanol and stained with toluidine blue solution and 1% chloride double salt (Panreac, Barcelona, Spain). Cells per field were counted randomly at ×200 magnification.
Annexin V Staining Assay
Cell survival assay was performed by flow cytometry using FITC annexin V (BD Biosciences) and propidium iodide (Sigma). Cells were treated with 1 or 2 mm H2O2 for 30 or 150 min, respectively, depending on the experiment and then detached with trypsin/EDTA, centrifuged at 290 × g, and washed with cold PBS. The cells were then suspended in binding buffer (0.1 m Hepes, pH 7.4, 1.4 m NaCl, and 25 mm CaCl2) at a density of 1 × 10⁶ cells/ml. After that, 1 × 10⁵ cells were incubated with 5 μl of annexin V and 10 μl of propidium iodide (50 μg/ml) for 15 min at room temperature in the dark. Cells were analyzed using Gallios Flow Cytometer (Beckman Coulter, Brea, CA), and the results were processed with Kaluza Analysis Software (Beckman Coulter, Brea, CA).
Electrophysiological Recordings
ISOC in colonic cells was recorded using a Port-a-Patch planar patch clamp system (Nanion Technologies, Munich, Germany) in the whole-cell, voltage clamp configuration at room temperature (20 ± 2 °C). Cultured cells (3–5 days after plating) were detached with Detachin and suspended at a cell density of 1–5 × 10⁶ cells/ml in external recording solution contained (in mm) the following: 145 NaCl, 2.8 KCl, 2 MgCl2, 10 CaCl2, 10 Hepes, 10 d-glucose, pH 7.4. For siRNA assays, recordings were performed 48 h after silencing. Suspended cells were placed on the NPC©1 chip surface, and the whole-cell configuration was achieved. Internal recording solution containing (in mm) 50 CsCl, 60 CsF, 10 NaCl, 20 EGTA, 10 Hepes, 2 Na+-ATP, pH 7.2 (adjusted with CsOH), was deposited in recording chips, having resistances of 3–5 megohms. The high concentration of EGTA was used to deplete stores and to activate ISOC in intact and in silenced cells. In some experiments in which ISOC was activated with thapsigargin or ATP, internal EGTA was diminished from 20 to 0.2 mm and supplemented with a mitochondrial mixture (in mm) of 2 pyruvic acid, 2 malic acid, and 1 NaH2PO4. ISOC was assessed using voltage ramps (−100 to + 100 mV in 200 ms) applied every 5 s, from a holding potential of 0 mV and acquired with an EPC-10 patch clamp amplifier (HEKA). Immediately after the whole-cell configuration was established, the cell capacitance and the series resistances (<10 megohms) were measured. During recordings, these two parameters were measured, and if they exceeded ≥10% with respect to the initial value, the experiment was discontinued. Resting membrane potentials were estimated by reading the potential of the recorded cell immediately after rupturing the membrane in the current-clamp configuration. Leak currents were eliminated by subtracting the average of the first five ramp currents (obtained just after whole-cell configuration was reached) to all subsequent currents. Inward and outward current amplitudes were measured at −80 and +80 mV, respectively. Data were normalized with respect to cell capacitance. Liquid junction potential and capacitive currents were cancelled using the automatic compensation of the EPC-10. Data were filtered at 10 kHz and sampled at 5 kHz.
Conventional and Quantitative PCR
Total cellular RNA was isolated from cells using TRIzol reagent (Invitrogen). Extracted RNA integrity was tested by electrophoresis on agarose gels, and the purity and concentration were determined by spectrophotometry. RNA was reverse-transcribed using a high capacity cDNA reverse transcription kit (Applied Biosystems, Foster City, CA) and the cDNA diluted prior to PCR amplification. Nucleotide sequences of the STIM1, ORAI1, ORAI2, and ORAI3 primers used were taken from Ref. 26 and β-actin from Ref. 27. The remaining primers were designed with Primer-BLAST (28). Table 1 shows all primer sequences used. Qualitative PCR was performed on a TGradient system (Biometra, Goettingen, Germany) using a Taq polymerase (Fermentas). The reaction protocol consisted of 3 min at 94 °C, 35 cycles of 1 min at 94 °C, 1 min at 57 °C, and 30 s at 72 °C and finished at 72 °C for 10 min. Real time quantitative-PCR was performed using a SYBR Green I detection in a LightCycler rapid thermal cycler (Roche Applied Science). The PCR protocol started with 5 min at 95 °C followed by 45 cycles of 15 s at 95 °C, 20 s at 57 or 60 °C, and 5 s at 72 °C. β-Actin was used as housekeeping gene. The data were normalized by PCR analysis of β-actin. Melting curves were used to determine the specificity of PCR products (data not shown).
TABLE 1.
Primers used for PCR experiments
ORAI1, ORAI2, ORAI3, and STIM1 primers were taken from Takahashi et al. (26) and β-actin primers from Wang et al. (27). The remaining primers were designed using BLAST primer software (28). F indicates forward, and R indicates reverse.
| Name | Primers (5′ to 3′) | Predicted size |
|---|---|---|
| bp | ||
| TRPC1 | F, TACTTGCACAAGCCCGGAAT | 209 |
| R, ACCCGACATCTGTCCAAACC | ||
| TRPC6 | F, ATCTGGTGCCGAGTCCAAAG | 364 |
| R, TCCTTCAGTTCCCCTTCGTTC | ||
| TRPV4 | F, GGGTGGATGAGGTGAACTGG | 182 |
| R, GTCCGGGTTCGAGTTCTTGT3 | ||
| TRPV6 | F, CTGGCTCTGCCAAGTGTAAC | 364 |
| R, GAGGAGACTCCCAGATCCTCTT | ||
| TRPM8 | F, GATTCCAAGGCCACGGAGAA | 345 |
| R, GGACTGCGCGATGTAGATGA | ||
| ORAI1 | F, AGCAACGTGCACAAATCTCAA | 344 |
| R, GTCTTATGGCTAACCAGTGA | ||
| ORAI2 | F, CGGCCATAAGGGCATGGATT | 333 |
| R, TTGTGGATGTTGCTCACGGC | ||
| ORAI3 | F, CTCTTCCTTGCTGAAGTTGT | 380 |
| R, CGATTCAGTTCCTCTAGTTC | ||
| STIM1 | F, AGGGTACTGAGAATGAGCGGA | 399 |
| R, CACAGAGGATCTCGATCTGT | ||
| STIM2 | F, TGTCACTGAGTCCACCATGC | 469 |
| R, GGGCGTGTTAGAGGTCCAAA | ||
| β-Actin | F, TACGCCAACACAGTGCTGTCTGG | 206 |
| R, TACTCCTGCTTGCTGATCCACAT |
Western Blotting
Total protein was extracted from cells and used to quantify expression of TRPC1, ORAI1, ORAI2, ORAI3, STIM1, and STIM2. Whole-cell lysate was obtained using RIPA buffer (20 mm Tris-HCl, pH 7.8, 150 mm NaCl, 1% Triton X-100, 1% deoxycholic acid, 1 mm EDTA, 0.05% SDS) supplemented with a protease inhibitor mixture. Protein concentrations were determined by a Bradford protein assay. Proteins were fractionated by SDS-PAGE, electroblotted onto PVDF membranes, and probed with the antibodies at a dilution of 1:200, except the anti-β-actin was used at dilution 1:5000. Antibodies were visualized by addition of goat anti-rabbit IgG (TRPC1, ORAI1, ORAI2, ORAI3, STIM1, and STIM2) or rabbit anti-mouse IgG (Stim2 and β-actin). Detection was performed using Pierce ECL Western blotting substrate (Thermo Scientific) and VersaDoc Imaging System (Bio-Rad). Quantification of protein expression was carried out using Quantity One software (Bio-Rad).
Gene Silencing
siRNA sequences of human TRPC1, ORAI1, ORAI2, ORAI3, and STIM2 were obtained from Santa Cruz Biotechnology, as well as control siRNA. NCM460 and HT29 cells (1 × 10⁶) were transfected transiently with 50 pmol of siRNA using Nucleofector II (Amaxa Biosystems, Cologne, Germany) and the W-017 program according to the manufacturer's instructions. After transfection, cells were grown in culture for 48 h, and then imaging, electrophysiology, and cell survival experiments were performed. The effectiveness of silencing was tested by real time qRT-PCR.
Statistics
When only two means were compared, Student's t test was used. For more than two groups, statistical significance of the data was assessed by analysis of variance and compared using Bonferroni's multiple comparison tests. Differences were considered significant at p < 0.05.
RESULTS
Store-operated Ca2+ Entry and Cell Proliferation in Colon Carcinoma Cells
Cell proliferation and SOCE were tested in a series of human colon mucosa (NCM460 and NCM356) and human colon carcinoma cell lines (HT29, SW480-ADH, and SW480-R cells). SOCE was monitored by imaging the increase in cytosolic Ca2+ concentration ([Ca2+]cyt) induced by Ca2+ re-addition to cells previously treated with thapsigargin (1 μm, 10 min) in Ca2+-free medium. Under these conditions, Ca2+ stores are empty (data not shown). Therefore, this procedure enables monitoring maximally activated SOCE when Ca2+ stores are fully depleted. We found that SOCE is small in normal colon mucosa cell lines, and it is largely up-regulated in all three human colon carcinoma cell lines tested (Fig. 1, A and B). Cell proliferation is low in normal mucosa cell lines and increases in carcinoma cells as expected (Fig. 1C). We found that there is an excellent correlation between SOCE and cell proliferation in all five cell lines tested (Fig. 1D) suggesting that increased SOCE contributes to enhanced proliferation in carcinoma cells. These data are consistent with our previous report showing the correlation between SOCE inhibition and prevention of HT29 cell proliferation (25, 29). Therefore, increased SOCE may contribute to enhance cell proliferation of colon carcinoma cells.
FIGURE 1.
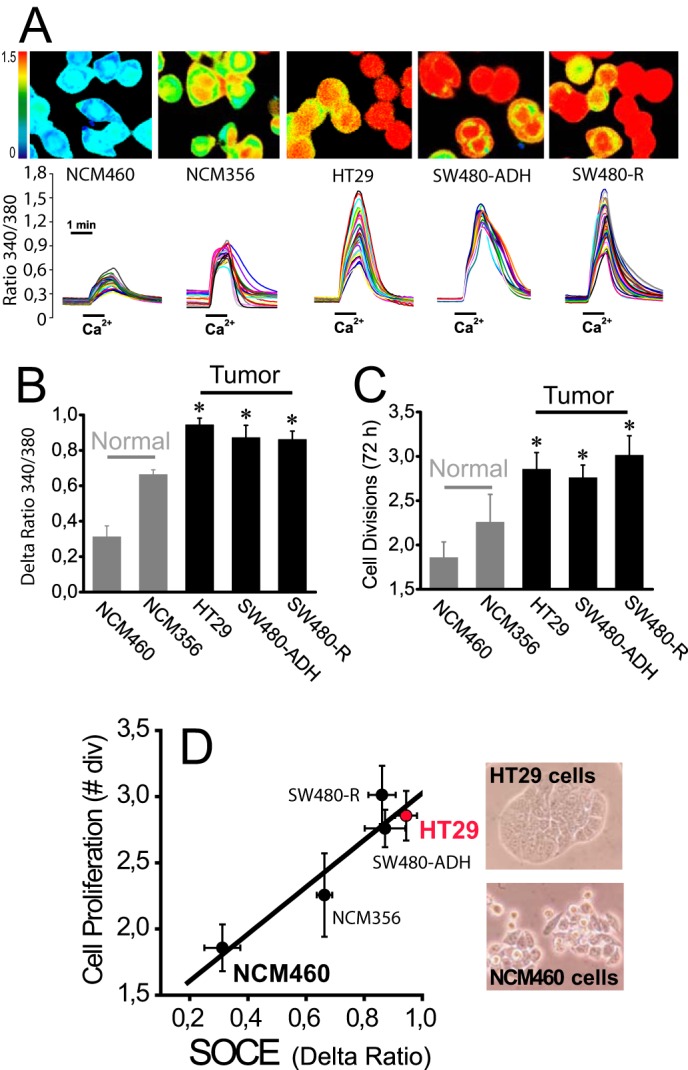
Increased SOCE correlates with increased cell proliferation in human colon carcinoma cells. A, SOCE in normal colon cancer cell lines. SOCE was recorded by Ca2+ imaging of fura-2-loaded cells treated with thapsigargin (1 μm, 10 min) in Ca2+-free medium by the Ca2+ re-addition protocol. Pictures show typical Ca2+ images coded in pseudocolor. Traces are representative single cell recordings of fluorescence ratios excited at 340 and 380 nm. B, average SOCE values in normal mucosa and colon carcinoma cell lines. Bars show mean ± S.E. values of rises in fluorescence ratios (n = 3, *, p ≤ 0.05). C, cell proliferation in normal and colon cancer cell lines. Cell proliferation was tested for 72 h (mean ± S.E., n = 3, *, p ≤ 0.05). D, correlation between SOCE and cell proliferation in normal and colon cancer cell lines. Cell proliferation (number of cell divisions in 72 h) was plotted versus increases in ratio fluorescence representing SOCE. Pictures show bright field images of HT29 and NCM460 cells.
We tested whether Ca2+ fluxes induced by physiological agonists were also remodeled in colon cancer. For this and subsequent studies, we selected NCM460 and HT29 cells as models of normal and colon carcinoma cells, respectively. The physiological agonist ATP increases [Ca2+]cyt in both normal and colon carcinoma cells. However, ATP-induced increases in [Ca2+]cyt in normal cells are small and transient, whereas in tumor cells [Ca2+]cyt increases are much larger and sustained (Fig. 2A). Fig. 2B shows that resting levels of [Ca2+]cyt are also significantly larger in tumor cells. ATP induces both Ca2+ release and (store-operated) Ca2+ entry. We tested both independently in normal and tumor cells. Fig. 2, C and E, shows that ATP-induced Ca2+ release is significantly larger in tumor cells. Similar results are obtained with carbachol (Fig. 2, D and F). Surprisingly, both agonists induce Ca2+ entry in tumor cells but not in normal cells (Fig. 2, C–F) suggesting that SOCE activation in physiological conditions is somehow prevented in normal cells. Therefore, in normal colonic cells, physiological agonists produce a small and transient increase in [Ca2+]cyt due solely to Ca2+ release, whereas tumor cells display a much larger increase due to both enhanced Ca2+ release and SOCE.
FIGURE 2.
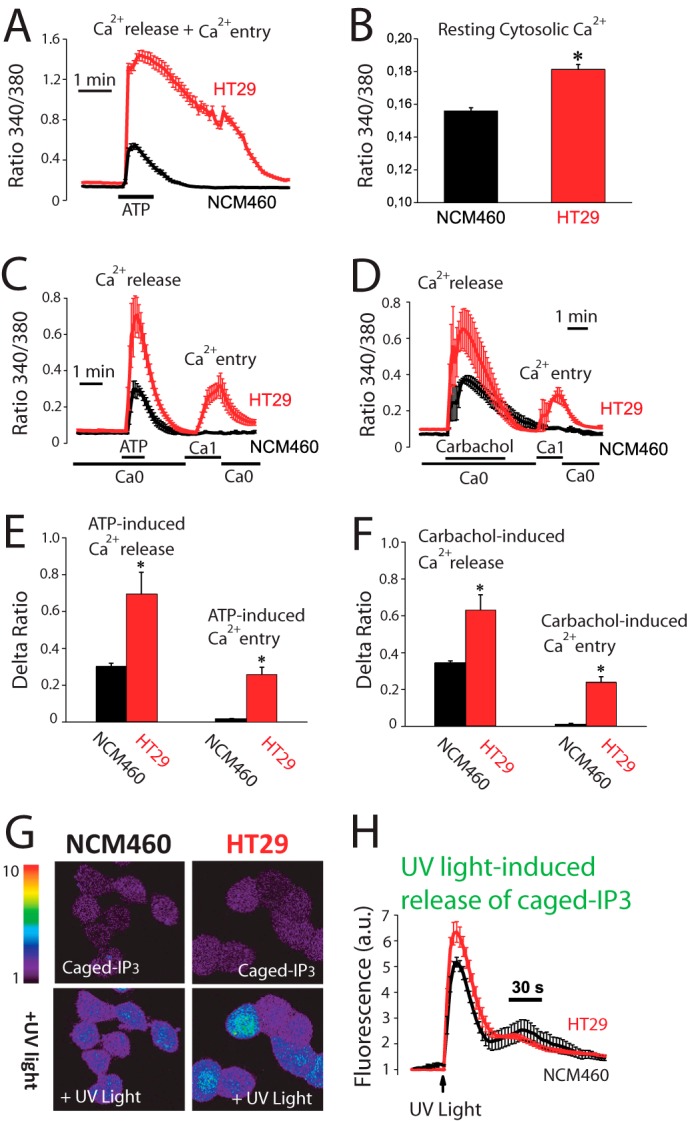
Agonist-induced Ca2+ release and Ca2+ entry are increased in human colon carcinoma cells. A, agonist-induced rise in [Ca2+]cyt is larger in colon carcinoma cells than in normal cells. [Ca2+]cyt increases induced by ATP (200 μm) in normal (NCM460) and colon carcinoma (HT29) cells. Traces are the mean ± S.E. values of fluorescence ratios of 19–23 individual cells (n = 4). B, resting [Ca2+]cyt is larger in tumor cells. Fluorescence ratios reflecting resting [Ca2+] estimated just before ATP perfusion in the same experiments (mean ± S.E., n = 4, *, p ≤ 0.05). C, ATP-induced Ca2+ release and entry are larger in tumor cells. Ca2+ release induced by ATP (200 μm) in Ca2+-free medium (Ca0) and Ca2+ entry induced by re-addition of external Ca2+ in normal and tumor cells (mean ± S.E., n ≥3). D, carbachol-induced Ca2+ release and entry are larger in tumor cells. Ca2+ release induced by carbachol (100 μm) in Ca2+-free medium (Ca0) and Ca2+ entry induced by re-addition of external Ca2+ in normal and tumor cells (mean ± S.E., n ≥3). E, average increases in ratio fluorescence for ATP-induced Ca2+ release and entry (mean ± S.E., *, p ≤ 0.05). F, average increases in ratio fluorescence for carbachol-induced Ca2+ release and entry (mean ± S.E., *, p ≤ 0.05). G, release of Ca2+ induced by caged-IP3 in normal and tumor cells. Cells were loaded with Fluo4/AM and Ca2+ release induced by flash photolysis of caged-IP3 was monitored by confocal imaging in normal and tumor cells. Pictures show fluorescence images coded in pseudocolor before and after of stimulation with UV light to release IP3. H, Fluo4 fluorescence recordings in normal and tumor cells (mean ± S.E.; n = 4, *, p ≤ 0.05).
Ca2+ Release and Ca2+ Store Content in Normal and Tumor Cells
Experiments were designed to ascertain whether IP3 availability causes differential Ca2+ release and as a consequence different amplitudes of Ca2+ increases between normal mucosa and colon carcinoma cells. Flash photolysis of caged-IP3 induces Ca2+ release in both normal and tumor cells as shown by confocal imaging of Fluo4-loaded cells. However, the Ca2+ release was still significantly larger in tumor cells (Fig. 2, G and H) suggesting that tumor cells store more Ca2+ and/or are more sensitive to IP3 than normal cells. Ca2+ store content in normal and colon carcinoma cells was estimated by measuring release of Ca2+ induced by the sarcoplasmic and endoplasmic reticulum Ca2+-ATPase pump blocker cyclopiazonic acid (CPA) and by low concentrations of the Ca2+ ionophore ionomycin. Unexpectedly, we found that CPA induces larger [Ca2+]cyt increases in normal cells than in tumor cells (Fig. 3A) consistently with a larger Ca2+ store content in normal cells. In fact, a few minutes after CPA treatment, normal cells still responded largely to ATP, whereas tumor cell stores did not respond at all (Fig. 3A). Consistently, ionomycin induces also a larger [Ca2+]cyt increase in normal cells (Fig. 3B) than in tumor cells. Thus, contrary to expectations, Ca2+ store content is seemingly larger in normal cells than in tumor cells.
FIGURE 3.
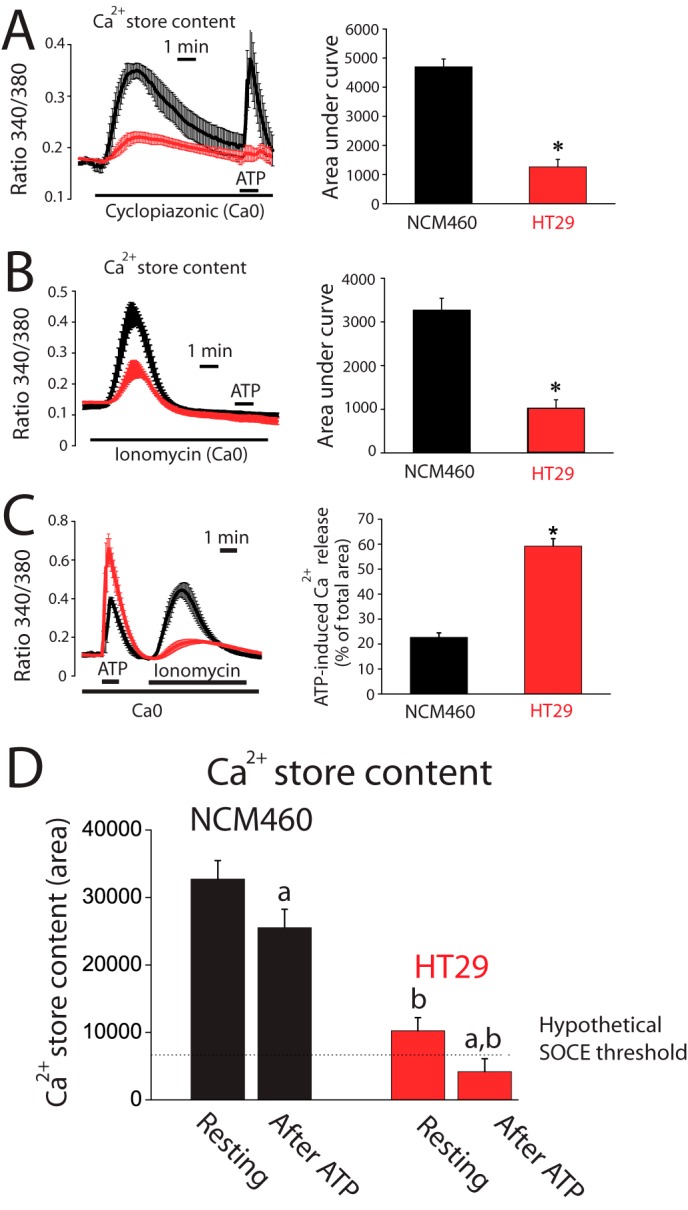
Ca2+ stores are partially depleted in colon cancer cells. A, CPA-induced Ca2+ release is smaller in tumor cells than in normal cells. Fura2 and Fura4F-loaded cells were subjected to fluorescence imaging for estimating Ca2+ store content. Recordings show the release of Ca2+ induced by 30 μm CPA in Ca2+-free medium (Ca0) in normal (black traces) and tumor (red traces) cells loaded with Fura2/AM (mean ± S.E.; n = 4). Bars represent area under curve (mean ± S.E.) of the records (*, p < 0.05). B, ionomycin-induced Ca2+ release is smaller in tumor cells than in normal cells. Recordings show the release of Ca2+ induced by 400 nm ionomycin in Ca2+-free medium (Ca0) in normal (black traces) and tumor (red traces) cells loaded with Fura4F/AM (mean ± S.E.; n = 7). Bars represent area under curve (mean ± S.E.) of the records (*, p < 0.05). C, Ca2+ store content after ATP-induced Ca2+ release in normal and tumor cells. Ca2+ release induced by 200 μm ATP in Ca2+-free medium was tested in normal and tumor cells. The remaining stored Ca2+ was estimated in the same cells by the adding 400 nm ionomycin (mean ± S.E.; n = 4–7). Bars are Ca2+ release-induced by ATP expressed as % of the total area under the curves (mean ± S.E., n ≥4, *, p ≤ 0.05). D, estimation of resting Ca2+ store content in normal and tumor cells (area under curve of bars in B) before (resting) and after ATP. Values after ATP were calculated by decreasing resting Ca2+ store content by the percent released estimated in C. (a, p < 0.05 versus resting cells; b, p < 0.05 versus normal cells.)
The extent of agonist-induced Ca2+ release relative to total stored Ca2+ was estimated next in normal and tumor cells. For this end, the amount of Ca2+ remaining in the store after ATP was tested using ionomycin in Ca2+-free medium (Fig. 3C). We found that ATP mobilizes about 20% of total stored Ca2+ in normal cells. In contrast, in tumor cells, ATP releases about 60% of total stored Ca2+ (Fig. 3C). Fig. 3D shows the Ca2+ store content estimated before and after stimulation with ATP in normal and tumor cells. Data indicate that Ca2+ stores in normal cells are overloaded relative to tumor cells, and physiological stimulation does not release much Ca2+, leaving stores nearly intact. In contrast, Ca2+ stores in tumor cells are substantially depleted in resting conditions and release relatively more Ca2+ in response to stimulation, thus likely enabling cells to reach the threshold for SOCE activation.
It has been reported that Ca2+ store content is critical for apoptosis resistance and survival (4). Accordingly, we have assessed apoptosis resistance (survival) of normal mucosa and carcinoma colon cells by flow cytometry after treatment with H2O2, a well established agent that promotes oxidative stress, apoptosis, and cell death. Consistently, colon carcinoma (HT29) cells are much more resistant to cell death than normal colonic epithelial (NCM460) cells (Fig. 4, A and B). These data suggest that the low Ca2+ store content of tumor cells may contribute to apoptosis resistance characteristic of human colon carcinoma cells.
FIGURE 4.
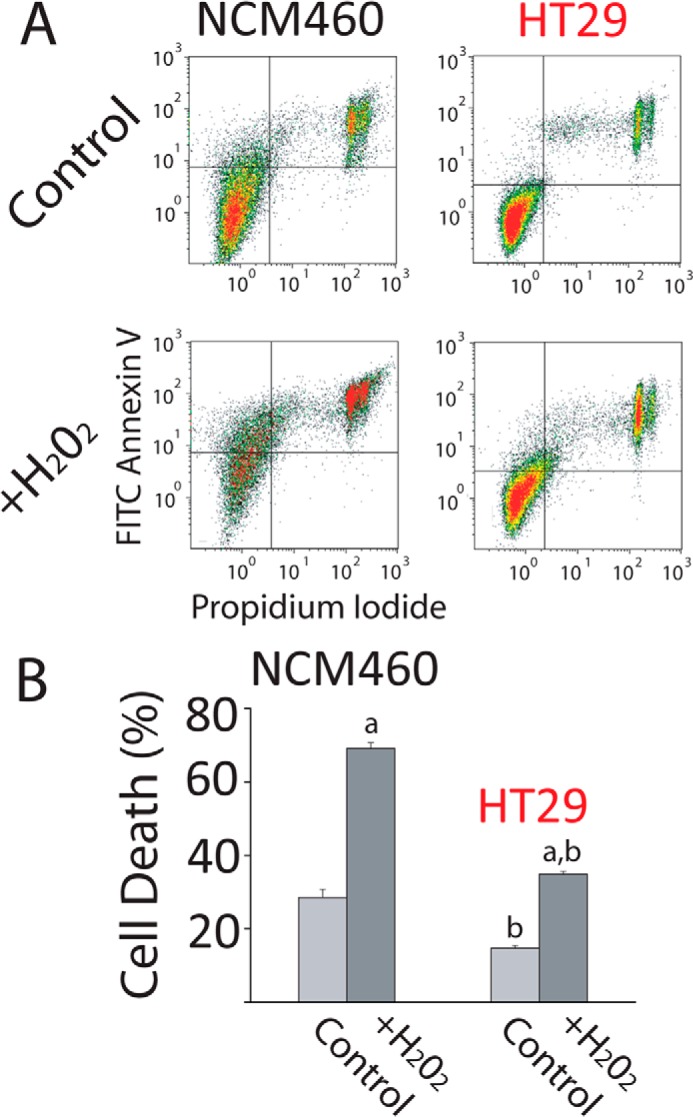
Colon carcinoma cells are resistant to cell death. A, resistance of NCM460 and HT29 cells to cell death induced by H2O2. Representative flow cytometry assays of FITC annexin V- and propidium iodide (PI)-stained cells. Viable cells are annexin V- and PI-negative; cells in early apoptosis are annexin V-positive and PI-negative, and cells in late apoptosis or necrosis are annexin V- and PI-positive. NCM460 and HT29 cells were treated with 2 mm H2O2 for 150 min. B, total cell death of treated and untreated cells with H2O2 (early apoptosis, late apoptosis, and necrosis). Bars are mean ± S.E. of the assay with three replicates and representative of five experiments (a, p < 0.05 versus untreated cells; b, p < 0.05 versus normal cells).
Store-operated Currents (ISOC) in Normal and Colon Carcinoma Cells
Ion currents involved in SOCE and agonist-induced Ca2+ entry were investigated next using planar patch clamp electrophysiology in the whole-cell voltage clamp configuration. The estimated resting membrane potential for HT29 cells was −64 ± 2 mV (n = 33) and for NCM460 cells was −45 ± 4 mV (n = 22). For ISOC activation, Ca2+ stores were passively depleted by dialyzing cells with a recording internal solution containing 20 mm EGTA. NCM460 cells displayed ISOC with small inward current amplitude (−2.3 ± 0.3 pA/pF, at −80 mV; n = 18) and without apparent outward current. The current-voltage (I-V) relationship of these ISOC, observed among all normal cells recorded (n = 82), displayed strong inward rectification and very positive reversal potential (Fig. 5A). All these characteristics are similar to the previously reported ICRAC (31). Fig. 5B shows the average time course graph, constructed by plotting the amplitude of the ICRAC-like current (at −80 mV) with respect to recording time, in which the Ca2+-dependent inactivation was prevented by the presence of a high concentration of EGTA. ISOC currents in tumor cells were quite different. In HT29 cells, ISOC has a small inward current that was significantly greater than in normal cells (−4.9 ± 0.15 pA/pF, at −80 mV; n = 31; Student's t test, p < 0.05). In addition, I-V relationships of ISOC display complex profiles that were classified in two principal groups as follows: a ICRAC-like current presented in about 36% of cells (Fig. 5, C and D; n = 11) and a mixture of a ICRAC-like plus a nonselective ISOC obtained from about 64% of cells (Fig. 5E; n = 20). Both I-V relationship profiles contain an inward component, without significant current amplitude differences when comparing them (Student's t test, p < 0.05). The outward component has an amplitude of 5.3 ± 0.2 pA/pF at 80 mV (n = 20) and displays rectification. Comparison of inward and outward currents in normal and tumor cells is shown in Fig. 5F. The electrophysiological data indicate that Ca2+ store depletion in tumor cells activates ICRAC-like currents with higher amplitude than in normal cells, probably contributing to their increased SOCE. Meanwhile, the nonselective ISOC observed in tumor cells could be an additional pathway for more Ca2+ influx. Similar results are obtained when ISOC was induced by passive depletion of intracellular Ca2+ stores with thapsigargin or the physiological agonist ATP (Fig. 6). Again, normal cells display only ICRAC-like currents with low amplitude (−1.6 ± 0.3 pA/pF, n = 17 for thapsigargin; −1.4 ± 0.6 pA/pF, n = 13 for ATP) compared with inward ISOC of tumor cells (−4.0 ± 0.4 pA/pF, n = 15 for thapsigargin; −2.4 ± 0.4 pA/pF, n = 13 for ATP). Tumor cells show currents similar to ISOC activated with high intracellular EGTA, thapsigargin as well as ATP activated ICRAC-like and nonselective ISOC currents.
FIGURE 5.
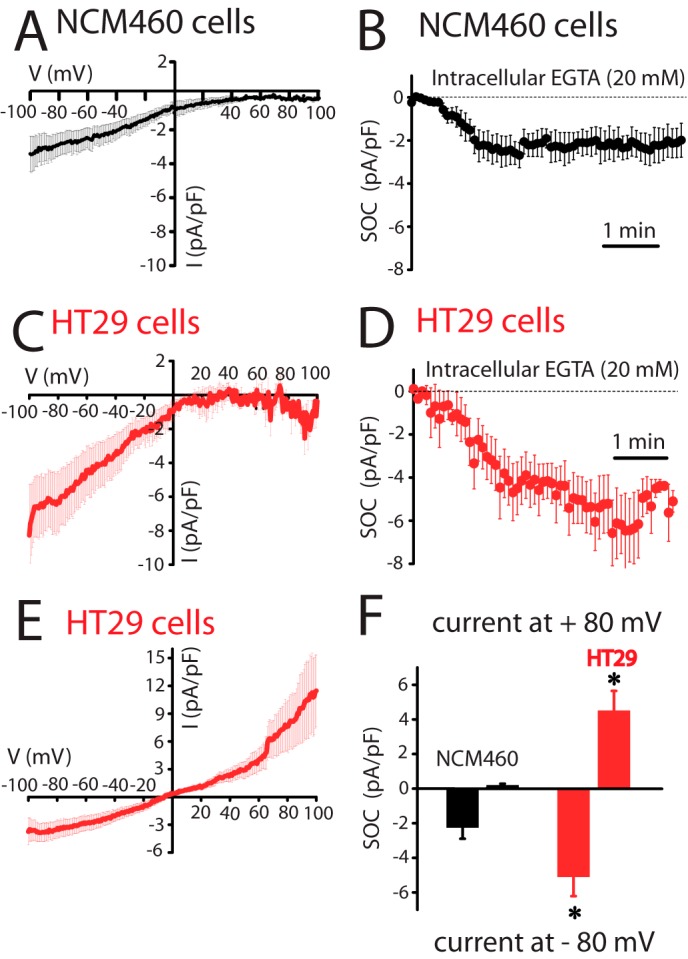
Store-operated currents (ISOC) in normal (NCM460) and colon carcinoma (HT29) cells. A, current-voltage (I-V) relationship of ISOC in normal cells. Average I-V relationships of ISOC obtained from NCM460 cells (n = 18). In this set of experiments SOCs were activated by passive Ca2+ store depletion with intracellular EGTA (20 mm). In this and following electrophysiological data, the current amplitudes were normalized with respect to cell capacitance; inward and outward currents were measured at −80 and +80 mV, respectively, and average plots are presented as mean ± S.E. B, averaged time course recordings of ISOC obtained from NCM460 cells (n = 18). C, I-V relationship of ICRAC-like currents in colon carcinoma cells. Average I-V relationships of ISOC obtained from the 36% of HT29 cells examined (n = 11). D, averaged time course recordings of ISOC obtained from HT29 cells (n = 31). E, I-V relationship of the nonselective ISOC in colon carcinoma cells. Average I-V relationships of ISOC obtained from the 64% of HT29 cells tested (n = 20). F, maximal current amplitude of ISOC in normal and tumor cells (n = 18–31, *, p < 0.05).
FIGURE 6.
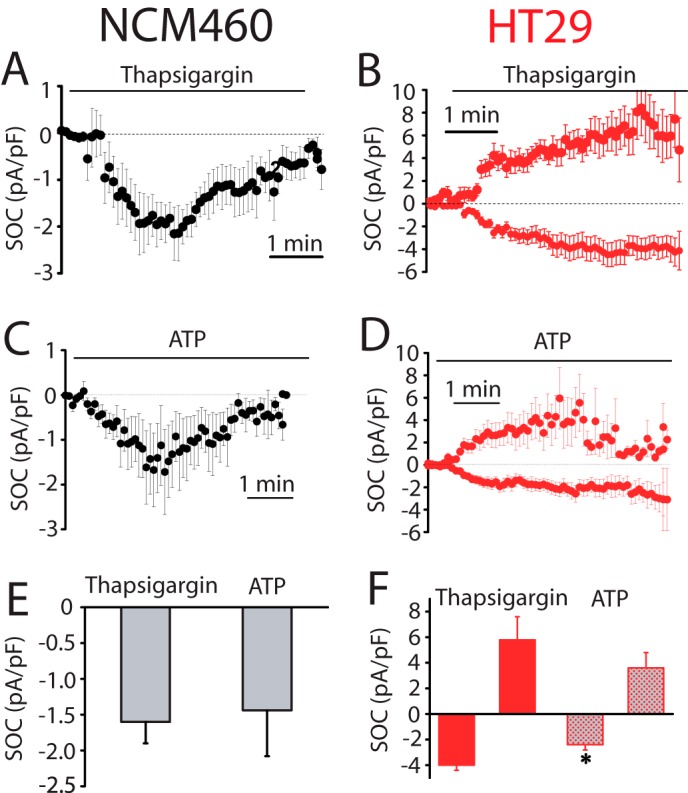
SOCs activated by thapsigargin and ATP in normal (NCM460) and colon carcinoma (HT29) cells. A, average time course plot of ICRAC activated with extracellular thapsigargin (1 μm) in normal colon cells (n = 17). B, average time course plots of ISOC activated with extracellular thapsigargin in HT29 cells (n = 15). C, average time course plots of ICRAC activated with ATP (200 μm) in NCM460 cells (n = 13). D, average time course plot of ISOC activated with ATP (200 μm) in HT29 cells (n = 13–14). E, mean ± S.E. of ISOC maximal amplitude for NCM460 (n = 17–13). F, mean of ISOC maximal amplitude for HT29 cells (n = 15–13, *, p < 0.05).
Sensitivity to antagonists was tested next to identify further the channels involved in ISOC in normal and tumor cells. Fig. 7 shows the effects of La3+, a classic SOCE antagonist of SOCs in normal and tumor cells. La3+ inhibited almost totally ICRAC-like currents in normal cells and both inward and outward currents in tumor cells. Low concentrations (30 μm) of 2APB largely inhibit the ICRAC-like current of normal cells (Fig. 8A) and the ICRAC-like component of tumor cells (Fig. 8B), but they have no effect on the outward ISOC. At 100 μm 2APB, the outward component is now inhibited (Fig. 8C). Average results are shown in Fig. 8D. 2APB is also more efficient in preventing SOCE in normal cells than in tumor cells (data not shown). Results suggest that normal and tumor cells express ISOC, similar to ICRAC, which are sensitive to low concentrations of 2APB. Yet the additional nonselective ISOC observed only in tumor cells is less sensitive to this SOCE antagonist. It has been reported that 2APB may enhance ISOC carried out by ORAI3 (32). In our hands 2APB did not potentiate ISOC in normal or tumor cells (Fig. 8). It has been reported that SOCE is involved in cell migration and invasion in tumor cells (30). Accordingly, colon carcinoma cell invasion was tested in vitro by transwell assay. HT29 cells displayed invasive characteristics. In addition, HT29 cell invasion was inhibited significantly by classic SOCE antagonist 2APB (Fig. 8E).
FIGURE 7.

Effects of La3+ on ISOC in normal (NCM460) and colon carcinoma (HT29) cells. ISOC were activated by passive Ca2+ store depletion with extracellular thapsigargin (1 μm). For NCM460 cells, representative I-V relationships of ISOC, in the absence and in the presence of 5 μm La3+ (A) and La3+-sensitive currents (B; n = 6). C, example of time course recordings of ISOC that was further inhibited by La3+. D, average effect of La3+ on ISOC in NCM460 cells, measured at −80 mV (mean ± S.E. of six independent experiments). F, *, p < 0.05. E–H, inhibition of ISOC of HT29 cells by 5 μm La3+ (n = 10; *, p < 0.05).
FIGURE 8.

Effects of 2APB on ISOC and SOCE in normal (NCM460) and colon carcinoma (HT29) cells and on HT29 cell invasion. A, low concentrations of 2APB (30 μm) inhibit ICRAC in normal cells. Left, representative I-V relationships of the ISOC in the absence (black) and in the presence (green) of 30 μm 2APB; middle, average I-V relationships of 2APB-sensitive currents (n = 11); right, example of time course recordings of ISOC that was further inhibited by 2APB. B, low concentrations of 2APB (30 μm) inhibit ICRAC component in tumor cells. Left, same as in A but for HT29 cells; middle, average I-V relationship of 30 μm 2APB-sensitive current (n = 6); right, example of time course recordings of ISOC and its subsequent inhibition by 30 μm 2APB concentration in tumor cells. C, high concentrations of 2APB (100 μm) inhibit the nonselective ISOC in tumor cells. Same as in B but using 100 μm 2-APB (n = 12); middle, average I-V relations of 100 μm 2APB concentration-sensitive currents (n = 12); right, example of time course recordings of ISOC. Both inward and outward currents were sensitive to high 2APB concentration. D, mean of ISOC maximal amplitude (at −80 and +80 mV) before and after 2APB at 30 and 100 μm (n = 5–12, #, p < 0.05). E, effects of 2APB (100 μm) on colon carcinoma (HT29) cell invasion. HT29 cells invaded a transwell invasion chamber from the top to the bottom in 48 h following an FBS gradient. Bars are mean ± S.E. of cells detected in three invasion experiments expressed relative to control (*, p < 0.05).
Ca2+ selectivity and Ba2+ permeability of ISOC was characterized further. The inward component of ISOC was very selective for Ca2+ because removal of Na+ (substituted by NMDG+) did not affect current amplitude (from −4.9 ± 1.5 pA/pF for Na+ medium to −4.2 ± 2.5 for Na+-free medium; n = 14–31). These data were consistent with the involvement of the high Ca2+-selective ORAI1 channel. In contrast, the outward component was nearly abolished in Na+-free medium (from 5.3 ± 0.2 pA/pF for Na+ medium to 0.2 ± 0.7 for Na+-free medium; n = 14–31) suggesting that this cation is the main current carrier of this component. However, it has been reported that Ba2+ decreases currents mediated by ORAI1 but potentiate those mediated by ORAI2 and ORAI3. We found that the inward ISOC carried Ba2+ ions, but the current amplitude was lower than that transported by Ca2+ (from −4.9 ± 15 pA/pF for Ca2+ to −2.6 ± 1.4 for Ba2+; n = 12–31) (data not shown). Data suggest that ORAI1 channels, rather than ORAI2 and -3, contribute to ICRAC-like currents in tumor cells. In addition, a nonselective channel also contributes to ISOC in tumor cells but not in normal cells.
Expression of SOCE Molecular Players in Normal and Tumor Carcinoma Cells
Expression of molecular candidates involved in ISOC and SOCE in normal and tumor cells was investigated next. PCR analysis shows expression of probable TRP channels involved in SOCE in normal and tumor cells. We found that only TRPC1 is expressed in both normal and tumor cells (Fig. 9A). TRPV6 and TRPM8 were expressed in normal but not in tumor cells (Fig. 9A). Consistently, TRPM8 agonist menthol had no effect on ISOC in tumor cells (data not shown). Other candidates tested, including TRPC6 and TRPV4, were missing in both cell lines (Fig. 9A). Regarding candidates involved in ICRAC, we found that all members of the ORAI (ORAI1, -2, and -3) and STIM (STIM1 and -2) protein families are expressed in both normal and tumor cells (Fig. 9B). Quantitative, real time RT-PCR studies were carried out on those candidates expressed in both normal and tumor cells (Fig. 9C). Expression values were normalized relative to expression of β-actin. The expression profile of these candidates in normal NCM460 cells was STIM2 = ORAI2 > STIM1 = ORAI1 > ORAI3 ≫ TRPC1. In HT29 colon carcinoma cells, the expression profile was roughly similar except that STIM1 now doubled the ORAI1 expression (Fig. 9C). More importantly, we found that several transcripts were increased significantly relative to normal cells, including STIM2, ORAI2, STIM1, and TRPC1 (Fig. 9C). ORAI1 and ORAI3 transcripts were similar in normal and tumor cells (Fig. 9C).
FIGURE 9.
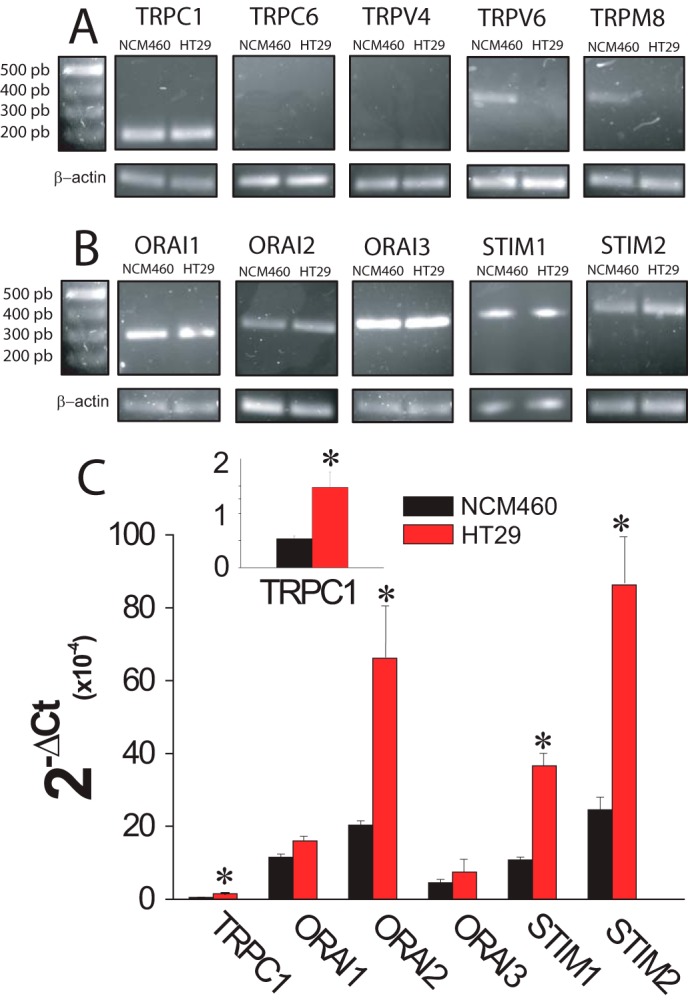
mRNA expression levels of SOCE-related channels and Stim proteins in normal (NCM460) and colon carcinoma (HT29) cells. A, mRNA expression of selected transient receptor potentials in normal and colon carcinoma cells. Pictures show specific bands of RT-PCR products of TRPC1, TRPC6, TRPV6, and TRP8. β-Actin expression was used as internal control. B, mRNA expression of orai and stim family members in normal and colon carcinoma cells. Pictures show specific bands of RT-PCR products of ORAI1, ORAI2, ORAI3, STIM1, and STIM2. β-Actin expression was used as internal control. C, transcript levels of TRPC1, ORAIS, and STIMs. mRNA levels of candidate molecular players were measured in normal (black bars) and tumor (red bars) cells by qPCR and normalized to β-actin. Data are mean ± S.E. of at least three experiments (*, p < 0.05).
Western blotting analysis was carried out to test expression of molecular candidates at the protein level. Fig. 10 shows that expression of almost all tested proteins was increased in tumor cells, including ORAI1, ORAI2, ORAI3, TRPC1, and STIM1 (Fig. 10, A–E), despite some of them showing no change at the mRNA level. Relative changes were not similar. TRPC1 and STIM1 increased 5.2 and 3.7 times in tumor cells, respectively. ORAI1, ORAI2, and ORAI3 increased 2.3-, 2.9-, and 1.5-fold in tumor cells, respectively (Table 2). Surprisingly, we found that STIM2 protein is nearly lost in colon carcinoma HT29 cells relative to normal colon NCM460 cells (Fig. 10F) despite that stim2 was the most increased transcript in tumor cells (Fig. 9C).
FIGURE 10.

Protein expression levels of SOCE-related channels and Stim proteins in normal (NCM460) and colon carcinoma (HT29) cells. A, Western blot assay of ORAI1 protein expression in normal and tumor cells. In this and the following panels, bars are mean ± S.E. values relative to normal cells (n ≥3; *, p < 0.05). B, Western blot assay of ORAI2 protein expression in normal and tumor cells. C, Western blot assay of ORAI3 protein expression in normal and tumor cells. D, Western blot assay of TRPC1 protein expression in normal and tumor cells. E, Western blot assay of STIM1 protein expression in normal and tumor cells. F, Western blot assay of STIM2 protein expression in normal and tumor cells.
TABLE 2.
Changes (fold increase) in proteins involved in SOCE in tumor cells relative to normal cells
Values correspond to the fold increase for each protein in tumor cells relative to normal cells. Thus, for instance, TRPC1 is 5.2 times more abundant in colon carcinoma cells than in normal colonic cells. Data are taken from the bars shown in Fig. 7. All proteins are more abundant (fold change >1) in tumor cells except for Stim2, which is decreased by 85% in tumor cells. The most important changes are those observed in TRPC1, Stim1, and Stim2 (shown in boldface).
| Fold change tumor vs. normal cells | |
|---|---|
| TRPC1 | 5.20 |
| ORAI1 | 2.30 |
| ORAI2 | 2.90 |
| ORAI3 | 1.50 |
| STIM1 | 3.70 |
| STIM2 | 0.15 |
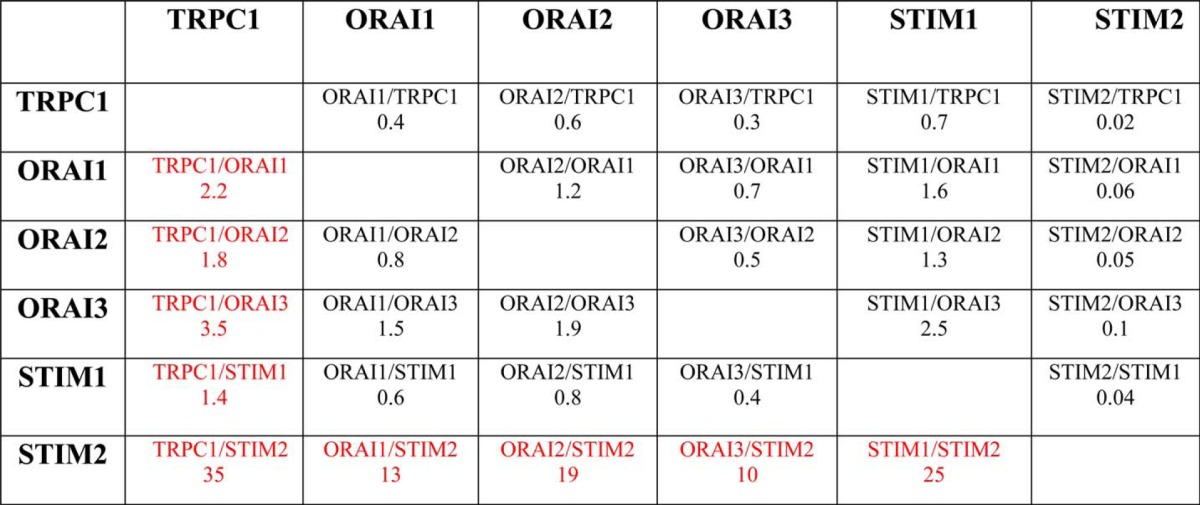
An emerging concept in Ca2+ signaling is that stoichiometry of molecular components may influence SOCE and ISOC critically (33). Accordingly, we have estimated the fold change of each component in tumor cells relative to the changes of the remaining proteins. Table 3 shows the fold change ratios of each protein relative to the changes of the rest of the proteins. TRPC1/ORAI1, TRPC1/ORAI2, and TRPC1/ORAI3 ratios increased 2.2-, 1.8-, and 3.5-fold, respectively, in tumor cells, suggesting that SOCs in tumor cells are enriched in TRPC1. In addition, fold change ratios for TRPC1/STIM2, ORAI1/STIM2, ORAI2/STIM2, ORAI3/STIM2, and STIM1/STIM2 increased by 35-, 13-, 19-, 20-, and 25-fold, respectively. These values suggest that, in tumor cells, STIM2 protein is essentially removed from any possible interaction with other SOCE molecular players. Interestingly, it has been reported that STIM2 may inhibit STIM1-mediated SOCE (34) and may regulate Ca2+ store content (35). Accordingly, loss of STIM2 may impact on both SOCE and Ca2+ store content. Knockdown experiments were carried out next to ascertain the role of the above-mentioned proteins on SOCE, ISOC, and Ca2+ store content.
TABLE 3.
Ratio of change in proteins involved in SOCE relative to the change observed in the remaining proteins
Each value corresponds to the fold change of a particular protein in tumor cells relative to the fold change of the remaining proteins. For instance, TRPC1 increases 5.2 fold in tumor cells whereas Orai1 increases only 2.3 times. Thus, TRPC1 protein expression increases 2.2 times more than Orai1. These ratios are very large for any combination of proteins with Stim2 in the denominator as this protein actually decreases in tumor cells.
Effects of TRPC1 and ORAI1 Silencing on SOCE and ISOC in Normal and Tumor Cells
Results suggest that ORAI1 and TRPC1 are likely involved in SOCE and ISOC in colon carcinoma cells. To test for this possibility, ORAI1 and TRPC1 were silenced in HT29 cells using small interference RNA (siRNA) technology. siRNA probes against ORAI1 and TRPC1 decreased significantly the amount of corresponding mRNA (Fig. 11, A and B). ORAI1 silencing decreases significantly SOCE in HT29 cells almost as much as it decreases ORAI1 transcript (Fig. 11A). In contrast, TRPC1 knockdown fails to reduce SOCE in tumor cells (Fig. 11B). The effects of silencing ORAI1 and TRPC1 on ISOC and ICRAC were tested next. In tumor cells, scramble siRNA had no effect on the inward or the outward ISOC (Fig. 11, C and F). As expected, ORAI1 silencing decreases largely the inward ISOC (from −4.9 ± 0.6 pA/pF for scramble siRNA to −2,2 ± 0.4 for ORAI1 siRNA; n = 13–19) but also reduces significantly the outward component (from 4.5 ± 1 pA/pF for scramble siRNA to 2.4 ± 1 for ORAI1 siRNA; n = 13–19) (Fig. 11, D and F). TRPC1 silencing nearly abolishes the outward component of the ISOC (from 4.5 ± 1 pA/pF for scramble siRNA to 0.7 ± 0.4 for TRPC1 siRNA; n = 13–17) and also reduces significantly the inward component (from −4.9 ± 0.6 pA/pF for scramble siRNA to −1.7 ± 0.5 for TRPC1 siRNA; n = 13–17) (Fig. 11, E and F). In normal cells, the results are quite different (Fig. 12). TRPC1 silencing or scramble siRNA has no effect on ICRAC (Fig. 12, A and B). However, silencing of ORAI1 inhibits ICRAC in normal cells (Fig. 12C). Average data are shown in Fig. 12D. Likewise, silencing of ORAI1 but not TRPC1 inhibits SOCE in normal cells (data not shown). These results indicate that both ORAI1 and TRPC1 contribute to ISOC in colon carcinoma cells, although in normal cells ICRAC is mediated only by ORAI1. We have also tested the contribution of ORAI2 and ORAI3 on SOCE in tumor cells. Fig. 13 shows that, paradoxically, silencing of either ORAI2 or ORAI3 in HT29 cells tends to increase SOCE. However, differences were not statistically significant (Fig. 13).
FIGURE 11.

Effects of ORAI1 and TRPC1 knockdown on SOCE and SOCs in colon carcinoma (HT29) cells. A, ORAI1 knockdown inhibits SOCE. Real time PCR of HT29 cells transfected with siRNAs scramble and orai1. Data were normalized to β-actin (mean ± S.E., n = 3, *, p < 0.05). SOCE recordings in HT29 cells transfected with scramble siRNA (black traces) or ORAI1 siRNA. Records are mean ± S.E. (n ≥15). Bars represent the mean ± S.E. of Δ ratios (*, p < 0.05). B, TRPC1 knockdown does not inhibit SOCE. Real time PCR of TRPC1 in HT29 cells transfected with scramble and TRPC1 siRNAs. Data were normalized to β-actin (mean ± S.E., n = 3, *, p < 0.05). SOCE recordings in HT29 cells transfected with scramble siRNA (black traces) or siRNA against TRPC1. Records are mean ± S.E. (n ≥15). Bars represent the mean ± S.E. of SOCE (Δ ratio) (*, p < 0.05). C, average time course plots of ISOC current amplitude from colon cancer cells transfected with scramble siRNA (n = 13). D, average time course plots of ISOC in colon cancer cells transfected with siRNA against ORAI1 (n = 19). E, average time course plots of ISOC in colon cancer cells transfected with siRNA against TRPC1 (n = 17). F, average data obtained from the above experiments (n = 13–19, *, p < 0.05).
FIGURE 12.

Effects of ORAI1 and TRPC1 knockdown on ICRAC in normal (NCM460) cells. A, representative I-V relationships (left) and current kinetics of ICRAC at −80 mV (right) in normal NCM460 cells transfected with scramble siRNA (n = 12). B, representative I-V relationships (left) and current kinetics of ICRAC at −80 mV (right) in normal NCM460 cells transfected with TRPC1 siRNA (n = 8). C, representative I-V relationships (left) and current kinetics of ICRAC at −80 mV (right) in normal NCM460 cells transfected with ORAI1 siRNA (n = 14). D, average current density (pA/pF) of ICRAC at −80 mV for nonsilenced cells and cells transfected with scramble siRNA, TRPC1 siRNA, and ORAI1 siRNA. Data are mean ± S.E. of 8–14 cells (*, p < 0.05), ns, nonsignificant.
FIGURE 13.
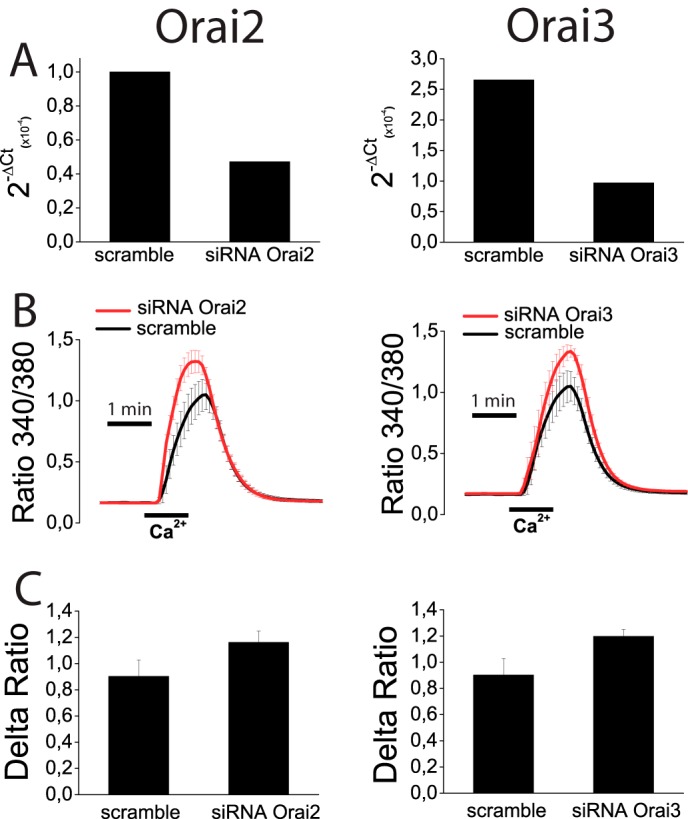
Effects of ORAI2 and ORAI3 knockdown on SOCE in colon carcinoma (HT29) cells. A, HT29 cells were transfected with scramble siRNA or siRNA for ORAI2 or ORAI3, and levels of corresponding mRNAs were estimated by quantitative RT-PCR. B, SOCE was estimated in control and knockdown cells for ORAI2 (left) and ORAI3 (right) HT29 cells treated with thapsigargin. Data are mean ± S.E. of four independent recordings for each case. C, Δ ratio (mean ± S.E.) of cells transfected with siRNA scramble or siRNAs for ORAI2 (left) or ORAI3 (right).
Finally, we have investigated the molecular basis and functional significance of Ca2+ store depletion in tumor cells. For this end, we tested the effects of STIM2 silencing in normal NCM460 cells on Ca2+ store content, SOCE, and apoptosis resistance. STIM2 silencing decreases STIM2 mRNA by 64 ± 6% (data not shown).
We found that STIM2 silencing decreased the rise in [Ca2+]cyt induced by ionomycin in Ca2+-free medium consistently with decreased Ca2+ store content in STIM2-silenced cells (Fig. 14A). In addition, re-addition of external Ca2+ to ionomycin treated is decreased in STIM2-silenced cells suggesting that STIM2 knockdown inhibits SOCE in normal cells. Consistently, SOCE in cyclopiazonic acid-treated cells was reduced in silenced cells (Fig. 14, A and B) relative to control cells. Therefore, these data indicate that STIM2 contributes to SOCE and Ca2+ store content in normal cells, and its silencing leads to decreased SOCE and Ca2+ store content. As Ca2+ store content may be relevant for apoptosis resistance, we next tested the effects of STIM2 silencing on apoptosis resistance. We found that after strong oxidative damage (2 mm H2O2, 150 min), resistance to apoptosis was similar in control and silenced cells (data not shown). However, when damage was less severe (1 mm H2O2, 30 min), STIM2-silenced cells proved to be more resistant to cell death than control cells (Fig. 14C). These data indicate that STIM2 participates in SOCE in normal colon epithelial cells, and the inhibition of its expression during tumorigenesis may contribute to Ca2+ store depletion and apoptosis resistance, which are characteristic of tumor cells.
FIGURE 14.

Effects of STIM2 knockdown on Ca2+ store content, SOCE, and apoptosis resistance in normal (NCM460) cells. A, STIM2 knockdown decreased significantly the increase in cytosolic Ca2+ induced by ionomycin in Ca2+-free medium (Ca2+ store content) and the increase in Ca2+ recorded in the same cells after external Ca2+ re-addition (SOCE) in normal NCM460 cells loaded with Fura4F/AM (*, p < 0.05, n = 3 independent experiments). B, STIM2 knockdown decreased SOCE significantly in normal NCM460 cells. SOCE was estimated by the re-addition of extracellular Ca2+ to cyclopiazonic acid (CPA)-treated, normal NCM460 cells transfected with scramble or STIM2 siRNA (*, p < 0.05, n = 3 independent experiments). C, effects of STIM2 knockdown on cell death induced by H2O2 (1 mm, 30 min) in normal NCM460 cells. Representative flow cytometry assays of FITC annexin V and propidium iodide-stained cells. Viable cells are annexin V- and PI-negative; cells in early apoptosis are annexin V-positive and propidium iodide-negative, and cells in late apoptosis or necrosis are annexin V- and PI-positive. Bars show the increase in total cell death (mean ± S.E.) induced by H2O2 in STIM2-silenced cells relative to the effects in scramble siRNA-transfected cells. Data are from three independent experiments (*, p < 0.05).
DISCUSSION
We have investigated the remodeling of intracellular Ca2+ handling in colon cancer, its molecular basis, and its contribution to cancer hallmarks. To this end, functional parameters and molecular players involved in Ca2+ homeostasis were studied in normal human mucosa and colon carcinoma cells. All colon carcinoma cell lines tested displayed a much larger SOCE than normal cell lines, which correlated with increased cell proliferation in tumor cells, thus suggesting that enhanced SOCE contributes to increased tumor cell proliferation in colon cancer. Consistently, up-regulation of SOCE has been recently correlated with cancer features in a number of cancers (10, 12, 13, 16, 20, 21, 36). We have shown previously that SOCE antagonists inhibit colon carcinoma cell proliferation (25, 29). Now, we show that SOCE antagonist 2APB also inhibits colon carcinoma cell invasion suggesting contribution of SOCE to enhanced proliferation and invasion in these cells. Accordingly, we have investigated the mechanisms for increased SOCE in human colon carcinoma cells. Importantly, NCM460 normal and HT29 carcinoma colon cells have been recently validated as normal and tumor cell models, respectively (37).
Increased SOCE in colon carcinoma cells was associated with enhanced resting [Ca2+]cyt, more negative membrane potential, increased ISOC, and enhanced agonist-induced Ca2+ release and entry. As a matter of fact, physiological agonists that induce Ca2+ release (ATP and carbachol) promoted Ca2+ entry only in tumor cells. This differential response could be due to the fact that Ca2+ stores in normal cells are overloaded relative to tumor cells, and the agonist-induced Ca2+ store emptying is rather limited. In this scenario, the threshold for SOCE activation could be beyond reach, and SOCE is not permitted unless Ca2+ stores are fully depleted by, for instance, thapsigargin. In contrast, Ca2+ stores in tumor cells are substantially depleted, and Ca2+ release is enhanced, thus putting SOCE threshold at reach and favoring SOCE activation in physiological conditions. This partial Ca2+ store depletion in colon carcinoma cells could contribute also to cancer features. First, it favors SOCE activation and therefore cell proliferation and invasion as stated above. Second, it may also contribute to apoptosis resistance, another hallmark of cancer cells. Interestingly, it has been reported recently that Ca2+ store content may be critical for survival. Specifically, large Ca2+ stores favor enhanced transfer to mitochondria and mitochondrial Ca2+ overload, whereas reduced Ca2+ store content prevents mitochondrial Ca2+ overload and apoptosis (38). Consistently, we show that colon carcinoma cells display substantially depleted stores and enhanced resistance to cell death. Taken together, data suggest that the “Ca2+ signature” of colon carcinoma cells shown here and made of enhanced SOCE and depleted Ca2+ stores may contribute to enhanced proliferation, invasion, and survival characteristics of cancer cells.
What mechanisms underlie enhanced SOCE and depleted Ca2+ stores in human colon carcinoma cells? Regarding SOCE, our combined functional and molecular analysis reveals that SOCE enhancement in tumor cells is mediated by the following: 1) up-regulation of ORAI1 and STIM1 proteins, which likely mediate enhanced ICRAC and SOCE in tumor cells; 2) overexpression of TRPC1 protein that correlated with the emergence of a nonselective ISOC; and 3) the switch of the levels of expression between STIM1 and STIM2 Ca2+ sensors proteins (Fig. 15). More specifically, differences in ion channel expression and ER Ca2+ sensors may contribute to enhance SOCE in tumor cells. This possibility was addressed directly by measuring SOCs in normal and tumor cells. Interestingly, ISOC was strikingly different. Normal cells display a small ICRAC current, whereas tumor cells showed a mix of currents, including enhanced ICRAC plus and additional nonselective ISOC. It has been reported that SOCE can be supported by different ISOC expressed in the same cell (9, 39–41). To our knowledge, this is the first report showing that ISOC currents in normal cells are strikingly different compared with their tumor cell counterparts.
FIGURE 15.

Hypothesis of molecular basis of Ca2+ remodeling in colon cancer. The “Ca2+ signature” of colon carcinoma cells is enhanced SOCE, differential SOCs, and depleted Ca2+ stores. This remodeling is associated with increased protein expression of TRPC1, STIM1, ORAI1, ORAI2, and ORAI3 in tumor cells along with loss of STIM2 protein. Normal cells show small SOCE mediated by canonical ICRAC carried by ORAI1. STIM2 protein in normal cells may limit STIM1/ORAI1 interaction and may signal for large Ca2+ store content, thus preventing SOCE activation and TRPC1 functional expression. In this scenario, cell proliferation and migration are limited, and cells are prone to die as Ca2+ stores are loaded. Loss of STIM2 renders cells under control of STIM1 that set Ca2+ store content to a lower level. Like in Darier disease, depletion of Ca2+ stores likely promotes TRPC1 functional expression. In addition, loss of STIM2 may also favor interaction of STIM1 with ORAI1 and TRPC1 resulting in enhanced ICRAC and the appearance of a nonselective current.
ICRAC in normal and colon carcinoma cells is likely mediated by ORAI1 and STIM1/STIM2 proteins because all of them are expressed in both cell lines, and the biophysical and pharmacological characteristics of recorded currents match those described for canonical ICRAC (31, 42, 43). In our hands, ICRAC in both normal and tumor colon cells displayed voltage-independent activation, strong inward rectification, and reversal potential in very positive voltages. Also, ICRAC was inhibited by 2APB at a low concentration (30 μm). In addition, the well known potentiating effect of low concentrations of 2APB on ORAI3-containing SOCs (32, 44) was not observed. Moreover, the extent of ICRAC was unaffected by the absence of extracellular Na+ ions and reduced when Ba2+ was used instead Ca2+, thus indicating a high Ca2+ selectivity and the involvement of ORAI1 channels (42, 45, 46).
However, the emergent ISOC restricted to tumor cells was nonselective showing a reversal potential near 0 mV. Unlike ICRAC, the emergent ISOC was not sensitive to low concentrations of 2APB (30 μm), and the current amplitude of the outward component was significantly decreased by removal of extracellular Na+ ions, thus suggesting involvement of a TRPC member (47, 48). At the molecular level, several candidates were excluded because they are not expressed in tumor cells, including TRPV6, TRPM8, TRPC6, and TRPV4. In contrast, TRPC1 was expressed in normal and tumor cells, and its abundance increased quite significantly in colon cancer cells, thus suggesting contribution of TRPC1 to the nonselective, emergent ISOC of tumor cells. Knockdown experiments corroborated the molecular identity of SOCs underlying SOCE. ORAI1-containing channels mediate ICRAC in normal and tumor cells. Overexpression of ORAI1 and STIM1 is involved in increased SOCE and ISOC in tumor cells. Consistently, ORAI1 silencing prevented SOCE in tumor cells. However silencing of either ORAI2 or ORAI3 had no significant effect on SOCE in colon carcinoma (HT29) cells. Meanwhile, TRPC1 channels are involved in the nonselective ISOC but do not contribute to SOCE. Moreover, the low Ca2+ store content may, in turn, modulate the expression of the TRPC1 channel. For example, it has been shown that prolonged depletion of Ca2+ stores enhances TRPC1 expression and increases [Ca2+]cyt responses to agonists without affecting SOCE (49). Silencing data are also consistent with the possibility of functional interactions between ORAI1 and TRPC1 channels. ORAI1 knockdown prevents mainly ICRAC but also reduces significantly the outward component mediated by TRPC1. Conversely, TRPC1 silencing nearly abolishes outward ISOC, but it also reduces significantly the extent of the inward component. Consistently, it has been shown that STIM1 may drive interactions between ORAI1 and TRPC1 (39, 50).
Our results pose the question regarding what is the role played by TRPC1 up-regulation in colon cancer. TRPC channel has been the subject of a long term controversy about its role as a SOC channel (33). In our experimental conditions, the nonselective ISOC is likely mediated by TRPC1-containing channels. The most interesting matter is that, in human carcinoma colon cells, TRPC1 protein showed the largest change (up-regulation) together with STIM2 (down-regulation). Accordingly, these changes could represent the most critical events underlying Ca2+ remodeling and acquisition of cancer features. In support of this view, it has been reported that TRPC channels are overexpressed and regulate cell proliferation in human non-small cell lung, breast, liver, stomach, and glioma cancer (13, 51–54). The nonselective channel TRPC1 permeates Na+ and Ca2+, and consequently, it may have a role as a Ca2+ influx pathway or as a modulator of membrane potential. For instance, TRPC1 may control the driving force for Ca2+ influx during SOCE (55). Moreover, TRPC1 could support cell proliferation of tumor cells because one of its physiological roles is the modulation of the cell cycle progression through the regulation of cell volume (56). In addition, it has been reported recently that the interaction between STIM1 and TRPC1 is essential for cell migration after wounding in rat intestinal, epithelial cells (57). Moreover, it has been shown that the rise in STIM2 relative to STIM1 favors STIM1/STIM2 heteromers that suppress STIM1 translocation to the plasma membrane and its interaction with TRPC1 (57). Therefore, our finding that TRPC1/STIM2, STIM1/STIM2, and ORAI1/STIM2 ratios increase by 35-, 25-, and 13-fold, respectively, in colon cancer cells suggests that STIM2 depletion may enable STIM1 translocation to the plasma membrane and STIM1 interaction with TRPC1, providing an explanation for both enhanced SOCE and functional expression of an emergent, nonselective ISOC in tumor cells. Further research is needed to ascertain more precisely the role of TRPC1 in colonic tumorigenesis.
What mechanisms are involved in the low level of Ca2+ store content in colon carcinoma cells? Ca2+ store content at the ER depends on the balance between Ca2+ uptake mediated by sarcoplasmic and ER Ca2+-ATPase pumps and Ca2+ exit through unknown leak channels (4). However, it has been reported that the level of [Ca2+] inside the ER is dictated actually by ER Ca2+ sensors STIM1 and STIM2 (35) that open Ca2+ channels at the plasma membrane to refill Ca2+ stores. However, STIM1 and STIM2 are not alike and show different affinities for Ca2+. STIM1 senses Ca2+ with high affinity and activates SOCE only after substantial depletion of Ca2+ stores (EC50 ∼210 μm). In contrast, the STIM2 EF hand displays a low apparent affinity for Ca2+ (Kd ∼500 μm) and senses rather small decreases in [Ca2+] within the ER with an EC50 of 406 μm (35). Accordingly, in normal mucosa cells expressing both STIM1 and STIM2, it is likely that Ca2+ levels inside the ER Ca2+ store are set by STIM2 that activates first when the Ca2+ store content falls below 500 μm. This view is consistent with the large Ca2+ store content found in normal cells where Stim2 is relatively more abundant. However, in tumor cells, STIM2 depletion may render STIM1 as the only Ca2+ sensor available. In this scenario, STIM1 could set Ca2+ levels within the ER close to 200 μm. Our finding that the STIM1/STIM2 ratio increases by 25-fold in tumor cells where Ca2+ stores remain substantially depleted is entirely consistent with this possibility. Our knockdown experiments also support this view. STIM2 knockdown in normal cells decreased Ca2+ store content in a significant manner. More importantly, STIM2 silencing induced apoptosis resistance to normal cells, thus confirming the important role of STIM2 loss in Ca2+ store emptying and enhanced cell survival.
Interestingly, down-regulation of STIM2 and Ca2+ store depletion may contribute to increase TRPC1 in tumor cells in another way. It has been reported that depletion of Ca2+ stores with thapsigargin increases TRPC1 protein levels without affecting SOCE (49). Thus, TRPC1 functional expression depends on the filling state of Ca2+ stores. This view is supported by a report showing that in Darier disease, a disorder of skin epithelia, a rare mutation that prevents operation of SERCA2 depletes Ca2+ stores, and this condition promotes a compensatory up-regulation of TRPC1 (58). Therefore, increased expression of TRPC1 and perhaps other SOCE components in colon cancer could be secondary to Ca2+ store depletion associated with the loss of STIM2.
Taken together, the above data suggest that the critical event in Ca2+ remodeling in colon cancer could be STIM2 protein down-regulation. As a cautionary note, we must acknowledge that our results are derived from comparison of a few normal and colon carcinoma cell lines that may not reflect entirely human colorectal carcinogenesis. Further research is required to test whether our results apply to other tumor cell lines and real tumor cells. However, in support of the potential relevance of STIM2 loss in colon cancer, recent data suggest that STIM2 is a tumor suppressor but the action mechanism is unknown. The STIM2 gene located at 4p15 has been recently identified as a candidate gene for tumorigenesis in glioblastoma multiforme (23) and colon cancer (22). Paradoxically, STIM2 transcript is actually overexpressed in 64% of all human colon cancers tested (22). However, these results are controversial because, as stated by the own authors, it is intriguing that a gene with a suppressor phenotype is so frequently overexpressed in colon cancer (22). It is worth noting, however, that STIM2 was tested only at the transcript level. Interestingly, STIM2 transcript, which is up-regulated also in prostate cancer, has been recently shown to be down-regulated during the transition from moderate to high Gleason grade (59). Thus, up-regulation of the mRNA level of STIM2 is not necessarily reflected as overexpression of the protein. In agreement, we show that STIM2 transcript is overexpressed in colon carcinoma (HT29) cells, although STIM2 protein is nearly lost in the same cells. Finally, it has also been reported recently that increases in STIM1/STIM2 ratios are associated with a poor prognosis in breast cancer (60).
In summary, we show here that human colon carcinoma cells show increased store-operated Ca2+ entry, enhanced and modified store-operated currents, and partially depleted Ca2+ stores relative to their normal counterparts. These changes correlate with increased cell proliferation, invasion, and survival characteristic of tumor cells. Finally, most changes can be explained by changes in molecular players involved in SOCE, particularly a reciprocal shift in TRPC1 and STIM2 expression, thus suggesting TRPC1 and STIM2 as novel targets for colorectal cancer. Further research is required to ascertain more precisely the role of these molecular players in colon carcinogenesis.
Acknowledgment
We thank D. del Bosque for technical assistance.
This work was supported in part by Grants BFU2009-08967 and BFU2012-37146 from Ministerio de Economia y Competitividad, Spain (to C. V.), and Ref VA145U13 from Regional Government of Castilla y León, Spain (to L. N.).
- SOCE
- store-operated Ca2+ entry
- [Ca2+]cyt
- cytosolic free Ca2+ concentration
- SOC
- store-operated current
- Stim1 and -2
- stromal interaction molecules 1 and 2
- TRPC
- transient receptor potential channel
- pF
- picofarad
- 2APB
- 2-aminoethoxydiphenylborate
- IP3
- inositol 1,4,5-trisphosphate
- ER
- endoplasmic reticulum
- CPA
- cyclopiazonic acid.
REFERENCES
- 1. Hanahan D., Weinberg RA. (2011) Hallmarks of cancer: the next generation. Cell 144, 646–674 [DOI] [PubMed] [Google Scholar]
- 2. Cheng K. T., Ong H. L., Liu X., Ambudkar I. S. (2013) Contribution and regulation of TRPC channels in store-operated Ca2+ entry. Curr. Top. Membr. 71, 149–179 [DOI] [PMC free article] [PubMed] [Google Scholar]
- 3. Roderick H. L., Cook S. J. (2008) Ca2+ signalling checkpoints in cancer: remodelling Ca2+ for cancer cell proliferation and survival. Nat. Rev. Cancer 8, 361–375 [DOI] [PubMed] [Google Scholar]
- 4. Prevarskaya N., Ouadid-Ahidouch H., Skryma R., Shuba Y. (2014) Remodelling of Ca2+ transport in cancer: how it contributes to cancer hallmarks? Philos. Trans. R. Soc. Lond. B. Biol. Sci. 369, 20130097. [DOI] [PMC free article] [PubMed] [Google Scholar]
- 5. Bergmeier W., Weidinger C., Zee I., Feske S. (2013) Emerging roles of store-operated Ca2+ entry through STIM and ORAI proteins in immunity, hemostasis and cancer. Channels 7, 379–391 [DOI] [PMC free article] [PubMed] [Google Scholar]
- 6. Liou J., Kim M. L., Heo W. D., Jones J. T., Myers J. W., Ferrell J. E., Jr., Meyer T. (2005) STIM is a Ca2+ sensor essential for Ca2+-store-depletion-triggered Ca2+ influx. Curr. Biol. 15, 1235–1241 [DOI] [PMC free article] [PubMed] [Google Scholar]
- 7. Feske S., Gwack Y., Prakriya M., Srikanth S., Puppel S. H., Tanasa B., Hogan P. G., Lewis R. S., Daly M., Rao A. (2006) A mutation in Orai1 causes immune deficiency by abrogating CRAC channel function. Nature 441, 179–185 [DOI] [PubMed] [Google Scholar]
- 8. Hogan P. G., Lewis R. S., Rao A. (2010) Molecular basis of calcium signaling in lymphocytes: STIM and ORAI. Annu. Rev. Immunol. 28, 491–533 [DOI] [PMC free article] [PubMed] [Google Scholar]
- 9. Kim M. S., Zeng W., Yuan J. P., Shin D. M., Worley P. F., Muallem S. (2009) Native store-operated Ca2+ influx requires the channel function of Orai1 and TRPC1. J. Biol. Chem. 284, 9733–9741 [DOI] [PMC free article] [PubMed] [Google Scholar]
- 10. El Boustany C., Bidaux G., Enfissi A., Delcourt P., Prevarskaya N., Capiod T. (2008) Capacitative calcium entry and transient receptor potential canonical 6 expression control human hepatoma cell proliferation. Hepatology 47, 2068–2077 [DOI] [PubMed] [Google Scholar]
- 11. Lehen'kyi V., Prevarskaya N. (2011) Oncogenic TRP channels. Adv. Exp. Med. Biol. 704, 929–945 [DOI] [PubMed] [Google Scholar]
- 12. Vanden Abeele F., Shuba Y., Roudbaraki M., Lemonnier L., Vanoverberghe K., Mariot P., Skryma R., Prevarskaya N. (2003) Store-operated Ca2+ channels in prostate cancer epithelial cells: function, regulation, and role in carcinogenesis. Cell Calcium 33, 357–373 [DOI] [PubMed] [Google Scholar]
- 13. Zeng B., Yuan C., Yang X., Atkin S. L., Xu S. Z. (2013) TRPC channels and their splice variants are essential for promoting human ovarian cancer cell proliferation and tumorigenesis. Curr. Cancer Drug Targets 13, 103–116 [PubMed] [Google Scholar]
- 14. Yang N., Tang Y., Wang F., Zhang H., Xu D., Shen Y., Sun S., Yang G. (2013) Blockade of store-operated Ca2+ entry inhibits hepatocarcinoma cell migration and invasion by regulating focal adhesion turnover. Cancer Lett. 330, 163–169 [DOI] [PubMed] [Google Scholar]
- 15. Liu H., Hughes J. D., Rollins S., Chen B., Perkins E. (2011) Calcium entry via ORAI1 regulates glioblastoma cell proliferation and apoptosis. Exp. Mol. Pathol. 91, 753–760 [DOI] [PubMed] [Google Scholar]
- 16. Motiani R. K., Hyzinski-García M. C., Zhang X., Henkel M. M., Abdullaev I. F., Kuo Y. H., Matrougui K., Mongin A. A., Trebak M. (2013) STIM1 and Orai1 mediate CRAC channel activity and are essential for human glioblastoma invasion. Pflugers Arch. 465, 1249–1260 [DOI] [PMC free article] [PubMed] [Google Scholar]
- 17. Bell N., Hann V., Redfern C. P., Cheek T. R. (2013) Store-operated Ca2+ entry in proliferating and retinoic acid-differentiated N- and S-type neuroblastoma cells. Biochim. Biophys. Acta 1833, 643–651 [DOI] [PMC free article] [PubMed] [Google Scholar]
- 18. Motiani R. K., Abdullaev I. F., Trebak M. (2010) A novel native store-operated calcium channel encoded by Orai3: selective requirement of Orai3 versus Orai1 in estrogen receptor-positive versus estrogen receptor-negative breast cancer cells. J. Biol. Chem. 285, 19173–19183 [DOI] [PMC free article] [PubMed] [Google Scholar]
- 19. Ay A. S., Benzerdjerb N., Sevestre H., Ahidouch A., Ouadid-Ahidouch H. (2013) Orai3 constitutes a native store-operated calcium entry that regulates non-small cell lung adenocarcinoma cell proliferation. PLoS One 8, e72889. [DOI] [PMC free article] [PubMed] [Google Scholar]
- 20. Chen Y. F., Chiu W. T., Chen Y. T., Lin P. Y., Huang H. J., Chou C. Y., Chang H. C., Tang M. J., Shen M. R. (2011) Calcium store sensor stromal-interaction molecule 1-dependent signaling plays an important role in cervical cancer growth, migration, and angiogenesis. Proc. Natl. Acad. Sci. U.S.A. 108, 15225–15230 [DOI] [PMC free article] [PubMed] [Google Scholar]
- 21. Yoshida J., Iwabuchi K., Matsui T., Ishibashi T., Masuoka T., Nishio M. (2012) Knockdown of stromal interaction molecule 1 (STIM1) suppresses store-operated calcium entry, cell proliferation and tumorigenicity in human epidermoid carcinoma A431 cells. Biochem. Pharmacol. 84, 1592–1603 [DOI] [PubMed] [Google Scholar]
- 22. Aytes A., Molleví D. G., Martinez-Iniesta M., Nadal M., Vidal A., Morales A., Salazar R., Capellà G., Villanueva A. (2012) Stromal interaction molecule 2 (STIM2) is frequently overexpressed in colorectal tumors and confers a tumor cell growth suppressor phenotype. Mol. Carcinog. 51, 746–753 [DOI] [PubMed] [Google Scholar]
- 23. Ruano Y., Mollejo M., Ribalta T., Fiaño C., Camacho F. I., Gómez E., de Lope A. R., Hernández-Moneo J. L., Martínez P., Meléndez B. (2006) Identification of novel candidate target genes in amplicons of Glioblastoma multiforme tumors detected by expression and CGH microarray profiling. Mol. Cancer 5, 39. [DOI] [PMC free article] [PubMed] [Google Scholar]
- 24. Moyer M. P., Manzano L. A., Merriman R. L., Stauffer J. S., Tanzer L. R. (1996) NCM460, a normal human colon mucosal epithelial cell line. In Vitro Cell Dev. Biol. Anim. 32, 315–317 [DOI] [PubMed] [Google Scholar]
- 25. Núñez L., Valero R. A., Senovilla L., Sanz-Blasco S., García-Sancho J., Villalobos C. (2006) Cell proliferation depends on mitochondrial Ca2+ uptake: inhibition by salicylate. J. Physiol. 571, 57–73 [DOI] [PMC free article] [PubMed] [Google Scholar]
- 26. Takahashi Y., Murakami M., Watanabe H., Hasegawa H., Ohba T., Munehisa Y., Nobori K., Ono K., Iijima T., Ito H. (2007) Essential role of the N terminus of murine Orai1 in store-operated Ca2+ entry. Biochem. Biophys. Res. Commun. 356, 45–52 [DOI] [PubMed] [Google Scholar]
- 27. Wang X. T., Nagaba Y., Cross H. S., Wrba F., Zhang L., Guggino S. E. (2000) The mRNA of L-type calcium channel elevated in colon cancer: protein distribution in normal and cancerous colon. Am. J. Pathol. 157, 1549–1562 [DOI] [PMC free article] [PubMed] [Google Scholar]
- 28. Ye J., Coulouris G., Zaretskaya I., Cutcutache I., Rozen S., Madden T. L. (2012) Primer-BLAST: a tool to design target-specific primers for polymerase chain reaction. BMC Bioinformatics 13, 134. [DOI] [PMC free article] [PubMed] [Google Scholar]
- 29. Valero R. A., Senovilla L., Núñez L., Villalobos C. (2008) The role of mitochondrial potential in control of calcium signals involved in cell proliferation. Cell Calcium 44, 259–269 [DOI] [PubMed] [Google Scholar]
- 30. Chen Y. F., Chen Y. T., Chiu W. T., Shen M. R. (2013) Remodeling of calcium signaling in tumor progression. J. Biomed. Sci. 20, 23. [DOI] [PMC free article] [PubMed] [Google Scholar]
- 31. Hoth M., Penner R. (1992) Depletion of intracellular calcium stores activates a calcium current in mast cells. Nature 355, 353–356 [DOI] [PubMed] [Google Scholar]
- 32. Lis A., Peinelt C., Beck A., Parvez S., Monteilh-Zoller M., Fleig A., Penner R. (2007) CRACM1, CRACM2, and CRACM3 are store-operated Ca2+ channels with distinct functional properties. Curr. Biol. 17, 794–800 [DOI] [PMC free article] [PubMed] [Google Scholar]
- 33. Saul S., Stanisz H., Backes C. S., Schwarz E. C., Hoth M. (2013) How ORAI and TRP channels interfere with each other: Interaction models and examples from the immune system and the skin. Eur. J. Pharmacol. 10.1016/j.ejphar.2013.10.071 [DOI] [PubMed] [Google Scholar]
- 34. Soboloff J., Spassova M. A., Hewavitharana T., He L. P., Xu W., Johnstone L. S., Dziadek M. A., Gill D. L. (2006) STIM2 is an inhibitor of STIM1-mediated store-operated Ca2+ entry. Curr. Biol. 16, 1465–1470 [DOI] [PubMed] [Google Scholar]
- 35. Brandman O., Liou J., Park W. S., Meyer T. (2007) STIM2 is a feedback regulator that stabilizes basal cytosolic and endoplasmic reticulum Ca2+ levels. Cell 131, 1327–1339 [DOI] [PMC free article] [PubMed] [Google Scholar]
- 36. Motiani R. K., Zhang X., Harmon K. E., Keller R. S., Matrougui K., Bennett J. A., Trebak M. (2013) Orai3 is an estrogen receptor α-regulated Ca2+ channel that promotes tumorigenesis. FASEB J. 27, 63–75 [DOI] [PMC free article] [PubMed] [Google Scholar]
- 37. Alcarraz-Vizán G., Sánchez-Tena S., Moyer M. P., Cascante M. (2014) Validation of NCM460 cell model as control in antitumor strategies targeting colon adenocarcinoma metabolic reprogramming: trichostatin A as a case study. Biochim. Biophys. Acta 1840, 1634–1639 [DOI] [PubMed] [Google Scholar]
- 38. Smaili S. S., Pereira G. J., Costa M. M., Rocha K. K., Rodrigues L., do Carmo L. G., Hirata H., Hsu Y. T. (2013) The role of calcium stores in apoptosis and autophagy. Curr. Mol. Med. 13, 252–265 [DOI] [PubMed] [Google Scholar]
- 39. Cheng K. T., Liu X., Ong H. L., Swaim W., Ambudkar I. S. (2011) Local Ca2+ entry via Orai1 regulates plasma membrane recruitment of TRPC1 and controls cytosolic Ca2+ signals required for specific cell functions. PLoS Biol. 9, e1001025. [DOI] [PMC free article] [PubMed] [Google Scholar]
- 40. Gusev K., Glouchankova L., Zubov A., Kaznacheyeva E., Wang Z., Bezprozvanny I., Mozhayeva G. N. (2003) The store-operated calcium entry pathways in human carcinoma A431 cells: functional properties and activation mechanisms. J. Gen. Physiol. 122, 81–94 [DOI] [PMC free article] [PubMed] [Google Scholar]
- 41. Skopin A., Shalygin A., Vigont V., Zimina O., Glushankova L., Mozhayeva G. N., Kaznacheyeva E. (2013) TRPC1 protein forms only one type of native store-operated channels in HEK293 cells. Biochimie 95, 347–353 [DOI] [PubMed] [Google Scholar]
- 42. DeHaven W. I., Smyth J. T., Boyles R. R., Putney J. W., Jr. (2007) Calcium inhibition and calcium potentiation of Orai1, Orai2, and Orai3 calcium release-activated calcium channels. J. Biol. Chem. 282, 17548–17556 [DOI] [PubMed] [Google Scholar]
- 43. Parekh A. B., Putney J. W., Jr. (2005) Store-operated calcium channels. Physiol. Rev. 85, 757–810 [DOI] [PubMed] [Google Scholar]
- 44. Zhang S. L., Kozak J. A., Jiang W., Yeromin A. V., Chen J., Yu Y., Penna A., Shen W., Chi V., Cahalan M. D. (2008) Store-dependent and -independent modes regulating Ca2+ release-activated Ca2+ channel activity of human Orai1 and Orai3. J. Biol. Chem. 283, 17662–17671 [DOI] [PMC free article] [PubMed] [Google Scholar]
- 45. Hoth M., Fasolato C., Penner R. (1993) Ion channels and calcium signaling in mast cells. Ann. N.Y. Acad. Sci. 707, 198–209 [DOI] [PubMed] [Google Scholar]
- 46. Schindl R., Frischauf I., Bergsmann J., Muik M., Derler I., Lackner B., Groschner K., Romanin C. (2009) Plasticity in Ca2+ selectivity of Orai1/Orai3 heteromeric channel. Proc. Natl. Acad. Sci. U.S.A. 106, 19623–19628 [DOI] [PMC free article] [PubMed] [Google Scholar]
- 47. Beech D. J. (2005) TRPC1: store-operated channel and more. Pflugers Arch. 451, 53–60 [DOI] [PubMed] [Google Scholar]
- 48. Nilius B. (2007) TRP channels in disease. Biochim. Biophys. Acta 1772, 805–812 [DOI] [PubMed] [Google Scholar]
- 49. Pigozzi D., Ducret T., Tajeddine N., Gala J. L., Tombal B., Gailly P. (2006) Calcium store contents control the expression of TRPC1, TRPC3, and TRPV6 proteins in LNCaP prostate cancer cell line. Cell Calcium 39, 401–415 [DOI] [PubMed] [Google Scholar]
- 50. Alicia S., Angélica Z., Carlos S., Alfonso S., Vaca L. (2008) STIM1 converts TRPC1 from a receptor-operated to a store-operated channel: moving TRPC1 in and out of lipid rafts. Cell Calcium 44, 479–491 [DOI] [PubMed] [Google Scholar]
- 51. Aydar E., Yeo S., Djamgoz M., Palmer C. (2009) Abnormal expression, localization and interaction of canonical transient receptor potential ion channels in human breast cancer cell lines and tissues: a potential target for breast cancer diagnosis and therapy. Cancer Cell Int. 9, 23. [DOI] [PMC free article] [PubMed] [Google Scholar]
- 52. Ding X., He Z., Zhou K., Cheng J., Yao H., Lu D., Cai R., Jin Y., Dong B., Xu Y., Wang Y. (2010) Essential role of TRPC6 channels in G2/M phase transition and development of human glioma. J. Natl. Cancer Inst. 102, 1052–1068 [DOI] [PubMed] [Google Scholar]
- 53. Jiang H. N., Zeng B., Zhang Y., Daskoulidou N., Fan H., Qu J. M., Xu S. Z. (2013) Involvement of TRPC channels in lung cancer cell differentiation and the correlation analysis in human non-small cell lung cancer. PLoS One 8, e67637. [DOI] [PMC free article] [PubMed] [Google Scholar]
- 54. Gees M., Colsoul B., Nilius B. (2010) The role of transient receptor potential cation channels in Ca2+ signaling. Cold Spring Harbor Perspect. Biol. 2, a003962. [DOI] [PMC free article] [PubMed] [Google Scholar]
- 55. Madsen C. P., Klausen T. K., Fabian A., Hansen B. J., Pedersen S. F., Hoffmann E. K. (2012) On the role of TRPC1 in control of Ca2+ influx, cell volume, and cell cycle. Am. J. Physiol. Cell Physiol. 303, C625–C634 [DOI] [PubMed] [Google Scholar]
- 56. Golovina V. A., Platoshyn O., Bailey C. L., Wang J., Limsuwan A., Sweeney M., Rubin L. J., Yuan J. X. (2001) Upregulated TRP and enhanced capacitative Ca2+ entry in human pulmonary artery myocytes during proliferation. Am. J. Physiol. Heart. Circ. Physiol. 280, H746–H755 [DOI] [PubMed] [Google Scholar]
- 57. Rao J. N., Rathor N., Zhuang R., Zou T., Liu L., Xiao L., Turner D. J., Wang J. Y. (2012) Polyamines regulate intestinal epithelial restitution through TRPC1-mediated Ca2+ signaling by differentially modulating STIM1 and STIM2. Am. J. Physiol. Cell Physiol. 303, C308–C317 [DOI] [PMC free article] [PubMed] [Google Scholar]
- 58. Pani B., Cornatzer E., Cornatzer W., Shin D. M., Pittelkow M. R., Hovnanian A., Ambudkar I. S., Singh B. B. (2006) Up-regulation of transient receptor potential canonical 1 (TRPC1) following sarco(endo) plasmic reticulum Ca2+-ATPase 2 gene silencing promotes cell survival: a potential role for TRPC1 in Darier disease. Mol. Biol. Cell 17, 4446–4458 [DOI] [PMC free article] [PubMed] [Google Scholar]
- 59. Ashida S., Orloff M. S., Bebek G., Zhang L., Zheng P., Peehl D. M., Eng C. (2012) Integrated analysis reveals critical genomic regions in prostate tumor microenvironment associated with clinicopathologic phenotypes. Clin. Cancer Res. 18, 1578–1587 [DOI] [PubMed] [Google Scholar]
- 60. McAndrew D., Grice D. M., Peters A. A., Davis F. M., Stewart T., Rice M., Smart C. E., Brown M. A., Kenny P. A., Roberts-Thomson S. J., Monteith G. R. (2011) Orai1-mediated calcium influx in lactation and breast cancer. Mol. Cancer Ther. 10, 448–460 [DOI] [PubMed] [Google Scholar]