

Abstract
The universally conserved translation elongation factor EF-Tu delivers aminoacyl(aa)-tRNA in the form of an aa-tRNA·EF-Tu·GTP ternary complex (TC) to the ribosome where it binds to the cognate mRNA codon within the ribosomal A-site, leading to formation of a pretranslocation (PRE) complex. Here we describe preparation of QSY9 and Cy5 derivatives of the variant E348C-EF-Tu that are functional in translation elongation. Together with fluorophore derivatives of aa-tRNA and of ribosomal protein L11, located within the GTPase associated center (GAC), these labeled EF-Tus allow development of two new FRET assays that permit the dynamics of distance changes between EF-Tu and both L11 (Tu-L11 assay) and aa-tRNA (Tu-tRNA assay) to be determined during the decoding process. We use these assays to examine: (i) the relative rates of EF-Tu movement away from the GAC and from aa-tRNA during decoding, (ii) the effects of the misreading-inducing antibiotics streptomycin and paromomycin on tRNA selection at the A-site, and (iii) how strengthening the binding of aa-tRNA to EF-Tu affects the rate of EF-Tu movement away from L11 on the ribosome. These FRET assays have the potential to be adapted for high throughput screening of ribosomal antibiotics.
EF-Tu is, along with EF-G, one of two G-protein factors that are required for controlling the speed and accuracy with which the bacterial 70S ribosome, formed by the association of 30S and 50S subunits, catalyzes polypeptide elongation.1 During an elongation cycle, a tRNA binds sequentially to several sites in the 70S ribosome.2 In the first elongation cycle, EF-Tu accelerates the binding of a cognate aminoacyl(aa)-tRNA, in the form of an aa-tRNA·EF-Tu·GTP ternary complex (TC), to the ribosomal A/T-site of a 70S initiation complex (70SIC), which contains initiator fMet-tRNAfMet bound in the ribosomal P-site. TC binding to the ribosome brings EF-Tu into proximity with ribosomal protein L11 within the GTPase associated center (GAC) of the 50S subunit, to which all ribosomal G-proteins bind.3 Base pairing between the anticodon loop of cognate aa-tRNA and the three-nucleotide codon in mRNA at the decoding center of the 30S subunit leads to changes in ribosome conformation and activation of the EF-Tu GTPase activity. GTP hydrolysis is followed by Pi release, and movement of aa-tRNA from the A/T to the A/A site, a process also known as “accommodation” into the A-site. Accommodation is rapidly followed by peptide bond formation within the peptidyl transferase center of the 50S subunit between fMet-tRNAfMet and aa-tRNA, and EF-Tu·GDP release from the ribosome, resulting in pretranslocation (PRE) complex formation. Structural studies show a dramatic conformational difference between the GTP- and GDP-bound forms of EF-Tu.1,4,5 The antibiotic kirromycin inhibits elongation by “freezing” EF-Tu·GDP on the ribosome in a GTP-like conformation.6,7
Selection of the cognate isoacceptor tRNA takes place in two steps, preceding and following GTP hydrolysis. During initial selection, all noncognate and the major fraction of near-cognate TCs dissociate. After GTP hydrolysis, almost all remaining near-cognate tRNAs are rejected in the so-called proofreading step; a small fraction goes forward and participates in peptide bond formation.8−10 The selectivity of the decoding process for cognate tRNA is reduced by aminoglycoside antibiotics.11,12
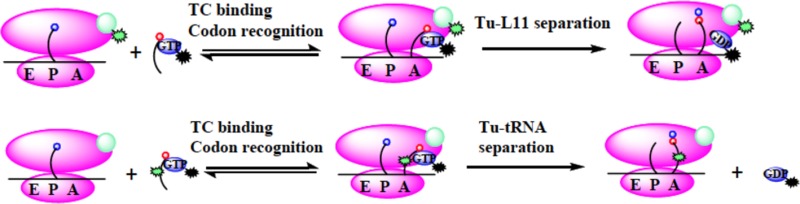
Although the movement of tRNA through the ribosome during decoding has been extensively studied by kinetic, structural, and modeling studies,6,13−21 the availability of tools allowing description of the dynamic properties of EF-Tu as it interacts with both the ribosome and aa-tRNA has been limited.8,13 Recently, we presented results, most in preliminary form,20 that an E348C-EF-Tu variant labeled with either the fluorescence quencher QSY9 or the fluorophore Cy5 could be used to develop real-time fluorescence resonance energy transfer (FRET) assays that monitor both EF-Tu contact with Cy3-labeled aa-tRNA (Tu-tRNA assay)20,22 and proximity to Cy3-labeled L11 (Tu-L11 assay)20 (Figure 1).
Figure 1.
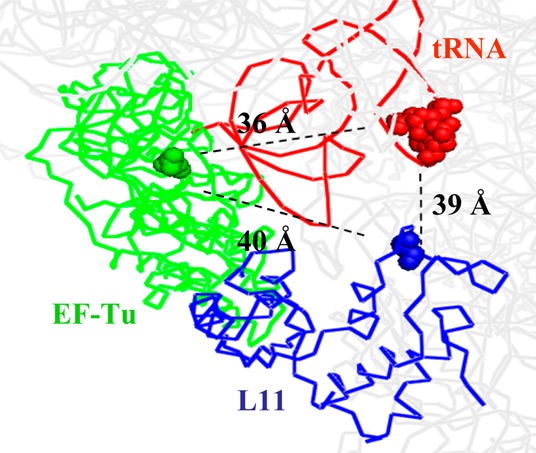
Distances between residue numbers 348 (Cα, EF-Tu), 87 (Cα, L11), and 16 (N-1, aminoacyl-tRNA) in a kirromycin- and paromomycin-stabilized ribosome complex with Thr-tRNAThr bound in the A/T site. Protein Data Bank accession codes are 2WRN, 2WRO, 2WRQ, and 2WRR.
These FRET assays, along with a previously described assay measuring aa-tRNA movement from the A/T-site to the A-site,23 permit us to measure the rates of several key substeps of decoding, including (i) initial TC interaction with the A/T site, (ii) movement of EF-Tu·GDP away from its initial binding site during accommodation, and (iii) release of EF-Tu·GDP from aa-tRNA. Here, we describe the application of these FRET assays in probing several interesting aspects of the decoding process, including the formation of stalled complexes, aminoglycoside antibiotic effects on tRNA misreading, and how decoding is affected by altering the strength of EF-Tu interaction with aa-tRNA. The results obtained provide new insights, reinforce previous observations, and demonstrate the feasibility of using the FRET assays in high throughput screening of antibiotics.
Results and Discussion
Nomenclature
The labeled protein synthesis components employed in this work are named and described in Table 1. QSY9 is an efficient quencher of Cy3 fluorescence.
Table 1. Labeled Protein Synthesis Components.
| labeled component | description |
|---|---|
| EF-TuQSY9 | E348C variant of wt-EF-Tu labeled with QSY9 |
| EF-TuCy3 | E348C variant of wt-EF-Tu labeled with Cy3 |
| EF-TuAV-Cy5 | C137A/C255 V/E348C triple variant of EF-Tu labeled with Cy5 |
| wt-EF-TuQSY9 | wt-EF-Tu labeled with QSY9 |
| Phe-tRNAPhe(Cy3) | Yeast Phe-tRNAPhe labeled at positions 16/17 with Cy3 |
| fMet-tRNAfMet(prf) | E. coli fMet-tRNAfMet labeled at position 20 with proflavin |
| TCQSY9 | TC containing EF-TuQSY9·GTP and Phe-tRNAPhe |
| TC QSY9/Cy3 | TC containing EF-TuQSY9·GTP and Phe-tRNAPhe(Cy3) |
| TCAV-Cy5 | TC containing EF-TuAV-Cy5·GTP and Phe-tRNAPhe |
| TCAV-Cy5/Cy3 | TC containing EF-TuAV-Cy5·GTP and Phe-tRNAPhe(Cy3) |
| TCCy3 | TC containing EF-Tu·GTP and Phe-tRNAPhe(Cy3) |
| 70SICCy3 | 70S initiation complex made with ribosomes containing S87C-L11 labeled with Cy3 |
Probe-Labeling of E348C-EF-Tu Variants
We used two E348C EF-Tu variants in this work. The first, E348C-EF-Tu, retains all three endogenous Cys residues (Cys81, Cys137, and Cys255) and is labeled with either QSY9-maleimide or Cy3-maleimide, yielding the labeled products denoted EF-TuQSY9 and EF-TuCy3, respectively. EF-TuQSY9 has 1.5 QSY9 residues/EF-Tu. Wild-type EF-Tu, labeled under identical conditions and denoted wt-EF-TuQSY9, has 0.5 QSY9/EF-Tu (Supporting Information Table 1). Similar results are obtained with Cy3 labeling of E348C-EF-Tu (Supporting Information Table 1). We conclude that Cys348 is much more reactive toward maleimides than any of the endogenous Cys residues, in line with its greater solvent accessibility as determined from the solved EF-Tu structure (PDB 1DG1), and that it can be labeled essentially to completion under conditions where the other Cys residues are labeled to only limited extents, approximately 20% on average. Furthermore, such background labeling is inconsequential for subsequent EF-Tu:L11 or EF-Tu:tRNA FRET measurements (Figure 2b and Supporting Information Figure S1c).
Figure 2.

Fluorescence assays of TC interaction with 70SIC. (a–d) Labeled TC interaction with 70SICCy3 (Tu-L11 assay). (a) Cartoon showing placement of labels. Cy3 fluorescence intensity decreases on TCQSY9 binding to the A/T-site and increases on accommodation of tRNA into the A-site and dipeptide formation. (b) Changes of 70SICCy3 fluorescence on rapid mixing with TCQSY9 (black); in the presence of kirromycin (precombined with 70SICCy3, red); with GDPNP in place of GTP (green). Very little change in fluorescence is seen with wt-EF-Tu labeled at a background level with QSY9 (light blue) or when mRNA is omitted (dark blue). Final concentrations: 70SICCy3, 0.1 μM; TCs, 0.4 μM; kirromycin, 100 μM; GDPNP, 250 μM. (c and d) Changes of Cy3 and Cy5 fluorescence intensities, respectively, on rapid mixing of 70SICCy3 with TCAV-Cy5 (black); in the presence of kirromycin (precombined with 70SICCy3, red); with GDPNP in place of GTP (green). Final concentrations: 70SICCy3, 0.1 μM; TCs, 0.4 μM; kirromycin, 100 μM; GDPNP, 1 mM. (e–g) Interaction of double–labeled TC with 70SIC (Tu-tRNA assay). (e) Cartoon showing placement of labels. Cy3 fluorescence intensity increase occurs on EF-Tu dissociation from the ribosome. (f and g) TCQSY9/Cy3 [(f) 0.1 μM] or TCAV-Cy5/Cy3 [(g) 0.1 μM] was rapidly mixed with 70SIC (0.4 μM) and Cy3 fluorescence was monitored (black); in the presence of kirromycin (precombined with 70SIC, red); with GDPNP in place of GTP (green). When GDPNP replaced GTP, adding kirromycin had no effect (data not shown). Final concentrations: kirromycin, 100 μM; GDPNP, 250 μM for TCQSY9/Cy3 and 1 mM for TCAV-Cy5/Cy3, respectively.
The second variant, C137A/C255V/E348C-EF-Tu, in which the two nonconserved Cys residues are replaced, is labeled with Cy5-maleimide, yielding the labeled product denoted EF-TuAV-Cy5, which has 0.9 Cy5/EF-Tu, as compared with 0.2 Cy5/EF-Tu for wt-EF-Tu (Supporting Information Table 1), consistent with earlier results.22
Labeled E348C-EF-Tu Variants Are Functional in TC Formation and on the Ribosome
EF-TuQSY9 and EF-TuAV-Cy5 form tight TCs with Phe-tRNAPhe, denoted TCQSY9 and TCAV-Cy5, respectively, which are comparable to those obtained with unlabeled wild-type EF-Tu, as measured by protection of Phe-tRNAPhe from either RNase A digestion (TCQSY9, Supporting Information Figure S1a) or from spontaneous deacylation (TCAV-Cy5, Supporting Information Figure S1b). This is in contrast to the weak binding observed in these assays with the unlabeled triple variant C81S/C137A/C255V-EF-Tu (EF-TuSAV), a result that is consistent with a previous study of the functional role of Cys81.24 A more recent study claimed that aa-tRNA binding to EF-Tu was retained when Cys81 is replaced by Ala.25 However, in this latter work, concentrations of both aa-tRNA and EF-Tu were in great excess over the dissociation constant, so that even comparatively large decreases in affinity would not have been detected.
EF-TuQSY9 also shows comparable activity to wt-EF-Tu in (1) poly(U)-directed poly(Phe) synthesis (76 ± 5% of wt) and (2) fMetPhe-tRNAPhe formation on rapid mixing of TCQSY9 with 70SIC. Here, the apparent rate constant obtained, 4.5 s–1 (25 °C), is similar to values reported earlier using unlabeled TC and 70SIC.8,23
FRET within TCQSY9/Cy3 and TCAV-Cy5/Cy3
Phe-tRNAPhe(Cy3) fluorescence is decreased to similar extents, approximately 66% within purified TC formed from Phe-tRNAPhe(Cy3), GTP, and EF-TuQSY9, denoted TCQSY9/Cy3 (Supporting Information Figure S2a), and approximately 76% within unpurified TC formed from Phe-tRNAPhe(Cy3), GTP, and EF-TuAV-Cy5, denoted TCAV-Cy5/Cy3 (Supporting Information Figure S2b), with both values determined after corrections, as needed, for tRNA charging stoichiometry, EF-Tu labeling stoichiometry, and partial Phe-tRNAPhe(Cy3) dissociation from TC in dilute solution (see Supporting Information). The latter value (76%) is essentially identical to the FRET efficiency (74%) obtained for EF-TuAV-Cy5 interaction with a Cy3 derivative of Phe-tRNAPhe labeled at position 47.22 The similarity in the FRET efficiency values for TCQSY9/Cy3 and TCAV-Cy5/Cy3 is expected based on the similar Förster Ro values for the pairs Cy3/QSY9 (55 Å)26 and Cy3/Cy5 (55–60 Å).27 Fluorescence quenching within TCQSY9/Cy3 is due solely to the QSY9 bound at position 348, since added wt-EF-TuQSY9, which lacks QSY9 bound at EF-Tu position 348 (Supporting Information Table 1), has no effect on Phe-tRNAPhe(Cy3) fluorescence (Supporting Information Figure S1c). Measuring the rate of Phe-tRNAPhe(Cy3) quenching as a function of EF-TuQSY9 concentration allowed estimation of a rate constant for TC formation at 25 °C, kon, of 1.3 ± 0.1 μM–1 s–1 (Supporting Information Figure S2c). This is consistent with a previous estimate for kon for unmodified EF-Tu of 0.11 μM–1 s–1, measured at 4 °C,28 assuming about a 10-fold increase in rate for a 21° increase in temperature.
Two Stopped-Flow FRET Assays (Tu-L11; Tu-tRNA) of PRE Complex Formation
The Tu-L11 assay (Figure 2a) involves rapid mixing of 70SIC containing Cy3-labeled L11, denoted 70SICCy3, with either TCQSY9 (Figure 2b) or TCAV-Cy5 (Figure 2c and d). In each case, such mixing results in a biphasic change in Cy3 fluorescence, with an initial decrease corresponding to TC binding to the ribosome that places EF-Tu position 348 in proximity to L11 position 87, followed by a restoration of fluorescence intensity as these two positions move apart (Figure 2b and c), with EF-Tu still bound to the ribosome or fully dissociated from it. For TCAV-Cy5 the expected reciprocal changes are seen in Cy5 fluorescence (Figure 2d). These changes are completely dependent on the presence of mRNA, with barely any change observed when mRNA is omitted (Figure 2b, blue curve). Further, addition of wt-TCQSY9 has virtually no effect on Cy3 fluorescence (Figure 2b, cyan curve), showing that the observed effects of TCQSY9 on Cy3-L11 fluorescence are due solely to the QSY9 bound at EF-Tu position 348, paralleling the results found with Phe-tRNAPhe(Cy3) (Supporting Information Figure S1c).
The Tu-tRNA assay (Figure 2e) involves rapid mixing of unlabeled 70SIC with either TCQSY9/Cy3 or TCAV-Cy5/Cy3. In each case, an increase in Cy3 fluorescence resulted (Figure 2f and g), ultimately leading to a complete loss of FRET interaction between labeled tRNA and labeled EF-Tu (Supporting Information Figure S3). This corresponds most probably to EF-Tu·GDP release from the ribosome, but, as above, could also reflect EF-Tu bound to the ribosome in a position far removed from tRNA.
The curves obtained with both FRET assays were fit to eq 1, giving the k1app and k2app values listed in Table 2. These values indicate that, following cognate TC binding to the 70SIC and prior to the release of EF-Tu from the ribosome as EF-Tu.GDP, EF-Tu moves away from the GAC, as measured by k2app in the Tu-L11 assay, somewhat faster (1.5–3-fold) than EF-Tu moves away from aa-tRNA, as measured by k1app in the Tu-tRNA assay. Alternatively, the relatively small difference in these two apparent rate constants could be a consequence of using different fluorescent components in the two assays. In either case, the similarity in the values is consistent with a branched mechanism for the two movements (Figure 3, pathways 1 and 2), a point we return to below.
Table 2. Kinetic Parameters for 70SIC Interaction with TCa.
| assayb | TC | conditionsc | k1app, s–1 | k2app, s–1 | A1/A2d |
|---|---|---|---|---|---|
| Tu-L11 | TCQSY9 | standard | 26 ± 4 | 6.2 ± 0.3 | –1.0 ± 0.1 |
| TCAV-Cy5 | 19 ± 1 | 3.4 ± 0.3 | –1.0 ± 0.1 | ||
| TCAV-Cy5,e | 16 ± 1 | 3.7 ± 0.1 | –1.0 ± 0.1 | ||
| Tu-tRNA | TCQSY9/Cy3 | 2.1 ± 0.3 | 0.31 ± 0.05 | 1.5 ± 0.4 | |
| TC AV-Cy5/Cy3 | 2.1 | 0.33 | 1.3 | ||
| Stalled Ribosomes | |||||
| Tu-L11 | TCQSY9 | +kirromycin | 35 ± 1 | 3.0 ± 0.7 | 1.1 ± 0.4 |
| TCAV-Cy5 | 25 ± 6 | 2.5 ± 0.4 | 0.7 ± 0.4 | ||
| TCAV-Cy5,e | 20 ± 5 | 2.5 ± 0.1 | 0.7 ± 0.3 | ||
| Tu-tRNA | TCQSY9/Cy3 | 5.1 ± 0.8 | 1.1 ± 0.2 | 0.7 ± 0.3 | |
| TC AV-Cy5/Cy3,e | 2.3 | 0.58 | 0.6 | ||
| Tu-L11 | TCQSY9 | GDPNP replaces GTP | 5.1 ± 0.2 | ||
| TCAV-Cy5 | 3.3 ± 0.2 | ||||
| TCAV-Cy5,e | 3.8 ± 0.3 | ||||
| Antibiotic Effects on tRNA Misreadingc | |||||
| Tu-L11 | TCQSY9 | near-cog | 24 ± 6 | <0.07 | |
| Tu-tRNA | TCQSY9/Cy3 | 0.74 ± 0.02 | 0.04 ± 0.01 | 0.19 ± 0.01 | |
| Tu-L11 | TCQSY9 | +STR | 22 ± 2 | 3.0 ± 0.2 | –1.4 ± 0.1 |
| Tu-tRNA | TCQSY9/Cy3 | 0.94 ± 0.04 | 0.13 ± 0.02 | 0.4 ± 0.1 | |
| Tu-L11 | TCQSY9 | +PAR | 17 ± 3 | 2.5 ± 0.1 | –1.7 ± 0.4 |
| Tu-tRNA | TCQSY9/Cy3 | 1.4 ± 0.1 | 0.22 ± 0.01 | 1.2 ± 0.2 | |
| Tu-L11 | TCQSY9 | near-cog+STR | 32 ± 1 | 1.0 ± 0.3 | –1.5 ± 0.5 |
| Tu-tRNA | TCQSY9/Cy3 | 1.1 ± 0.3 | 0.15 ± 0.04 | 0.3 ± 0.2 | |
| Tu-L11 | TCQSY9 | near-cog+PAR | 23 ± 2 | 1.6 ± 0.4 | –2.2 ± 0.8 |
| Tu-tRNA | TCQSY9/Cy3 | 0.89 ± 0.10 | 0.15 ± 0.06 | 0.5 ± 0.1 | |
Values shown are average ± average deviation of 2–4 independent determinations. Abbreviations: STR, streptomycin; PAR, paromomycin; near-cog, near-cognate.
Tu-L11 reactions were carried out using 0.1 μM 70SIC and 0.4 μM TC; Tu-tRNA reactions were carried out using 0.4 μM 70SIC and 0.1 μM TC. Unless otherwise indicated, reactions were monitored by changes in Cy3 fluorescence.
Standard conditions included the use of cognate codon and EF-Tu.GTP, and the absence of added antibiotic. Variations included substituting GDPNP for GTP or near-cognate codon for cognate codon, and/or adding an antibiotic at a final concentration of 100 μM.
Ratio of the apparent amplitudes in eq 1.
Monitored by changes in Cy5 fluorescence.
Figure 3.
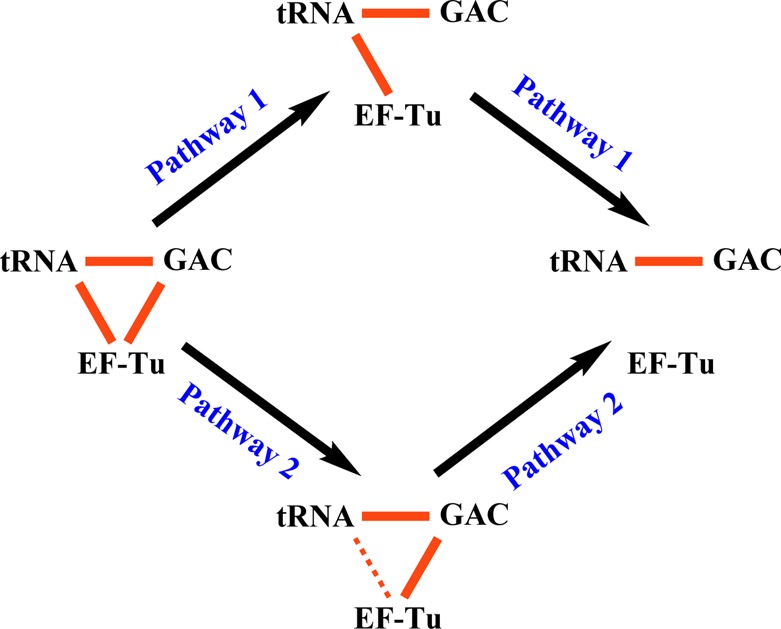
Branched mechanism for EF-Tu movement away from both the GAC (L11) and aa-tRNA following GTP hydrolysis that culminates in EF-Tu dissociation from the ribosome. Solid red lines indicate high FRET efficiencies between aa-tRNA and L1119 and between EF-Tu and both aa-tRNA and L11 (this work). The latter two are lost during PRE complex formation. Pathway 1 is slightly preferred for cognate codon. Kirromycin blocks the first step of pathway 1 and the second step of pathway 2, leading, in the latter case, to a partial distancing of EF-Tu from aa-tRNA, and lower FRET, as indicated by the dotted line.
Formation of Stalled Complexes
Adding kirromycin or replacing GTP with the nonhydrolyzable analogue GDPNP results, in both cases, in formation of a stalled complex, in which EF-Tu is held on the ribosome.29,30 As seen using the Tu-L11 assay, these stalled complexes form at different rates, but display similar (Figure 2b) or essentially identical (Figures 2c and d) high FRET efficiencies, as measured with TCQSY9 or TCAV-Cy5, respectively. The FRET efficiency with TCAV-Cy5 is equal to 0.55, as determined from the spectral data presented in Supporting Information Figure S4, corresponding to a Cy3-Cy5 distance of 58 Å. This is in reasonable accord with the predicted Cα: Cα distance of 40 Å (Figure 1) and the added distance to be expected between the two fluorophores attached via tethers to these positions. In contrast, the stalled complexes have quite different EF-Tu:tRNA FRET efficiencies (Figure 2f and g), with GDPNP completely blocking the increase in Cy3 fluorescence in the Tu-tRNA assay, whereas added kirromycin permits a 50–60% increase, corresponding to an ∼13–18 Å increase in the tRNA:EF-Tu distance. These results indicate that GDPNP fully blocks both pathways described in Figure 3, whereas kirromycin only fully blocks pathway 1, permitting partial separation of EF-Tu from aminoacyl-tRNA via the first step of pathway 2, while maintaining the EF-Tu:L11 distance giving rise to high FRET efficiency.
The results presented in Figure 2 show an apparent inconsistency with high resolution X-ray structures of kirromycin- and GDPCP-stalled ribosomes containing bound EF-Tu, which display no significant differences in the distance of EF-Tu (position 348) to either L11 (position 87) or aa-tRNA (D loop).6,7,31 We speculate that this apparent inconsistency arises from the conformational mobility of the kirromycin-stalled complex, as has been demonstrated in cryoelectronmicroscopy studies.16,21 These studies have identified 4–6 structurally distinct kirromycin-stalled complexes, and revealed especially high disorder in the D-loop region of the aa-tRNA, which is the site of Cy3 labeling in our experiments. Such conformational mobility will give rise to a measured EF-Tu:tRNA FRET value that reflects an averaging of all the structural states present in solution. In contrast, the X-ray structure determinations were each carried out on essentially a single conformational state that was present in the crystals. Alternatively, or in addition, it is possible that there are significant structural differences between complexes stalled with GDPNP, as in the present work, and complexes stalled with GDPCP, employed in the structural studies. Such differences have been reported between ribosome complexes containing EF-G that are stalled with GDPCP or GDPNP.32,33
Antibiotic Effects on tRNA Misreading
The Tu-L11 and Tu-tRNA assays provide convenient methods for examining the selectivity of TC binding to 70SIC programmed at the decoding center with cognate (UUU) and near-cognate (CUC) codons, and the ability of the misreading-inducing aminoglycoside antibiotics streptomycin (STR) and paromomycin (PAR)11,12,34−36 to modulate such selectivity. Preliminary experiments using the noncognate CGU codon showed almost no change in Cy3 fluorescence in either assay (Figures 4a and b) and were not pursued.
Figure 4.

tRNA selectivity demonstrated by (a) TCQSY9 effects on the fluorescence of 70SICCy3 (Tu-L11 assay see Figure 2a) or (b) 70SIC effects on the fluorescence of TCQSY9/Cy3 (Tu-tRNA assay see Figure 2e). Cognate mRNA (UUU, black); near-cognate mRNA (CUC, red); near-cognate mRNA, high TC concentration (CUC, cyan); noncognate mRNA (CGU, green); without mRNA (blue). In part a, no further fluorescence changes are seen out to 3 s. Parts c and d repeat the assays shown in parts a and b, respectively, in the presence of aminoglycoside antibiotics. Cognate mRNA, no antibiotic (black); cognate mRNA, STR (green); cognate mRNA, PAR (blue); near-cognate mRNA, no antibiotic (red); near-cognate mRNA, STR (cyan); near-cognate mRNA, PAR (lavender). Final concentrations: 70SICCy3 in a, 0.1 μM; 70SIC in b, 0.4 uM; TCQSY9 in a, 0.4 μM; high concentration, 1.0 μM; TCQSY9/Cy3 in b, 0.1 μM; STR, 100 μM; PAR, 100 μM.
As measured in the Tu-L11 assay, reaction of TCQSY9 with a 70SICCy3 programmed with near-cognate CUC leads to a monophasic decrease in Cy3 fluorescence intensity, which proceeds with a rate constant similar to that found for the first phase of TCQSY9 binding to 70SICCy3 programmed with cognate UUU (Figure 4a, Table 2). The magnitude of the intensity drop is somewhat lower than in the cognate case, but it can be increased by raising the TCQSY9 concentration. However, the second phase of reaction is inhibited at least 100-fold, showing no detectable rise in Cy3 fluorescence from 0.2 to 3 s. These results indicate that near-cognate TC binding closely mirrors that of cognate TC binding to the A/T site, although with somewhat lower affinity, but that subsequent movement away from the A/T site either does not occur or is extremely slow, consistent with conclusions reached in earlier studies.34
The rise in Cy3 fluorescence in the Tu-tRNA assay using near-cognate mRNA proceeds much more rapidly than in the Tu-L11 assay, although it is slowed some 12-fold vis-à-vis cognate mRNA, as estimated from the t1/2 values in Figure 4b. Thus, for near-cognate mRNA, partial movement of aa-tRNA away from EF-Tu can take place in the absence of any movement of EF-Tu away from L11 (Figure 3, pathway 2, step 1), paralleling the results obtained with cognate-programmed ribosomes in the presence of kirromycin (Figure 2).
Added STR essentially abolishes the marked differences seen in the two assays for cognate vs near-cognate codons, by both decreasing some of the apparent rate constants for cognate codon (Tu-L11 assay, k2app; Tu-tRNA assay, k1app, k2app) and increasing the value of these same rate constants for near-cognate codon (Figure 4c and d, Table 2). PAR displays similar effects, although reaction with cognate codon remains somewhat faster. These effects on rate constants are qualitatively similar to those obtained in studies of the effects of STR and PAR on decoding specificity measured by other assays.34−36 More unexpected is the observation that each antibiotic decreases the fluorescence change within the initial complex formed on TC binding during the first phase of the Tu-L11 assay (Figure 4c). Since STR does not weaken cognate TC binding,34 this result suggests that these antibiotics, which bind to the 30S subunit, increase the average L11 to EF-Tu distance in the 50S subunit, presumably via a structural change in the 30S subunit that is propagated to the 50S subunit.37 As X-ray structures in the presence and absence of PAR show little difference in the global conformation of EF-Tu on the ribosome,7 such a distance change is more likely to arise from changes in the L11 position, which is generally not well-ordered in crystal structures.
Effects of Altering EF-Tu:aa-tRNA Affinity
Schrader et al.38 have recently presented results leading to the conclusion that the affinities of aa-tRNAs for EF-Tu are constrained to be uniform by their need to bind tightly enough to form the TC but weakly enough to rapidly release from EF-Tu during decoding. In that work, the affinity of variant tRNAVal2Bs for EF-Tu was altered by mutation of a portion of the aa-tRNA stem that binds directly to EF-Tu. Their principal finding was that, provided that sufficient EF-Tu was added to form TC, the rate of dipeptide formation with a 70SIC was similar for tRNA variants binding to EF-Tu·GTP up to 100 times more weakly than wt, but that such activity fell off very quickly for variants binding to EF-Tu more tightly than wt, despite their having rates of ribosome-dependent GTP hydrolysis similar to that of wild type.
Here, we re-examine this question at higher kinetic resolution by determining the influence of aa-tRNA affinity for EF-Tu on the timing of L11-EF-Tu distance change, as measured by the Tu-L11 assay, and on the rate of movement of aa-tRNA from the A/T site into the A/A site, as measured by changes in the fluorescence of proflavin-labeled fMet-tRNAfMet [denoted fMet-tRNAfMet(prf)], bound in the P-site of the 70SIC.23 In so doing, we compare measurements on TCs formed by wt Val-tRNAVal2B and two variants, denoted T1 and ψ, which bind to EF-Tu·GTP with much higher or slightly lower affinity compared to wt, respectively.38
We first measured TC dissociation rates. The fluorescence intensity of EF-TuCy3·GTP increases on forming a TC with each of the Val-tRNAVal2B variants. The second-order association rate constant for the wt-transcript, determined by measuring the apparent association rate constant as a function of EF-TuCy3 concentration, is 0.74 ± 0.06 μM–1 s–1 (Figure 5a, inset). Dissociation rate constants (kd) for all three variants were determined from the time dependence of the decrease in Cy3 fluorescence when the labeled complex is mixed with a large excess of unlabeled EF-Tu, under conditions where dissociation of the labeled complex is rate limiting for formation of unlabeled TC (Figure 5b), giving the relative values shown in Table 3. Similar relative values of kd were obtained for the ψ and T1 variants by Schrader et al.38 using a ribonuclease protection assay (Table 3).
Figure 5.

Effects of tRNAVal2B T-stem mutation. (a) TC formation. Increase in EF-TuCy3 (0.4 μM) fluorescence intensity on rapid mixing with either wt-Val-tRNAVal2B (red line) (0.1 μM) or its T1 variant (0.1 μM) (green line) in the presence of 0.5 mM GTP. Inset shows kapp dependence on EF-TuCy3 concentration. Wt-EF-Tu labeled to background levels showed no fluorescence change (black line). Although EF-TuCy3 had higher initial fluorescence, all traces are shown starting at the same fluorescence for ease of comparison. (b) TC dissociation. Decrease in EF-TuCy3 fluorescence intensity on rapid mixing of TCs made with the indicated Val-tRNAVal2B variants [formed by premixing of EF-TuCy3(0.4 μM) with the Val-tRNAVal2B (0.1 μM) variant in the presence of 0.5 mM GTP], with excess (8 μM) unlabeled EF-Tu. The traces shown are an average of two independent determinations. (c) Cartoon showing placement of labels. Cy3 fluorescence intensity decreases on TCQSY9 binding to the A/T-site. Accommodation of Val-tRNAVal into the A-site and dipeptide formation leads to an increase in Cy3 fluorescence and a decrease in tRNAfMet(prf) fluorescence. (d and e) Changes in Cy3 and prf fluorescence on rapid mixing of 70SICCy3 (0.1 μM) containing fMet-tRNAfMet(prf) with TCs formed by combining EF-TuQSY9·GTP (1.6 μM) with the indicated Val-tRNAVal2B variants (0.4 μM). Solid black lines are global fits to Scheme 1 using the k values shown in Table 3. (d) 0–1 s. (e) 0–20 s. Only results for the T1 variant are shown in part e, because the reactions of the wt and ψ variants are essentially complete within 1 s. All concentrations are final after rapid mixing. The more pronounced decrease in Cy3 fluorescence in the phase 1 of the L11-tRNA assay for the T1 variant as compared with the wt and ψ variants is due, at least in part, to phase 2 being so much slower than phase 1 (Table 3), leading to a transient buildup of C1.
Table 3. Rate Constants for tRNAVal2B Variants.
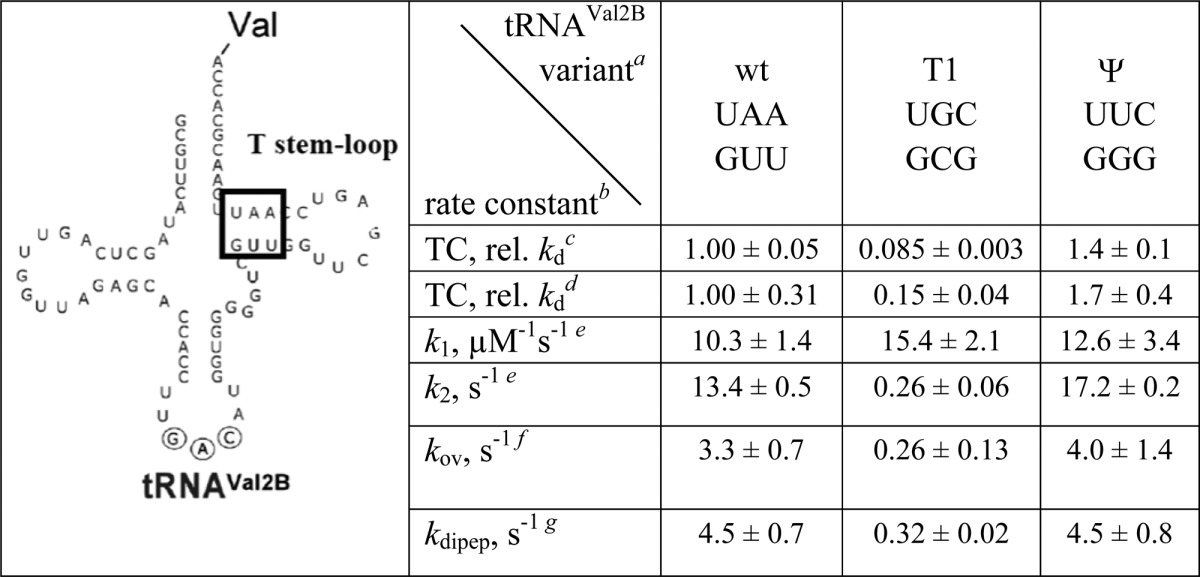
Sequences show portion of T-stem (boxed): top line, nts 65–63; bottom line, nts 49–51.
Values are from this work, measured at 25 °C, unless otherwise specified. Measurements were performed in duplicate or triplicate, with average deviations indicated.
This work. Value for wt is 0.039 s–1. The increase of ∼30-fold from the value measured at 4 °C (see below) is consistent with the high ΔH† for this reaction.36
Dissociation rate constant, 4 °C. Value for wt is 0.0013 s–1, as reported.36
Rate constants for Scheme 1, determined for reaction of TCQSY9 with 70SICCy3 containing fMet-tRNAfMet(prf). 70SIC has the cognate codon for tRNAVal2B, GUC, in the A-site.
The overall rate constant for formation
of the C2 complex ( Scheme 1) 
The rate constant for dipeptide formation, measured at 20 °C, as reported.36
We next carried out the Tu-L11 assay with a 70SICCy3 containing fMet-tRNAfMet(prf) and programmed with mRNA MVYF and the TCs formed by each of the three Val-tRNAVal2B transcripts, which allowed simultaneous monitoring of the changes in Cy3 and prf fluorescence (Figure 5c–e). Both sets of data could be globally fit to the simplified Scheme 1, in which initial second order binding of TC to form complex C1 is followed by formation of complex C2. In this second step, the movement of EF-Tu away from L11 and aa-tRNA accommodation into the A-site, measured by the increase in Cy3 fluorescence intensity and the decrease in proflavin fluorescence intensity, respectively, appear to proceed simultaneously. Thus, both assays may be monitoring the same event, aa-tRNA movement from the A/T to the A/A position.
| Scheme 1 |
Fitting the results of the Tu-L11 assay for the T1 variant measured at different TC concentrations to the phenomenological eq 1 showed that k1app and k2app were linearly dependent or lacked dependence on TC concentration, respectively (Supporting Information Figure S5), providing additional support for Scheme 1.
The microscopic rate constants k1 and k2 resulting from global fitting of the results in Figure 5d to Scheme 1 (Table 3) show that the tightened aa-tRNA binding to EF-Tu in the T1 variant has little effect on the rate of C1 formation but markedly decreases, by almost 2 orders of magnitude as compared with the wt and ψ variants, the rates of EF-Tu movement away from L11 and of tRNA movement into the A-site that accompany C2 formation. Moreover, allowing for some small differences in experimental conditions, for each of the three variants there is fairly close agreement between the overall rate constant for complex C2 formation (kov) and the rate constant for dipeptide formation (kdipep) measured by Schrader et al.38 We conclude that the decreased rate of dipeptide formation previously measured for the T1 variant38 is not an effect on the dipeptide formation step itself nor on the rate of TC binding to the ribosome, but rather reflects a specific inhibitory effect on the rate of movement of aa-tRNA from the A/T site to the A/A site, which is accompanied by movement of EF-Tu away from the GAC. At present it is unclear whether these two movements are necessarily tightly coupled, or whether both rates are equal because they depend upon a common rate-determining step, e.g., release of tRNA from EF-Tu.
Concluding Comments
Here we present two new FRET assays for determining the dynamics, during PRE complex formation, of movements separating EF-Tu from either ribosomal protein L11, located within the GAC (Tu-L11 assay), or from aa-tRNA (Tu-tRNA assay). These assays utilize TCs formed from EF-Tu variants labeled at position 348 with either a fluorophore or a fluorescence quencher and either unlabeled or fluorescent-labeled aminoacyl-tRNAs. Application of these assays, in conjunction with related measurements, has led to two new mechanistic insights concerning PRE complex formation. First, that although for wt-tRNA and cognate codon, both separation movements occur at similar rates, with the L11 movement proceeding a little faster, the two movements can be completely decoupled from one another, either when a near-cognate codon is employed, or in the presence of kirromycin. Second, that the large slowdown in PRE complex formation resulting from increasing EF-Tu affinity for aminoacyl-tRNA arises from a specific inhibitory allosteric effect on the rate of movement of EF-Tu away from the GAC, which accompanies the movement of aa-tRNA from the A/T site to the A/A site.
Lastly, we wish to stress the clear potential of the Tu-L11 and Tu-tRNA assays for screening new misreading-inducing antibiotic candidates in high-throughput formats, given the large changes in fluorescence in these assays that are sensitive to antibiotic addition (Figure 4). Such screening efforts are of fundamental importance, given the rise of resistance to antibiotics currently in use,39 and the fact that the translational apparatus of the bacterial cell remains one of the principal targets of antibiotics for the clinical treatment of infection worldwide.12
Methods
Materials
The following materials were purchased from the indicated suppliers: IPTG, GDP, GTP, GDPNP [guanosine 5′-[β,γ-imido]triphosphate trisodium salt hydrate], TCEP [tris(2-carboxyethyl)phosphine hydrochloride], streptomycin, paromomycin, kirromycin, and poly(U), bulk E. coli tRNA, amino acids (Sigma); Talon Superflow Metal Affinity Resin (Clontech); plasmid pTZ18R (Amersham); QSY9 maleimide, dNTP, and Top 10 competent cells (Invitrogen); Cy3 maleimide, Cy5 maleimide, NAP-5 column, pGEX vector, MonoQ column (GE Healthcare); pET-15b vector (Novagen); QuikChange site-directed mutagenesis kit (Stratagene); phosphoenolpyruvate (PEP), pyruvate kinase (PK), and RNase A (Roche); proflavin (MB Biomedicals); inorganic pyrophosphatase, Phusion DNA polymerase and DpnI (New England Biolabs); PCR purification kit (QIAGEN); Amicon Ultra ultrafiltration units and nitrocellulose filters (Millipore); GF/C filters (Whatman); E. coli tRNAfMet and yeast tRNAPhe (Chemical Block, Moscow).
Tightly coupled wild-type 70S ribosomes from E. coli MRE600 cells, mutant 70S ribosomes lacking L11 from E. coli AM77 cells, cloned E. coli His-tagged proteins (IF1-3, L11(C38S/S87C), and EF-G), and mRNA 022 and 022CUC were prepared and purified as previously reported.23 mRNA MVYF was prepared by mutation of the mRNA 022 sequence via PCR,40 using the following primers: forward, 5′-TTA ACT TTT AAA TTT TTG AAT TCC CTA TAG TGA GTC GTA TTA AAT TC-3′; over-reverse, 5′-CAG GTA TAC ATA CTA TGG TCT ACT TTA CTA CGA TCT TCT TCA CTT AAC GCG TCT GCA GGC ATG-3′; reverse, 5′-CTT CAC TTA ACG CGT CTG CAG GCA TG-3′; over-forward, 5′-AAG ATC GTA GTA AAG TAG ACC ATA GTA TGT ATA CCT GTT AAC TTT TAA ATT TTT GAA TTC CCT ATA GTG AGT CGT ATT AAA TTC-3′. For mRNA MRFF, the corresponding coding sequence (underlined) with a T7 promoter sequence (GGG AAT TCG AAA TAG AAG TCT TCT TTT TGG A AAA ATT TAA AAG TTA ATA AGG ATA CAT ACT ATG CGT TTC TTC CGT TTC TTC CGT AAA TTC CGT GTG CGT TTT TTC AAA TTT GTG TTC CGT TAA CGC GTC TGC AGG CAT GCA AGC TAA AAA AAA AAA AAA AAA AAA AAA AAA GCT T), purchased from IDT, was ligated into plasmid pTZ18R for expression and purification.41 tRNAVal2B and mutants were prepared by in vitro transcription as previously described.38 L11 labeling with Cy3 and the reconstitution of 70S ribosomes containing L11Cy3 (70SCy3) were performed as described.19
Procedures described in Pan et al. (2007)42 were used to formylaminoacylate or aminoacylate tRNAfMet from E. coli or tRNAPhe from yeast, respectively, and to prepare fMet-tRNAfMet(prf), except that, in the latter case, tRNAfMet was reduced with NaBH4, aminoacylated and purified on FPLC (MonoQ) first, then labeled with prf. tRNAPhe was labeled with Cy3 at positions 16 and 1743 and tRNAVal2B transcripts were aminoacylated44 as previously reported. Bulk aa-tRNAs from E. coli were prepared by charging bulk E. coli tRNAs with 19 amino acids (-Cys). The charging mixture contained ATP (10 mM), each amino acid (0.3 mM), bulk tRNAs (50 μM), a 1:30 dilution of S100 from MRE600 cells as the source of aminoacyl-tRNA synthetases, 0.0025 U μL–1 inorganic pyrophosphatase in buffer (50 mM HEPES, pH 7.6, 30 mM KCl, 70 mM NH4Cl, 15 mM MgCl2,). The reaction mixture was incubated at 37 °C for 30 min and quenched by addition of a 1/10 volume of 3 M NaOAc (pH 5.2). tRNA was precipitated by addition of 2.5 volumes of 96% (v/v) EtOH to reaction mixture aliquots (4 °C). Pellets were washed with 75% (v/v) EtOH and air-dried prior to use.
EF-Tu Variant Preparation and Labeling
C-terminal His-tagged E-coli E348C-EF-Tu was prepared as previously described45 with the following changes. BL21 cells, transformed with a pET15b EF-Tu plasmid, were grown in LB medium at 37 °C and harvested 5 h after induction of protein expression by IPTG (1 mM). Cells (6 g) were resuspended in buffer (50 mM Tris–HCl, pH 7.6, 60 mM NH4Cl, 7 mM MgCl2, 7 mM 2-mercaptoethanol, 15 μM GDP, 15% (v/v) glycerol) and were broken by French press. EF-Tu was purified on a Co(II)-Sepharose (Talon) column (bed volume of 3 mL) and stored in frozen aliquots (15 mg mL–1) in Buffer A (50 mM Tris-HCl, pH 7.5, 100 mM NaCl, 10 mM MgCl2, 15 μM GDP). E348C-EF-Tu labeling was carried out in Buffer A by incubating E348C-EF-Tu (0.8 mg, 0.1 mM), QSY9 or Cy3 maleimide (1.35 mM), and TCEP (1 mM) at room temperature (RT) for 6 h (final volume, 150 μL). The reaction was quenched by addition of β-mercaptoethanol (3 μL). The mixture was diluted to 0.5 mL with Buffer A and loaded onto a NAP-5 column (0.5 mL) at RT to remove free QSY9. One mL of Buffer A was used to elute the EF-Tu. Three fractions of volumes 200, 400, and 400 μL were collected. Labeled EF-Tu was eluted in the middle 400 μL.
The triple variant C137A/C255V/E348C-EF-Tu containing an N-terminal GST-tag was constructed by inserting the tufa gene into the pGEX vector and introducing site-specific mutations using the QuikChange site-directed mutagenesis kit. In addition, a TEV protease recognition site was engineered between the GST and EF-Tu sequences. The variant was purified as described,46 except that bacterial cultures were grown in LB medium with 1 M sorbitol at 37 °C until A600 nm reached 0.6–0.8. Cells were induced with 1 mM IPTG and EF-Tu expressed at 18 °C overnight. The GST tag was cleaved off with recombinant TEV protease.47
Labeling reactions of EF-Tu were carried out at RT by forming TCs with bulk aa-tRNAs from E. coli that protect Cys 81 from labeling, as follows: EF-Tu (50 μM) was preincubated in labeling buffer (50 mM HEPES-HCl, pH 7.6, 30 mM KCl, 70 mM NH4Cl, 7 mM MgCl2) supplemented with GTP (1 mM), PEP (1 mM), pyruvate kinase (0.05 mg mL–1), and TCEP (100 μM) for 10 min, followed by addition of bulk aa-tRNAs (200 μM) and additional incubation for 5 min. A 10× excess of Cy5 maleimide was then added. The reaction mixture was incubated for 6 h, quenched with β-mercaptoethanol (140 mM) and loaded onto a 1 mL Mono Q column prewashed with labeling buffer containing 15 μM GDP. EF-Tu was eluted with the labeling buffer containing 0.25 M NaCl and concentrated using Amicon Ultra-15 ultrafiltration units.
Functional Analysis of EF-Tu Mutants
EF-Tu interaction with aa-tRNA was monitored by the ability of EF-Tu to protect aa-tRNA against either RNase degradation or spontaneous deacylation. The RNase protection assay was performed as described.23 Deacylation reactions were performed in deacylation buffer (60 mM Tris-HCl, pH 7.8, 30 mM KCl, 30 mM NH4Cl, 3.1 mM Mg(OAc)2, 1 mM DTT, 1 mM PEP, 1 mM GTP, 0.05 mg mL–1 PK) containing 0.1 μM [14C]-Phe-tRNAPhe (100 cpm/pmol) at 30 °C in the presence and absence of 0.4 μM EF-Tu. Reactions were stopped at various time points with 400 μL ice-cold 10% (w/v) TCA/1.5% (w/v) Casamino acids solution, the precipitate was collected on Whatman GF/C filters and the radioactivity was determined.
The poly(Phe) assay was carried out in buffer (20 mM Tris-HCl, pH 7.6, 200 mM NH4Cl, 10 mM MgAc2). Initiation complex was made by mixing 70S ribosomes (0.3 μM), poly(U) (0.3 g L–1), [3H]-AcPhe-tRNAPhe (0.36 μM) at 37 °C for 5 min. β-Mercaptoethanol (2 mM), PEP (0.4 mM), PK (4 mg L–1), GTP (0.5 mM), [3H]-Phe-tRNAPhe (4.5 μM), and EF-G (0.5 μM) were then added, and the mixture was fractionated into 6 μL aliquots. PolyPhe synthesis was initiated by adding 0.5 μM of EF-Tu (2 μL) to the aliquots. After incubation at 37 °C for 30 min, the reaction mixtures were quenched with 0.3 mL of 5% (w/v) TCA, heated to 95 °C for 15 min and cooled on ice for 1 h. Filter binding was performed using nitrocellulose filters followed by three washes with 5% (w/v) chilled TCA, and radioactivity was determined.
Testing of fluorescence quenching efficiency was performed in Buffer B (50 mM Tris-HCl, pH 7.5, 70 mM NH4Cl, 30 mM KCl, 7 mM MgCl2, and 1 mM DTT) supplemented with 100 μM GTP, 2 mM PEP and 10 μg mL–1 PK. 0.17 μM of Phe-tRNAPhe (Cy3) was incubated with different concentrations of free QSY9 or EF-TuQSY9 variants at 37 °C for 10 min.
Complex Preparation
All complexes were prepared in Buffer B at 37 °C. 70SICs and TCs were made as described,23 except that EF-Tu was in 4-fold excess of tRNA unless otherwise specified. For experiments using fMet-tRNAfMet(prf) or GDPNP, further purification of 70SIC was performed by centrifugation through a 1.1 M sucrose cushion in Buffer B (Sorvall S120-AT2 rotor, 110 K rpm, 40 min, 4 °C). No PEP or PK was added when GDPNP was used. To evaluate the quenching efficiency between EF-TuQSY9 and [3H]-Phe-tRNAPhe (Cy3), TC [formed by combining 2 nmol of EF-TuQSY9 and 0.7 nmol of Phe-tRNAPhe (Cy3)] was purified on a Co(II)-Sepharose (Talon) resin (0.5 mL). TC and resin prewashed with Buffer C (Buffer B minus DTT) were mixed with shaking at 4 °C for 30 min. Following centrifugation, the resin was transferred to a small spin column. Washing with 4 mL of Buffer C removed all forms of tRNAPhe not bound within a TC. The wash step was followed by elution with 2 mL portions of Buffer C containing 300 mM KCl and first 10 mM imidazole, and then 300 mM imidazole. 0.5 mL fractions were collected. TC was eluted in the first fraction of the 300 mM imidazole-containing buffer.
Kinetic Experiments
Kinetic experiments were performed in Buffer B at 25 °C. Stopped-flow experiments were carried out on KinTek SF-300X stopped-flow spectrofluorometer. Cy3 was excited at 530 nm and monitored using either a 570 nm long-pass filter or a 570 ± 10 nm band-pass filter for experiments in which proflavin fluorescence was monitored simultaneously. Proflavin was excited at 462 nm and monitored using a 515 ± 15 nm band-pass filter. Cy5 fluorescence was monitored using a 680 ± 10 nm band-pass filter. Apparent rate constants were obtained by exponential fitting using Origin (OriginLab). Fitting the Tu-L11 assay results clearly requires a double exponential. Although the Tu-tRNA assay results could be adequately fit with a single exponential, superior fits were obtained using double exponentials (eq 1) (adjusted R2 values were 0.990–0.993 for single exponential fits and 0.999 for double exponential fits).
| 1 |
Global fittings to Scheme Scheme 1 were carried out using Scientist (MicroMath Research). The fMetPhe-tRNAPhe formation was measured using a rapid-quenched flow assay as described.23 Final concentrations: TCQSY9, 0.3 μM; 70SIC, 1.2 μM.
Steady-State Fluorescence
Samples were excited at either 530 nm (for EF-TuQSY9 experiments) or 514 nm (for EF-TuAV-Cy5 experiments) at RT (Fluoromax-3, Jobin Yvon).
Calculation of Residue Surface Exposure
Calculations were carried out within Pymol using the FindSurfaceResidues plug-in from PyMOLWiki.org.
Acknowledgments
This work was supported by the National Institutes of Health [GM080376 to B.S.C. and Y.E.G.] and HG004364 to W.M. C.R.K. was supported by the Leo Pharma Research Foundation, the Novo Nordic Foundation, and the Danish Councils for Independent Research (FNU). V. B. was supported by a Sapere Aude Grant from the Danish Councils for Independent Research.
Supporting Information Available
Labeling stoichiometries of EF-Tu variants. Characterization of ternary complexes formed by labeled EF-Tus. FRET in TCs formed from labeled E348C-EF-Tu variants and Phe-tRNAPhe(Cy3). Complete loss of fluorescence quenching due to FRET. Fluorescence spectrum. Dependence of the apparent rate constants on rapid mixing. This material is available free of charge via the Internet at http://pubs.acs.org.
Author Present Address
∇ Institute for Diabetes, Obesity and Metabolism, Perelman School of Medicine, University of Pennsylvania, Philadelphia, PA 19104
Author Present Address
○ Department of Biosciences, School of Life and Health Sciences, Aston University, Birmingham, B4 7ET, United Kingdom
Author Present Address
◆ Department of Developmental Biology, School of Medicine, Stanford University, Stanford, CA 94305, United States
Author Present Address
¶ Department of Biochemistry, University of Illinois at Urbana–Champaign, Urbana, IL 61801, United States
The authors declare no competing financial interest.
Funding Statement
National Institutes of Health, United States
Supplementary Material
References
- Kavaliauskas D.; Nissen P.; Knudsen C. R. (2012) The busiest of all ribosomal assistants: Elongation factor Tu. Biochemistry 51, 2642–2651. [DOI] [PubMed] [Google Scholar]
- Schmeing T. M.; Ramakrishnan V. (2009) What recent ribosome structures have revealed about the mechanism of translation. Nature 461, 1234–1242. [DOI] [PubMed] [Google Scholar]
- Allen G. S.; Zavialov A.; Gursky R.; Ehrenberg M.; Frank J. (2005) The cryo-EM structure of a translation initiation complex from Escherichia coli. Cell 121, 703–712. [DOI] [PubMed] [Google Scholar]
- Berchtold H.; Reshetnikova L.; Reiser C.; Schirmer N.; Sprinzl M.; Hilgenfeld R. (1993) Crystal structure of active elongation factor Tu reveals major domain rearrangement. Nature 365, 126–132. [DOI] [PubMed] [Google Scholar]
- Polekhina G.; Thirup S.; Kjeldgaard M.; Nissen P.; Lippmann C.; Nyborg J. (1996) Helix unwinding in the effector region of elongation factor EF-Tu-GDP. Structure 4, 1141–1151. [DOI] [PubMed] [Google Scholar]
- Schmeing T. M.; Voorhees R. M.; Kelley A. C.; Gao Y.; Murphy F. V.; Weir J. R.; Ramakrishnan V. (2009) The crystal structure of the ribosome bound to EF-Tu and aminoacyl-tRNA. Science 326, 688–694. [DOI] [PMC free article] [PubMed] [Google Scholar]
- Schmeing T. M.; Voorhees R. M.; Kelley A. C.; Ramakrishnan V. (2011) How mutations in tRNA distant from the anticodon effect the fidelity of decoding. Nat. Struct. Mol. Biol. 18, 432–436. [DOI] [PMC free article] [PubMed] [Google Scholar]
- Gromadski K. B.; Rodnina M. V. (2004) Kinetic determinants of high-fidelity tRNA discrimination on the ribosome. Mol. Cell 13, 191–200. [DOI] [PubMed] [Google Scholar]
- Wohlgemuth I.; Pohl C.; Mittelstaet J.; Konevega A. L.; Rodnina M. V. (2011) Evolutionary optimization of speed and accuracy of decoding on the ribosome. Philos. Trans. R. Soc., B 366, 2979–2986. [DOI] [PMC free article] [PubMed] [Google Scholar]
- Johansson M.; Zhang J.; Ehrenberg M. (2012) Genetic code translation displays a linear trade-off between efficiency and accuracy of tRNA selection. Proc. Natl. Acad. Sci. U.S.A. 109, 131–136. [DOI] [PMC free article] [PubMed] [Google Scholar]
- Vicens Q.; Westhof E. (2003) RNA as a drug target: The case of aminoglycosides. ChemBioChem 4, 1018–1023. [DOI] [PubMed] [Google Scholar]
- Blanchard S. C.; Cooperman B. S.; Wilson D. N. (2010) Probing translation with small-molecule inhibitors. Chem. Biol. 17, 633–645. [DOI] [PMC free article] [PubMed] [Google Scholar]
- Pape T.; Wintermeyer W.; Rodnina M. V. (1998) Complete kinetic mechanism of elongation factor Tu-dependent binding of aminoacyl-tRNA to the A site of the E. coli ribosome. EMBO J. 17, 7490–7497. [DOI] [PMC free article] [PubMed] [Google Scholar]
- Blanchard S. C.; Kim H. D.; Gonzalez R. L. Jr.; Puglisi J. D.; Chu S. (2004) tRNA dynamics on the ribosome during translation. Proc. Natl. Acad. Sci. U.S.A. 101, 12893–12898. [DOI] [PMC free article] [PubMed] [Google Scholar]
- Sanbonmatsu K. Y.; Joseph S.; Tung C. S. (2005) Simulating movement of tRNA into the ribosome during decoding. Proc. Natl. Acad. Sci. U.S.A. 102, 15854–15859. [DOI] [PMC free article] [PubMed] [Google Scholar]
- Schuette J. C.; Murphy F. V. 4th; Kelley A. C.; Weir J. R.; Giesebrecht J.; Connell S. R.; Loerke J.; Mielke T.; Zhang W.; Penczek P. A.; Ramakrishnan V.; Spahn C. M. (2009) GTPase activation of elongation factor EF-Tu by the ribosome during decoding. EMBO J. 28, 755–765. [DOI] [PMC free article] [PubMed] [Google Scholar]
- Geggier P.; Dave R.; Feldman M. B.; Terry D. S.; Altman R. B.; Munro J. B.; Blanchard S. C. (2010) Conformational sampling of aminoacyl-tRNA during selection on the bacterial ribosome. J. Mol. Biol. 399, 576–595. [DOI] [PMC free article] [PubMed] [Google Scholar]
- Whitford P. C.; Geggier P.; Altman R. B.; Blanchard S. C.; Onuchic J. N.; Sanbonmatsu K. Y. (2010) Accommodation of aminoacyl-tRNA into the ribosome involves reversible excursions along multiple pathways. RNA 16, 1196–1204. [DOI] [PMC free article] [PubMed] [Google Scholar]
- Chen C.; Stevens B.; Kaur J.; Cabral D.; Liu H.; Wang Y.; Zhang H.; Rosenblum G.; Smilansky Z.; Goldman Y. E.; Cooperman B. S. (2011) Single-molecule fluorescence measurements of ribosomal translocation dynamics. Mol. Cell 42, 367–377. [DOI] [PMC free article] [PubMed] [Google Scholar]
- Cooperman B. S., Goldman Y. E., Chen C., Farrell I., Kaur J., Liu H., Liu W., Rosenblum G., Smilansky Z., Stevens B., and Zhang H. (2011) Mechanism and dynamics of the elongation cycle. In Ribosomes: Structure, Function, and Dynamics (Rodnina M. V.et al. , Eds.) pp 339–348, SpringerWien, New York. [Google Scholar]
- Penczek P. A.; Kimmel M.; Spahn C. M. (2011) Identifying conformational states of macromolecules by eigen-analysis of resampled cryo-EM images. Structure 19, 1582–1590. [DOI] [PMC free article] [PubMed] [Google Scholar]
- Chudaev M.; Poruri K.; Goldman E.; Jakubowski H.; Jain M. R.; Chen W.; Li H.; Tyagi S.; Mandecki W. (2013) Design and properties of efficient tRNA:EF-Tu FRET system for studies of ribosomal translation. Protein Eng., Des. Sel. 26, 347–357. [DOI] [PMC free article] [PubMed] [Google Scholar]
- Pan D.; Zhang C.; Kirillov S.; Hou Y.; Cooperman B. S. (2008) Perturbation of the tRNA tertiary core differentially affects specific steps of the elongation cycle. J. Biol. Chem. 283, 18431–18440. [DOI] [PMC free article] [PubMed] [Google Scholar]
- Anborgh P. H.; Parmeggiani A.; Jonák J. (1992) Site-directed mutagenesis of elongation factor Tu. The functional and structural role of residue Cys81. Eur. J. Biochem. 208, 251–257. [DOI] [PubMed] [Google Scholar]
- De Laurentiis E. I.; Mo F.; Wieden H. J. (2011) Construction of a fully active Cys-less elongation factor Tu: Functional role of conserved cysteine 81. Biochim. Biophys. Acta 1814, 684–692. [DOI] [PubMed] [Google Scholar]
- Medintz I. L.; Goldman E. R.; Lassman M. E.; Mauro J. M. (2003) A fluorescence resonance energy transfer sensor based on maltose binding proteins. Bioconjugate Chem. 14, 909–918. [DOI] [PubMed] [Google Scholar]
- Qin H.; Grigoriadou C.; Cooperman B. S. (2009) Interaction of IF2 with the ribosomal GTPase-associated center during 70S initiation complex formation. Biochemistry 48, 4699–4706. [DOI] [PMC free article] [PubMed] [Google Scholar]
- Sanderson L. E.; Uhlenbeck O. C. (2007) Directed mutagenesis identifies amino acid residues involved in elongation factor Tu binding to yeast Phet-tRNAPhe. J. Mol. Biol. 368, 119–130. [DOI] [PMC free article] [PubMed] [Google Scholar]
- Parmeggiani A.; Swart G. W. (1985) Mechanism of action of kirromycin-like antibiotics. Annu. Rev. Microbiol. 39, 557–577. [DOI] [PubMed] [Google Scholar]
- Rodnina M. V.; Fricke R.; Wintermeyer W. (1994) Transient conformational states of aminoacyl-tRNA during ribosome binding catalyzed by elongation factor Tu. Biochemistry 33, 12267–12275. [DOI] [PubMed] [Google Scholar]
- Voorhees R. M.; Schmeing T. M.; Kelley A. C.; Ramakrishnan V. (2010) The mechanism for activation of GTP hydrolysis on the ribosome. Science 330, 835–838. [DOI] [PMC free article] [PubMed] [Google Scholar]
- Chen Y.; Feng S.; Kumar V.; Ero R.; Gao Y. G. (2013) Structure of EF-G-ribosome complex in a pretranslocation state. Nat. Struct. Mol. Biol. 20, 1077–1084. [DOI] [PubMed] [Google Scholar]
- Rodnina M. V. (2013) Biochemistry. Translocation in action. Science 340, 1534–1535. [DOI] [PubMed] [Google Scholar]
- Gromadski K. B.; Rodnina M. V. (2004) Streptomycin interferes with conformational coupling between codon recognition and GTPase activation on the ribosome. Nat. Struct. Mol. Biol. 11, 316–322. [DOI] [PubMed] [Google Scholar]
- Pape T.; Wintermeyer W.; Rodnina M. V. (2000) Conformational switch in the decoding region of 16S rRNA during aminoacyl-tRNA selection on the ribosome. Nat. Struct. Biol. 7, 104–107. [DOI] [PubMed] [Google Scholar]
- Cochella L.; Brunelle J. L.; Green R. (2007) Mutational analysis reveals two independent molecular requirements during transfer RNA selection on the ribosome. Nat. Struct. Mol. Biol. 14, 30–36. [DOI] [PubMed] [Google Scholar]
- Demirci H.; Murphy F. 4th; Murphy E.; Gregory S. T.; Dahlberg A. E.; Jogl G. (2013) A structural basis for streptomycin-induced misreading of the genetic code. Nat. Commun. 4, 1355. [DOI] [PMC free article] [PubMed] [Google Scholar]
- Schrader J. M.; Chapman S. J.; Uhlenbeck O. C. (2011) Tuning the affinity of aminoacyl-tRNA to elongation factor Tu for optimal decoding. Proc. Natl. Acad. Sci. U.S.A. 108, 5215–5220. [DOI] [PMC free article] [PubMed] [Google Scholar]
- Antibiotic resistance threats in the United States (2013). U.S. Dept. HHS, Centers for Disease Control and Prevention. http://www.cdc.gov/drugresistance/threat-report-2013/ (accessed April 13, 2014). [Google Scholar]
- Chiu J.; March P. E.; Lee R.; Tillett D. (2004) Site-directed, ligase-independent mutagenesis (SLIM): A single-tube methodology approaching 100% efficiency in 4 h. Nucleic Acid Res. 32, e174. [DOI] [PMC free article] [PubMed] [Google Scholar]
- Stevens B.; Chen C.; Farrell I.; Zhang H.; Kaur J.; Broitman S. L.; Smilansky Z.; Cooperman B. S.; Goldman Y. E. (2012) FRET-based identification of mRNAs undergoing translation. PLoS One 7, e38344. [DOI] [PMC free article] [PubMed] [Google Scholar]
- Pan D.; Kirillov S. V.; Cooperman B. S. (2007) Kinetically competent intermediates in the translocation step of protein synthesis. Mol. Cell 25, 519–529. [DOI] [PMC free article] [PubMed] [Google Scholar]
- Pan D.; Qin H.; Cooperman B. S. (2009) Synthesis and functional activity of tRNAs labeled with fluorescent hydrazides in the D-loop. RNA 15, 346–354. [DOI] [PMC free article] [PubMed] [Google Scholar]
- Dale T.; Sanderson L. E.; Uhlenbeck O. C. (2004) The affinity of elongation factor Tu for an aminoacyl-tRNA is modulated by the esterified amino acid. Biochemisty 43, 6159–6166. [DOI] [PubMed] [Google Scholar]
- Perla-Kajan J.; Lin X.; Cooperman B. S.; Goldman E.; Jakubowski H.; Knudsen C. R.; Mandecki W. (2010) Properties of Escherichia coli EF-Tu mutants designed for fluorescence resonance energy transfer from tRNA molecules. Protein Eng., Des. Sel. 23, 129–136. [DOI] [PMC free article] [PubMed] [Google Scholar]
- Jonák J. (2007) Bacterial elongation factors EF-Tu, their mutants, chimeric forms, and domains: Isolation and purification. J. Chromatogr. B: Anal. Technol. Biomed. Life Sci. 849, 141–153. [DOI] [PubMed] [Google Scholar]
- Jonstrup A. T.; Andersen K. R.; Van L. B.; Brodersen D. E. (2007) The 1.4 Å crystal structure of the S. pombe Pop2p deadenylase subunit unveils the configuration of an active enzyme. Nucleic Acids Res. 35, 3157–3164. [DOI] [PMC free article] [PubMed] [Google Scholar]
Associated Data
This section collects any data citations, data availability statements, or supplementary materials included in this article.