

Abstract
The three-dimensional conformations of noncoding RNAs underpin their biochemical functions but have largely eluded experimental characterization. Here, we report that integrating a classic mutation/rescue strategy with high-throughput chemical mapping enables rapid RNA structure inference with unusually strong validation. We revisit a 16S rRNA domain for which SHAPE (selective 2′-hydroxyl acylation with primer extension) and limited mutational analysis suggested a conformational change between apo- and holo-ribosome conformations. Computational support estimates, data from alternative chemical probes, and mutate-and-map (M2) experiments highlight issues of prior methodology and instead give a near-crystallographic secondary structure. Systematic interrogation of single base pairs via a high-throughput mutation/rescue approach then permits incisive validation and refinement of the M2-based secondary structure. The data further uncover the functional conformation as an excited state (20 ± 10% population) accessible via a single-nucleotide register shift. These results correct an erroneous SHAPE inference of a ribosomal conformational change, expose critical limitations of conventional structure mapping methods, and illustrate practical steps for more incisively dissecting RNA dynamic structure landscapes.
Keywords: RNA folding, secondary structure, SHAPE, compensatory rescue, mutate-and-map, ribosome
INTRODUCTION
RNA plays critical roles in diverse cellular and viral processes ranging from information transfer to metabolite sensing to translation (Nudler and Mironov 2004; Amaral et al. 2008; Zhang et al. 2009, 2010; Breaker 2012). For the most complex of these processes, RNAs must adopt and interconvert between specific three-dimensional structures (Zhang et al. 2010), but for the vast majority of systems, these conformations remain experimentally uncharacterized. In particular, current prediction methods do not yet offer clear metrics of statistical confidence, probe the possibility of multiple conformations (including weakly populated “excited” states), or provide routes to cross-validation through independent experiments. The situation is particularly problematic since RNAs can form multiple alternative secondary structures whose helices are mutually exclusive (Nudler and Mironov 2004; Henkin 2008; Haller et al. 2011).
One approach for probing large numbers of RNA molecules involves chemically modifying RNA and reading out these events via electrophoresis or deep sequencing (Mitra et al. 2008; Lucks et al. 2011; Pang et al. 2011; Yoon et al. 2011). Numerous reagents, including protein nucleases (Walczak et al. 1996; Grover et al. 2011; Siegfried et al. 2011), alkylating chemicals such as dimethyl sulfate (DMS) (Wells et al. 2000; Tijerina et al. 2007; Cordero et al. 2012a), and hydroxyl radicals (Adilakshmi et al. 2006; Das et al. 2008; Ding et al. 2012), have been leveraged to modify or cleave RNA in a structure-dependent manner. Protection of nucleotides from modification, typically signaling the formation of base pairs, can guide manual or automatic secondary structure inference (Mathews et al. 2004; Mitra et al. 2008; Vasa et al. 2008). Strong cases have been made for using reagents that covalently modify 2′-hydroxyls followed by readout via primer extension (SHAPE) (Merino et al. 2005; Mortimer and Weeks 2007; Deigan et al. 2009; Watts et al. 2009; McGinnis et al. 2012) and then applying these data as pseudoenergy bonuses in free-energy minimization algorithms, such as RNAstructure (Mathews et al. 2004; Reuter and Mathews 2010; Hajdin et al. 2013).
Assessing the accuracy of structure mapping methods is becoming a major issue as these approaches are being applied to large RNA systems—such as entire cellular transcriptomes—for which crystallographic, spectroscopic, or phylogenetic methods cannot be brought to bear (Kertesz et al. 2010; Underwood et al. 2010; Kladwang et al. 2011a). In some cases, the resulting models have disagreed with accepted structures (Quarrier et al. 2010; Kladwang et al. 2011c; Hajdin et al. 2013; Sükösd et al. 2013; Rice et al. 2014), motivating efforts to estimate uncertainty (Kladwang et al. 2011c; Ramachandran et al. 2013), to incorporate alternative mapping strategies (Cordero et al. 2012a; Kwok et al. 2013), and to integrate mapping with systematic mutagenesis (mutate-and-map [M2]) (Kladwang and Das 2010; Kladwang et al. 2011a,b; Cordero et al. 2014). Even these improvements do not provide routes to validation through independent experiments, and structure inferences remain under question (Wenger et al. 2011).
A powerful technique for validating RNA structures is the rescue of disruptive perturbations from single mutations through compensatory mutations that restore Watson-Crick pairs. Mutation/rescue has typically been read out through catalytic reactions such as self-cleavage (Wu and Huang 1992; Macnaughton et al. 1993). For RNAs without well-established functional assays, chemical mapping offers a potentially general readout for mutation/rescue, but has been explored in only a limited fashion (Huang et al. 2013). Here, we demonstrate the applicability and power of high-throughput mutation/rescue for the 126–235 RNA, a 16S ribosomal domain and S20-protein-binding site (Brodersen et al. 2002) for which a prior SHAPE study (Fig. 1) proposed a multihelix conformational change (Deigan et al. 2009). Our new analyses and data instead gave a model that was consistent with the RNA's accepted secondary structure up to a single-nucleotide register shift in one helix. In-depth analysis of high-throughput mutation/rescue experiments further revealed that the crystallographic conformation was present as an “excited state” at 20 ± 10% population. The resolution and in-depth validation of these results on the 126–235 RNA suggest that a mutate-map-rescue approach will be necessary for correctly modeling structures and excited states of noncoding RNA domains, and we discuss prospects for further accelerating the method's throughput.
FIGURE 1.

Models of a 16S rRNA domain (the 126–235 RNA). (A–C) Secondary structure derived from SHAPE data (1D-data-guided) on the solution RNA, from mutate-and-map (2D-data-guided) of the solution RNA, and from crystallography in the context of the full ribosome. Colored helices are pairings under question, as described in the text and presented with the same color-coding in subsequent figures. P2* consists of noncanonical base pairs in the crystallographic model, while it is predicted as Watson-Crick-paired in 1D- and 2D-data-guided modeling. (D) Comparisons of independent SHAPE reactivity measurements of 126–235 RNA. SHAPE data presented in prior study (Deigan et al. 2009) within the full-length 16S ribosomal RNA extracted from E. coli (prior [full-length]); for a construct isolating the 126–235 domain (prior [126–235]); and from this work (current [126–235]). Standard deviations (SD) are shown, N = 7.
RESULTS
Reproducibility and robustness of SHAPE modeling
Before applying newer approaches, we carried out standard SHAPE chemical mapping on the 126–235 RNA readout by capillary electrophoresis (CE), seeking to reproduce prior studies. Our SHAPE data with the acylating reagent 1-methyl-7-nitroisatoic anhydride (1M7) (Mortimer and Weeks 2007), averaged across four replicates, agreed with previously published data (Deigan et al. 2009) for the 126–235 RNA in the context of the full ribosome and in different flanking sequences (Fig. 1D). In particular, sequence assignments agreed with prior work and were additionally verified by coloading chemical mapping samples with dideoxy sequencing ladders and measurements using the Illumina-based MAP-seq (Multiplexed Accessibility Probing readout through sequencing) protocol (Supplemental Fig. S1A,B; Seetin et al. 2014). In ribosome crystals and phylogenetic analyses, the 126–235 RNA domain forms a junction of four helices (Fig. 1B; Zhang et al. 2009); whereas the prior SHAPE-directed model (referred to hereafter as the “1D-data-guided model”) proposed two different helices (Fig. 1A). The SHAPE data were consistent with both the ribosome crystallographic secondary structure as well as with the prior 1D-data-guided secondary structure. In both models, the nucleotides observed to be SHAPE-reactive either do not form Watson-Crick base pairs or are next to such nucleotides.
We then carried out secondary structure predictions guided by these SHAPE data, using the RNAstructure modeling algorithm with default SHAPE pseudofree energy parameters, which were derived from prior 16S rRNA analysis (Deigan et al. 2009). The resulting model (Fig. 2A) was identical to the 1D-data-guided model inferred in the previous study and distinct from the crystallographic secondary structure (Fig. 1B). Hereafter, we refer to the helical segments in the crystallographic secondary structure as P1a-c, P2a-b, P3, and P4a-b, since they provide a finer level of description than the conventional 16S rRNA helix numbering (H122, H144, H184, H198). The 1D-data-guided model retains P1a-c, P2b, and P3 but forms distinct helices that we label as alt-P1d, alt-P4, and alt-P5 (Fig. 2A). Crystallographic helix P2* consists of noncanonical base pairs (trans Watson-Crick/Hoogsteen U/A); RNAstructure does not model these pairings but frequently recovers them as Watson-Crick pairs (see, e.g., Cordero et al. 2012a).
FIGURE 2.
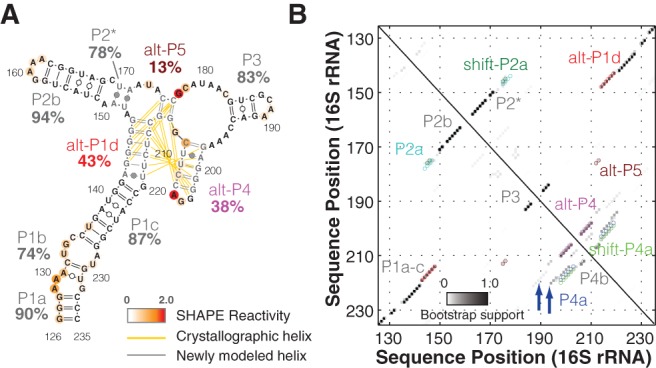
SHAPE analysis gives an uncertain model for the 126–235 RNA. (A) Secondary structure prediction using one-dimensional SHAPE (1M7) data. Nucleotides are colored with SHAPE reactivities. Crystallographic pairings missing in this model and new noncrystallographic pairings are drawn as yellow and gray lines, respectively. Percentage labels give bootstrap support values. (B) Bootstrap support values for each base-pair shown as grayscale shading. The data presented are symmetrical, but with positions corresponding to crystallographic and alternative pairings labeled separately on the bottom left and top right, respectively. Labeled open circles mark the predicted pairings from the three models shown in Figure 1. Blue arrows mark a range of further alternative pairings.
Confusion regarding SHAPE protocols and recent reports of artifacts by us and others (Wilkinson et al. 2006; Kladwang et al. 2011b; Leonard et al. 2013) motivated us to further test the robustness of our experimental SHAPE protocol and algorithm. We obtained results that were the same, within estimated experimental error, upon varying folding solution conditions (Wilkinson et al. 2006; Deigan et al. 2009; Kladwang et al. 2011b), acylating reagents (1M7 and NMIA) (Merino et al. 2005; Mortimer and Weeks 2007), reverse transcription conditions (Mills and Kramer 1979), quantitation software (Yoon et al. 2011; Karabiber et al. 2013), normalization schemes (Deigan et al. 2009), and RNAstructure modeling software versions (Fig. 1D; Supplemental Figs. S1A,B, S2; Mathews et al. 2004; Hajdin et al. 2013). Overall, these data confirmed the reproducibility of the SHAPE experimental method and modeling procedure across different conditions and by different groups.
Nonparametric bootstrapping gives low confidence estimates
Procedures for estimating uncertainties in SHAPE-directed modeling have not yet become widely accepted. We recently proposed that useful helix-by-helix support values might be calculated by a resampling procedure called nonparametric bootstrapping (Efron et al. 1996; Kladwang et al. 2011c). This conceptually simple procedure has found wide use in complex statistical problems, such as phylogenetic inference, in which parametric models for likelihood or posterior probabilities are unavailable or untrustworthy. Mock data sets are “bootstrapped” from the experimental data set by resampling with replacement from the collection of data-derived energy bonuses. These data sets mimic scenarios in which data at particular residues might be missing or extra data at particular residues are available (e.g., from multiple-probe methods). The data are then input into the same secondary structure prediction algorithm. The frequencies at which helices arise in these bootstrap replicates provide “bootstrap supports.” Low support values indicate that alternative structural models exist and are nearly as consistent with the experimental data as the original model. Although this procedure has been criticized as being overly conservative (Ramachandran et al. 2013), experimental benchmarks on noncoding RNAs of known structure (Kladwang and Das 2010; Kladwang et al. 2011a,b) and simulation-based studies (S Tian and R Das, unpubl.) confirm that bootstrap supports provide numerically accurate indicators of helix confidence.
For the 126–235 RNA SHAPE modeling, bootstrapping calculations gave a wide range of values for the 1D-data-guided model (Fig. 2). On one hand, helices that were shared between the 1D-data-guided model and the crystallographic model gave bootstrap supports >80% (see P1a, P1c, P2b, and P3 in Fig. 2A). On the other hand, helices that were rearranged in the 1D-data-guided model gave lower bootstrap supports (43%, 78%, 38%, and 13% for alt-P1d, P2*, alt-P4, and alt-P5, respectively). In contrast to prior suggestions (Ramachandran et al. 2013), the strengths of these supports did not simply reflect helix length. For example, the short P3 (three base pairs) attained a high support of 83%, whereas the second-longest helix alt-P1d attained a lower support of 43%. Instead, the helices with low supports lay in regions that could form numerous alternative structures calculated to have energies nearly as low as the final 1D-data-guided model, including the crystallographic secondary structure (Fig. 2B, blue arrows).
The low bootstrap supports for the rearranged helices, as well as the difficulty of discriminating between multiple alternative structures with the available data, motivated us to acquire measurements on the 126–235 RNA that might validate or falsify their existence. Independent information from alternative modifiers highlighting bases whose Watson-Crick edges are available for alkylation (A-N1 or C-N3, by DMS) (Tijerina et al. 2007) or for the carbodiimide reaction (G-N1 or U-N3, by CMCT) (Walczak et al. 1996; Cordero et al. 2012a) were obtained, and secondary structure prediction guided by these data show similarly low bootstrap values (Supplemental Fig. S1D,E). Except for noncanonical pairings in P2*, this analysis provided weak or no support to the 1D-data-guided model above and indicated that confidently disambiguating the RNA's solution structure would require methods with higher information content.
Two-dimensional mutate-and-map (M2) resolves ambiguities in modeling
Compared to the “one-dimensional” (1D) structure mapping approaches above, a recently developed two-dimensional (2D) expansion of chemical mapping offered the prospect of higher confidence modeling of the 126–235 RNA. The mutate-and-map method (M2) involves the parallel synthesis of separate constructs harboring single mutations at each nucleotide of the RNA (Supplemental Table S2), followed by chemical mapping of each construct at nucleotide-resolution (Kladwang and Das 2010; Kladwang et al. 2011a,b). Observation of an initially protected region that becomes reactive upon mutation of a sequence-distant region provides evidence for pairing between the two regions. Mutations that are unique in their effect and that do not release nucleotides other than their partner appear as punctate features in the M2 data; such signals provide the strongest evidence for nucleotide–nucleotide interactions (Kladwang et al. 2011b).
M2 electropherograms for the 126–235 RNA were acquired as in prior work (Fig. 3A; Kladwang et al. 2011b). Several features provided consistency checks in the M2 analysis. Perturbations near the site of the mutations were visible as a diagonal feature from top left to bottom right. In addition, in several expected regions, mutations led to punctate features corresponding to “release” of sequence-distant nucleotides. For example, G138 was exposed by C225G and no other mutation. These data, as well as nearby features (marked I in Fig. 3A) supported P1c. Similarly, punctate features of increased reactivity at G168 by C153G and G184 by C193G defined hairpin P2b and P3 (marked II and III, respectively, on Fig. 3A). These segments, P1c, P2b, and P3, were present in all the models above, including the prediction by RNAstructure with no experimental data (Supplemental Fig. S1C).
FIGURE 3.

Mutate-and-map analysis gives a confident model of the 126–235 RNA. (A) Mutate-and-map (M2) data set probed by the SHAPE reagent NMIA. Structural features (dark signals) highlight evidence of (I) G138 pairing with C225; (II) G168 pairing with C153; (III) G184 pairing with C193; (IV) G200 pairing with C217; (V) C176 pairing with G146; (VI) interaction between A143 and G220; (VII) interaction between A174 and A199; and (VIII) more extensive disruptions from G142C. (B) Z-score contact map extracted from A, used for secondary structure inference. (C,D) Secondary structure prediction and bootstrap support matrix using two-dimensional M2 data. Percentage labels give bootstrap support values. Difference from crystallographic model is drawn in yellow/gray lines. Open circles mark the positions of helices from all three models.
Additional punctate features provided discrimination between the 1D-data-guided secondary structure and other models. First, C217G released nucleotide G200 (IV in Fig. 3A). The only other mutations that perturbed G200 were changes near this nucleotide in sequence and G187C, which caused a change in SHAPE profile throughout the RNA, presumably reflecting a major rearrangement of secondary structure. This feature supported pairing of C217 and G200, which occurs in P4a of the crystallographic secondary structure; it also disfavored the 1D-data-guided model, in which these nucleotides are instead partnered with different nucleotides (C217-G145 and G200-U208). Second, G146C released C176 while affecting no other region of the 126–235 RNA (V). This feature supports base-pairing of G146-C176, which occurs in crystallographic P2a but not in the 1D-data-guided model. Additional punctate features suggested interactions between G220 and A143 (VI) and A174 and A199 (VII). These features do not connect nucleotides that are Watson-Crick paired but that may be coupled through noncanonical interactions. For example, in the ribosome crystallographic model, G220 and A143 form a cis-Watson-Crick pair, and A199 makes a contact with the neighbor of A174 (U173).
To fully integrate the M2 data into a structural model, we carried out automated secondary structure prediction with RNAstructure (Mathews et al. 2004). This analysis takes into account the single-nucleotide-resolution features as above but also leverages additional, less punctate features that correspond to, e.g., disruption of multiple base pairs upon mutations (marked VIII in Fig. 3A). The weights of these features are calculated as Z-scores (Fig. 3B), which down-weight any regions that are highly variable across constructs (see Methods). Consistent with visual analysis above, the resulting secondary structure (referred to hereafter as the “2D-data-guided model”), recovered helices P1a-c, P2b, P3, and the noncanonical P2* with high confidence (support values of 96% or greater) (Fig. 3C,D). Furthermore, this 2D-data-guided model agreed with the crystallographic secondary structure in helix P4b (support value 99%), which is entirely absent from the 1D-data-guided structure. Minor discrepancies with the crystallographic secondary structure occurred in P2a and in P4a. Some bootstrap replicates (36%) recovered two base pairs in helix P2a, but a larger fraction of replicates (63%) returned this helix with the pairings shifted by one nucleotide, a secondary structure we called shift-P2a (cf. Fig. 1B,C). Nevertheless, the overall support totaled over P2a and shift-P2a was strong (98%). Similarly, bootstrap replicates sampled alternative registers for the P4a helix (shift-P4a and the crystallographic P4a at 85% and 13%, respectively, summing to 98%). In contrast, only 2% of bootstrap replicates gave secondary structures consistent with the alt-P4 rearrangement in the 1D-data-guided model (Figs. 2B, 3D).
As an independent confirmation of the M2 analysis, we repeated the M2 experiments with the SHAPE modifier 1M7 (instead of NMIA) and again with the DMS modifier. Automated secondary structure prediction guided by these separate M2 data sets returned models indistinguishable from the NMIA-based analysis above, with similar residual ambiguities in the registers of P2a and P4b (Supplemental Fig. S3). Overall, the M2 analysis recovered the crystallographic secondary structure, up to potential single-nucleotide register shifts in helices P2a and P4b.
Systematic falsification of 1D-data-guided model through mutation/rescue
To more deeply interrogate and test the 126–235 RNA's secondary structure, we sought to validate or falsify base pairs in the models above through mutation/rescue experiments. A classic technique for validating RNA models is the rescue of disruptive perturbations from single mutations through compensatory mutations. Rescue of function in double mutants predicted to restore Watson-Crick pairs disrupted by separate single mutations provides strong evidence for base-pairing of those nucleotides. Mutation/rescue approaches are well developed for RNA molecules whose structure is coupled to a functional readout, such as self-cleavage (Wu and Huang 1992; Macnaughton et al. 1993); but such a general and systematic validation method has not been well explored for cases without well-established functional assays. Here, chemical mapping offers a single-nucleotide-resolution readout of perturbation and restoration of structure (Kladwang et al. 2011b). The crystallographic model, 1D-data-guided and 2D-data-guided models provided specific pairing hypotheses to test. The same synthesis pipeline (Kladwang et al. 2011b) leveraged to synthesize 96 single mutants for M2 measurements permitted facile synthesis of these additional RNA variants (Supplemental Table S2). Figure 4 shows the capillary electropherograms of pairings in question as well as quantitated data.
FIGURE 4.

Mutation/rescue results validate and refine the 126–235 RNA solution secondary structure. Electropherograms of SHAPE analysis with compensatory double mutations to test base-pairings from 1D-data-guided models: (A–G) alt-P1d, (H–J) alt-P4, and (K–O) alt-P5; 2D-data-guided: (P–V) shift-P4a and (W–Z) shift-P2a; and crystallographic: (AA–AF) P4a and (AG–AJ) P2a. Red X's mark pairings for which disruption and/or rescue were not observed (alt-P1d, alt-P4, and alt-P5 from the 1D data-guided model, and shift-P2a from the 2D-data-guided model); green checkboxes mark pairings for which disruption and/or rescue were observed (shift-P4a from the 2D-data-guided model and P2a and P4a from the crystallographic model). For each tested pairing, a “quartet” of wild-type, single mutant 1, single mutant 2, and compensatory double mutant are grouped for comparison. Blue arrows mark G204 in P4a-stabilized mutants (AA–AF).
Discriminating the secondary structure models required identification of nucleotides with different pairings across models. As an example, G201 paired with C207 within the alt-P4 helix of the 1D-data-guided model but with C217 in the shift-P4a helix of the 2D-data-guided model. Single mutation of G201C resulted in clear changes in SHAPE data over a ∼20-nucleotide region (180–198) (Fig. 4F). The 1D-data-guided model predicted that mutation C207G would restore this pairing. However, the double mutant G201C/C207G retained the disruptions observed in the G201C single mutant as well as additional changes observed in the C207G single mutant (Fig. 4F). An analogous experiment on the same pairing but different mutations (G201U/C207A) gave similar results, with no observed rescue (Fig. 4E).
In contrast to the above experiment, the 2D-data-guided model predicted that a different mutation, C217G, would restore the pairing disrupted by the G201C mutation. Such a rescue was indeed observed in G201C/C217G (Fig. 4S). The effect was even more striking given that the rescuing C217G mutation produced disruptions throughout the entire RNA when implemented as a single mutant (Fig. 4S). The SHAPE reactivities for the entire double mutant RNA were indistinguishable from the wild-type RNA with a minor exception: Weak reactivity at G204 in the wild type was suppressed in the double mutant. Together with similar observations with G201U/C217A (Fig. 4R), these experiments provided strong evidence for shift-P4a predicted by the 2D-data-guided model.
In addition to the pairing options G201 above, we tested additional base-pairings by mutation/rescue studies on alt-P1d, alt-P4, and alt-P5 (Fig. 4A–O). None of these experiments exhibited disruptions by single mutants that were rescued by double mutants (Supplemental Fig. S4A,E). Three double mutants (A199U/U209A, A143U/U219A, and A143C/U219G) gave reactivity profiles similar to wild type, but the single mutations alone did not introduce significant disruptions either (Fig. 4A,K,L).
For the 2D-data-guided model, mutation/rescue resolved ambiguities in the P2a/shift-P2a and P4a/shift-P4a regions. Mutation/rescue for helix P4b was rendered difficult by its low stability (see Supplemental Fig. S4D). For the pairings of shift-P2a, double mutants did not exhibit rescue of disruptions observed in single mutants (Fig. 4W–Z). Therefore, another set of double mutants was designed based on the register of helix P2a seen in the crystallographic model (Fig. 4AG–AJ). In each of these cases, the double mutants did rescue the perturbations induced by single mutants, restoring the SHAPE reactivity seen in the wild-type RNA. (In G145U/G177A, the SHAPE reactivity of G177 was suppressed, consistent with replacement of the original noncanonical G/G pair with a canonical A/U pair.) Taken together, these data strongly favored the formation of the crystallographic P2a.
In the case of shift-P4a, as with G201C/C217G above, all double mutants rescued disruptions observed in single mutants, giving strong evidence for helix shift-P4a (Fig. 4P–V). Furthermore, the quantitated data showed strong agreement with one another (Supplemental Fig. S4B,F).
Quantitative dissection of the P4a helix register shift
The data above strongly favored the crystallographic secondary structure. The only exception was a subtle one: a single-nucleotide register shift in helix P4a, which was experimentally validated through mutation/rescue of the shifted pairings. We sought to further probe this register shift by carrying out mutation/rescue experiments based on crystallographic P4a but not in shift-P4a (Fig. 4AA–AF). Surprisingly, the double mutants SHAPE data showed rescue of disruptions induced by single mutations, and led to SHAPE data indistinguishable from the wild type data, except for stronger reactivity at G204 and the disappearance of weak reactivity at G198 (Supplemental Fig. S4C). These data strongly supported the presence of the crystallographic helix P4a, in apparent contradiction to the results above supporting the 2D-data-guided helix shift-P4a.
The paradox of mutation/rescue data supporting both registers could be resolved if 126–235 RNA interconverts between P4a and shift-P4a registers at equilibrium. The double mutants chosen to test shift-P4a perturbed the equilibrium and favored the shift-P4a structure, and alternative stabilization occurred for the P4a double mutants. This model provided testable predictions: Double mutants should converge to two slightly distinct SHAPE reactivity profiles depending on which register they preferentially stabilized. Furthermore, the wild-type SHAPE profile should be decomposable into a linear combination of the P4a-stabilized and shift-P4a-stabilized profiles.
Indeed, the double mutants observed to stabilize P4a gave distinct SHAPE reactivity data from those that stabilized shift-P4a at nucleotides G204 (increased) and G198 (decreased); see Figure 4AA–AF (blue arrows) and Supplemental Figure S4B,C,F,G. In accord with the model, these are the two nucleotides brought into and out of the helix, respectively, by the register shift; cf. Figure 4S and AD. Finally, the wild-type data could be fitted to an equilibrium mixture of the shift-P4a-stabilized and P4a-stabilized profiles, as determined from the double mutants (Fig. 5A). To estimate the population fraction of shift-P4a and P4a in the wild-type RNA, we carried out χ2-based fits of the SHAPE reactivity across all nucleotides (126–235), or G204 and A205 (where changes were largest), or G204 only (Supplemental Fig. S4H–J). The equilibrium fractions of shift-P4a and P4a were fitted to be 80 ± 10% and 20 ± 10%, with the error reflecting small differences in fits using the different nucleotides. This ratio of populations corresponds to a free energy difference of 0.5–1.3 kcal/mol. In the context of the full ribosome, this equilibrium may be perturbed to favor the crystallographic/phylogenetic structure by RNA tertiary contacts or S20 protein binding, providing possible checkpoints for 16S rRNA assembly that can be tested in future experiments (Supplemental Fig. S6; below). Additional tests, including SHAPE reactivities from other mutants, suggest that if states other than the P4a and shifted-P4a state are present, either their population fractions are negligible (<5%) (Supplemental Fig. S4K) or their SHAPE reactivities are very similar to the already described two states.
FIGURE 5.
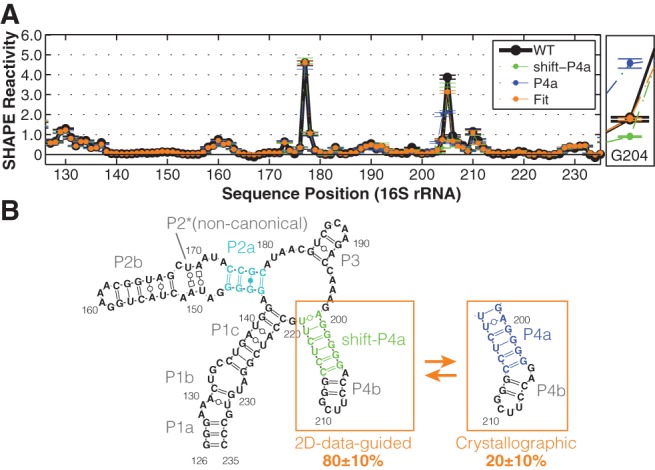
Equilibrium fitting tests a register-shift “excited state” model for the 126–235 RNA. (A) Linear fitting of P4a/shift-P4a equilibrium based on G204. An enlarged view of G204 reactivities is on the right. Averaged reactivity profiles of P4a-stabilized (blue) and shift-P4a-stablized (green) double mutants are plotted. SDs are shown, N = 5. (B) Model of 126–235 RNA secondary structure in solution, including P4a/shift-P4a dynamics.
DISCUSSION
Toward validated models of RNA structure from chemical mapping
As a test case for single-nucleotide-resolution chemical mapping, we have carried out an in-depth dissection of the solution structure of a model system with complex RNA structure, a 110-nucleotide segment of the 16S ribosomal RNA that was previously suggested to undergo a large-scale conformational rearrangement between its intrinsic solution structure and its state within the assembled small ribosomal subunit. Through a simple computational procedure, we first discovered that prior SHAPE-directed modeling (Deigan et al. 2009) as well as DMS and CMCT chemical mapping measurements did not carry sufficient information content to determine the 126–235 RNA's secondary structure. We then leveraged a more information-rich technology, the mutate-and-map (M2) approach, to infer a more confident model, which disagreed with prior approaches and was instead identical to the structure observed in ribosome crystallography, up to small ambiguities in helix register (Zhang et al. 2009). Finally, we demonstrated that a rich array of mutation/rescue experiments could be designed, carried out, and interpreted to provide strong tests and refinement of these RNA structure models. In addition to resolving the secondary structure at nucleotide resolution, these data revealed the exact crystallographic secondary structure, which is shifted from the dominant structure by a single-nucleotide register change, to be present as an “excited state.” The overall mutate-map-rescue (M2R) pipeline offers numerous advantages over prior methodology.
Limitations of previous mutational analysis
Prior mutational analysis was not designed to precisely validate or falsify base pairs and instead gave data that did not discriminate between possible models. One mutant, M1, harbored two mutations U208C and U218C, and was speculated to stabilize the 1D-data-guided model by switching two U-G pairs to more stable C-G pairs. Although the overall 1D SHAPE profile of M1 is indistinguishable from wild type (Supplemental Fig. S5A,B), this observation does not exclude alternative pairing schemes. Mutation U208C is also consistent with both the 2D-data-guided and crystallographic model since U208 is unpaired in both models. Mutation U218C can result in pairing with another G in both 1D-data-guided and 2D-data-guided models: G144 in alt-P1d and G200 in shift-P4a. In our final model (Fig. 5B), forming a G200-C218 pair would lock the structure in shift-P4a and give G204 reactivity lower than the wild-type RNA. This slight perturbation was indeed observed in M1 (Supplemental Fig. S5C). Thus, the data for M1 is consistent with both prior and current models.
The second mutant, M2, was designed to stabilize the crystallographic model with two mutations G145C and U219C. A perturbed SHAPE profile at G177 was taken to support a conformational change (Deigan et al. 2009). Nevertheless, the observed changes can be explained by small differences in the structures. G145C stabilizes the original noncanonical G145-G177 pair in crystallographic model into a Watson-Crick base pair, reducing the reactivity of G177 (Supplemental Figs. S5D, S6A). U219C alters a U-G pair to C-G pair in P4a, thus stabilizing and also locking it in P4a conformation, enhancing the reactivity of G204 and A205 in M2 (Supplemental Fig. S5D, blue arrow). The mutations render the M2 sequence unable to form base pairs seen in the 1D-data-guided model. The M2 data again do not discriminate between previous and new models.
In summary, the variants tested in the prior study, M1 (U208C/U218C) and M2 (G145C/U219C), were double mutants but did not probe compensatory mutations; those results were consistent with numerous structures, including the new model here. The number of alternative models for an RNA system is vast and difficult to enumerate, especially given errors in the nearest-neighbor parameters underlying secondary structure modeling methods. Rich data like the mutate-map-rescue measurements herein may be useful in recalibrating those parameters in the future. At present, however, only compensatory rescue provides incisive mutational discrimination amongst secondary structures.
Excited states
Nearly all experimental RNA structural methods, ranging from solution chemical mapping to crystallography, focus on inferring the dominant RNA conformation in solution. Obtaining an experimental description of weakly populated states necessarily requires more information and has typically involved mutations to trap such states (Pan and Woodson 1998; Russell et al. 2002; Gilbert et al. 2007). The mutate-map-rescue (M2R) approach herein involved a systematic panel of such mutations and provided a clear view of one such excited state. Several different sets of mutations (Fig. 4P–V,AA–AF) in the region 199–203 converged to a chemical reactivity profile that was distinct from the wild type. The effects of single mutations and the reactivity perturbations could be explained by formation of the crystallographic P4a conformation, which is shifted in register by a single nucleotide from the dominant solution conformation shift-P4a. This register shift model was additionally confirmed by double-mutant analysis and by demonstrating the recovery of the wild-type reactivity from a linear combination of measurements on mutants stabilizing the conformations. Notably, our approach is analogous to—but significantly faster than—recent mutation-coupled NMR methods for inferring and stabilizing excited states of RNA model systems (Dethoff et al. 2012).
Here, the “excited” state of the 126–235 RNA, present at 20% population, has the register observed in crystallography of the entire 16S rRNA (Fig. 5). Changes in solution condition such as temperature, Mg2+, or monovalent concentration would be expected to shift the populations of the dominant and excited state and any other states, offering the possibility of environmental sensing by the ribosome through this register shift; initial characterization of Mg2+ versus Na+ titrations lend support to the hypothesis that the same states are present, but with different populations, across a wide range of solution conditions (data not shown). Within the full ribosome, this functional helix register may be stabilized by tertiary interactions with the rest of the 16S rRNA or with ribosomal proteins (Supplemental Fig. S6B,C). Indeed, the 1D SHAPE profile of full-length 16S rRNA from previous study resembles P4a-stabilized mutants at G204 (Fig. 1D). An A-minor interaction between G203-C214 and A465 is observed in crystallographic structure (Supplemental Fig. S6B), suggesting that this tertiary contact may stabilize the P4a conformation in full-length 16S rRNA context. The small ribosomal protein S20 can also bind the 126–235 region, and it plays a crucial role in stabilizing this region of the 5′ domain (Rydén-Aulin et al. 1993; Brodersen et al. 2002). These scenarios suggest a novel checkpoint for ribosome assembly based on locking the P4a/shift-P4a register shift and should be resolvable through future experiments. More generally, the mutate-map-rescue pipeline holds promise for discovering and validating excited states for other RNAs, especially if the throughput of double mutation can be increased and if inference of a structure ensemble from the available data can be fully automated.
A general mutate-map-rescue (M2R) pipeline
This study has delineated an expansion of conventional chemical mapping that enables systematic inference, testing, and refinement of RNA structure domains, including the correction of prior misleading inferences and possibility of inferring excited states. Although unusually detailed for a chemical mapping study, the entire mutate-map-rescue pipeline described herein was carried out with the same commercially available reagents, equipment, and synthesis strategy as our standard high-throughput chemical mapping protocol (Kladwang et al. 2011b; Lucks et al. 2011). With current technologies, the presented pipeline is generally applicable to noncoding RNA domains up to 300 nucleotides in length. Use of random mutagenesis or modification, and deconvolution through paired-end next-generation sequencing, may allow routine extension to longer transcripts and to RNAs in vivo (Cheng et al. 2014). We therefore propose that this mutate-map-rescue approach can be generally adopted as a “best practice” for finalizing RNA models inferred from chemical mapping.
MATERIALS AND METHODS
RNA synthesis
Double-stranded DNA templates were prepared by PCR assembly of DNA oligomers with maximum length of 60 nt ordered from IDT (Integrated DNA Technologies). DNA templates contain a 20-nt T7 RNA polymerase promoter sequence (TTCTAATACGACTCACTATA) on the 5′ end, followed by sequence of interest. One hairpin with single-stranded buffering region was added on both ends to flank the region of interest. A 20-nt Tail2 sequence (AAAGAAACAACAACAACAAC) was put on the 3′ end (Supplemental Table S1). The assembly schemes for all constructs were designed by an automated MATLAB script (design_primers, available at https://github.com/DasLab/NA_thermo) (Kladwang et al. 2011b).
PCR reactions, consisting of 200 pmol of terminal primers and 2 pmol of internal primers, were carried out as previously described (Kladwang et al. 2011b). PCR products were purified using Ampure XP magnetic beads (Agencourt) on a 96-well Greiner microplate format following the manufacturer's instructions. DNA concentration were measured by UV absorbance on Nanodrop 1000 spectrophotometer (Thermo Scientific). DNA templates were verified by sequencing (PAN core facility, Stanford University). In vitro transcription reactions were described previously (Kladwang et al. 2011b), followed by same purification and quantification steps as DNA. Sequences and purities of RNA samples were confirmed by reverse transcription in presence of each ddNTP.
Chemical modification
One-dimensional chemical mapping, mutate-and-map (M2), and mutation/rescue were carried out in 96-well format as described previously (Kladwang et al. 2011a,b; Cordero et al. 2014). Prior to chemical modification, 1.2 pmol of RNA was heated and cooled to remove secondary structure heterogeneity (90°C for 2 min and cooled on ice for 2 min) and folded for 20 min at 37°C in 15 μL of one of the following buffers as noted in the text: 10 mM MgCl2, 50 mM Na-HEPES, pH 8.0 (our standard) (Kladwang et al. 2011b); 5 mM MgCl2, 200 mM KOAc, 50 mM Na-HEPES, pH 8.0 (Deigan et al. 2009); 10 mM MgCl2, 100 mM NaCl, 50 mM Na-HEPES, pH 8.0 (Wilkinson et al. 2006); or 50 mM Na-HEPES, pH 8.0.
RNA was modified by adding 5 μL of modification reagent (0.5% dimethyl sulfate [DMS] prepared by mixing 1 μL 10.5 M DMS into 9 μL ethanol, and then 190 μL water; 21 mg/mL 1-cyclohexyl-[2-morpholinoethyl] carbodiimide metho-p-toluene sulfonate [CMCT]; 5 mg/mL 1-methyl-7-nitroisatoic anhydride [1M7]; or 12 mg/mL N-methylisatoic anhydride [NMIA]) (Merino et al. 2005; Mortimer and Weeks 2007; Tijerina et al. 2007; Cordero et al. 2012a). Doubly deionized H2O or anhydrous DMSO was used as background control. Modification reactions were incubated at room temperature for 20 min and then quenched appropriately (5 μL of 0.5 M Na-MES, pH 6.0 for SHAPE and CMCT or 2-mercaptoethanol for DMS). All modifiers were made fresh before use. Quenches also included 1 μL poly(dT) magnetic beads (Ambion) and 0.065 pmols of FAM-labeled Tail2-A20 primer (A20-GTTGTTGTTGTTGTTTCTTT) for reverse transcription. Samples were separated and purified using magnetic stands, washed with 100 μL 70% ethanol twice, and air-dried. Beads were resuspended in 5.0 μL reverse transcription mix, then incubated for 30 min at 55°C. RNAs were degraded by adding 5 μL 0.4 M NaOH and incubating for 3 min at 90°C. Solutions were cooled down on ice then neutralized with 5 μL acid quench (1.4 M NaCl, 0.6 M HCl, and 1.3 M NaOAc). Fluorescent-labeled cDNA was recovered by magnetic bead separation, rinsed twice with 40 μL 70% ethanol, and air-dried. The beads were resuspended in 10 μL Hi-Di formamide (Applied Biosystems) with 0.0625 μL ROX-350 ladder (Applied Biosystems) and eluted for 20 min. Supernatants were loaded to capillary electrophoresis sequencer (ABI3100). Sequencing ladders were prepared analogously, without any chemical modification but with inclusion of each 2′-3′-dideoxy-NTP (ddNTP) equimolar to each dNTP during reverse transcription.
To verify sequence assignments in downstream analysis, an additional “coloaded” sample composed of each sequencing ladder (5 μL), and cDNA derived from SHAPE-probed RNA (5 μL) was also measured. RNA chemical mapping using an alternative deep-sequencing readout was carried out analogously to the method above but included an additional ligation step to permit Illumina sequencing (Seetin et al. 2014).
Data processing and structural modeling
The HiTRACE software package version 2.0 was used to analyze CE data (MATLAB toolbox is available at https://github.com/hitrace) (Yoon et al. 2011), and a web server is also available at http://hitrace.org (Kim et al. 2013). Electrophoretic traces were aligned and baseline subtracted using linear and nonlinear alignment routines as previously described (Kim et al. 2009). Sequence assignment was accomplished manually with verification from sequencing ladders and the coloaded samples. Band intensities were obtained by fitting profiles to Gaussian peaks and integrating.
Rigorous normalization, correction for signal attenuation, and background subtraction were enabled by inclusion of referencing hairpin loop residues (GAGUA) at both 5′ and 3′ ends, 10× dilution replicates, and no-modification controls (get_reactivities in HiTRACE). Briefly, values for saturated peaks were obtained from 10× dilutions. Signal attenuation was corrected from 5′ to 3′ ends based on the relative reactivity between 5′ and 3′ referencing hairpin loop intensities. Reactivities of all the chemical profile were normalized against GAGUA (Kladwang et al. 2014). For most comparisons, the average of reactivities in each of the two GAGUA hairpins were set to two for best comparison with previously reported data (Deigan et al. 2009).
Data-driven secondary structure models were obtained using the Fold program of the RNAstructure package (Mathews et al. 2004; Reuter and Mathews 2010). For secondary structure models guided by 1D chemical mapping, pseudoenergy slope and intercept parameters of 2.6 kcal/mol and −0.8 kcal/mol (RNAstructure version 5.4) (Mathews et al. 2004) or, where stated, 1.8 kcal/mol and −0.6 kcal/mol (version 5.5) (Hajdin et al. 2013) were used. To obtain 2D-data-guided secondary structure models, Z-score matrices for M2 data sets were calculated as previously described (Kladwang et al. 2011b). Briefly, Z-scores were calculated for each nucleotide reactivity by subtracting the average reactivity of this nucleotide across all mutants and dividing by standard deviation (output_Zscore_from_rdat in HiTRACE). M2 seeks to identify release of putative base-pair partners of a nucleotide upon mutation; therefore, negative Z-scores and positions with high average reactivity (cutoff is 0.8) were excluded. Background subtraction and signal attenuation correction were not applied to M2 data, since Z-scores are independent of those steps (which would otherwise introduce noise). Z-score matrices were used as base-pair-wise pseudoenergies with a slope and intercept of 1.0 kcal/mol and 0 kcal/mol (Kladwang et al. 2011b).
Helix-wise confidence values were calculated via bootstrapping as described previously: Mock data sets were generated by sampling the mutants with replacement and comparing the helices of the resulting mock-data-driven models with those in the model obtained using the full data (Kladwang et al. 2011b). An independent analysis using the QuSHAPE software was performed following given instructions (Karabiber et al. 2013). In all modeling steps, full-length sequences (including flanking elements) were used for prediction.
Structural equilibrium fitting
Equilibrium fractions of each structure were determined by assuming that shift-P4a-stabilized and P4a-stabilized double mutants completely stabilize the register-shifted and crystallographic structure, respectively; their reactivity profiles therefore represent the reactivity profile for each state. The reactivities of shift-P4a-stabilized double mutants and P4a-stabilized double mutants were taken to fit the wild-type reactivity by χ2 score, which is calculated as follows:
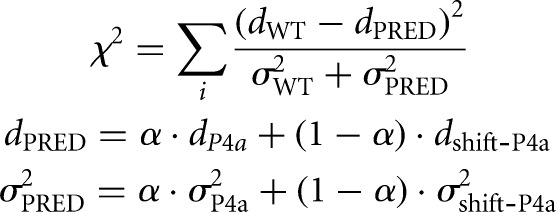 |
Where dWT, dP4a, and dshift-P4a are mean SHAPE reactivity profiles of wild-type, P4a-stabilized, and shift-P4a-stabilized double mutants, and σWT, σP4a, and σshfit-P4a are errors (standard deviation across A199U/U218A, A199C/U218G, G201U/U216A, G201C/U216G, G203U/C214A, G203C/C214G for P4a; and A199U/U219A, A199C/U219G, G201U/C217A, G201C/C217G, G203U/C215A, G203C/C215G for shift-P4a) of dWT, dP4a, and dshift-P4a. The parameter α is the fraction of P4a register shift, ranging from 0 to 1. χ2 is summed over all or a subset of nucleotide positions i as specified in the text. χ2 scores are plotted against α, and the α value with minimum χ2 is taken as the best fit. Fitting with a third state was carried out analogously, optimizing over the weight α on the P4a-stabilized state for each tested value of the weight β on a third state; SHAPE reactivities from mutants C175G, C176G, A199C, C207G, and C215G were tested for the third state.
Structural visualization
Secondary structure images were generated by VARNA (Darty et al. 2009). The atomic model of crystallographic data from PDB entry 3I1M (Zhang et al. 2009) was visualized in PyMol (The PyMOL Molecular Graphics System, Version 1.5.0.4; Schrödinger, LLC.). Noncanonical base-pairing and long-range interactions were mapped with tool at the RNA 3D Hub (Petrov et al. 2013). Secondary structure diagram in Leontis/Westhof nomenclature (Leontis and Westhof 2001) was drawn in Illustrator (Adobe).
DATA DEPOSITION
All chemical mapping data sets, including one-dimensional mapping, mutate-and-map, and mutation/rescue, have been deposited at the RNA Mapping Database (http://rmdb.stanford.edu) (Cordero et al. 2012b) under the following accession codes: 16SFWJ_STD_0001, 16SFWJ_1M7_0001, 16SFWJ_NMIA_0001, 16SFWJ_DMS_0001, and 16SFWJ_RSQ_0001.
SUPPLEMENTAL MATERIAL
Supplemental material is available for this article.
Supplementary Material
ACKNOWLEDGMENTS
We acknowledge financial support from a Stanford Graduate Fellowship (S.T.), a Conacyt fellowship (P.C.), the Burroughs Wellcome Foundation (CASI to R.D.), and NIH R01 R01GM102519. We thank members of the Das laboratory for comments on the manuscript.
Footnotes
Article published online ahead of print. Article and publication date are at http://www.rnajournal.org/cgi/doi/10.1261/rna.044321.114.
Freely available online through the RNA Open Access option.
REFERENCES
- Adilakshmi T, Lease RA, Woodson SA. 2006. Hydroxyl radical footprinting in vivo: mapping macromolecular structures with synchrotron radiation. Nucleic Acids Res 34: e64. [DOI] [PMC free article] [PubMed] [Google Scholar]
- Amaral PP, Dinger ME, Mercer TR, Mattick JS. 2008. The eukaryotic genome as an RNA machine. Science 319: 1787–1789 [DOI] [PubMed] [Google Scholar]
- Breaker RR. 2012. Riboswitches and the RNA world. Cold Spring Harb Perspect Biol 4: a003566. [DOI] [PMC free article] [PubMed] [Google Scholar]
- Brodersen DE, Clemons WM Jr, Carter AP, Wimberly BT, Ramakrishnan V. 2002. Crystal structure of the 30 S ribosomal subunit from Thermus thermophilus: structure of the proteins and their interactions with 16 S RNA. J Mol Biol 316: 725–768 [DOI] [PubMed] [Google Scholar]
- Cheng C, Chou F-C, Kladwang W, Tian S, Cordero P, Das R. 2014. MOHCA-seq: RNA 3D models from single multiplexed proximity-mapping experiments. bioRxiv http://dx.doi.org/10.1101/004556 [Google Scholar]
- Cordero P, Kladwang W, VanLang CC, Das R. 2012a. Quantitative dimethyl sulfate mapping for automated RNA secondary structure inference. Biochemistry 51: 7037–7039 [DOI] [PMC free article] [PubMed] [Google Scholar]
- Cordero P, Lucks JB, Das R. 2012b. An RNA Mapping DataBase for curating RNA structure mapping experiments. Bioinformatics 28: 3006–3008 [DOI] [PMC free article] [PubMed] [Google Scholar]
- Cordero P, Kladwang W, VanLang CC, Das R. 2014. A mutate-and-map protocol for inferring base pairs in structured RNA. Methods Mol Biol 1086: 53–77 [DOI] [PMC free article] [PubMed] [Google Scholar]
- Darty K, Denise A, Ponty Y. 2009. VARNA: interactive drawing and editing of the RNA secondary structure. Bioinformatics 25: 1974–1975 [DOI] [PMC free article] [PubMed] [Google Scholar]
- Das R, Kudaravalli M, Jonikas M, Laederach A, Fong R, Schwans JP, Baker D, Piccirilli JA, Altman RB, Herschlag D. 2008. Structural inference of native and partially folded RNA by high-throughput contact mapping. Proc Natl Acad Sci 105: 4144–4149 [DOI] [PMC free article] [PubMed] [Google Scholar]
- Deigan KE, Li TW, Mathews DH, Weeks KM. 2009. Accurate SHAPE-directed RNA structure determination. Proc Natl Acad Sci 106: 97–102 [DOI] [PMC free article] [PubMed] [Google Scholar]
- Dethoff EA, Petzold K, Chugh J, Casiano-Negroni A, Al-Hashimi HM. 2012. Visualizing transient low-populated structures of RNA. Nature 491: 724–728 [DOI] [PMC free article] [PubMed] [Google Scholar]
- Ding F, Lavender CA, Weeks KM, Dokholyan NV. 2012. Three-dimensional RNA structure refinement by hydroxyl radical probing. Nat Methods 9: 603–608 [DOI] [PMC free article] [PubMed] [Google Scholar]
- Efron B, Halloran E, Holmes S. 1996. Bootstrap confidence levels for phylogenetic trees. Proc Natl Acad Sci 93: 13429. [DOI] [PMC free article] [PubMed] [Google Scholar]
- Gilbert SD, Love CE, Edwards AL, Batey RT. 2007. Mutational analysis of the purine riboswitch aptamer domain. Biochemistry 46: 13297–13309 [DOI] [PMC free article] [PubMed] [Google Scholar]
- Grover R, Sharathchandra A, Ponnuswamy A, Khan D, Das S. 2011. Effect of mutations on the p53 IRES RNA structure: implications for de-regulation of the synthesis of p53 isoforms. RNA Biol 8: 132–142 [DOI] [PubMed] [Google Scholar]
- Hajdin CE, Bellaousov S, Huggins W, Leonard CW, Mathews DH, Weeks KM. 2013. Accurate SHAPE-directed RNA secondary structure modeling, including pseudoknots. Proc Natl Acad Sci 110: 5498–5503 [DOI] [PMC free article] [PubMed] [Google Scholar]
- Haller A, Soulière MF, Micura R. 2011. The dynamic nature of RNA as key to understanding riboswitch mechanisms. Acc Chem Res 44: 1339–1348 [DOI] [PubMed] [Google Scholar]
- Henkin TM. 2008. Riboswitch RNAs: using RNA to sense cellular metabolism. Genes Dev 22: 3383–3390 [DOI] [PMC free article] [PubMed] [Google Scholar]
- Huang Q, Purzycka KJ, Lusvarghi S, Li D, LeGrice SFJ, Boeke JD. 2013. Retrotransposon Ty1 RNA contains a 5′-terminal long-range pseudoknot required for efficient reverse transcription. RNA 19: 320–332 [DOI] [PMC free article] [PubMed] [Google Scholar]
- Karabiber F, McGinnis JL, Favorov OV, Weeks KM. 2013. QuShape: rapid, accurate, and best-practices quantification of nucleic acid probing information, resolved by capillary electrophoresis. RNA 19: 63–73 [DOI] [PMC free article] [PubMed] [Google Scholar]
- Kertesz M, Wan Y, Mazor E, Rinn JL, Nutter RC, Chang HY, Segal E. 2010. Genome-wide measurement of RNA secondary structure in yeast. Nature 467: 103–107 [DOI] [PMC free article] [PubMed] [Google Scholar]
- Kim J, Yu S, Shim B, Kim H, Min H, Chung EY, Das R, Yoon S. 2009. A robust peak detection method for RNA structure inference by high-throughput contact mapping. Bioinformatics 25: 1137–1144 [DOI] [PubMed] [Google Scholar]
- Kim H, Cordero P, Das R, Yoon S. 2013. HiTRACE-Web: an online tool for robust analysis of high-throughput capillary electrophoresis. Nucleic Acids Res 41: W492–W498 [DOI] [PMC free article] [PubMed] [Google Scholar]
- Kladwang W, Das R. 2010. A mutate-and-map strategy for inferring base pairs in structured nucleic acids: proof of concept on a DNA/RNA helix. Biochemistry 49: 7414–7416 [DOI] [PubMed] [Google Scholar]
- Kladwang W, Cordero P, Das R. 2011a. A mutate-and-map strategy accurately infers the base pairs of a 35-nucleotide model RNA. RNA 17: 522–534 [DOI] [PMC free article] [PubMed] [Google Scholar]
- Kladwang W, VanLang CC, Cordero P, Das R. 2011b. A two-dimensional mutate-and-map strategy for non-coding RNA structure. Nat Chem 3: 954–962 [DOI] [PMC free article] [PubMed] [Google Scholar]
- Kladwang W, VanLang CC, Cordero P, Das R. 2011c. Understanding the errors of SHAPE-directed RNA structure modeling. Biochemistry 50: 8049–8056 [DOI] [PMC free article] [PubMed] [Google Scholar]
- Kladwang W, Mann TH, Becka A, Tian S, Kim H, Yoon S, Das R. 2014. Standardization of RNA chemical mapping experiments. Biochemistry 53: 3063–3065 [DOI] [PMC free article] [PubMed] [Google Scholar]
- Kwok CK, Ding Y, Tang Y, Assmann SM, Bevilacqua PC. 2013. Determination of in vivo RNA structure in low-abundance transcripts. Nat Commun 4: 2971. [DOI] [PubMed] [Google Scholar]
- Leonard CW, Hajdin CE, Karabiber F, Mathews DH, Favorov OV, Dokholyan NV, Weeks KM. 2013. Principles for understanding the accuracy of SHAPE-directed RNA structure modeling. Biochemistry 52: 588–595 [DOI] [PMC free article] [PubMed] [Google Scholar]
- Leontis NB, Westhof E. 2001. Geometric nomenclature and classification of RNA base pairs. RNA 7: 499–512 [DOI] [PMC free article] [PubMed] [Google Scholar]
- Lucks JB, Mortimer SA, Trapnell C, Luo S, Aviran S, Schroth GP, Pachter L, Doudna JA, Arkin AP. 2011. Multiplexed RNA structure characterization with selective 2′-hydroxyl acylation analyzed by primer extension sequencing (SHAPE-Seq). Proc Natl Acad Sci 108: 11063–11068 [DOI] [PMC free article] [PubMed] [Google Scholar]
- Macnaughton TB, Wang YJ, Lai MM. 1993. Replication of hepatitis δ virus RNA: effect of mutations of the autocatalytic cleavage sites. J Virol 67: 2228–2234 [DOI] [PMC free article] [PubMed] [Google Scholar]
- Mathews DH, Disney MD, Childs JL, Schroeder SJ, Zuker M, Turner DH. 2004. Incorporating chemical modification constraints into a dynamic programming algorithm for prediction of RNA secondary structure. Proc Natl Acad Sci 101: 7287–7292 [DOI] [PMC free article] [PubMed] [Google Scholar]
- McGinnis JL, Dunkle JA, Cate JHD, Weeks KM. 2012. The mechanisms of RNA SHAPE chemistry. J Am Chem Soc 134: 6617–6624 [DOI] [PMC free article] [PubMed] [Google Scholar]
- Merino EJ, Wilkinson KA, Coughlan JL, Weeks KM. 2005. RNA structure analysis at single nucleotide resolution by selective 2′-hydroxyl acylation and primer extension (SHAPE). J Am Chem Soc 127: 4223–4231 [DOI] [PubMed] [Google Scholar]
- Mills DR, Kramer FR. 1979. Structure-independent nucleotide sequence analysis. Proc Natl Acad Sci 76: 2232–2235 [DOI] [PMC free article] [PubMed] [Google Scholar]
- Mitra S, Shcherbakova IV, Altman RB, Brenowitz M, Laederach A. 2008. High-throughput single-nucleotide structural mapping by capillary automated footprinting analysis. Nucleic Acids Res 36: e63. [DOI] [PMC free article] [PubMed] [Google Scholar]
- Mortimer SA, Weeks KM. 2007. A fast-acting reagent for accurate analysis of RNA secondary and tertiary structure by SHAPE chemistry. J Am Chem Soc 129: 4144–4145 [DOI] [PubMed] [Google Scholar]
- Nudler E, Mironov AS. 2004. The riboswitch control of bacterial metabolism. Trends Biochem Sci 29: 11–17 [DOI] [PubMed] [Google Scholar]
- Pan J, Woodson SA. 1998. Folding intermediates of a self-splicing RNA: mispairing of the catalytic core. J Mol Biol 280: 597–609 [DOI] [PubMed] [Google Scholar]
- Pang PS, Elazar M, Pham EA, Glenn JS. 2011. Simplified RNA secondary structure mapping by automation of SHAPE data analysis. Nucleic Acids Res 39: e151. [DOI] [PMC free article] [PubMed] [Google Scholar]
- Petrov AI, Zirbel CL, Leontis NB. 2013. Automated classification of RNA 3D motifs and the RNA 3D Motif Atlas. RNA 19: 1327–1340 [DOI] [PMC free article] [PubMed] [Google Scholar]
- Quarrier S, Martin JS, Davis-Neulander L, Beauregard A, Laederach A. 2010. Evaluation of the information content of RNA structure mapping data for secondary structure prediction. RNA 16: 1108–1117 [DOI] [PMC free article] [PubMed] [Google Scholar]
- Ramachandran S, Ding F, Weeks KM, Dokholyan NV. 2013. Statistical analysis of SHAPE-directed RNA secondary structure modeling. Biochemistry 52: 596–599 [DOI] [PMC free article] [PubMed] [Google Scholar]
- Reuter J, Mathews D. 2010. RNAstructure: software for RNA secondary structure prediction and analysis. BMC Bioinformatics 11: 129. [DOI] [PMC free article] [PubMed] [Google Scholar]
- Rice GM, Leonard CW, Weeks KM. 2014. RNA secondary structure modeling at consistent high accuracy using differential SHAPE. RNA 20: 846–854 [DOI] [PMC free article] [PubMed] [Google Scholar]
- Russell R, Zhuang X, Babcock HP, Millett IS, Doniach S, Chu S, Herschlag D. 2002. Exploring the folding landscape of a structured RNA. Proc Natl Acad Sci 99: 155–160 [DOI] [PMC free article] [PubMed] [Google Scholar]
- Rydén-Aulin M, Shaoping Z, Kylsten P, Isaksson LA. 1993. Ribosome activity and modification of 16S RNA are influenced by deletion of ribosomal protein S20. Mol Microbiol 7: 983–992 [DOI] [PubMed] [Google Scholar]
- Seetin MG, Kladwang W, Bida JP, Das R. 2014. Massively parallel RNA chemical mapping with a reduced bias protocol. Methods Mol Biol 1086: 95–117 [DOI] [PubMed] [Google Scholar]
- Siegfried NA, Weeks KM, Steen K-A. 2011. Selective 2′-hydroxyl acylation analyzed by protection from exoribonuclease (RNase-detected SHAPE) for direct analysis of covalent adducts and of nucleotide flexibility in RNA. Nat Protoc 6: 1683–1694 [DOI] [PMC free article] [PubMed] [Google Scholar]
- Sükösd Z, Swenson MS, Kjems J, Heitsch CE. 2013. Evaluating the accuracy of SHAPE-directed RNA secondary structure predictions. Nucleic Acids Res 41: 2807–2816 [DOI] [PMC free article] [PubMed] [Google Scholar]
- Tijerina P, Mohr S, Russell R. 2007. DMS footprinting of structured RNAs and RNA-protein complexes. Nat Protoc 2: 2608–2623 [DOI] [PMC free article] [PubMed] [Google Scholar]
- Underwood JG, Uzilov AV, Katzman S, Onodera CS, Mainzer JE, Mathews DH, Lowe TM, Salama SR, Haussler D. 2010. FragSeq: transcriptome-wide RNA structure probing using high-throughput sequencing. Nat Methods 7: 995–1001 [DOI] [PMC free article] [PubMed] [Google Scholar]
- Vasa SM, Guex N, Wilkinson KA, Weeks KM, Giddings MC. 2008. ShapeFinder: a software system for high-throughput quantitative analysis of nucleic acid reactivity information resolved by capillary electrophoresis. RNA 14: 1979–1990 [DOI] [PMC free article] [PubMed] [Google Scholar]
- Walczak R, Westhof E, Carbon P, Krol A. 1996. A novel RNA structural motif in the selenocysteine insertion element of eukaryotic selenoprotein mRNAs. RNA 2: 367–379 [PMC free article] [PubMed] [Google Scholar]
- Watts JM, Dang KK, Gorelick RJ, Leonard CW, Bess JW Jr, Swanstrom R, Burch CL, Weeks KM. 2009. Architecture and secondary structure of an entire HIV-1 RNA genome. Nature 460: 711–716 [DOI] [PMC free article] [PubMed] [Google Scholar]
- Wells SE, Hughes JMX, Igel AH, Ares M Jr. 2000. Use of dimethyl sulfate to probe RNA structure in vivo. Methods Enzymol 318: 479–493 [DOI] [PubMed] [Google Scholar]
- Wenger CD, Lee MV, Hebert AS, McAlister GC, Phanstiel DH, Westphall MS, Coon JJ. 2011. Gas-phase purification enables accurate, multiplexed proteome quantification with isobaric tagging. Nat Methods 8: 933–935 [DOI] [PMC free article] [PubMed] [Google Scholar]
- Wilkinson KA, Merino EJ, Weeks KM. 2006. Selective 2′-hydroxyl acylation analyzed by primer extension (SHAPE): quantitative RNA structure analysis at single nucleotide resolution. Nat Protoc 1: 1610–1616 [DOI] [PubMed] [Google Scholar]
- Wu HN, Huang ZS. 1992. Mutagenesis analysis of the self-cleavage domain of hepatitis δ virus antigenomic RNA. Nucleic Acids Res 20: 5937–5941 [DOI] [PMC free article] [PubMed] [Google Scholar]
- Yoon S, Kim J, Hum J, Kim H, Park S, Kladwang W, Das R. 2011. HiTRACE: high-throughput robust analysis for capillary electrophoresis. Bioinformatics 27: 1798–1805 [DOI] [PubMed] [Google Scholar]
- Zhang W, Dunkle JA, Cate JHD. 2009. Structures of the ribosome in intermediate states of ratcheting. Science 325: 1014–1017 [DOI] [PMC free article] [PubMed] [Google Scholar]
- Zhang J, Lau MW, Ferré-D'Amaré AR. 2010. Ribozymes and riboswitches: modulation of RNA function by small molecules. Biochemistry 49: 9123–9131 [DOI] [PMC free article] [PubMed] [Google Scholar]
Associated Data
This section collects any data citations, data availability statements, or supplementary materials included in this article.