

Abstract
For the past 30 y, data have suggested that unique islet populations exist, based on morphology and glucose sensitivity. Yet little has been done to determine the mechanism of these functional differences. The purpose of this study was to determine whether human islets were comprised functionally unique populations, and to elucidate a possible mechanism. Islets or pancreatic sections from 29 human donors were analyzed. Islets were isolated and measured for insulin secretion, cell composition and organization, insulin and glucagon granule density and insulin content. Insulin secretion was significantly greater in small compared with large islets. In sectioned human pancreata, β-cells comprised a higher proportion of the total endocrine cells in small islets (63%) than large islets (39%). A higher percentage of β-cells in small islets contacted blood vessels (44%) compared with large islets (31%). Total insulin content of isolated human islets was significantly greater in the small (1323 ± 512 μIU/IE) compared with large islets (126 ± 48 μIU/IE). There was less immunostaining for insulin in the large islets from human pancreatic sections, especially in the core of the islet, compared with small islets. The results suggest that differences in insulin secretion between large and small islets may be due to a higher percentage of β-cells in small islets with more β-cells in contact with blood vessels and a higher concentration of insulin/β-cell in small islets.
Keywords: blood vessels, glucagon, human, insulin, islet morphology, islets, lymphatics, α-cell, β-cell
Introduction
While the Islets of Langerhans were first described in 1869, there is still much about their biology that is not understood.1 Basic islet biology has lagged behind other cell biology fields, partially because human islets are difficult to obtain and they are comprised of thousands of small endocrine cell clusters surrounded by exocrine tissue, as opposed to a large solid organ like the liver.
Morphometrical analysis, first reported in 19472 and followed with many subsequent papers, showed differences in size distribution, number and volume of islets from several species3-7 including humans.8,9 In 1980 Bonner-Weir reported two size-dependent populations of islets (large and small) with unique distributions, growth rates and β-cell granularity suggesting functionally distinct populations.10 Little was done to elucidate the islet populations until the architectural variations based on size were published in 2010.9 At about the same time, we documented several differences between the large and small rat islets that could partially explain why isolated small islets secreted more insulin per volume.11
The current study builds on decades of research describing functional differences between large and small islets. The study tests different hypotheses to begin to identify an underlying mechanism for the functional differences. Several hypotheses were put forward. First islet architecture may result in a more efficient secretion of insulin. For example, the location of the β-cells (near blood vessels or the outer capsule) could result in greater measured insulin secretion in small islets compared with large. Additionally, small islets may have a higher percentage of β-cells than large islets. Alternatively differences in individual β-cells within islets, such as insulin content, could be different in small vs. large islets.
Results
Insulin secretion
Static insulin secretion experiments illustrated a difference in the insulin secretion in large and small islets in low glucose (3 mM) or high glucose (16.7 mM). Small and large islets secreted the same amount of insulin in low glucose, but in high glucose the small islets secreted >2 times more insulin than large islets (Fig. 1A). The insulin secretion data was normalized both to cell numbers (as shown in Fig. 1A) and to islet equivalents (IE) (not shown), and the results were not different.

Figure 1. Insulin secretion. Isolated islets were separated into small and large populations based on diameter. (A) In static insulin secretion experiments, the large islets released less insulin in low (3 mM) and high (16.7 mM) glucose. (n = 5 separate incubation from different donors, run in triplicate; *p < 0.01). (B) In perifusion experiments, islets were exposed to low glucose (3 mM) at time 0 for 30 min, and aliquots were removed for analysis every 10 min. Subsequently, the islets were exposed to high glucose for 1 h with a return to low glucose conditions. At each time point, the small islets secreted more insulin than the large ones (n = 7 trials using different donor islets; p < 0.001).
Separate perifusion experiments illustrated the same differences between the islet populations. For 30 min, human islets were exposed to low glucose (3 mM) and the insulin secreted from the islets was collected every 10 min. The perfusate was then switched to a high glucose concentration (16.7 mM) and returned to low glucose 60 min later. At each time point measured, the small human islets secreted more insulin than the large (Fig. 1B). Normalization with islet equivalents (IE) resulted in the same finding.
The results of the insulin secretion studies point to several possible hypotheses for the higher insulin secretion levels in small islets when compared with large islets. The hypotheses tested in this study are (1) more β-cells on the surface or near blood vessels in small islets result in more efficient insulin secretion, (2) a higher percentage of β-cells in small islets results in greater total insulin secretion or (3) greater insulin content per each β-cell in small islets. The following experiments were designed to test these hypotheses.
Cell location affects secretion
The organization of the β-cells within the large and small islets could theoretically affect their ability to secrete insulin efficiently. The two populations of islets have very different cellular arrangements with the β-cells of the small islets clustered in the center of the islet, while the α-, β- and δ-cells of the large islets more evenly distributed throughout the islet (Fig. 2A). Because it is known that the outer layers of cells (the mantle) can be lost during the isolation procedure,11 all analysis of the architecture of the islets was completed in situ using serial sections to identify the center of the islet (by analyzing the section with the largest islet diameter). In 287 islets analyzed from six donors, 87% of the small islets were organized with core β-cell distribution surrounded by α- and δ-cells. In contrast, only 7.5% of the large islets contained such an organizational pattern. The majority of the large islets were comprised of mixed endocrine cell organization throughout the islet (Fig. 2A).

Figure 2. Endorcine cell location. (A) Large islets displayed a random pattern of α- (red), β- (green) and δ- (blue) cells within the islet. In contrast, small islets predominantly showed a clustering of β-cells within the core of the islet with α-and δ-cells forming the periphery. Scale bar = 100μm. (B) Blood vessel penetration into, and around, large and small islets was determined by staining with anti-CD31 (red). In the representative image, β-cells were identified with anti-insulin staining (green). (C) Cell composition of islets (in situ) demonstrated that small islets had a higher percentage of β-cells than large islets (n = 804 cells from 78 islets from 5 donors; *p < 0.001).
Based on the hypothesis that cell location in relationship to blood vessels was an important characteristic that could affect the efficiency of insulin secretion, the endocrine cell type directly in contact with blood vessels was analyzed using previously published methods.9 Figure 2B illustrates the structure of the blood vessels (red) entering a typical large and small islet. Additional evidence is provided in the supplemental materials showing vessels (red) penetrating large and small islets stained with hematoxylin and eosin. There were statistically fewer β-cells (green) in direct contact with blood vessels in large islets compared with small islets, summarized in Figure 2C. There was no statistical difference in the proportion of α- or δ-cells contacting blood vessels in the two islet populations (Fig. 2C).
Location of a β-cell to a blood vessel did not alone indicate directional release of insulin. Triple labeling pancreatic sections for insulin, proinsulin and blood vessels illustrated the intracellular distribution of insulin within each β-cell in relationship to nearby blood vessels. Figure 3A shows the vessels (blue) traversing the islet with the insulin (green) located within the β-cells on the side of the cell in contact with the vessel. Proinsulin (orange) was predominantly located on the opposite side of each cell.
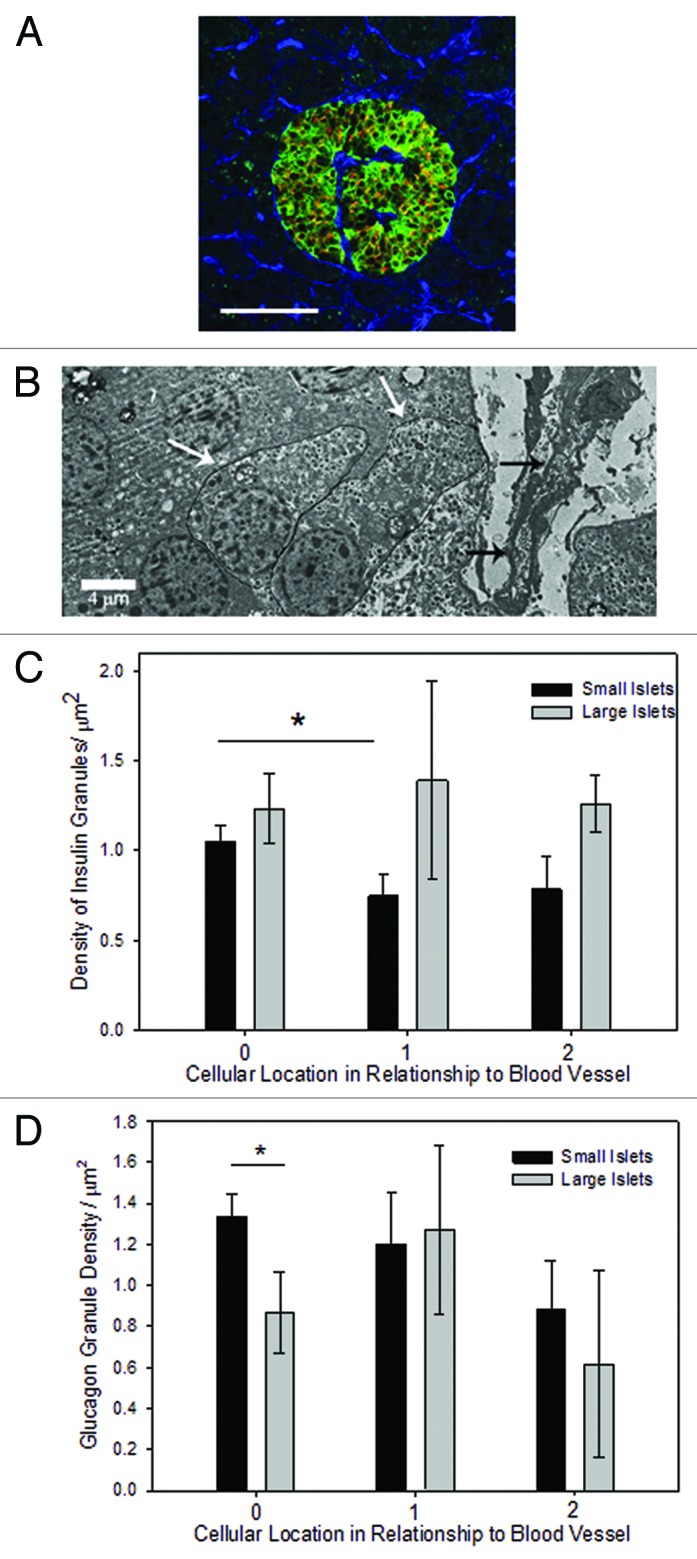
Figure 3. Granule density related to blood vessels. (A) Triple labeling with antibodies to insulin (green), proinsulin (orange), and vessels (with CD34, blue) revealed the cellular pattern of insulin localized to the side of the β-cell near the blood vessel and proinsulin on the opposite side. Scale bar is 100 μm. (B) A typical electron micrograph shows a penetrating blood vessel (black arrows) into a small islet. The white arrows identify a β-cell adjacent to the blood vessel and one cell away. (C) The density of insulin granules in β-cells adjacent to a blood vessel was not statistically different between small and large islets. However, there was a lower density in β-cells one cell away from the vessel compared with adjacent cells but only in the small islets. (n = 79 cells from 17 islets; *p < 0.05). (D) The density of glucagon granules was higher in α-cells adjacent to a blood vessel from small islets compared to one cell away (n = 82 cells from 17 islets; *p < 0.05).
Electron microscopy was used to quantify the density of insulin and glucagon granules in cells relative to their location near blood vessels (Fig. 3B). In small islets there was a significant relationship between the insulin granule density and the location of the cell relative to the nearest blood vessel. Insulin granule density per cell had a statistically significant difference between cells adjacent to blood vessels and those one cell away from blood vessels in small islets (Fig. 3C). Insulin granule densities per cell between one and two cells away from the nearest blood vessel did not show a significant difference. In contrast, there were no statistically significant differences in the density of insulin granules in relationship to the location of the β-cell and nearby blood vessels in large islets (Fig. 3C). Likewise, there was no difference in glucagon granule density in large or small islets in relationship to nearby blood vessels (Fig. 3D), but there were fewer granules near blood vessels in large islets.
Islets are surrounded by a robust lymphatic system,12,13 demonstrated in Figure 4A, showing lymphatics (green) and glucagon staining (red). Our data, as well as other studies, show that the lymphatics mostly surround the islet and do not penetrate it. Thus, using EM images, the insulin and glucagon granule density was calculated in relationship to the islet’s outer capsule, which is in contact with the lymphatic vessels. There was no statistically significant difference between insulin granule density and distance to capsule in small islets, but in large islets there was a significantly greater density in cells that were a cell away from the capsule (Fig. 4B). There was no difference in the glucagon granule density and distance to a capsule (Fig. 4C).
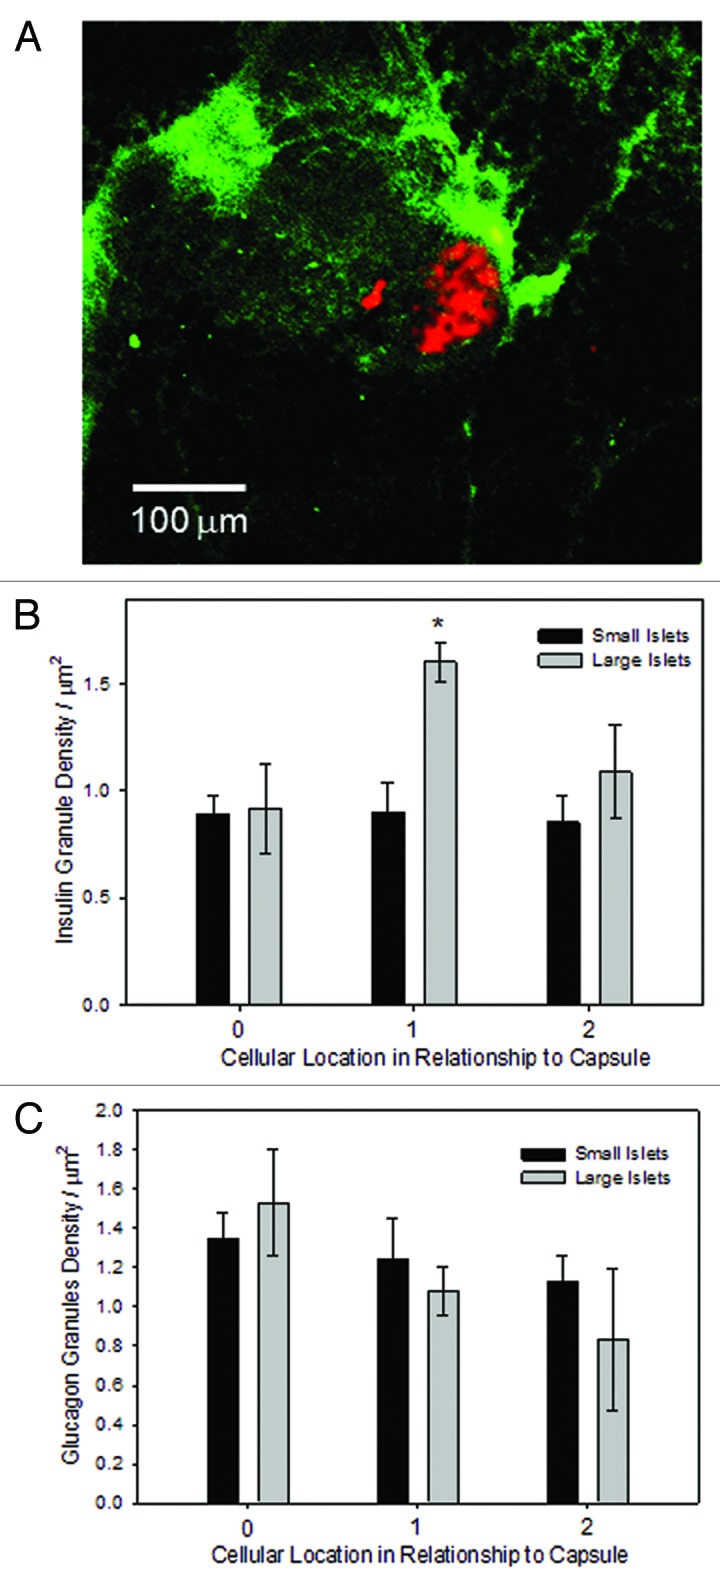
Figure 4. Granule density related to the capsule. (A) Lymphatic tree staining was accomplished with LIVE1 antibodies (green), counterstained for glucagon identifying the location of the islet (red), using fresh pancreatic sections. Scale bar is 100 μm. (B) The density of insulin granules in β-cells was consistent across groups, with the exception of β-cells in large islets located one cell away from the capsule (n = 79 cells from 17 islets; *indicates increase compared with all other groups, p < 0.01) . (C) There was no difference in the density of glucagon granules between small and large islets in relationship to the outer capsule (n = 103 cells from 19 islets).
Islet cell composition affects insulin secretion
It is clear in the examples shown in Figure 2A, that the percentage of β-cells (compared with α- and δ-cells) was lower in the large islets than small islets. This difference could account for the more efficient release of insulin from small islets compared with large. Serial sections were analyzed at the point of largest islet diameter, to ensure that counts were made across the core of the islet, for the total number of α-, β- and δ-cells. Figure 5 summarizes the differences in cell composition between large and small islets. Small islets contained a significantly higher proportion of β-cells than large islets and significantly fewer α-cells. There was no statistically significant difference in the percentage of δ-cells between groups.
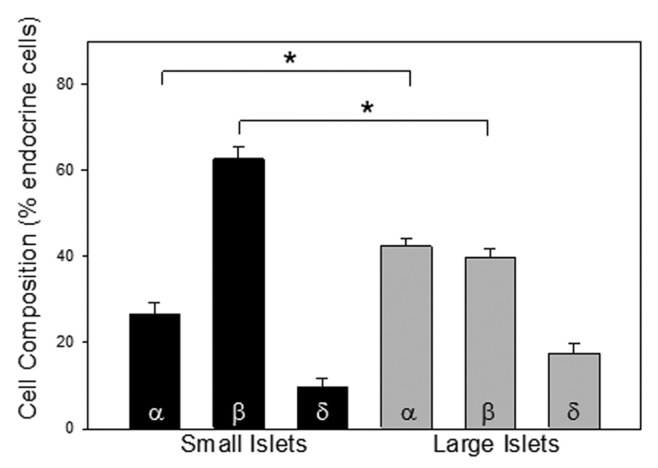
Figure 5. Cell composition. Islets were stained for α-cells (anti-glucagon), β-cells (anti-insulin) and δ-cells (anti-somatostatin). The percentage of each is plotted for small and large islets. There was a significantly greater percentage of α-cells and a lower percentage of β-cells in the large islets (n = 402 cells 6 donors, *p < 0.001).
Insulin content greater in small islets
With a higher proportion of β-cells in small islets, we hypothesized that small islets might have more stored insulin per volume than large islets. In fact, isolated small islets had significantly more total insulin content compared with large islets (Fig. 6A). In order to determine if the same difference held true for islets prior to isolation, pancreatic sections were analyzed for insulin antibody staining intensity as we have published previously.11 All images were compared within the same sections, due to the inherent variations in staining intensity between sections. Figure 6B illustrates the darker insulin staining of the small islet compared with the neighboring large islet. The average intensity of the insulin staining per islet was significantly greater in the small islets. In fact, the small islets had 40.4 ± 7.7% more insulin staining/islet than large islets (Fig. 6C). This was partially due to the vast areas found within the large islet sections that held blood vessels and the lower percentage of β-cells in the large islets (as noted in Fig. 6B, arrow), which were less prominent in small islets. Obviously, the regions devoid of β-cells could have skewed the results, lowering the average islet insulin staining.
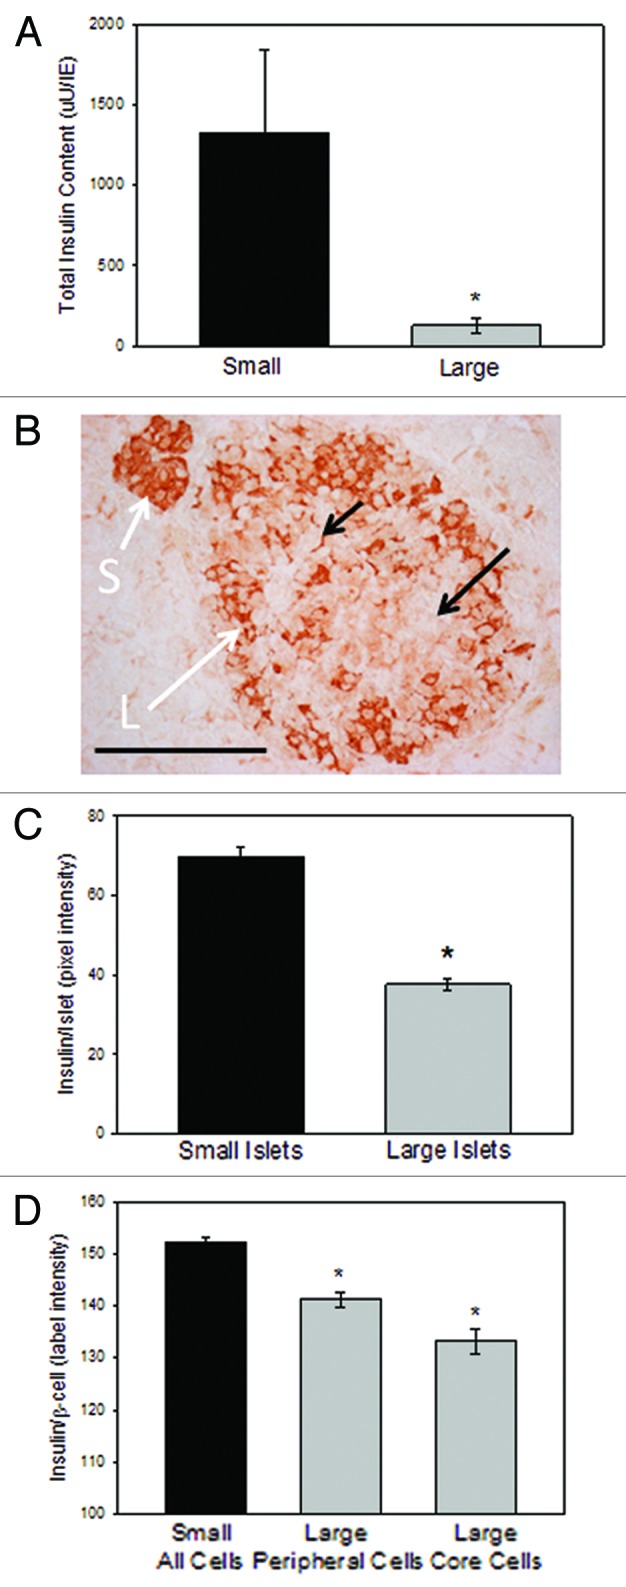
Figure 6. Insulin content in vitro and in situ. (A) Total insulin content within isolated islets was greater in small islets than large ones. n = 3 separate preparations from 3 different donors (*p < 0.02). (B) A typical image of a large and small islet within the same section shows the lighter insulin staining (brown) in the large islets compared with the small ones, and individual β-cells with lighter staining in the core of the large islet. Scale bar = 100 μm. (C) Islets (n = 45 islets from 4 donors) were categorized as large or small based on their largest diameter and the average insulin staining (measured as arbitrary pixel values) were recorded. Small islets had significantly more insulin/islet (*p < 0.001) (D) Insulin intensity measurements made of individual β-cells shows less insulin in the cells located in the core of the large islet than either the mantle cells of the large islet or the β-cells of the small islets (n = 171 β-cells from 5 donors, *p < 0.05).
Subsequently, we reanalyzed the images by comparing the average insulin staining of 420 individual β-cells. The individual β-cells within the small islets had statistically more insulin immuno-reactivity than β-cells of large islets (p < 0.05). Interestingly, in the large islets, the β-cells on the mantle contained more insulin than the core β-cells. Figure 6B shows the darker cellular insulin staining in the small islet, and the gradient of insulin staining from the outer layers of the large islet to the inner core. The data were plotted in Figure 6D showing that the outer layer of β-cells in the large islets had significantly more insulin than the β-cells in the core, and all of the cells of the large islets had statistically less insulin than the cells of the small islets.
In order to be certain that the gradient of insulin intensity was not an artifact of the immunostaining process, we repeated these experiments using three different antibody dilutions with two different substrate systems as described in the methods section. All results were identical, regardless of the methods utilized.
Discussion
As described eloquently by Heller, human islets have many distinct features when compared with islets of other species.14 Heller explained that in humans and non-human primates the endocrine cells are arranged in a relatively random organization. In contrast, in some fish, rodents, and amphibians, the β-cells are clustered into the center of the islet with glucagon and somatostatin-positive cells on the mantle.14 The data presented here along with a recent publication from another lab9 challenge the concept that all human islets have the same basic architecture. Rather, islets fall into two general categories based on their diameter and other morphological features. We present data that support the hypothesis that the morphologically unique islet populations also have important functional differences and the differences are not limited to in vitro characteristics but are likely present in vivo.
The architectural differences between large and small human islets noted in this paper are in agreement with the findings recently published by others, as Kaihoh was the first to show conclusively that small human islets were made of a higher percentage of β-cells when compared with large islets, but they did not link their observation to functional differences.15 Bosco et al. found that human pancreatic sections double-stained for insulin and glucagon showed different morphologies based on the size of the islets.9 Small islets (they defined as 40–60 μm in diameter) showed a segregated cell distribution with α-cells on the outer mantle and β-cells in the core. In bigger islets the cells were more randomly arranged, as we showed in Figure 2A. Maintaining the normal islet morphology with a-cells on the mantle appears to have important implications, even in islet transplantation.16
In the past 10 years, evidence has suggested that functionally unique islet populations existed in animals and humans.4 We have previously shown that large rat islets released very little insulin under low or high glucose when normalized for volume.17,18 Those findings were replicated in human islets by others with the same results.19,20 More recently proinsulin mRNA was analyzed in large and small human islets.21 Only small islets increased insulin synthesis in response to glucose stimulation. Large islets (>300 μm in diameter) did not respond to high glucose with an increase in proinsulin mRNA. However, the authors concluded that the likely cause of poor performance by the large islets was due to central core necrosis associated with isolation and dismissed any discussion that there could be inherent differences in the islets in vivo.21
The existence of core cell death after isolation due to a powerful diffusion barrier in large islets has been shown.11,17,19,22,23 However, we have previously demonstrated that reduction of the diffusion barrier halted core cell death in large islets but did not improve insulin secretion.18 Those results, along with the in situ findings presented here, add new complexity when considering the poor insulin secretion from large islets. While core cell death certainly accounts for some of the failure of isolated large islets to respond, our results suggest that differences in insulin levels are present even prior to isolation (Fig. 2; Fig. 4; Fig. 6).
For the first time, this paper begins to unravel some of the possible reasons for the enhanced insulin secretion from small human islets. In situ, it is clear that small islets contain a higher percentage of β-cells compared with α- or δ-cells. The β-cells within small islets each contain significantly more insulin/cell than large islets. This translates to more insulin immunostaining per small islet when compared with large. Further, there are architectural differences that may enhance insulin secretion from small islets. The blood vessels that infiltrate small islets are surrounded by more β-cells than vessels within large islets, although the density of insulin granules in the cells contacting the blood vessels was not different from cells in other locations.
Continued exploration of the functional, genetic and proteomic differences between subpopulations of islets is important, not only to obtain a deeper understanding of the endocrine function of the pancreas, but also for researchers working with stem cells, regenerated islets or reprogrammed cells to expand islet-like tissue for people with diabetes. It is unlikely that the existence of subpopulations of islets with distinct functions found in a variety of mammals has no physiological relevance. Biology rarely produces functionally distinct clusters of cells for no reason. Without a full appreciation of the varying roles of subpopulations of islets, cellular interventions to prevent or cure diabetes will likely be only partially successful.
Materials and Methods
Isolated islet retrieval and separation
Human tissues from five different suppliers were obtained from 29 non-diabetic human donors. The samples were obtained from the Integrated Islet Distribution Program, the Midwest Organ Transplant Network, the University of Kansas Tissue Repository, the National Institute of Child Health and Human Development Brain and Tissue Bank and BetaPro. Isolated islets were obtained from 23 donors and pancreatic sections obtained from 6 donors. Fifty-nine percent of the donors were female, and the donors had an average age of 42.6 ± 2.78 y. The average BMI (when provided) was 30.4 ± 1.8. Causes of death varied with 40% caused by strokes, 25% from trauma and 15% caused by heart attacks. The remaining donors died of various causes.
Isolated islets were maintained in CMRL 1066 medium with 2 mM glutamine, 10% FBS and 1% antibiotic/antimycotic at 37 °C in a culture chamber containing 5% CO2. Automated separation was performed using the Complex Object Parametric Analyzer and Sorter (COPAS, Union Biometrica). We have previously reported using the COPAS for automated separation of rat islets.18,23 We optimized the instrument for the size range of the islets to be sorted by setting the sampling conditions (photomultiplier tube setting, gain, gate and sort parameters and regions). When COPAS sorting was not applicable, islets were sorted manually. The diameter of the islets was recorded for calculating total islet volume using light microscopy. Islet equivalents (IE) were calculated from duplicate samples of each batch of islets. Individual islets were counted and their diameters measured. For irregularly shaped islets, two to four diameter measurements were taken at different locations on the islet and averaged. Islet volumes were calculated and converted to IE for the sample and the entire islet fraction. Based on our previous reports on the functional differences between large and small rat islets, we defined small islets as <125 μm diameter and large islets >150 μm.17,18 Islets between 125 to 150 μm diameter were excluded from analysis, in order to obtain clean population groupings.
Immunofluorescence staining
Using published procedures, paraffin-embedded 7–8 μm thick pancreatic tail sections from six human donors were deparaffinized/rehydrated in xylene followed by ethanol and PBS, pH 7.4.11 Antigen was retrieved using a steamer (30 min) in Shandon plastic spill-free slide jar (Thermo Scientific, 3 1001362) containing 0.01M citrate buffer, pH 6.2, with 0.002M EDTA. After cooling for 20 min, slides were washed in PBS and permeabilized in1.0% Triton X-100 in 0.1M PBS for 30 min. Slides were rinsed again in PBS, and sections of interest were encircled with a PAP pen. Sections were blocked in 10% normal donkey serum, 1.0% BSA and 0.03% Triton X-100 diluted in 0.1 M PBS for 30 min. Incubation with the primary antibody mix was performed at 4 °C overnight in a wet chamber followed by incubation with the mix of fluorophore conjugated secondary antibodies at room temperature for 2 h in a wet chamber protected from light. Both primary and secondary antibodies were diluted in 1% NDS, 1% BSA and 0.03% Triton X-100. After washing, slides were mounted with anti-fading agent Gel/Mount (Biomeda, PA, M01). In some cases DAPI (0.5 μg/ml, Molecular Probes, D1306) staining to reveal nuclei followed the secondary antibody labeling.
Because some of the antibodies, namely LYVE1, work best on non-fixed tissue, sections of pancreas were dissected into 10 × 10 mm pieces. Freshly prepared fluorescent-labeled primary antibody mix was injected in the pancreatic pieces. Anti-LYVE1 antibody (Abcam, ab14917) was used as lymphatic vessel marker and anti-glucagon antibody (Abcam, ab10988) was used to detect α-cells located on the islet surface. Both antibodies had been tagged with a fluorophore using APEX Alexa Fluor 488 Antibody Labeling Kit (Invitrogen, Molecular probes, A10468) or Zenon Alexa Fluor 568 Mouse IgG1 Labeling Kit (Invitrogen, Molecular probes, Z25006), respectively, according to manufacturer protocols. Fresh pancreatic pieces were injected with the antibodies, allowed to equilibratefor 1–2 h and imaged using a Fluoview Confocal Microscope (Olympus).
Primary antibodies used were the following: anti-insulin (1:100, Abcam, ab7842; 1:100, Santa Cruz Biotechnology, sc-9168), anti-glucagon (1:200, Abcam, ab10988), anti-CD31 (1:100, Chemicon–Millipore, 90214), anit-proinsulin (1:200, Abcam, ab50805), CD34 (1:200, Abcam 1b812894) and anti-somatostatin (1:200, Abcam, ab53165). Corresponding secondary antibodies were conjugated with Cy2 (1:200, Jackson ImmunoResearch Laboratories Inc., 706-225-148), Alexa 647 (1:400, Molecular Probes, A31573), Alexa 555 (1:400, Molecular Probes, A31570) or DyLight 488 (1:400, Jackson ImmunoResearch Laboratories Inc., 706-485-148). Images were obtained on an Olympus Fluoview confocal microscope or a Nikon C1Si or a C1Plus confocal microscope. Images were acquired using 10×–100× objectives (depending on the experiment) and analyzed using FluoView or Ps Adobe Photoshop CZ4 software.
Immunohistochemistry
Insulin immunohistochemistry (IHC) was completed on paraffin-embedded tissue sections using anti-insulin (1:100, Santa Cruz Biotechnology, Inc., sc-9168) and Vectastain Elite ABC kit (Vector Laboratories, PK-6101) in combination with 3,3′-diaminobenzidine (DAB) peroxidase substrate kit (Vector Laboratories, SK-4100). The DAB colorimetric substrate yields a red-brown, insoluble end product whose intensity is proportional to the amount of antigen. After staining, slides were dehydrated in xylene and placed on coverslips in Permount mounting medium (Fisher Scientific, S15-100). To confirm the results, another staining process, using the Histostain Plus Rabbit Primary system (Invitrogen, 85-6143) containing 3-amino-9-ethyl-carbazole AEC chromogenic substrate yielding pink-red color, was used. Three different dilutions of the insulin antibody (1:50, 1:100, 1:200) were applied to consecutive sections on the slides. Sections were immersed in incubation solution to avoid any potential artifact of irregular staining resulting from incomplete section coverage. The specificity of insulin immunoreactivity was confirmed by omitting the primary antibody. Images were collected on a Nikon Eclipse 80i microscope and analyzed with Adobe Photoshop CS4 extended software, by determining the average pixel intensity per cell or per islet. Background staining was subtracted from each value. Slides were counterstained with hematoxylin. Supplemental Images shown were stained with hematoxylin and eosin.
Cell composition
To determine the cell composition, a well-established protocol was followed.11 The relative proportion of immuno-labeled endocrine cells (α, β and δ) in pancreatic sections through the core of the islet was evaluated by counting the number of individual types of cells and dividing by the total sum of endocrine cells per islet. DAPI staining of nuclei was used to count the total cell number in the preparation. Cells were defined as peripheral, if any portion of the cell formed the border of the islet/exocrine interaction. The percentage of α, β, and δ cells in contract with blood vessels were calculated by counting the number of each cell type in closest to a vessel.
Islet viability
Islet viability was measured using methods we have previously published.17 Standard viability fluorophores, Sytox (Invitrogen, S348591, μM) and calcein (Invitrogen, C1430, 0.5 μM), were incubated with islets for 15–30 min at 37 °C. For apoptosis assay, islets were incubated in YO-PRO-1 and propidium iodide (Vybrant Apoptosis Assay, Invitrogen, V13243) for 30 min at 37 °C. For either assay, islets were rinsed and imaged using the Olympus Fluoview 300 confocal microscope within 20 min. Islet diameters and perimeters were calculated using Olympus software.
Electron microscopy
Electron microscopy was conducted using 2 mm sections of pancreatic tissue fixed in 2% glutaraldehyde as previously published.23 Samples were rinsed twice in 0.1 M sodium cacodylate buffer for 10 min prior to post fixation in 1% osmium tetroxide for 1 h. Rinsing with distilled water was followed by a graded ethanol dehydration (30%, 70%, 80%, 95%, 100%) for 10 min each. Samples were rinsed twice in propylene oxide for 15 min prior to being infiltrated in a mixture of propylene oxide and Embed 812 resin (Electron Microscopy Sciences) overnight. BEEM capsules were used to embed the samples in fresh resin prior to curing overnight in a 70 °C oven. Thin sections, 80nm in diameter, were cut using a Leica UCT ultramicrotome and placed on 300 mesh thin bar grids. Contrast was applied to the sections by adding uranyl acetate followed by Sato’s lead stain. Images of human pancreatic islets were captured from random tissue sections using a J.E.O.L JEM 1400 transmission electron microscope.
Analysis of the EM images included measurement of the insulin and glucagon granule density. Images were processed and analyzed in Adobe Photoshop (Adobe Systems, Inc.). Cell surface area was determined by outlining the cell boundaries and calculating the area using the histogram tool. Insulin granules were then counted manually per cell in each micrograph. Granule density (granules/cell surface area) was measured on two different occasions by two lab members and the inter-rater reliability was determined, and presented in the supplemental materials.
Insulin secretion
Insulin secretion was measured from islets using static incubation and islet perifusion procedures. For static incubation, 20 islets of each islet subpopulation were distributed in 24-well plates and incubated for 30 min in fresh media containing either 3 mM glucose or 20 mM glucose. Triplicate wells for each condition were tested. Islet equivalency values were calculated for each well and medium samples were withdrawn from each well to assay for insulin content using ELISA kit (ALPCO, Mercodia) as we have published previously.18
Perifusion experiments were conducted on small and large islets, preincubated for 90 min in RPMI 1640 medium containing 10% FBS and 3 mM glucose at 37 °C with 5% CO2. After preincubation, the islets were incubated in the glucose perifusion system with a constant flow rate (500 μl/min) at 37 °C for 90 min including: 30 min of low glucose (3 mM) followed by 60 min of high glucose concentration (20 mM) and 30 min of low glucose concentration (3 mM). During the perifusion, samples of medium with insulin released by islets were collected from the output fraction every 10 min starting with the last 10 min of the first low glucose exposure. Samples were frozen at −80 °C. At the end of the perifusion, the islets were harvested and frozen at −80 °C. The total protein in the islets was extracted by acid ethanol (0.18 M HCl in 95% ethanol). The released insulin and the total intracellular insulin amounts of large and small islets were determined using ELISA (ALPCO).
Statistics
For all experiments with more than two groups, one-way ANOVA on ranks (Kruskal-Wallis) followed by Dunn’s pairwise comparisons was used. A t-test was used to compare total insulin content and insulin immunoreactivity. For the other immunostaining experiments, nested ANOVA was used. Perifusion experiments were analyzed with a repeated measures ANOVA. All figures include means ± SE. P value, defined as <0.05, was considered statistically significant.
Supplementary Material
Acknowledgments
We wish to thank all of our islet and tissue suppliers, especially the Integrated Islet Distribution Program (IIDP), the Midwest Organ Transplant Network and the University of Kansas Tissue Repository, with special thanks to BetaPro LLC for working with the authors to obtain optimal tissues. We appreciate the work done by Barbara Fegley and Dr. Tiffany Schwasinger-Schmidt for their assistance in obtaining the electron micrographs. The work was funded by grants from the Emilie Rosebud Diabetes Research Foundation (L.S.B.) and the Institute for the Advancement of Medical Innovation (L.S.B.).
Author’s contributions are as follows: B.F. designed some experiments, collected data and assisted with writing of manuscript; A.A. completed EM analysis and assisted with the design and analysis of the experiments; K.R. analyzed insulin secretion and insulin content experiments and assisted with writing; S.J.W. processed islets, completed experiments and contributed to discussion; H.H. designed and completed experiments and reviewed manuscript; D.Z. assisted with data analysis and manuscript preparation; L.N. completed tissue processing, image acquisition, data analysis and manuscript preparation; I.D. assisted with tissue collection, data analysis and manuscript preparation; L.S.B. designed experiments, completed data analysis and wrote the manuscript. All authors reviewed the manuscript.
Supplementary Material
Supplementary materials may be found here:
http://www.landesbioscience.com/journals/islets/article/24780
References
- 1.Bloomfield AL. A bibliography of internal medicine; diabetes mellitus-from Rollo (1798) to Banting (1921) AMA Arch Intern Med. 1958;101:1159–71. doi: 10.1001/archinte.1958.00260180149017. [DOI] [PubMed] [Google Scholar]
- 2.Haist R, Pugh E. Volume measurements of the Islets of Langerhans and the effects of age and fasting. Am J Physiol. 1947;152:36–41. doi: 10.1152/ajplegacy.1947.152.1.36. [DOI] [PubMed] [Google Scholar]
- 3.Bonnevie-Nielsen V, Skovgaard LT. Pancreatic islet volume distribution: direct measurement in preparations stained by perfusion in situ. Acta Endocrinol (Copenh) 1984;105:379–84. doi: 10.1530/acta.0.1050379. [DOI] [PubMed] [Google Scholar]
- 4.Aizawa T, Kaneko T, Yamauchi K, Yajima H, Nishizawa T, Yada T, et al. Size-related and size-unrelated functional heterogeneity among pancreatic islets. Life Sci. 2001;69:2627–39. doi: 10.1016/S0024-3205(01)01332-7. [DOI] [PubMed] [Google Scholar]
- 5.White SA, Hughes DP, Contractor HH, London NJ. A comparison of cross sectional surface area densities between adult and juvenile porcine islets of Langerhans. Horm Metab Res. 1999;31:519–24. doi: 10.1055/s-2007-978787. [DOI] [PubMed] [Google Scholar]
- 6.Baetens D, Malaisse-Lagae F, Perrelet A, Orci L. Endocrine pancreas: three-dimensional reconstruction shows two types of islets of langerhans. Science. 1979;206:1323–5. doi: 10.1126/science.390711. [DOI] [PubMed] [Google Scholar]
- 7.Elayat AA, el-Naggar MM, Tahir M. An immunocytochemical and morphometric study of the rat pancreatic islets. J Anat. 1995;186:629–37. [PMC free article] [PubMed] [Google Scholar]
- 8.Cabrera O, Berman DM, Kenyon NS, Ricordi C, Berggren P-O, Caicedo A. The unique cytoarchitecture of human pancreatic islets has implications for islet cell function. Proc Natl Acad Sci U S A. 2006;103:2334–9. doi: 10.1073/pnas.0510790103. [DOI] [PMC free article] [PubMed] [Google Scholar]
- 9.Bosco D, Armanet M, Morel P, Niclauss N, Sgroi A, Muller YD, et al. Unique arrangement of α- and β-cells in human islets of Langerhans. Diabetes. 2010;59:1202–10. doi: 10.2337/db09-1177. [DOI] [PMC free article] [PubMed] [Google Scholar]
- 10.Bonner-Weir S, Like AA. A dual population of islets of Langerhans in bovine pancreas. Cell Tissue Res. 1980;206:157–70. doi: 10.1007/BF00233616. [DOI] [PubMed] [Google Scholar]
- 11.Huang HH, Novikova L, Williams SJ, Smirnova IV, Stehno-Bittel L. Low insulin content of large islet population is present in situ and in isolated islets. Islets. 2011;3:6–13. doi: 10.4161/isl.3.1.14132. [DOI] [PMC free article] [PubMed] [Google Scholar]
- 12.Pepin J, Singh H, Pairent FW, Appert HE, Howard JM. A study of insulin secretion in thoracic duct lymph of the dog. Ann Surg. 1970;172:56–60. [PMC free article] [PubMed] [Google Scholar]
- 13.Rasio EA, Hampers CL, Soeldner JS, Cahill GF., Jr. Diffusion of glucose, insulin, inulin, and Evans blue protein into thoracic duct lymph of man. J Clin Invest. 1967;46:903–10. doi: 10.1172/JCI105596. [DOI] [PMC free article] [PubMed] [Google Scholar]
- 14.Heller RS. The comparative anatomy of islets. Adv Exp Med Biol. 2010;654:21–37. doi: 10.1007/978-90-481-3271-3_2. [DOI] [PubMed] [Google Scholar]
- 15.Kaihoh T, Masuda T, Sasano N, Takahashi T. The size and number of Langerhans islets correlated with their endocrine function: a morphometry on immunostained serial sections of adult human pancreases. Tohoku J Exp Med. 1986;149:1–10. doi: 10.1620/tjem.149.1. [DOI] [PubMed] [Google Scholar]
- 16.Rackham CL, Jones PM, King AJ. Maintenance of islet morphology is beneficial for transplantation outcome in diabetic mice. PLoS One. 2013;8:e57844. doi: 10.1371/journal.pone.0057844. [DOI] [PMC free article] [PubMed] [Google Scholar]
- 17.MacGregor RR, Williams SJ, Tong PY, Kover K, Moore WV, Stehno-Bittel L. Small rat islets are superior to large islets in in vitro function and in transplantation outcomes. Am J Physiol Endocrinol Metab. 2006;290:E771–9. doi: 10.1152/ajpendo.00097.2005. [DOI] [PubMed] [Google Scholar]
- 18.Williams S, Huang HH, Kover K, Moore W, Berkland C, Singh M, et al. Reduction of diffusion barriers in isolated islets improves survival, but not insulin secretion or transplantation outcome. Organogenesis. 2010;6:115–24. doi: 10.4161/org.6.2.10373. [DOI] [PMC free article] [PubMed] [Google Scholar]
- 19.Lehmann R, Zuellig RA, Kugelmeier P, Baenninger PB, Moritz W, Perren A, et al. Superiority of small islets in human islet transplantation. Diabetes. 2007;56:594–603. doi: 10.2337/db06-0779. [DOI] [PubMed] [Google Scholar]
- 20.Fujita Y, Takita M, Shimoda M, Itoh T, Sugimoto K, Noguchi H, et al. Large human islets secrete less insulin per islet equivalent than smaller islets in vitro. Islets. 2011;3:1–5. doi: 10.4161/isl.3.1.14131. [DOI] [PubMed] [Google Scholar]
- 21.Omori K, Mitsuhashi M, Todorov I, Rawson J, Shiang K-D, Kandeel F, et al. Microassay for glucose-induced preproinsulin mRNA expression to assess islet functional potency for islet transplantation. Transplantation. 2010;89:146–54. doi: 10.1097/TP.0b013e3181c4218d. [DOI] [PMC free article] [PubMed] [Google Scholar]
- 22.O’Sullivan ES, Johnson AS, Omer A, Hollister-Lock J, Bonner-Weir S, Colton CK, et al. Rat islet cell aggregates are superior to islets for transplantation in microcapsules. Diabetologia. 2010;53:937–45. doi: 10.1007/s00125-009-1653-8. [DOI] [PMC free article] [PubMed] [Google Scholar]
- 23.Williams SJ, Schwasinger-Schmidt T, Zamierowski D, Stehno-Bittel L. Diffusion into human islets is limited to molecules below 10 kDa. Tissue Cell. 2012;44:332–41. doi: 10.1016/j.tice.2012.05.001. [DOI] [PubMed] [Google Scholar]
Associated Data
This section collects any data citations, data availability statements, or supplementary materials included in this article.