

Abstract
What basic visual structures underlie human face detection and how can we extract such structures directly from the amplitude of neural responses elicited by face processing? Here, we address these issues by investigating an extension of noise‐based image classification to BOLD responses recorded in high‐level visual areas. First, we assess the applicability of this classification method to such data and, second, we explore its results in connection with the neural processing of faces. To this end, we construct luminance templates from white noise fields based on the response of face‐selective areas in the human ventral cortex. Using behaviorally and neurally‐derived classification images, our results reveal a family of simple but robust image structures subserving face representation and detection. Thus, we confirm the role played by classical face selective regions in face detection and we help clarify the representational basis of this perceptual function. From a theory standpoint, our findings support the idea of simple but highly diagnostic neurally‐coded features for face detection. At the same time, from a methodological perspective, our work demonstrates the ability of noise‐based image classification in conjunction with fMRI to help uncover the structure of high‐level perceptual representations. Hum Brain Mapp 34:3101–3115, 2013. © 2012 Wiley Periodicals, Inc.
Keywords: face recognition, reverse correlation, fMRI
INTRODUCTION
Extensive research has focused on mapping out the neural resources involved in face processing [Gauthier et al., 2000; Haxby et al., 2000; Ishai et al., 2005; Kanwisher et al., 1997; Rossion et al., 2003] and on exploring how these resources enable various recognition tasks such as detection or individuation [Fox et al., 2009; Kriegeskorte et al., 2007; Nestor et al., 2011; Pourtois et al., 2005; Winston et al., 2004]. However, our understanding of the visual representations underlying recognition is far more limited. An obvious example in this sense is face detection: while the face selectivity of certain cortical areas, such as the fusiform face area (FFA), has been commonly associated with detection [Avidan et al., 2005; Freiwald et al., 2009; Loffler et al., 2005; Tong et al., 2000], it is still unclear how these areas are able to perform this function. Theoretically, uncovering the representational basis of face detection is critical in that detection precedes and constrains other face processing tasks [Liu et al., 2002; Or and Wilson, 2010; Tsao and Livingstone, 2008]. Methodologically though, uncovering the structure of neural representations poses a significant challenge.
A standard approach to exploring internal representations for visual recognition involves hypothesis‐testing. Specifically, one can select a biologically‐plausible recognition schema, adopt it as a model of neural processing and test its validity. For instance, a detection schema relying on image fragments [Ullman et al., 2002] has been tested with relative success as a model of neural face processing [Harel et al., 2007; Nestor et al., 2008]. However, this approach is limited by the specificity of the representational types assumed (e.g., do neural representations encode actual image fragments?) and by the difficulty of their interpretation (e.g., what properties of a fragment underlie its diagnosticity for face detection?)
Another approach, more challenging but less restrictive in terms of theoretical assumptions, involves reconstructing the relevant visual features rather than testing a specific class. Reverse correlation methods have been extensively employed to this effect in neurophysiology and behavioral research [Neri and Levi, 2006; Ringach and Shapley, 2004]. A family of such techniques, known as image classification [Abbey and Eckstein, 2002; Ahumada, 2002; Beard and Ahumada, 1998; Gold et al., 2000], achieve this goal by combining noise fields into a unique template based on the discrete responses they elicit. This template, referred to as a “classification image” (CI), serves as an approximation of the image structure that accounts best for a given set of responses. As the elements entering the construction of a CI are typically structure‐free (e.g., white noise fields), it is inferred that any significant structure apparent in the CI lies with the source of the responses, be that a single neuron or a behavioral subject. However, this approach is costly in terms of the number of trials needed and restrictive with respect to the type of features targeted, i.e., prominent, robust, simple features.
Here, we derive face detection templates by applying image classification to behavioral and neural responses recorded in the human ventral cortex. To deal with the challenge of applying noise‐based image classification to BOLD data, we consider several ways of optimizing the quality of our neurally‐derived CIs. First, we collected a relatively large number of trials by testing each subject across multiple scanning sessions (12–13). Second, we took advantage of the continuous nature of the BOLD signal by adapting a suitable version of image classification [Murray et al., 2002] to our data (i.e., a version not restricted to binary responses). Third, we used slow event trials allowing us to maximize the SNR of trial‐specific BOLD responses. Finally, we constructed CIs corresponding to face selective regions as established by an independent “localizer”. This fact is important in that standard image classification is based on a linearity assumption: the magnitude/likelihood of a response increases linearly with the presence of a particular image structure. Recent research shows that face‐selective areas, but not other high‐level visual areas, exhibit this property in response to faces [Davidenko et al., in press; Horner and Andrews, 2009] warranting the application of image classification to their responses.
Of note, face detection is a suitable domain for assessing the application of image classification to BOLD data. Faces, as a visual category, are remarkably homogeneous and, thus, likely to contain a few highly diagnostic detection features [Sinha, 2002]. The presence of such features and the robustness of their encoding are key factors in being able to derive meaningful visual features from BOLD data. Supporting this idea, a number of recent electroencephalography (EEG) and behavioral results [Hansen et al., 2010; Rieth et al., 2011; Smith et al., 2012] suggest that image classification is a viable and promising approach to the study of face perception (see Discussion).
As far as the regions targeted by our investigation are concerned, the FFA naturally holds particular interest. This is due not only to the prominent role played by the FFA in face perception [Kanwisher and Yovel, 2006] but also to its sensitivity to unconsciously processed face stimuli [Jiang and He, 2006] and even to stimuli erroneously expected to contain faces [Righart et al., 2010; Zhang et al., 2008]. These latter results are particularly relevant in that the ability of noise‐only trials to elicit activation in the FFA is critical for the application of image classification to FFA responses. At the same time, we note that it is important to extend such investigations, insofar that it is possible, beyond the FFA to other high‐level visual areas (and to other face‐selective regions in particular).
In short, our work explores the representational basis of face detection associated with neural face processing. In this context, the use of noise‐based image classification serves a twofold purpose by allowing us to uncover the basic image structures underlying face detection and, more generally, by providing the opportunity to assess the applicability of this method to fMRI.
METHODS
Subjects
Two young adults, EC and EA (both female, 22 years old), volunteered to participate in the experiment in exchange for payment. Subjects were right‐handed, with normal (or corrected‐to‐normal) vision and no history of neurological disorder. Both subjects provided written consents. All procedures were approved by the Institutional Review Board of Brown University.
Stimuli
An average face base image was constructed by combining multiple frontal‐view faces from the Max Plank Institute, Tübingen (MPIK) face dataset (the current version is available at http://faces.kyb.tuebingen.mpg.de)—see Figure 1. The database contains 200 Caucasian faces of different individuals with neutral expressions collected under consistent lighting conditions. We converted all faces to grayscale, cropped them, and normalized them with the position of the eyes and the nose. The base image was obtained by averaging individual faces along with their mirror symmetric versions and subsampling the resulting image to 38 × 32 pixels. The contrast of the base image was separately adjusted for each subject as described below (see Experimental paradigm).
Figure 1.
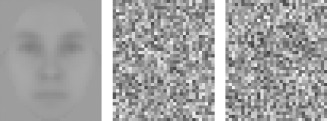
Base image (left) and examples of the two types of stimuli presented in the experiment: noise‐only (middle) and noise‐plus‐base image (right).
Experimental stimuli were constructed half of the time by adding white Gaussian noise to the base image and half of the time from noise only (see Fig. 1 for examples). Noise had a fixed root‐mean‐square (RMS) Weber contrast of 27%. The size of the contrast was maximized under the constraint that all pixel luminance values within two standard deviations of the mean fall within a displayable range. Values outside this interval were discarded and resampled on each trial. The stimuli subtended a visual angle of 4.4° × 5.2° after tripling the size of the images by pixel replication.
We note that the effective resolution of our stimuli is relatively low allowing us to minimize the size of the search space. While this restricts the use of high‐level frequencies in performing the task, it is unlikely to affect face detection in a critical manner given that the optimal band for face recognition in humans lies under 16 cycles per face width [Costen et al., 1996; Näsänen, 1999; Peli et al., 1994].
Stimulus design and presentation relied on Matlab 7.5 (Mathworks, Natick, MA) and the Psychophysics Toolbox 3 [Brainard, 1997; Pelli, 1997] running on an OS X Apple Macintosh.
Imaging Methods
Each subject was scanned for 12 (EC) and 13 (EA) 1‐h sessions completed on separate days. Scanning was carried out using a Siemens 3T TIM Trio magnet with a 32‐channel phased‐array head coil. Functional images were acquired with an echo‐planar imaging (EPI) pulse sequence (1.5 s TR; 36 ms TE; 90° flip angle; 2.23 mm voxels; 193.6 × 193.6 × 39.6 mm FOV; 18 oblique slices covering the ventral stream). To maximize similarity in brain coverage across sessions, an anatomical landmark was selected for the top slice of the partial volume for each subject. At the beginning of each session, we also acquired a T1‐weighted anatomical image (13 mm voxels; 160 slices of total size 256 × 240 mm).
Experimental Paradigm
Subjects performed a face detection task by discriminating noisy face stimuli from noise‐only stimuli (Fig. 1). Both subjects were informed that half of the time the stimuli contained a face embedded in noise in the attempt to minimize bias. They were also informed that the face was the same on all trials, that it was of the same size as the rectangular stimulus appearing on each trial and that it was centrally located within the rectangle. Neither subject was exposed at any time to a noise‐free version of the base image (i.e., they never saw the image shown in Fig. 1, left). Responses were made by pushing one of two buttons with the index fingers of both hands.
Each trial had the following structure: a high‐contrast fixation cross was displayed for 100 ms followed by a stimulus for 400 ms followed, in turn, by a lower‐contrast fixation cross for 10 s. Thus, the duration of each trial totaled 10.5 s.
During pilot testing, contrast thresholds for the base image corresponding to a 70% accuracy level were computed for each subject [Watson and Pelli, 1983]—4.5% and 4.2% RMS Weber contrast for EC and EA, respectively. Noise contrast was the same across subjects and sessions. Each subject was tested across multiple days prior to scanning in order to ensure no further learning would take place (as reflected by better accuracy or shorter reaction times).
Each scanning session contained five to seven face detection runs and each run consisted in 24 trials preceded by a 10.5 s fixation interval (for a total of 262.5 s). Trial order was pseudo‐randomized to maximize the uncertainty of stimulus category (noisy base image or just noise). Across sessions we collected a total of 1,920 and 2,136 face‐detection trials for EC and EA, respectively.
In addition, each session included one or two standard face‐localizer runs for a total of 14 and 15 runs for EC and EA, respectively. During the localizer subject performed a category‐unrelated task (monitoring for stimulus position) with faces, objects and scrambled images displayed in separate blocks. More specifically, each run contained nine blocks (three for each stimulus category), each block contained 15 trials and each trial consisted in 750 ms of stimulus presentation followed by 250 ms of fixation. Stimulus blocks were separated by 15 s of fixation. Additional fixation blocks were introduced at the beginning and at the end of each run. The order of stimulus block types was counterbalanced across runs and no stimulus of any type was repeated within a session. Stimuli subtended a visual angle of approximately 3.9° × 4.3° and were randomly displayed on the left/right side of the fixation cross. On each trial subjects pressed one of two buttons associated with each position (left/right). The duration of each run totaled 285 s.
In addition to identifying regions of interest (ROIs), the large number of localizers allowed us to verify the reproducibility of the ROIs and to obtain unbiased estimates of face selectivity in these regions [Kriegeskorte et al., 2010]. Critically, they also allowed us to monitor potential changes in the selectivity of these ROIs induced by a visually demanding task across numerous test sessions.
Conventional Analysis of Imaging Data
Preprocessing steps involved slice scan time correction, three‐dimensional motion correction, smoothing with a Gaussian kernel of 6 mm full‐width half maximum (FWHM), normalization to percent signal change and linear trend removal. All analyses were performed in the native space of each subject using AFNI [Cox, 1996] and custom Matlab code.
Face selective regions were localized through standard univariate analysis by contrasting blocks of faces and objects. Significance maps were corrected using the false discovery rate (q < 0.05). ROIs were further constrained by placing spherical masks (19 voxels) on the peak of each functionally defined area.
In addition to the high‐level visual areas mentioned above we also identified a control ROI in the calcarine sulcus of each participant. This early visual cortex (EVC) ROI was centered on the peak of another contrast, scrambled images versus objects and faces (q < 0.05), and was equated in terms of shape and size with the other ROIs. This particular region was chosen as a control ROI in order to assess the specificity of a number of effects to higher‐level visual cortex (i.e., face‐selective areas).
ROI mapping was performed using the first five localizer runs for each subject. Unbiased estimates of selectivity were computed using the remaining runs.
CI Computation
Trials with no behavioral response and trials scoring reaction times significantly shorter/longer than the mean (±2 SD) were discarded (5.6% and 8.8% for EC and EA). All analyses were performed on the remaining data.
Two classes of CIs were computed for each subject: behavioral CIs and neurally‐derived CIs (based on BOLD data). Behavioral CIs were constructed by combining noise fields across trials following a standard approach [Ahumada, 2002; Beard and Ahumada, 1998]:
| (1) |
The terms μFF and μNF denote the average noise fields on trials on which subjects responded “face” in the presence of a base image (hits) and in its absence (false alarms), respectively. Similarly, μFN and μNN denote the average noise fields on trials on which subjects responded “noise” in the presence of a base image (misses) and in its absence (correct rejections). Figure 2 details the construction of the CIs and the outcome of this procedure for each subject.
Figure 2.
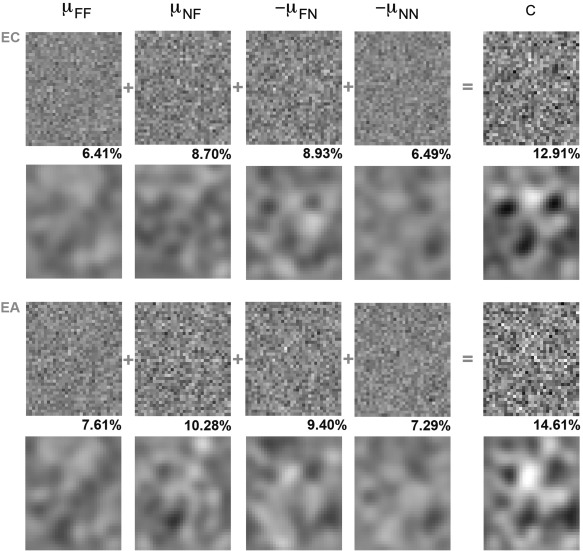
Intermediate results involved in the construction of behaviorally‐derived CIs: four different components corresponding to four types of trials are added to each other in order to estimate the internal template guiding behavioral responses (note that the polarity of μFN and μNN was flipped for ease of visualization and comparison with the other components). Smoothed components and CIs are displayed under their original (raw) versions. The RMS contrast of each raw image is separately computed for each component and CI. Results are separately shown for subjects EC (top) and EA (bottom).
The computation of neurally‐derived CIs was performed as follows (see also Fig. 3). First, we computed average ROI amplitudes for each trial, normalized them (by z‐scoring) and binned them separately by trial type (base image present/absent) and time point (1.5 through 10.5 s after stimulus onset). The size/number of bins is a parameter of the method—the results below were computed using a bin of size 0.4SD although smaller/larger bins produced similar results. Following this procedure every trial was labeled with its corresponding bin number (1 through 12 within the interval −2.4 to 2.4 SDs).
Figure 3.
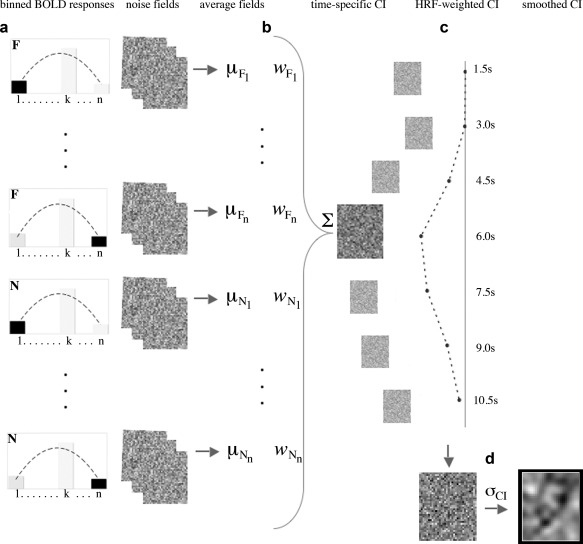
Procedure for the construction of neurally‐derived CIs: (a) noise fields are grouped and averaged based on ROI response amplitude and stimulus type (F—face base image, N—noise) at a given time point; (b) noise field averages are weighted and combined into a time‐specific CI; (c) a weighted sum is computed across time‐specific CIs using a standard hemodynamic response function (HRF) to generate a single ROI‐specific CI; (d) raw CIs are smoothed with a Gaussian filter to allow analysis and visualization.
Second, for each ROI, time point‐specific CIs were computed with the following formula [Murray et al., 2002]:
| (2) |
where .
Here p Fi− and p Ni− represent the probability of a bin number smaller than i when a base image is present and absent, respectively. G −1 is the inverse of the normal cumulative distribution function, g is the normal probability density function, d′ is performance level, and n represents the number of bins (g(z 1) and (g(z n+1) are estimated as 0). Finally, μFi and μNi represent the average noise fields for a given bin i. The combination schema above represents an attempt to maximize the SNR of CIs derived from graded responses [Murray et al., 2002] and is here extended to work with BOLD responses.
Third, a single CI was computed for each ROI by taking a weighted sum over time‐specific CIs using a standard hemodynamic response function [Friston et al., 1994]. This approach was expected to increase the overall SNR of the images (by computing a weighted average across multiple time points) and to produce a summary template of the visual structure driving the response of each ROI.
Finally, both behavioral and neural CIs were smoothed with a Gaussian filter with a 5‐pixel FWHM allowing their analysis with random field theory‐based tests [Chauvin et al., 2005].
RESULTS
Face Detection—Behavioral Performance and Neural Correlates
Response accuracy across sessions was 69.3% and 73.2% for EC and EA. Subjects classified the stimuli as “face” on 50.5% (EC) and 43.9% (EA) of the trials. Thus, as intended, both subjects reported the presence of a signal about half of the time (although we notice a small bias toward “no face” responses in EA's case).
The effect of trial type on neural responses was assessed for traditional ventral cortical regions for face processing [Haxby et al., 2000]. In both subjects, conventional functional contrasts (faces versus objects) revealed bilaterally the FFA [Kanwisher et al., 1997] and the occipital face area (OFA) [Gauthier et al., 2000]— Figure 4 and Table 1. Average ROI responses (Fig. 5) were subjected to a three‐way ANOVA (stimulus type × response type × ROI) across sessions separately for each subject. Here, stimulus type encodes whether the stimulus contained a base image or not while response type encodes the behavioral response, “face” or “no face.”
Figure 4.
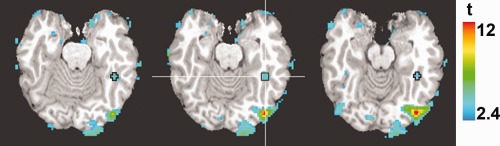
Example of ROI mask in subject EA. The map shows the contrast between faces and objects (q < 0.05) superimposed on three axial slices (in EA's native space). The mask is centered on the peak of the right FFA (see Table 1).
Table 1.
Coordinates and average face selectivity for the ROIs (EC/EA)
| ROI | Peak coordinates | Face selectivity (%SC ± SD) | ||
|---|---|---|---|---|
| x | y | z | ||
| rFFA | 45/45 | −53/−44 | −15/−18 | 0.26 ± 0.15*/0.16 ± 0.08* |
| lFFA | −40/−38 | −46/−40 | −11/−14 | 0.05 ± 0.05**/0.05 ± 0.08 |
| rOFA | 36/41 | −77/−76 | −12/−5 | 0.22 ± 0.11*/0.30 ± 0.13* |
| lOFA | −39/−41 | −78/−73 | −11/−5 | 0.09 ± 0.19/0.22 ± 0.12* |
| EVC | 16/1 | −94/−93 | −6/−7 | 0.01 ± 0.17/0.07 ± 0.15 |
Face selectivity is measured as the difference between face and object‐evoked activation (*P < 0.001, **P < 0.05).
Figure 5.
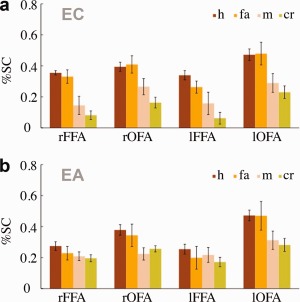
Response amplitudes (in percent signal change) across different ROIs as a function of stimulus type and behavioral response (h—hits, fa—false alarms, m—misses, cr—correct rejections). Error bars show ±1 SE across sessions.
The analysis revealed significant effects for response type in each subject (EC: F (1, 11) = 27.25, P < 0.001; EA: F (1,12) = 10.83, P < 0.01) and a significant interaction between response type and ROI for EA (F (3,36) = 6.18, P < 0.01). To examine the source of this interaction we performed further contrasts that revealed significant effects of response type within each of EA's ROIs with the exception of the left FFA (P > 0.10). At the same time, we did not find a main effect or interaction with stimulus type for either subject. Finally, a control area in the early visual cortex did not show any significant effects (P > 0.05).
These results are important in several respects. First, they confirm the sensitivity of the FFA to face detection independent of the objective presence of a face stimulus [Righart et al., 2010; Zhang et al., 2008] and also extend this sensitivity to the OFA (as evidenced by response type effects). Second, they show that there is marked variation in both behavioral and neural responses independent of the presence of a signal (as evidenced by the absence of effects/interactions with stimulus type). This finding serves to motivate the application of reverse correlation to our data—if responses were mainly a function of signal presence (i.e., stimulus type) then CIs would reveal little if any information. And third, they suggest behaviorally and neurally‐derived CIs may be similar to each other in virtue of the fact that they are constructed from correlated signals: BOLD amplitudes tend to be higher on trials on which subjects classify the stimuli as “faces.”
Finally, a critical assumption of reverse correlation methods is the consistency of the mechanism responsible for producing responses (e.g., the use of a same internal template) across extensive series of test sessions. Particularly problematic is the possibility of additional learning, change of strategy or, in our case, changes in neural perceptual processing. To verify this assumption we examined both behavioral markers (i.e., accuracy and bias) and BOLD responses (i.e., ROI‐specific face selectivity) for the presence of consistent changes across sessions. Specifically, we computed Pearson correlations between each of these measures averaged within sessions and the corresponding session number. Our results showed no significant change in accuracy or bias for either participant (P > 0.10). Similarly, no change in estimates of face selectivity was found for any of the ROIs examined (P > 0.10).
Behaviorally‐Derived CIs
In order to assess the overall reliability and quality of the results, we examined the intermediate steps involved in the generation of the CIs. In theory, the most informative trials in a standard image classification paradigm should be those on which a subject responds incorrectly in that they reflect stronger reliance upon internal templates [Murray et al., 2002; Solomon, 2002]. Thus, we may expect that the contrast of the components based upon incorrect responses (μNF and μFN) to be higher than that those based upon correct ones (μFF and μNN) and, thus, to contribute more information to the construction of a CI. This expectation was borne out by the results of both subjects (Fig. 2). Specifically, the RMS contrast of the four image components showed higher levels for the two types of incorrect responses than for correct ones. In addition, the contrast level of the resulting CIs was markedly larger than that of any single component suggesting that information combines (and is used) in a relatively consistent manner across the four types of trials. Thus, both subjects appear to make reliable and consistent use of internal templates.
While the results above point to the likely use of internal face templates, they do not speak to the structure or the nature of these templates. To deal with these issues, we conducted two sets of analyses, in the frequency domain and in the spatial domain, as detailed below.
First, in the frequency domain, we computed the squared amplitude energy of raw (i.e., unsmoothed) CIs as well as of the actual experimental stimuli (Fig. 6). Specifically, for each given image we computed the energy of a range of frequencies (in cycles/image) and averaged the results across orientations. In the case of experimental stimuli, this analysis examined whether their structure exhibited significant energy across the entire frequency band (as shown in Fig. 6a) and, thus, it provide subjects with the opportunity to exploit information from the range of frequencies most relevant for face detection (i.e., under 16 cycles/image) [Costen et al., 1996; Näsänen, 1999; Peli et al., 1994]. In the case of the CIs, the analysis examined the relative importance and use of different frequencies in our face detection task (Fig. 6b). In order to evaluate these latter results more rigorously, the analysis was repeated for an additional 100 CIs obtained by randomly permuting the behavioral responses of each participant. Overall, the comparison between actual and randomly derived CIs revealed higher amplitudes for the former. More importantly, behaviorally‐derived CIs showed a marked decrease in amplitude across higher frequencies characteristic of natural images, and faces in particular [Keil, 2008]. In contrast, permutation‐based CIs exhibited a roughly flat profile characteristic of the spectrum of white noise.
Figure 6.
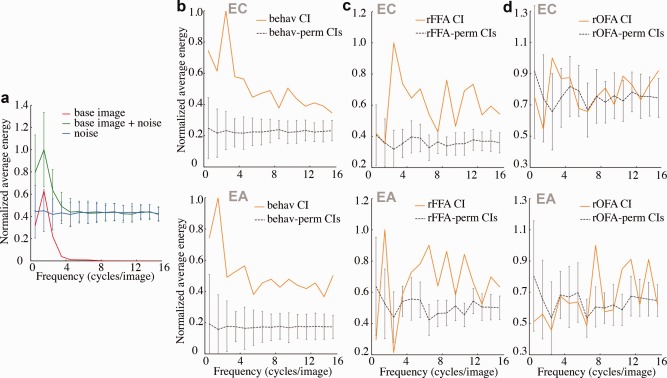
Average squared amplitude energy for (a) the base image, stimuli containing the base image and stimuli containing only noise fields; (b) the raw behavioral CIs; (c), (d) the raw neurally‐derived CIs (corresponding to the right FFA and OFA). The abscissa represents spatial frequency in cycles per image and the ordinate displays normalized amplitude values averaged across orientations—values are normalized (scaled) by the maximum value. The average energy of 100 control CIs (constructed by permuting response labels) is shown in gray. Error bars show ±1 SD across stimuli for (a) and across control CIs for (b–d).
Second, in the spatial domain, smoothed CIs (Fig. 7a) were analyzed using a pixel test [Chauvin et al., 2005] with the goal of identifying areas of the image (i.e., pixels) whose luminance values differ significantly from chance. Of note, this image‐based analysis focuses on low‐frequency information (i.e., less than eight cycles/image) both because it is better suited to deal with such information and because low‐frequency energy dominates the spectral profile of the CIs (Fig. 6). The outcome of this analysis revealed a triangular pattern of dark regions corresponding roughly to the position of the eyes and the mouth. The images also displayed a markedly bright region corresponding to the upper brow.
Figure 7.
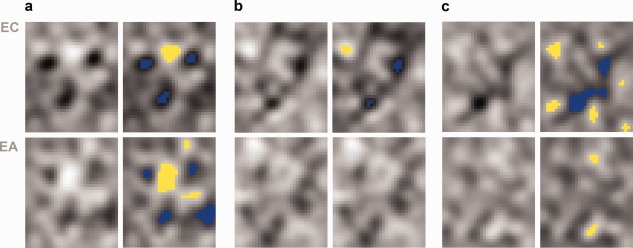
Smoothed CIs and their pixel test analysis. Results are shown for (a) behavioral responses, (b) right FFA responses, and (c) the right OFA responses. Blue and yellow mark pixels darker/brighter than chance (P < 0.05).
Thus, the two sets of analyses concur on the presence of consistent visual structures used in face detection. More importantly, they identify the main spatial components of these structures associated with low‐frequency information.
Neurally‐Derived CIs
Right‐hemisphere ROIs showed higher face selectivity than their left homologues [Kanwisher et al., 1997; Puce et al., 1996] and, more critically, their selectivity was reliably replicated across sessions in both subjects (Table 1). Consequently, our analysis focuses on these ROIs; however, for completeness, CIs were separately constructed for all regions. Neurally‐derived CIs were analyzed in the frequency domain and in the spatial domain following the same approach described above for behavioral CIs.
Out of all regions, the right FFA exhibited high amplitudes for a broad range of frequencies relative to baseline as well as an overall decrease in amplitude at higher frequencies. Figure 6b–d displays these results for the right FFA and OFA and Supporting Information Figure 1 shows the results for their left homologues.
Some differences between the two participants are immediately apparent. For instance, we note that EC exhibits a better separation from baseline than EA in the case of the FFA. These differences are consistent both with behavioral performance (e.g., EA's bias for “no face” responses) and neural response profiles (e.g., EA's smaller FFA face‐selectivity—Table 1). In line with these differences, we expect EA's CIs to possess a smaller SNR than ECs. In the spatial domain, pixel tests confirmed this expectation in that EC's images displayed more extensive structures that EA's—see Figure 7 and Supporting Information Figure 2.
To boost the SNR of the present images and facilitate their interpretation we appealed to one simplifying assumption: facial symmetry. Given the sensitivity of face‐selective regions to symmetry [Caldara and Seghier, 2009], it is plausible that some symmetrical features may be present in the internal template used for face detection. To examine this possibility, we averaged each CI with its mirror‐symmetric version and submitted the results to a new set of analyses. This manipulation effectively doubles the number of trials used in constructing the raw images (since noise fields were independently generated for the right and the left sides) and is thus expected to increase their SNR [Murray et al., 2002]. Figure 8a displays the results for both behaviorally‐derived CIs and right FFA CIs—unlike these CIs, those corresponding to the right OFA did not show any clear improvement over the initial results of the two subjects. The examination of the results shows that both eye‐level regions and the mouth appear to serve as key elements for face detection.
Figure 8.
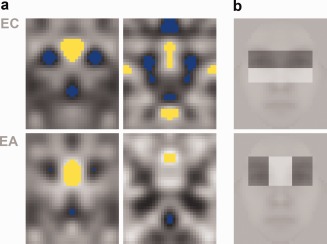
(a) Symmetrical CIs analyzed with a pixel test (P < 0.05). Results are shown for behavioral CIs (on the left) and for rFFA‐derived CIs (on the right). (b) The two best contrast features for face detection of Viola and Jones [2004] superimposed on a base image.
Another facet of our investigation concerns the relationship between behaviorally and neurally‐derived CIs. The standard analysis of BOLD amplitudes suggests that the two types of CIs should be positively correlated with each other—insofar as “face” responses are overall associated with higher ROI amplitudes (Fig. 5), this relationship presumably carries over to the CIs based upon behavioral and neural data. To evaluate this hypothesis we correlated smoothed symmetrical CIs (the left‐hand half of each image). As expected, all pairs of CIs showed positive correlations with each other: behavioral and FFA‐based CIs (EC: r = 0.35, P < 0.001; EA: r = 0.26, P < 0.001) as well as behavioral and OFA‐based CIs (EC: r = 0.28, P < 0.001; EA: r = 0.27, P < 0.001)—the overlap of significant regions contained by the two types of CIs is also shown in Supporting Information Figure 3. Similar correlation results were obtained by comparing smoothed CIs prior to introducing a symmetry assumption. However, this time the correlation between the right FFA and the behavioral CIs derived for subject EA did not reach significance (P > 0.10)—this latter result is consistent with the standard analyses mentioned above given that, unlike the other ROIs examined, EA's FFA did not show a significant effect of response type (i.e., “face” versus “noise”).
Correlations between behavioral and BOLD of data are certainly important in clarifying the relationship between brain and behavior. At the same time though, if neurally‐derived CIs display significant structures simply by virtue of the correlation with behavior, in the long term, the application of image classification to BOLD data may prove to be of limited theoretical value. To address this concern we computed and analyzed a new set of neurally‐based CIs. Specifically, first, we regressed out behavioral responses from neural ones and, second, we constructed CIs from the neural residuals of both the right FFA and the right OFA of each subject. Image‐based analyses show that the new CIs (Supporting Information Fig. 4) exhibit most of the significant regions present in the original CIs (Fig. 7b–d). Therefore, we argue, the correlation of BOLD and behaviorally responses is not the only (or even the main) factor responsible for the structure of neurally‐based CIs. More generally, this latter result supports the idea that BOLD‐derived CIs can contribute significant information regarding visual representations independent of that provided by their behavioral counterparts.
DISCUSSION
Internal Face Representations
What basic image structures guide face detection within the human visual system? Our study uses image classification to clarify the structure of general face representations and their instantiation at the neural level (i.e., at the level of face‐selective regions). Overall, our results provide evidence for simple but robust image structures including a triangular configuration of dark areas corresponding to the eyes and the mouth along with brighter areas corresponding to the middle brow. These image structures are especially clear based on our behavioral results; however, their elements can be traced to neural processing, especially in the case of the right FFA.
The present results are in broad agreement with recent behavioral and EEG studies [Hansen et al., 2010; Rieth et al., 2011; Smith et al., 2012] that also reveal significant image structures mediating face detection. For instance, Rieth et al. [2011] applied image classification to behavioral data collected across a large number of subjects (i.e., several hundred). The resultant CIs associated with a face detection task showed a multitude of dark patches across a surprisingly wide expanse of the image both centrally and peripherally—however, guiding the subjects' attention to the center of the image reduced the amount of spatial uncertainty leading to a less dispersed and more intuitive “face‐like” structure. More relevantly here, two other studies [Hansen et al., 2010; Smith et al., 2012] extended image classification to neuroimaging data associated with a face detection task. Specifically, these studies derived CIs corresponding to EEG signals at different time points and frequency bands. In one study, significant image structures were observed in multiple frequency bands for occipitotemporal cortex around 170 ms [Hansen et al., 2010]. While these structures were fairly diverse in their appearance across bands and subjects, additional analyses across CIs confirmed that they were likely to contain visual features characteristic of actual faces. Interestingly, Smith et al. [2012] showed that meaningful structures can be derived from frontal areas as well as occipitotemporal areas in a broad interval ranging from 200 to 500 ms from stimulus onset. Moreover, neurally‐derived CIs correlated reliably in this latter study with their behavioral counterparts computed across the same subjects, thus reinforcing the explanatory value of the neural results.
Importantly, some of the image structures identified by the studies above have noticeable similarity to those we found here—for instance, the eyes appear to play a dominant role. Thus, the successful application of image classification across neuroimaging modalities (i.e., EEG, by previous studies, and fMRI here) suggests that our current results reflect meaningful aspects of neural representations. At the same time, as expected, we note the presence of substantial variability in the overall pattern of results across subjects (and across studies). Thus, our results also underline the clear challenges facing further applications of image classification to neural data (see next section). Moreover, while the studies above argue for the intuitive “face‐like” aspects of certain image structures, it remains unclear what properties recommend these structures for their privileged role in recognition and for their encoding in high‐level visual areas. That is, the identification of significant image structures can benefit from an explanation of their function. In this respect, we argue that a plausible account of the present results involves objective feature diagnosticity as detailed below.
Previous investigations of visual face properties found that the contrast between the eyes and the rest of the face is highly characteristic of faces as a visual category [Gilad et al., 2009; Sinha, 2002]. In particular, the contrast between the eyes and the middle brow area or the upper cheeks (Fig. 8b) systematically outperforms other local features in automatic recognition [Viola and Jones, 2004]. Consistent with this, the horizontal placement of the internal features (e.g., the eyes and the middle brow) leads to a specific face signature in the frequency domain—the presence of diagnostic information at around 10 cycles per face [Keil, 2008]. Furthermore, recent comparisons of automatic and human face detection ['t Hart et al., 2011] suggest that simple contrast features such as those in Figure 8b are highly predictive of behavioral performance. To be clear, such features are not invariant (e.g., an extreme change in viewpoint can render them relatively ineffective). However, what matters is their robustness over a large number of common changes, both intrinsic (e.g., expression) and extrinsic (e.g., lighting). Overall, our results provide support for these previous findings by deriving such features directly from patterns of behavioral and neural responses. Conversely, these previous findings support the idea that the most robustly encoded features are those most diagnostic about faces as a class. In this sense, face encoding appears to reflect the objective structure and statistics of face images [Bartlett, 2007] in a manner that is similar to the way early visual representations reflect the low‐level statistics of natural images [Barlow, 1961; Olshausen and Field, 1996].
As far as the frequency profile of the features noted above is concerned, their coarse low‐resolution aspect (under eight cycles/image) is quite obvious. This result may seem at odds with the availability of high‐frequency information for detection purposes [Halit et al., 2006]. However, current research suggests that high‐frequency information is not critical for face recognition [Costen et al., 1996; Näsänen, 1999; Peli et al., 1994]. Face detection as carried out by the human visual system is remarkably fast and efficient, for instance when compared with individuation [Liu et al., 2002; Or and Wilson, 2010]. As such, it is likely to take advantage more readily of low‐frequency information whose availability precedes that of high‐frequency information [Bar et al., 2006]. Thus, the privileged role of low frequencies in neural processing along with the diagnosticity of the information they carry serve as a plausible explanation for the coding of the features revealed by our CIs.
Interestingly, the structures revealed by our CIs bears similarity to the type of simple displays (e.g., low‐frequency eyes‐and‐mouth configurations) evoking preferential looking in infants [Farroni et al., 2005; Johnson and Morton, 1991]. This structure has been associated in the past with subcortical face processing [Johnson, 2005]. While our results do not speak directly to this possibility, the diagnosticity of the visual features identified provides a plausible argument for their redundant encoding at multiple levels of visual processing. In particular, we find that the right FFA appears to encode these features confirming its involvement in face detection [Freiwald et al., 2009; Grill‐Spector et al., 2004; Nestor et al., 2008].
The considerations above raise an interesting issue: to what extent the study of other types of face stimuli (e.g., profiles) or even other categories of objects would reveal significant structures such as those found here in the FFA? To address this issue three related points should to be considered. First, face profiles activate the FFA significantly less than frontal‐view faces [Xu et al., 2009; Yue et al., 2011] and so do objects [Kanwisher and Yovel, 2006]. Second, face profile and object features encoded in the FFA are probably less diagnostic for their respective classes and, therefore, less robustly encoded—for instance, highly effective features for face detection like those shown in Figure 8b have difficulty in dealing with profiles. Third, the FFA does not appear to respond linearly to other categories than faces [Horner and Andrews, 2009] warning against the application of standard image classification to such cases. Therefore, we argue, the investigation of alternative types of stimuli in face‐selective regions is likely to be less informative. At the same time though, we do acknowledge that such investigations may serve as relevant controls in the evaluation of image classification results such as those presented here.
On a related note, it may seem surprising to assume linearity in the neural responses of high‐level visual areas associated with any object category, particularly considering that invariance in object recognition is achieved primarily trough nonlinear processing [Riesenhuber and Poggio, 1999]. However, such nonlinearities in face processing may be amenable to linear approximations under certain respects. Indeed, recent evidence suggests that the FFA exhibits much less invariance to basic image characteristics than previously thought. For instance, its response increases with the size of a face stimulus [Xu et al., 2009; Yue et al., 2011], decreases with its eccentricity [Schwarzlose et al., 2008; Yue et al., 2011] and also with viewpoint divergence from a frontal view [Xu et al., 2009; Yue et al., 2011]. Furthermore, many of these properties affect response amplitudes and combine with each other in a roughly linear fashion [Yue et al., 2011]. Finally, the response of the FFA was found to increase proportionately with the “faceness” of a stimulus [Davidenko et al., in press; Horner and Andrews, 2009]. To be clear, these results do not imply that the functioning of the FFA reduces to strictly linear operations but rather that important aspects of its functioning, such as those related to face detection, can be reasonably approximated by a linear function. Thus, the response characteristics of the FFA make it ideal for the goals of our investigation while they also raise questions concerning the more general applicability of image classification to BOLD data as discussed in the next section.
In sum, our results argue for the role of several critical features in face detection. Clearly though, face detection is not limited to their use. For instance, other luminance‐based features (e.g., hair), although less stable and robust, are likely to complement those discussed here. Similarly, other modalities in addition to luminance can provide diagnostic information. As a case in point, color can be exploited in a number of face recognition tasks including detection [Bindemann and Burton, 2009; Dupuis‐Roy et al., 2009; Nestor and Tarr, 2008]. Thus, we argue that the features discussed here serve as robust properties of face representations rather than as complete and flawless ones.
Finally, as a point of clarification, we note that top‐down processes such as expectation and context are unlikely to account for the present results. The use of noisy/ambiguous images is a powerful tool for researching top‐down processes in object recognition [Li et al., 2009; Summerfield et al., 2006; Wild and Busey, 2004]. The general strategy of this research involves direct pairing of neural responses with higher‐level cognitive factors (e.g., expectations regarding probability of occurrence). In contrast, image classification as illustrated here aims at relating behavioral/cortical responses with random image structures. The relevant factor in this relationship is the accidental similarity of these structures to actual face representations rather than any manipulation of high‐level cognitive factors. Thus, we argue that our results serve as approximations of internal visual representations rather than as byproducts of top‐down visual processing.
Application of Image Classification to fMRI
The present findings suggest that an extension of noise‐based image classification to BOLD data can be informative as long as several preconditions are satisfied. First, the overall linearity of response amplitudes within a region [Davidenko et al., in press; Horner and Andrews, 2009; Yue et al., 2011] is likely to be an important factor in this respect. Second, the systematic variability of neural responses (e.g., as illustrated by their relationship with behavioral responses) is critical to constructing meaningful CIs. Third, optimizing the SNR of the CIs serves as a significant constraint both in the design of the experimental paradigm and in the construction of the CIs. Given such considerations, our results provide a proof of principle that image classification can be applied to BOLD data to uncover visual features employed in high‐level recognition.
At the same time, we note that the completeness and quality of neurally‐based CIs is not on the same par with that of behaviorally‐derived CIs as illustrated by the present results and by related studies [Hansen et al., 2010; Smith et al., 2012]. At least two reasons seem to underlie this difference. First, the SNR of neural recordings is likely poorer than that of behavioral responses. For instance, BOLD signals are corrupted both by internal (e.g., physiological) noise and by external noise related to fMRI measurement (e.g., thermal noise) [Bennett and Miller, 2010]. In contrast, behavioral responses are primarily influenced by internal noise—there is virtually no measurement noise associated with recording button presses. Our work attempts to deal with this issue by maximizing the SNR of BOLD‐derived CIs. Despite such efforts, it seems unlikely that current methods can yield comparable SNR levels for the two categories of data. Second, it is reasonable to assume that any CI based upon activation in a single brain region may provide only a noisy and incomplete estimation of the overall internal template driving behavioral responses. For instance, in the case of face perception, its reliance upon an entire network of cortical regions is well‐documented [Gauthier et al., 2000; Haxby et al., 2000, 2009; Ishai et al., 2005; Rossion et al., 2003; Tsao et al., 2008] and consistent with the idea that these regions provide both redundant and complementary information for the purpose of face recognition [Fox et al., 2009; Gobbini and Haxby, 2007; Nestor et al., 2011]. Thus, the construction of hybrid CIs based from patterns of activation across multiple regions may ultimately provide a way to boost the quality of neurally‐derived CIs. More generally, relating and combining CIs across different brain regions in a principled and statistically optimal manner may provide new insights into how information is integrated at the level of cortical networks and how behavior emerges from complex visual processing.
In addition to the research directions noted above, a more extensive application of image classification to neuroimaging, and BOLD data in particular, appears to require two critical developments. One concerns a significant reduction in the number of trials, for instance by replacing random sampling with adaptive stimulus sampling [Lewi et al., 2009]. Generating and testing maximally informative stimuli on the fly as a function of previous responses is certainly an option for behavioral studies but also for neuroimaging, particularly in connection with the advent of real‐time fMRI [deCharms, 2008; LaConte et al., 2007]. The other development involves the use of nonlinear methods [Neri, 2004] better suited to uncovering subtler, more complex, higher‐level features. Such developments are critical in extending the application of image classification beyond the interesting but restricted domain of face detection.
At this time, we note that neuroimaging data represent a new domain for the application of image classification. “Bubbles” [Gosselin and Schyns, 2001], a technique related to image classification, has been recently applied to several imaging modalities including fMRI [Smith et al., 2007, 2012, 2002]. However, rather than aiming to reconstruct internal representations out of structure‐free stimuli, the bubbles technique takes on the interesting but less taxing enterprise of uncovering informative areas of a given stimulus. More closely related to our work, another study [Smith et al., 2012] applied a challenging version of image classification known as “superstitious perception” [Gosselin and Schyns, 2003] to EEG data. Unlike standard image classification [Abbey and Eckstein, 2002; Ahumada, 2002; Beard and Ahumada, 1998], superstitious perception completely discards the use of a base image and only relies on noise stimuli to construct CIs. The merit of this approach is obvious in that it forces a heavier reliance on internal templates in performing the task. However, it also introduces the risk of variable/evolving internal templates within (and across) subjects, a risk that base images, such as those used here, are intended to minimize. From a practical point of view, this version of image classification may not be immediately applicable to BOLD data due to the larger number of trials needed. However, the development of adaptive stimulus sampling [Lewi et al., 2009] in connection with real‐time fMRI could make superstitious perception a feasible and appealing approach for future research.
Finally, an interesting parallel can be drawn here with fMRI methods for stimulus reconstruction [Miyawaki et al., 2008; Naselaris et al., 2009]. The idea of reconstructing an image‐based structure is common to both such methods and to reverse correlation. However, the general goal of the former is to reconstruct actual stimuli from neural patterns rather than to recover the structure of neural representation. Thus, while impressive as an engineering feat, stimulus reconstruction was pointed out to have unclear theoretical value [Kriegeskorte, 2011] in that it exploits current knowledge about neural representations rather than attempting to extend it. In particular, stimulus reconstruction takes advantage of existing computational descriptions of neural representations in early visual areas. On the other hand, rigorous descriptions at the level of higher visual areas are still missing. In this respect, image classification methods may provide an important tool by narrowing the gap between models of neural representation at the level of high‐level versus low‐level visual areas.
SUMMARY
Our work aims at uncovering the basic visual structures underlying human face detection and at relating them to the neural representations hosted by ventral face‐selective areas. Our results reveal the existence and characteristics of such structures and account for them in terms of their objective diagnosticity for face detection. More generally, the present results are instrumental in establishing the potential as well as the challenges confronting the application of image classification to BOLD data in the study of high‐level visual perception.
Supporting information
Supporting Information Figure 1.
Supporting Information Figure 2.
Supporting Information Figure 3.
Supporting Information Figure 4.
ACKNOWLEDGMENTS
The authors thank David Badre, David Sheinberg, and Isabel Gauthier for valuable and helpful comments on previous versions of this article.
REFERENCES
- Abbey CK, Eckstein MP (2002): Classification image analysis: Estimation and statistical inference for two‐alternative forced‐choice experiments. J Vis 2:66–78. [DOI] [PubMed] [Google Scholar]
- Ahumada AJ (2002): Classification image weights and internal noise level estimation. J Vis 2:121–131. [DOI] [PubMed] [Google Scholar]
- Avidan G, Hasson U, Malach R, Behrmann M (2005): Detailed exploration of face‐related processing in congenital prosopagnosia. 2. Functional neuroimaging findings. J Cogn Neurosci 17:1150–1167. [DOI] [PubMed] [Google Scholar]
- Barlow HB (1961): Possible principles underlying the transformation of sensory messages In: Rosenblith W, editor.Sensory Communication. Cambridge, MA:MIT Press; pp217–234. [Google Scholar]
- Bar M, Kassam KS, Ghuman AS, Boshyan J, Schmid AM, Schmidt AM, Dale AM, Hämäläinen MS, Marinkovic K, Schacter DL, Rosen BR, Halgren E (2006): Top‐down facilitation of visual recognition. Proc Natl Acad Sci USA 103:449–454. [DOI] [PMC free article] [PubMed] [Google Scholar]
- Bartlett MS (2007): Information maximization in face processing. Neurocomputing 70:2204–2217. [Google Scholar]
- Beard BL, Ahumada AJ (1998): A technique to extract the relevant features for visual task In: Rogowitz BE, Pappas TN, editors. Human Vision and Electronic Imaging III (SPIE Proceedings, Vol.3299). Bellingham, WA:International Society for Optical Engineering; pp79–85. [Google Scholar]
- Bennett CM, Miller MB (2010): How reliable are the results from functional magnetic resonance imaging? Ann NY Acad Sci 1191:133–155. [DOI] [PubMed] [Google Scholar]
- Bindemann M, Burton AM (2009): The role of color in human face detection. Cogn Sci 33:1144–1156. [DOI] [PubMed] [Google Scholar]
- Brainard DH (1997): The psychophysics toolbox. Spat Vis 10:433–436. [PubMed] [Google Scholar]
- Caldara R, Seghier ML (2009): The Fusiform Face Area responds automatically to statistical regularities optimal for face categorization. Hum Brain Mapp 30:1615–1625. [DOI] [PMC free article] [PubMed] [Google Scholar]
- Chauvin A, Worsley KJ, Schyns PG, Arguin M, Gosselin F (2005): Accurate statistical tests for smooth classification images. J Vis 5:659–667. [DOI] [PubMed] [Google Scholar]
- Costen NP, Parker DM, Craw I (1996): Effects of high‐pass and low‐pass spatial filtering on face identification. Percept Psychophys 58:602–612. [DOI] [PubMed] [Google Scholar]
- Cox RW (1996): AFNI: Software for analysis and visualization of functional magnetic resonance neuroimages. Comput Biomed Res 29:162–173. [DOI] [PubMed] [Google Scholar]
- Davidenko N, Remus DA, Grill‐Spector K: Face‐likeness and image variability drive responses in human face‐selective ventral regions. Hum Brain Mapp (in press). [DOI] [PMC free article] [PubMed] [Google Scholar]
- deCharms RC (2008): Applications of real‐time fMRI. Nat Rev Neurosci 9:720–729. [DOI] [PubMed] [Google Scholar]
- Dupuis‐Roy N, Fortin I, Fiset D, Gosselin F (2009): Uncovering gender discrimination cues in a realistic setting. J Vis 9:10.1–10.8. [DOI] [PubMed] [Google Scholar]
- Farroni T, Johnson MH, Menon E, Zulian L, Faraguna D, Csibra G (2005): Newborns' preference for face‐relevant stimuli: Effects of contrast polarity. Proc Natl Acad Sci USA 102:17245–17250. [DOI] [PMC free article] [PubMed] [Google Scholar]
- Fox CJ, Moon SY, Iaria G, Barton JJ (2009): The correlates of subjective perception of identity and expression in the face network: An fMRI adaptation study. Neuroimage 44:569–580. [DOI] [PMC free article] [PubMed] [Google Scholar]
- Freiwald WA, Tsao DY, Livingstone MS (2009): A face feature space in the macaque temporal lobe. Nat Neurosci 12:1187–1196. [DOI] [PMC free article] [PubMed] [Google Scholar]
- Friston KJ, Jezzard P, Turner R (1994): Analysis of functional MRI time‐series. Hum Brain Mapp 1:153–171. [Google Scholar]
- Gauthier I, Tarr MJ, Moylan J, Skudlarski P, Gore JC, Anderson AW (2000): The fusiform “face area” is part of a network that processes faces at the individual level. J Cogn Neurosci 12:495–504. [DOI] [PubMed] [Google Scholar]
- Gilad S, Meng M, Sinha P (2009): Role of ordinal contrast relationships in face encoding. Proc Natl Acad Sci USA 106:5353–5358. [DOI] [PMC free article] [PubMed] [Google Scholar]
- Gobbini MI, Haxby JV (2007): Neural systems for recognition of familiar faces. Neuropsychologia 45:32–41. [DOI] [PubMed] [Google Scholar]
- Gold JM, Murray RF, Bennett PJ, Sekuler AB (2000): Deriving behavioural receptive fields for visually completed contours. Curr Biol 10:663–666. [DOI] [PubMed] [Google Scholar]
- Gosselin F, Schyns PG (2001): Bubbles: A technique to reveal the use of information in recognition tasks. Vision Res 41:2261–2271. [DOI] [PubMed] [Google Scholar]
- Gosselin F, Schyns PG (2003): Superstitious perceptions reveal properties of internal representations. Psychol Sci 14:505–509. [DOI] [PubMed] [Google Scholar]
- Grill‐Spector K, Knouf N, Kanwisher N (2004): The fusiform face area subserves face perception, not generic within‐category identification. Nat Neurosci 7:555–562. [DOI] [PubMed] [Google Scholar]
- Halit H, de Haan M, Schyns PG, Johnson MH (2006): Is high‐spatial frequency information used in the early stages of face detection? Brain Res 1117:154–161. [DOI] [PubMed] [Google Scholar]
- Hansen BC, Thompson B, Hess RF, Ellemberg D (2010): Extracting the internal representation of faces from human brain activity: An analogue to reverse correlation. Neuroimage 51:373–390. [DOI] [PubMed] [Google Scholar]
- Harel A, Ullman S, Epshtein B, Bentin S (2007): Mutual information of image fragments predicts categorization in humans: Electrophysiological and behavioral evidence. Vision Res 47:2010–2020. [DOI] [PubMed] [Google Scholar]
- Haxby JV, Gobbini MI, Furey ML, Ishai A, Schouten JL, Pietrini P (2001): Distributed and overlapping representations of faces and objects in ventral temporal cortex. Science 293:2425–2430. [DOI] [PubMed] [Google Scholar]
- Haxby JV, Hoffman EA, Gobbini MI (2000): The distributed human neural system for face perception. Trends Cogn Sci 4:223–233. [DOI] [PubMed] [Google Scholar]
- Horner AJ, Andrews TJ (2009): Linearity of the fMRI response in category‐selective regions of human visual cortex. Hum Brain Mapp 30:2628–2640. [DOI] [PMC free article] [PubMed] [Google Scholar]
- Ishai A, Schmidt CF, Boesiger P (2005): Face perception is mediated by a distributed cortical network. Brain Res Bull 67:87–93. [DOI] [PubMed] [Google Scholar]
- Jiang Y, He S (2006): Cortical responses to invisible faces: dissociating subsystems for facial‐information processing. Curr Biol 16:2023–2029. [DOI] [PubMed] [Google Scholar]
- Johnson MH (2005): Subcortical face processing. Nat Rev Neurosci 6:766–774. [DOI] [PubMed] [Google Scholar]
- Johnson MH, Morton J (1991): Biology and Cognitive Development: The Case of Face Recognition. Oxford:Blackwell. [Google Scholar]
- Kanwisher N, McDermott J, Chun MM (1997): The fusiform face area: A module in human extrastriate cortex specialized for face perception. J Neurosci 17:4302–4311. [DOI] [PMC free article] [PubMed] [Google Scholar]
- Kanwisher N, Yovel G (2006): The fusiform face area: A cortical region specialized for the perception of faces. Philos Trans R Soc Lond B Biol Sci 361:2109–2128. [DOI] [PMC free article] [PubMed] [Google Scholar]
- Keil MS (2008): Does face image statistics predict a preferred spatial frequency for human face processing? Proc Biol Sci 275:2095–2100. [DOI] [PMC free article] [PubMed] [Google Scholar]
- Kriegeskorte N (2011): Pattern‐information analysis: From stimulus decoding to computational‐model testing. Neuroimage 56:411–421. [DOI] [PubMed] [Google Scholar]
- Kriegeskorte N, Formisano E, Sorger B, Goebel R (2007): Individual faces elicit distinct response patterns in human anterior temporal cortex. Proc Natl Acad Sci USA 104:20600–20605. [DOI] [PMC free article] [PubMed] [Google Scholar]
- Kriegeskorte N, Lindquist MA, Nichols TE, Poldrack RA, Vul E (2010): Everything you never wanted to know about circular analysis, but were afraid to ask. J Cereb Blood Flow Metab 30:1551–1557. [DOI] [PMC free article] [PubMed] [Google Scholar]
- LaConte SM, Peltier SJ, Hu XP (2007): Real‐time fMRI using brain‐state classification. Hum Brain Mapp 28:1033–1044. [DOI] [PMC free article] [PubMed] [Google Scholar]
- Lewi J, Butera R, Paninski L (2009): Sequential optimal design of neurophysiology experiments. Neural Comput 21:619–687. [DOI] [PubMed] [Google Scholar]
- Li J, Liu J, Liang J, Zhang H, Zhao J, Huber DE, Rieth CA, Lee K, Tian J, Shi G (2009): A distributed neural system for top‐down face processing. Neurosci Lett 451:6–10. [DOI] [PMC free article] [PubMed] [Google Scholar]
- Liu J, Harris A, Kanwisher N (2002): Stages of processing in face perception: An MEG study. Nat Neurosci 5:910–916. [DOI] [PubMed] [Google Scholar]
- Loffler G, Yourganov G, Wilkinson F, Wilson HR (2005): fMRI evidence for the neural representation of faces. Nat Neurosci 8:1386–1390. [DOI] [PubMed] [Google Scholar]
- Miyawaki Y, Uchida H, Yamashita O, Sato MA, Morito Y, Tanabe HC, Sadato N, Kamitani Y (2008): Visual image reconstruction from human brain activity using a combination of multiscale local image decoders. Neuron 60:915–929. [DOI] [PubMed] [Google Scholar]
- Murray RF, Bennett PJ, Sekuler AB (2002): Optimal methods for calculating classification images: Weighted sums. J Vis 2:79–104. [DOI] [PubMed] [Google Scholar]
- Naselaris T, Prenger RJ, Kay KN, Oliver M, Gallant JL (2009): Bayesian reconstruction of natural images from human brain activity. Neuron 63:902–915. [DOI] [PMC free article] [PubMed] [Google Scholar]
- Näsänen R (1999): Spatial frequency bandwidth used in the recognition of facial images. Vision Res 39:3824–3833. [DOI] [PubMed] [Google Scholar]
- Neri P (2004): Estimation of nonlinear psychophysical kernels. J Vis 4:82–91. [DOI] [PubMed] [Google Scholar]
- Neri P, Levi DM (2006): Receptive versus perceptive fields from the reverse‐correlation viewpoint. Vision Res 46:2465–2474. [DOI] [PubMed] [Google Scholar]
- Nestor A, Plaut DC, Behrmann M (2011): Unraveling the distributed neural code of facial identity through spatiotemporal pattern analysis. Proc Natl Acad Sci USA 108:9998–10003. [DOI] [PMC free article] [PubMed] [Google Scholar]
- Nestor A, Tarr MJ (2008): Gender recognition of human faces using color. Psychol Sci 19:1242–1246. [DOI] [PubMed] [Google Scholar]
- Nestor A, Vettel JM, Tarr MJ (2008): Task‐specific codes for face recognition: How they shape the neural representation of features for detection and individuation. PLoS One 3:e3978. [DOI] [PMC free article] [PubMed] [Google Scholar]
- Olshausen BA, Field DJ (1996): Natural image statistics and efficient coding. Network 7:333–339. [DOI] [PubMed] [Google Scholar]
- Or CC, Wilson HR (2010): Face recognition: Are viewpoint and identity processed after face detection? Vision Res 50:1581–1589. [DOI] [PubMed] [Google Scholar]
- Peli E, Lee E, Trempe CL, Buzney S (1994): Image enhancement for the visually impaired: The effects of enhancement on face recognition. J Opt Soc Am A Opt Image Sci Vis 11:1929–1939. [DOI] [PubMed] [Google Scholar]
- Pelli DG (1997): The VideoToolbox software for visual psychophysics: Transforming numbers into movies. Spat Vis 10:437–442. [PubMed] [Google Scholar]
- Pourtois G, Schwartz S, Seghier ML, Lazeyras F, Vuilleumier P (2005): View‐independent coding of face identity in frontal and temporal cortices is modulated by familiarity: An event‐related fMRI study. Neuroimage 24:1214–1224. [DOI] [PubMed] [Google Scholar]
- Puce A, Allison T, Asgari M, Gore JC, McCarthy G (1996): Differential sensitivity of human visual cortex to faces, letterstrings, and textures: A functional magnetic resonance imaging study. J Neurosci 16:5205–5215. [DOI] [PMC free article] [PubMed] [Google Scholar]
- Riesenhuber M, Poggio T (1999): Hierarchical models of object recognition in cortex. Nat Neurosci 2:1019–1025. [DOI] [PubMed] [Google Scholar]
- Rieth CA, Lee K, Lui J, Tian J, Huber DE (2011): Faces in the mist: Illusory face and letter detection. i‐Perception 2:458–476. [DOI] [PMC free article] [PubMed] [Google Scholar]
- Righart R, Andersson F, Schwartz S, Mayer E, Vuilleumier P (2010): Top‐down activation of fusiform cortex without seeing faces in prosopagnosia. Cereb Cortex 20:1878–1890. [DOI] [PubMed] [Google Scholar]
- Ringach D, Shapley R (2004): Reverse correlation in neurophysiology. Cogn Sci 28:147–166. [Google Scholar]
- Rossion B, Caldara R, Seghier M, Schuller AM, Lazeyras F, Mayer E (2003): A network of occipito‐temporal face‐sensitive areas besides the right middle fusiform gyrus is necessary for normal face processing. Brain 126:2381–2395. [DOI] [PubMed] [Google Scholar]
- Schwarzlose RF, Swisher JD, Dang S, Kanwisher N (2008): The distribution of category and location information across object‐selective regions in human visual cortex. Proc Natl Acad Sci USA 105:4447–4452. [DOI] [PMC free article] [PubMed] [Google Scholar]
- Sinha P (2002): Qualitative representations for recognition In: Goos G, Hartmanis J, van Leeuwen J, editors.Lecture Notes in Computer Science. Heidelberg:Springer‐Verlag; pp249–262. [Google Scholar]
- Smith FW, Muckli L, Brennan D, Pernet C, Smith ML, Belin P, Gosselin F, Hadley DM, Cavanagh J, Schyns PG (2008): Classification images reveal the information sensitivity of brain voxels in fMRI. Neuroimage 40:1643–1654. [DOI] [PubMed] [Google Scholar]
- Smith ML, Fries P, Gosselin F, Goebel R, Schyns PG (2009): Inverse mapping the neuronal substrates of face categorizations. Cereb Cortex 19:2428–2438. [DOI] [PubMed] [Google Scholar]
- Smith ML, Gosselin F, Schyns PG (2007): From a face to its category via a few information processing states in the brain. Neuroimage 37:974–984. [DOI] [PubMed] [Google Scholar]
- Smith ML, Gosselin F, Schyns PG (2012): Measuring internal representations from behavioral and brain data. Curr Biol 22:191–196. [DOI] [PubMed] [Google Scholar]
- Solomon JA (2002): Noise reveals visual mechanisms of detection and discrimination. J Vis 2:105–120. [DOI] [PubMed] [Google Scholar]
- Summerfield C, Egner T, Mangels J, Hirsch J (2006): Mistaking a house for a face: Neural correlates of misperception in healthy humans. Cereb Cortex 16:500–508. [DOI] [PubMed] [Google Scholar]
- 't Hart BM, Abresch TG, Einhäuser W (2011): Faces in places: Humans and machines make similar face detection errors. PLoS One 6:e25373. [DOI] [PMC free article] [PubMed] [Google Scholar]
- Tong F, Nakayama K, Moscovitch M, Weinrib O, Kanwisher N (2000): Response properties of the human fusiform face area. Cogn Neuropsychol 17:257–280. [DOI] [PubMed] [Google Scholar]
- Tsao DY, Livingstone MS (2008): Mechanisms of face perception. Annu Rev Neurosci 31:411–437. [DOI] [PMC free article] [PubMed] [Google Scholar]
- Tsao DY, Moeller S, Freiwald WA (2008): Comparing face patch systems in macaques and humans. Proc Natl Acad Sci USA 105:19513–19518 [DOI] [PMC free article] [PubMed] [Google Scholar]
- Ullman S, Vidal‐Naquet M, Sali E (2002): Visual features of intermediate complexity and their use in classification. Nat Neurosci 5:682–687. [DOI] [PubMed] [Google Scholar]
- Viola P, Jones MJ (2004): Robust real‐time face detection. Int J Comput Vision 57:137–154. [Google Scholar]
- Watson AB, Pelli DG (1983): QUEST—A Bayesian adaptive psychometric method. Percept Psychophys 33:113–120. [DOI] [PubMed] [Google Scholar]
- Wild HA, Busey TA (2004): Seeing faces in the noise: Stochastic activity in perceptual regions of the brain may influence the perception of ambiguous stimuli. Psychon Bull Rev 11:475–481. [DOI] [PubMed] [Google Scholar]
- Winston JS, Henson RN, Fine‐Goulden MR, Dolan RJ (2004)fMRI‐adaptation reveals dissociable neural representations of identity and expression in face perception. J Neurophysiol 92:1830–1839. [DOI] [PubMed] [Google Scholar]
- Xu X, Yue X, Lescroart MD, Biederman I, Kim JG (2009): Adaptation in the fusiform face area (FFA): Image or person? Vision Res 49:2800–2807. [DOI] [PubMed] [Google Scholar]
- Yue X, Cassidy BS, Devaney KJ, Holt DJ, Tootell RB (2011): Lower‐level stimulus features strongly influence responses in the fusiform face area. Cereb Cortex 21:35–47. [DOI] [PMC free article] [PubMed] [Google Scholar]
- Zhang H, Liu J, Huber DE, Rieth CA, Tian J, Lee K (2008): Detecting faces in pure noise images: A functional MRI study on top‐down perception. Neuroreport 19:229–233. [DOI] [PubMed] [Google Scholar]
Associated Data
This section collects any data citations, data availability statements, or supplementary materials included in this article.
Supplementary Materials
Supporting Information Figure 1.
Supporting Information Figure 2.
Supporting Information Figure 3.
Supporting Information Figure 4.