

Abstract
Statistical regularities pervade our perceptual world. Assuming that the human brain is tuned for satisfying the constraints of the visual environment, visual system computations should be optimized for processing such regularities. A socially relevant and highly recurrent homogenous pattern for which the brain has developed sensitivity is certainly the human face. Yet, for which statistical regularities the face sensitive regions are tuned for, and to what extent their detection occurs automatically is largely unexplored. Using fMRI we measured activations within the face sensitive areas for nonface symmetrical and asymmetrical curvilinear patterns with either more high‐contrast elements in the upper or in the lower part. Faceness evaluation performed outside of the scanner showed that these patterns were not perceived as schematic faces. Noticeably, symmetry violations disrupted perception of faceness, despite objective image similarity measures showing high faceness values for those patterns. Among the faces sensitive regions, only the right Fusiform Face Area (FFA) showed sensitivity to symmetry. This region showed also greater responses to patterns with more elements in the upper part. Critically, the FFA's responses were more strongly correlated with the physical objective faceness properties of the stimuli than the perceived subjective faceness ratings of the observers. These findings provide direct evidence that the neural computations of the right FFA are tuned to curvilinear symmetrical patterns with high‐contrasted elements in the upper part, which fit best with the physical structure of human faces. Such low‐level geometrical regularities might be used by the FFA to automatically categorize visual shapes as faces. Hum Brain Mapp 2009. © 2008 Wiley‐Liss, Inc.
Keywords: fMRI, face recognition, visual stimuli, extrastriate cortex, functional localization
INTRODUCTION
Our visual world is not randomly organized. Natural inputs share statistical regularities, and many of them are actually, or potentially, important for our survival. When we look around us, we readily recognize an impressively large number of objects despite substantial variations in the actual visual input that impinge upon the retina. To achieve this feat, the visual system must simplify information by detecting regularities and pool the natural range of variability into similar categories. A biologically relevant visual pattern for which the brain has developed sensitivity is the human face [Haxby et al., 2000]. Despite its large variability in terms of size, orientation, and luminance, the human brain quickly extracts a wealth of nonverbal signals from faces critical for communication: identity, gender, expression, and so forth. This highly developed and expert visual skill relies on a crucial prerequisite at the entry level: the detection and categorization of visual objects as faces [Tanaka, 2001]. Human faces are roughly symmetrical objects that share similar salient shapes arranged in fixed locations across exemplars (e.g. two eyes above a central nose and mouth), which results in an intrinsic geometrically top‐heavy vertical bias (i.e. more elements in the upper compared to the lower part). Yet whether and how these geometrical regularities are represented in the cortical system and contribute to its response selectivity for human faces remains to be clarified. Moreover, whether the neural tuning in the face regions would require explicit use of active mechanisms to achieve such categorization or not is largely unclear.
Face processing in the human brain is mediated by both distributed [Haxby et al., 2001] and localized representations [Haxby et al., 2000], with right hemispheric dominance in the bilateral ventral visual pathway [e.g. Caldara et al., 2006; Kanwisher et al., 1997]. Within this network, there is a non‐retinotopic region that is thought to be critical for efficient face, but not object, processing [Grill‐Spector et al., 2004], which responds significantly more to faces than any other visual category: the right middle fusiform gyrus, so called the ‘Fusiform Face Area’ (rFFA) [Kanwisher et al., 1997]. Another region posterior to the FFA––the inferior temporal occipital cortex––also plays a critical role in the extraction of face representations: the so called Occipital Face Area (OFA) [Gauthier et al., 2000; Rossion et al., 2003]. Despite the large number of neuroimaging studies in face perception, only a few have directly investigated the neural tuning of the face areas. Levy et al. [2001] have identified a visual field bias in the brain regions coding for faces and buildings. Face areas are associated with central‐biased representations, compared to periphery‐biased representations in the building areas. This particular tuning in the face system might relate to the extraction of fine details and global configurations properties, as the rFFA appears to be equally sensitive to modulations in the spatial frequencies range [Rotshtein et al., 2007]. More recently, neuroimaging studies in humans [Loffler et al., 2005] and macaques [Leopold et al., 2006] have reported a convergent norm‐based coding in the face system, which was expressed by a particular tuning for the average of a subset of faces. Individual faces were coded as a function of the distance from the average face (prototype). The average translates the statistical regularities in faces, as it naturally depicts the invariant information. This norm‐based mechanism might represent an economic coding strategy for the face system, as individual faces would be encoded as a difference from the average [Leopold et al., 2006]. However, all these studies do not provide any information regarding a fine‐grained geometrical tuning in the face system. In an attempt to clarify this issue, we previously used an approach inspired by recent findings obtained in the newborn literature, which showed larger sensitivity to nonface visual patterns presenting a greater number of high‐contrast elements in the upper compared to the lower vertical part of the stimulus in this population [Turati et al., 2002]. In an fMRI experiment, we presented adult participants with schematic curvilinear and square patterns with either more elements in the lower or in the upper part [Caldara et al., 2006]. The FFA showed sensitivity to curvilinear patterns with more high‐contrasted elements in the upper part uniquely when they were inscribed in a curvilinear contour. This neural tuning can be attributed to mechanisms sensitive to the structural geometry of faces and might relate to an economic strategy used by the neural face system for categorizing face shapes in the visual world. However, the visual patterns used in our previous study [Caldara et al., 2006] were all symmetrical and, consequently, did not allow us to draw any conclusions regarding this important structural rule.
Symmetrical human faces1 are perceived as sexually attractive [Little and Jones, 2003; Mealy et al., 1999; Rhodes et al., 1998], healthier and more intelligent [Rhodes et al., 2001; Zebrowitz and Rhodes, 2004], all representing crucial factors for social and biological interactions. However, the perception of symmetry in humans relies on specific mechanisms and constraints of the visual system, as, for instance, symmetry detection of complex radial frequency shapes differs from those of dot patterns [Wilson and Wilkinson, 2002]. In particular, symmetry detection is better for upright compared to inverted faces despite that these visual stimuli are matched for their low‐level properties [Rhodes et al., 2005], suggesting that high‐order mechanisms subtend to this human ability on processing such statistical regularity on faces.
A few neuroimaging studies have recently investigated the role of symmetry in the visual cortex. Symmetry detection for dot patterns involves integration of visual information in extrastriate visual areas with large receptive fields (i.e. V3A, V4, V7) [Sasaki et al., 2005] and LO [Sasaki et al., 2005; Tyler et al., 2005], suggesting that high‐order mechanisms are required for symmetry perception of low‐level stimuli, without the involvement of particular attentional resources [Tyler et al., 2005]. Recently, Chen et al. [2006] investigated the role of symmetry for faces by comparing the activations of the face sensitive regions for front view upright faces and their phase scrambled version that were vertically symmetric. When these two conditions were contrasted, the only region that was sensitive to symmetry was the right OFA, but surprisingly not the right FFA (rFFA). Considering the importance of symmetry that is robustly found for faces in behavioral studies, it is somewhat surprising that this geometrical rule does not affect the level of activation in the most important face sensitive area (i.e. the right FFA).
The present study was designed to further investigate the role of symmetry in the face sensitive areas and its interaction with the top‐heavy vertical bias (upper > lower). More generally, we aimed to improve our understanding of the neural tuning underlying rFFA activations, by using nonface stimuli that optimally modulate rFFA activations [Caldara et al., 2006]. We used the same methods as our previous functional MRI (fMRI) study [Caldara et al., 2006]. We sampled the visual input space by presenting the participants with geometrical patterns presenting orthogonal visual properties and tested their tuning in the occipito‐temporal face sensitive regions. After the scanning sessions, participants evaluated the faceness of the presented stimuli, as well as a schematic face‐like stimulus. We also aimed to investigate to what extent the neural responses of the face sensitive regions were subtended by perceived (subjective) or physical (objective) faceness properties. Thus, we calculated the faceness of each individual pattern, as measured by an image similarity index with the schematic face‐like control stimulus, and compared the relative contribution of perceived (subjective evaluations) and physical (objective image similarity) faceness indices with the brain signals. We expected that at least symmetrical curvilinear patterns with more high‐contrast elements in the upper part will enhance the responses of the human adult cortex coding for faces, as their low‐level structural properties are comparable to those of human faces [Caldara et al., 2006].
METHODS
Stimuli
Stimuli consisted of:
-
i
Twenty full front photographs of unfamiliar faces (http://faces.kyb.tuebingen.mpg.de).
-
ii
Twenty pictures of common objects (http://www.cog.brown.edu).
-
iii
Twenty symmetrical and asymmetrical head‐shaped patterns with either more elements in the upper or the lower visual part. To sample at maximum the space covered by all the images, minimize adaptation effects and consequently extract a general rule rather than an observation related to a sub‐sample of possible patterns, we created a set of configurations comprising a minimum of four elements and a maximum of seven elements.
The number of the elements was greater either in the upper or in the lower half of the stimulus and the identical set of configurations was adapted for the asymmetrical conditions by misplacing only one element (black square‐‐‐see Fig. 1). The center spatial frequencies [Parish and Sperling, 1991] are similar across conditions (mean ± SD): symmetrical head‐shaped patterns with more elements in the upper part = 5.91 ± 0.44 c/image; symmetrical head‐shaped patterns with more elements in the lower part = 6.01 ± 0.44 c/image; asymmetrical head‐shaped patterns with more elements in the upper part = 5.96 ± 0.43 c/image; and asymmetrical head‐shaped patterns with more elements in the lower part = 6.01 ± 0.43 c/image. Critically, the position of the squares in the visual patterns we used (see Fig. 1) was different across stimuli (n = 20), abolishing potential adaptation effects.
-
iv
A schematic face‐like stimulus (see Fig. 1) inscribed in a head‐shaped pattern was created in order to control for the evaluation of the faceness of the stimuli used during the scanning sessions.
Figure 1.

Left: examples of stimuli used during and after the fMRI scanning. Right: the face‐like control stimulus.
Participants
Eleven adult participants (seven women, mean age = 24.5 years, one left handed) with normal vision, voluntarily participated in the study. Six of the participants analyzed here have been included in our previous study [Caldara et al., 2006]. All the participants gave written informed consent and the protocol was approved by the ethical committee.
Tasks
For all the tasks, a block design that alternated between “control” and “activation” sequences was applied. Face and object epochs (18 s; 6 TR) were counterbalanced and separated by baseline epochs (fixation cross, 9 s; 3 TR). Two runs were performed, using a “localizer” block design alternating periods of faces (n = 20) and objects (n = 20) [Kanwisher et al., 1997], with six epochs of each experimental condition (faces or objects) in each run. In each face and object epoch, 24 stimuli were presented for 750 ms, without any offset, but a small shift of location (20 pixels) between consecutive images [Caldara et al., 2006]. Four of the 24 images were repeated twice consecutively and participants were required to detect the immediate repetitions by pressing a response key (one‐back task).
For the experimental conditions we used two runs of symmetrical and asymmetrical head‐shaped (n = 20) with either more elements in the upper or the lower vertical part (see Fig. 1). Three epochs of the four conditions were pseudorandomly presented in each run. In each epoch 24 stimuli were presented (18 s; 6 TR) and separated by baseline epochs (fixation cross, 9 s; 3 TR). Participants had to detect the immediate repetition of the same stimulus (4 out of 24 images) and report their answers with a response key. All the images were displayed for 600 ms on a black background with an interleaved fixation cross (150 ms). Participants were required to fixate on this cross throughout the duration of the experiment. All stimuli were presented to the subjects via a video projector and a system of mirrors fastened to the head coil. The visual field spanned by this set‐up was ∼15 × 11°.
After the scanning sessions, participants were debriefed and required to report their general impressions, and what they thought was the aim of the scanning sessions. No feedback was provided. Then they were instructed to rate on a Likert scale of 1 (nonface‐like) to 8 (face‐like) the faceness of the patterns and the schematic face‐like control stimulus, which were not presented during the fMRI scanning sessions. All these stimuli were presented in a random sequence on a computer monitor, with the same duration used in the scanner (600 ms) and an inter‐stimulus interval of 2 s. Participants were required to express their faceness judgment by pressing the respective key (1–8) of a computer keyboard. Responses were acquired without time constraints. After this final stage, the real aim of the study was explained in detail to the participants in accordance with our ethical policy.
Finally, we also analyzed the objective faceness of the images used during the fMRI scanning sessions by measuring the similarity between each of the images (20 per condition) and the schematic face‐like control stimulus. For each condition separately, images were recoded as vectors and a measure of faceness with the schematic face‐like stimulus was obtained by computing cosine (cos) similarity values between the each of the stimuli used in the experiment and the schematic face‐like stimulus. This was formally achieved by applying the following formula:
where T denotes the vector transpose and ‖ ‖ the norm (i.e. length or magnitude) of the vector. Formally, the ratio computed in the cos formula corresponds to the cosine angle between the images (vectors), which has the interesting property of having a scale invariant value range extending from 0 to 1 (a formal property that Euclidian distances do not possess). As the angle between the images (vectors) shortens, the cosine angle approaches 1, meaning that the two images are getting closer and their similarity increases. On the contrary, a cosine angle near to 0 indicates that the images (vectors) are orthogonal, uncorrelated (i.e. different). This formula was iteratively applied to each of the s k stimuli (with k‐th extending from 1 to 20 in each condition) and the face‐like controls stimulus (f). Finally, the computed cosine values (20) were compared using an ANOVA with Symmetricity (symmetric vs. asymmetric) and Greater number of elements' location (upper vs. lower) as factors.
Imaging Methods
Experiments were performed on a 1.5 T whole‐body MRI system (Philips Medical Systems, Best, Netherlands) using the standard head coil configuration. Acquired multislice volume was positioned on sagittal scout images. Anatomical reference images consisted of a 3D‐GRE T1‐weighted sequence (TE = 15 ms; FOV = 250 mm; matrix = 256 × 256; slice thickness = 1.25 mm). For the localizer block paradigm and the experiment, functional imaging consisted of an echo planar imaging (EPI) GRE sequence (TR = 3000 ms; TE = 40 ms; flip = 80°; FOV = 250 mm; matrix = 128 × 128; 30 contiguous 5‐mm axial slices). A vacuum cushion (PAR Scientific A/S, Denmark) was used to minimize head movement. Functional scanning was always preceded by 9 s of dummy scans to insure tissue steady‐state magnetization.
Image and Behavioral Analyses
Collected data were processed with cross‐correlation analysis [Bandettini et al., 1993] after motion correction [Woods et al., 1993] and smoothing (full width half maximum (FWHM) = 6 × 6 × 6 mm3) using MEDx software (Sensor Systems, Sterling, VA) [Gold et al., 1998]. The cross‐correlation, expressed in terms of Z‐values, was calculated pixelwise between a delayed boxcar function and the set of measurements. Individual Z‐score maps were then resampled and normalized to the Talairach space [Talairach and Tournoux, 1998]. The normalization procedure used in MEDx consisted of the application of an affine transformation following identification of eight anatomical landmarks (including the anterior and posterior commissures points). Clusters of size of >0.08 cm3 (>10 voxels; voxel size after normalization was 2 × 2 × 2 mm3) showing a statistically significant Z‐score (typically Z‐threshold = 3.0, equivalent to P < 0.002 uncorrected) in the face‐object comparison were considered [Forman et al., 1995]. We then computed additional post hoc analyses to reveal the influence of the perceived stimuli on the detected MRI signal. For this purpose, clusters activated during the localizer block paradigm were identified for each subject (size >0.08 cm3, at Z‐threshold = 3.0) and used as region of interest (ROI). Here we tested our hypothesis in a handful of ROIs in order to increase the significance of our inferences [Saxe et al., 2006]. Principally, three ROIs were identified: the right FFA, the left FFA and the right OFA [for more details see Caldara et al., 2006]. The left OFA was identified in only four participants, which decreased its statistical power for testing the effects of the experimental conditions. For this reason we excluded this ROI from the analyses.
For each defined ROI a mean timecourse (i.e. BOLD percent signal change) was obtained by averaging the timecourses of individual voxels within the ROI during each experimental run. Since not all the participants showed activation in all the ROIs (which leaded to missing values across regions), the different experimental conditions were separately compared by using 2 × 2 repeated measure ANOVAs in each individual ROI, with Symmetricity (symmetric vs asymmetric) and Greater number of elements' location (upper vs lower) as factors. To further investigate whether brain activations and faceness rating scores were linked, when appropriate we carried out a 2 × 2 repeated measure ANOVA with the BOLD signal for Symmetricity (symmetric vs asymmetric) and Greater number of elements' location (upper vs lower) as factors and the normalized faceness scores as a covariate [Winer et al., 1991].
Independently for each participant, behavioral faceness rating scores were normalized by rescaling raw rating score values between 0 (minimum) and 1 (maximum) for each individual by using the following formula: (faceness raw rating score − minimum faceness raw rating)/(maximum faceness raw rating − minimum faceness raw rating). The normalization process neutralizes subjective differences in the rating scores across the participants (since a judgment of faceness is by definition not absolute), resulting in all participants sharing values in the same range. The normalization process also allows the direct comparison of faceness scores within and between subjects.
Finally, we computed within subjects correlation analyses in order to investigate whether the perceived (subjective) and the physical (objective) faceness of the presented patterns were related to brain activations. This analysis was carried out by completing the following steps. (i) for each participant we computed a first within‐subject Person's correlation between the profile of activations for all the conditions (mean % signal change averaged across blocs for the symmetrical and asymmetrical head‐shaped patterns with more elements in either the upper or lower part––a vector of length 4) and the perceived (subjective) faceness rating scores for the respective conditions (a vector of length 4). (ii) We computed a second within‐subject Person's correlation between subjects' profile of activations for all the conditions (mean % signal change averaged across blocs for the symmetrical and asymmetrical head‐shaped patterns with more elements in either the upper or lower part––a vector of length 4) and the physical (objective) normalized faceness scores2 (a vector of length 4). (iii) Since correlation coefficients are not additive, they must be z‐normalized [Chung et al., 2005], before performing statistical analyses. We thus normalized the obtained correlation coefficient by using Fisher's transform  . (iv) To test whether the observed normalized correlations between BOLD activations and, respectively, the perceived and the physical faceness were significantly different from 0 (null correlation), we used one sample t test across subjects for each ROI separately. (v) Then, to estimate the average correlation coefficients for each ROI, we applied an inverse of Fisher's transform on the mean of Z values (Z
mean) using the following formula: r
average = tanh(Z
mean), in which tanh stands for the hyperbolic tangent. (vi) Finally, to determine whether the observed correlation coefficients between BOLD activations and, respectively, the perceived and the physical faceness were significantly different, the obtained Z values were compared by using separate paired t‐test in each ROI independently.
. (iv) To test whether the observed normalized correlations between BOLD activations and, respectively, the perceived and the physical faceness were significantly different from 0 (null correlation), we used one sample t test across subjects for each ROI separately. (v) Then, to estimate the average correlation coefficients for each ROI, we applied an inverse of Fisher's transform on the mean of Z values (Z
mean) using the following formula: r
average = tanh(Z
mean), in which tanh stands for the hyperbolic tangent. (vi) Finally, to determine whether the observed correlation coefficients between BOLD activations and, respectively, the perceived and the physical faceness were significantly different, the obtained Z values were compared by using separate paired t‐test in each ROI independently.
RESULTS
Visual Image Analyses
The physical image similarity between the stimuli used during fMRI scanning sessions and the schematic face‐like control pattern are reported in Figure 2.
Figure 2.

Image similarity means and their standard errors between the stimuli used for the fMRI experimental conditions and the face‐like control stimulus (cosine ([0,1]). The average image of the patterns in each respective condition is reported inside the bars. [Color figure can be viewed in the online issue, which is available at www.interscience.wiley.com.]
The ANOVA revealed a significant interaction between the Symmetricity and Greater number of elements' location (F(1, 76) = 7.89, P = 0.006). As expected, head‐shaped visual patterns with more elements in the upper part presented the higher score (cos = 0.89) in terms of image similarity with the schematic face‐like pattern (post‐hoc t tests head‐shaped symmetric lower, cos = 0.85, t(19), P < 0.0001; head‐shaped asymmetric upper, cos = 0.88, t(10), P < 0.01; head‐shaped asymmetric lower, cos = 0.87, t(10), P < 0.0001)). We also observed a main effect of the Greater number of elements' location (F (1, 76) = 15.061, P < 0.001), but the Symmetricity factor did not reach significance (F(1,76) = 0.14, P = 0.7).
Behavioral Results
Participants performed comparably in terms of accuracy and speed across conditions in the one‐back repetition task. Image repetitions were respectively detected with an accuracy of 95% (SE ± 0.94%) for symmetrical patterns with more elements in the upper part, 95.27% (±1.08%) for symmetrical patterns with more elements in the lower part, 95.36% (±1.02%) for asymmetrical patterns with more elements in the upper part and 95% (±1.08%) for asymmetrical patterns with more elements in the lower part. Repetition of symmetrical patterns with more elements in the upper part were respectively detected in 494 ms (±29 ms), 491 ms (±26 ms) for symmetrical patterns with more elements in the lower part, 475 ms (±27 ms) for asymmetrical patterns with more elements in the upper part and 505 ms (±30 ms) for asymmetrical patterns with more elements in the lower part. No statistical significant differences were observed in terms of accuracy or reaction times.
As expected, faceness rating scores were significantly larger for the schematic face‐like control stimulus (1––Likert scale values normalized from 0 to 1) presented outside the scanner compared to all the visual patterns used during fMRI scanning sessions (Fig. 3–minimum significant P value when compared to any of the experimental conditions: P < 0.0001).
Figure 3.

Normalized faceness rating scores, and their standard errors, for the fMRI experimental conditions (0: minimum; 1: maximum). Note, the ceiling effect for the face‐like control stimulus that was not presented during the fMRI scanning sessions, indicating that the schematic face‐like pattern was perceived and rated as the most face‐like stimulus by all the participants. [Color figure can be viewed in the online issue, which is available at www.interscience.wiley.com.]
This result indicates that the schematic face‐like pattern was perceived and rated as the most face‐like stimulus by all the participants. A repeated measure ANOVA on the faceness rating scores related to the experimental conditions, revealed a significant effect of Symmetricity (F(1, 10) = 27.53, P < .001) and a marginal effect on the Greater number of elements' location (F(1, 10) = 4.13, P = 0.7). The interaction between these factors was not significant (F(1, 10) = 3.34, P = 0.1).
Neuroimaging Results
Significantly greater activations for faces compared to objects were found in all subjects in the right FFA (rFFA; (x,y,z) = 41, −52, −17) (see Fig. 4).
Figure 4.
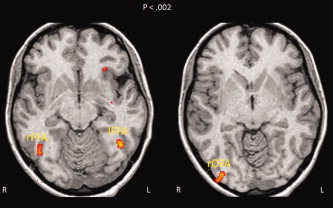
Functional regions of interest for faces identified by the localizer paradigm in one participant showing the three ROIs (R/r = right; L/l = left). The images are displayed in radiological convention so that the left direction on the page corresponds to the right direction on the anatomy and vice versa. [Color figure can be viewed in the online issue, which is available at www.interscience.wiley.com.]
We identified the other face sensitive regions, but not in all the subjects. The left FFA (lFFA; (x,y,z) = −38, −51, −16) was activated in nine participants, the right OFA (rOFA; (x,y,z) = 36, −82, −6) in eight participants.
Repeated measures ANOVA revealed the presence of additive effects. Head‐shaped patterns with a greater number of elements in the upper vertical part showed larger responses in the rFFA compared to those with a greater number of elements in the lower part (F(1, 10) = 9.53, P = 0.011). Symmetrical patterns elicited larger activations in the rFFA compared to the asymmetrical ones (F(1, 10) = 5. 3, P = 0.044) (see Fig. 5). The interaction between Symmetricity (symmetric vs. asymmetric) and Greater number of elements' location (upper vs. lower) failed to reach the significance (F(1, 10) = 0.15, P = 0.70). But this pattern of activations was mostly accounted by the symmetrical head‐shaped patterns with more elements in the upper part (mean % signal change = 0.39%), as revealed by the comparison with the other experimental conditions (post‐hoc t tests head‐shaped symmetric lower, mean signal % change = 0.15%, t(10), P < 0.0001; head‐shaped asymmetric upper, mean % signal change = 0.25%, t(10), P < 0.05 and lower, mean % signal change = 0.14%, t(10), P < 0.01)). To further investigate the additive effects, a paired bootstrap analysis with 1,000 permutations was subsequently performed on the differences for each of the factors (Greater number of elements' location: upper‐lower vs. Symmetricity: symmetric‐asymmetric). This analysis revealed a marginal significant effect (P = 0.07), a greater number of elements in the upper part elicited larger activations (mean % signal change = 0.21%) compared to symmetry (mean % signal change = 0.11%).
Figure 5.

Mean BOLD signal percent change measures across participants, and their standard errors, related to the processing of the experimental visual patterns within the functionally defined brain ROIs. The relative number of participants presenting significant activations for faces within their respective selective regions is reported in parentheses. [Color figure can be viewed in the online issue, which is available at www.interscience.wiley.com.]
A supplementary 2 × 2 repeated measures ANOVAs with the BOLD signal for Symmetricity (symmetric vs. asymmetric) and Greater number of elements' location (upper vs. lower) as factors of interest and the normalized faceness scores as a covariate was performed in order to control for the subjective perception of faceness in the brain activations. As observed before, we found a main significant effect for the Greater number of elements' location (F(1, 10) = 8.087, P = 0.019) and for Symmetricity (F(1, 10) = 9.66, P = 0.013). The interaction between these factors was not significant (F(1, 10) = 0.64, P = 0.80).
Symmetric patterns also elicited larger activations in the rOFA compared to the asymmetrical ones (F(1, 7) = 5.95, P = 0.045). There was also a significant effect of the Greater number of elements' location (F(1, 7) = 7.93, P = 0.026); patterns with more elements in the lower part enhanced activation of this brain region. Both effects were essentially driven by larger activations for the symmetry condition with more elements in the lower part. The interaction was not significant (F(1, 7) = 2.29, P = 0.17). However, when the normalized faceness rating scores were taken into account as a covariate, both effects failed to reach the significance (Symmetricity: (F(1, 7) = 3.7, P = 0.1; Greater number of elements' location: (F(1, 7) = 4.13, P = 0.09). No significant effects were found in the activations of the left FFA (Greater number of elements' location (F(1, 8) = 0.112, P = 0.74); for Symmetricity (F(1, 8) = 1.0601, p = 0.33)and for their interaction (F(1, 8) = 0.02, P = 0.89)).
Finally, to investigate whether brain activations were related to the physical or the perceived faceness of the stimuli, for each region of interest separately, we computed within‐subject Pearson's correlations between the mean percent signal change profile and respectively both, the mean image similarity values (cosine) across all the experimental conditions and the individual normalized faceness scores. The average correlation coefficients are reported in Table I. Average correlations were significantly different from 0 in the rFFA only.
Table I.
Average of the within subjects normalized correlation coefficients between the individual brain activations (mean % signal change), and the objective—physical—faceness (image similarity—cos) and the normalized subjective faceness—perception—ratings for all the conditions
| rFFA | lFFA | rOFA | |
|---|---|---|---|
| Objective Faceness | 0.71* | 0.44 | −0.35 |
| Subjective Faceness | 0.38* | 0.57 | 0.61 |
The correlation was computed separately in each ROI and transformed into Fisher's Z values. Correlation significantly different form 0 are reported with an ‘*’. Note that the absence of correlations significantly above 0 in the lFFA and rOFA is due to the high variability across subjects observed in these ROIs.
Paired t‐test statistical analyses on the Z values correlations observed between the BOLD responses and the physical and the perceived faceness were finally carried out in each region separately. The rFFA responses was correlated more strongly with the physical (r = 0.71) rather than the perceived (r = 0.38) faceness of the stimuli (t(10), P = 0.01). On the contrary, rOFA activations were more correlated with the perceived (r = 0.61) rather than the physical (r = −0.35) faceness of the stimuli (t(7), P = 0.001). The same comparison failed to reach significance in the lFFA (t(8), P = 0.06).
DISCUSSION
We used fMRI to investigate the sensitivity to geometrically structural properties in the brain regions preferentially responding to human faces. Of specific interest was whether the neural face system was sensitive to symmetry when this visual property was combined with different curvilinear geometrical configurations. Unlike previous studies [e.g. Chen et al., 2006] that confronted participants with symmetrical zero phase scrambled patterns (not presenting any salient geometrical bias in terms of image contrast) and normal faces, our participants were shown with symmetrical and asymmetrical curvilinear high‐contrasted patterns with either more elements in the upper or the lower visual part. This procedure ensured that some critical dimensions modulating the activation of at least the rFFA [Caldara et al., 2006], namely a curvilinear top‐heavy vertical bias, were used to optimally investigate the sensitivity for symmetry. Participants were unaware of the aim of the experiment and the behavioral results clearly showed that the schematic patterns were not perceived as face‐like stimuli [for a detailed discussion on this point see also Caldara et al., 2006], as confirmed by verbal reports. Strikingly, behavioral measures revealed a discrepancy between the perceived (subjective) and the physical (objective) quantification of the faceness of the stimuli. A violation of symmetry induced a dramatic disruption of faceness perception in the participants, even though this same violation does not disrupt the physical faceness of the stimuli, as revealed by a visual image similarity measure with the schematic face‐like pattern. Our neuroimaging results confirmed the critical role of the right FFA in processing statistical regularities optimal for face categorization. Among face sensitive areas identified, only the rFFA shows responses modulated by the geometrical configurations we manipulated. In line with our previous observations [Caldara et al., 2006], the rFFA was sensitive to a greater number of high contrast elements in the upper part. Importantly, the present findings also demonstrate that the rFFA is sensitive to symmetry. Symmetrical patterns elicit larger responses in this area compared to asymmetrical ones.3 Strikingly, however, rFFA activations were more strongly correlated with the physical faceness of the stimuli, than the perceived faceness, at least as faceness defined as a simple schematic face‐like pattern. It is worth noting that this pattern of activation cannot be accounted by an attentional confound, as the task constraints were unrelated to our questions of interest (one‐back repetition task) and the participants showed similar behavioral performance across conditions. This observation might suggest that the rFFA is an automatic detector of physical patterns sharing objective statistical regularities with the structure of human faces. However, a potential influence of the face context induced by the localizer scans cannot completely rule out the possibility that participants extracted and implicitly learned the geometrical rules specific to faces without awareness. Implicit learning occurs in situations in which participants become sensitive to certain regularities in the environment (1) in the absence of intention to learn about those regularities (2) in the absence of awareness that one is learning, and (3) in such a way that the resulting knowledge is difficult to express [Cleeremans, 2002].
Human faces can be defined as curvilinear visual objects presenting a top‐heavy vertical bias. Faces encapsulate a larger proportion of salient and high‐contrast features in the upper (eyes, eyebrows, hairs) compared to the lower part (mouth), which across faces are congruently and bilaterally located along the vertical symmetrical axis (Fig. 6, top), regardless of expression. Symmetry in faces plays a crucial (evolutionary) role for social and biological interactions [Zebrowitz and Rhodes, 2004]. Therefore, it is not surprising that the current neuroimaging findings showed preferential responses to this facial salient cue in the brain region that is the most sensitive to face processing: the rFFA. However, our supplementary analyses using the bootstrap approach revealed a marginal effect in the strength of the rFFA responses to a top‐heavy bias compared to symmetry (the top‐heavy patterns electing about twice of the mean % signal change than the symmetrical ones). Since symmetry and the top‐heavy bias are both important in face processing (Fig. 6, top) why these properties might not be represented with the same extent within the neural face system?
Figure 6.

Top‐right: Average face calculated across the images of 35 men and 35 women presenting 7 expressions (neutral, fear, anger, disgust, happy, sad, and surprise—KDEF face database, 1998). The composite image results in a symmetrical face, with a triangular top‐heavy bias. Bottom‐right: Composite image resulting from averaging face composites presenting different views. Note, that now symmetry disappears, as this property is not reliably shared across the exemplars. Critically, however, the final face composite still presents more elements in the upper part (red dots). [Color figure can be viewed in the online issue, which is available at www.interscience.wiley.com.]
Despite our canonical representation of faces being in the full‐front view and the fact that most experiments on face processing use bilateral symmetrical faces, in everyday life we are continuously confronted with moving faces that most of the time impinge upon our retina in an asymmetrical configuration along the vertical axis. Thus, the face system might rely more on visual cues extracted from the top down bias than symmetry to categorize shapes as faces. Indeed, the top‐heavy bias is invariant, present even in asymmetrical views (Fig. 6, bottom). In addition, behavioral evidence suggests that information on symmetry could be even extracted from non symmetrical face views [Troje and Bulthoff, 1998], which might also explain why the top‐down bias showed marginal stronger sensitivity in the rFFA than symmetry.
Symmetrical and asymmetrical patterns with more elements in the upper part both showed the largest responses in the rFFA. On average, the patterns presented in these conditions had a salient contrast in the upper part (see Fig. 2), a region that might be related to the eyes in normal faces. The eyes are unequivocally the most critical feature for face identification [Caldara et al., 2005; Ellis et al., 1979; Gosselin and Schyns, 2001; McKelvie, 1976] and for communicating non verbal information, as they convey emotions, direction of attention and intentions [Baron‐Cohen, 1995]. Studies of eye movements have revealed triangular pathway between the eyes and the mouth regions for face processing [Althoff and Cohen, 1999; Yarbus, 1967], with a relatively stronger weight for the eyes. Our data suggest a particular sensitivity in the rFFA for this “T” shaped contrast, as we observed larger activations in the conditions presenting this particular geometrical configuration. This particular spatial tuning also provides an alternative explanation to the so‐called face inversion effect. The presentation of faces upside‐down sharply impairs their recognition compared to objects in similar orientation [for a recent review see Rossion and Gauthier, 2002; Yin, 1969]. In this particular nonecological situation, faces present more elements in the lower compared to upper part, which might explain the decrease of activations in the brain area processing faces [for a detailed discussion on this point see also Caldara et al., 2006].
Chen et al.'s study [2006] did not find sensitivity for symmetry in the rFFA, but it did in the rOFA. A possible explanation for the absence of symmetry sensitivity in the rFFA in Chen et al.'s study [2006] could rely on the fact that zero phase symmetrical patterns do not enclose any salient geometric structure besides symmetry. Therefore, the contrast is uniformly spread across the image axes and do not present any bias in the location of high‐contrasted elements (i.e. in the upper/lower part). Consequently, the rFFA might not have been sufficiently stimulated by these suboptimal patterns and might have not reached the threshold allowing the expression of differential sensitivity. Our previous results [Caldara et al., 2006] clearly showed that changing one salient dimension of symmetrical visual patterns (i.e. the shape or the location of the greater number of elements) significantly and sharply increased or decreased the activations in the rFFA. On the contrary, in line with Chen et al. [2006], we also found an effect of symmetry in the rOFA. However, this effect was confounded with the perceived faceness, as showed by both the correlation analyses and the statistical analyses taking into account this measure as a covariate. Future studies are necessary to clarify the precise nature of the mechanisms occurring in the rFFA and rOFA, the dynamics and interaction between face selective regions and the clear role of low‐level statistical regularities in face identification [Rotshtein et al., 2005], as the current study was designed to uniquely investigate the modulation of perceptual mechanisms rather than face identification.
Newborns tested with similar head‐shaped nonface stimuli [Turati et al., 2002], and also with more realistic face‐like stimuli [Macchi Cassia et al., 2004], showed a visual preference for patterns with more elements in the upper part, but not for symmetry. These observations suggest that a tuning for symmetry is constructed with visual experience (at least with face‐like patterns), which might explain why the strength for the tuning to this visual property is lower compared to the top‐heavy bias. However, it is worth noting that is difficult to compare newborns' findings with the present neuroimaging observations in the adult population. Despite the fact that it has been suggested that the superior colliculus route plays a critical role in the newborn preference for face detection [Johnson, 2005], we still lack of direct evidence and it is still unknown whether the brain regions sensitive to faces in adults are or not involved in the immature newborns' brain. Therefore, the present findings cannot be straightforwardly compared across both populations. Future studies are necessary to isolate the brain roots of the face preference in the newborn.
To sum up, our observations revealed that the rFFA is tuned to statistical regularities shared in the intrinsic structure of faces (two horizontal eyes placed above a central nose and mouth). Symmetry finely calibrates such neural computational tuning, which occurs automatically in the rFFA and as it is related to the objective, physical faceness of the stimuli, and not to the subjective, conscious perception of faceness. This observation indicates that the rFFA might use this statistical tuning for classifying shapes best fitting with faces in the visual environment.
Acknowledgements
The authors express their gratitude to Dr. François Lazeyras (Department Radiology, Geneva University Hospitals) for his help with scanning.
Footnotes
Note, that no human face is perfectly symmetrical.
Note that performing the correlation analyses with the raw faceness scores would lead to identical results.
Note that the responses elicited in the rFFA by real faces were about four times larger than those observed by the visual patterns we used. This observation also supports the view that these patterns were not perceived as faces.
REFERENCES
- Althoff RR,Cohen NJ ( 1999): Eye‐movement‐based memory effect: A reprocessing effect in face perception. J Exp Psychol Learn Mem Cogn 25: 997–1010. [DOI] [PubMed] [Google Scholar]
- Bandettini PA,Jesmanowicz A,Wong EC,Hyde JS ( 1993): Processing strategies for time‐course data sets in functional MRI of the human brain. Magn Reson Med 30: 161–173. [DOI] [PubMed] [Google Scholar]
- Baron‐Cohen S ( 1995): Mindblindness: An Essay on Autism and Theory of Mind. Cambridge: MIT Press. [Google Scholar]
- Caldara R,Schyns P,Mayer E,Smith ML,Gosselin F,Rossion B ( 2005): Does prosopagnosia take the eyes out of face representations? Evidence for a defect in representing diagnostic facial information following brain damage. J Cogn Neurosci 17: 1652–1666. [DOI] [PubMed] [Google Scholar]
- Caldara R,Seghier ML,Rossion B,Lazeyras F,Michel C,Hauert CA ( 2006): The fusiform face area is tuned for curvilinear patterns with more high‐contrasted elements in the upper part. Neuroimage 31: 313–319. [DOI] [PubMed] [Google Scholar]
- Chen CC,Kao KL,Tyler CW ( 2007): Face configuration processing in the human brain: The role of symmetry. Cereb Cortex 17(6): 1423–1432. [DOI] [PubMed] [Google Scholar]
- Chung MK,Kim DM,Kelley DJ,Robbins S,Evans AC,Davidson RJ ( 2005): Partial correlation mapping of anatomical and behavioral measures and its application to autism. Madison: University of Wisconsin. [Google Scholar]
- Cleeremans . 2002. Models of Implicit Learning: Encyclopedia of Cognitive Science. Oxford, UK: Macmillan Publishers. [Google Scholar]
- Ellis HD,Shepherd JW,Davies GM ( 1979): Identification of familiar and unfamiliar faces from internal and external features: Some implications for theories of face recognition. Perception 8: 431–439. [DOI] [PubMed] [Google Scholar]
- Forman SD,Cohen JD,Fitzgerald M,Eddy WF,Mintun MA,Noll DC ( 1995): Improved assessment of significant activation in functional magnetic resonance imaging (fMRI): Use of a cluster‐size threshold. Magn Reson Med 33: 636–647. [DOI] [PubMed] [Google Scholar]
- Gauthier I,Tarr MJ,Moylan J,Skudlarski P,Gore JC,Anderson AW ( 2000): The fusiform “face area” is part of a network that processes faces at the individual level. J Cogn Neurosci 12: 495–504. [DOI] [PubMed] [Google Scholar]
- Gold S,Christian B,Arndt S,Zeien G,Cizadlo T,Johnson DL,Flaum M,Andreasen NC ( 1998): Functional MRI statistical software packages: A comparative analysis. Hum Brain Mapp 6: 73–84. [DOI] [PMC free article] [PubMed] [Google Scholar]
- Gosselin F,Schyns PG ( 2001): Bubbles: a technique to reveal the use of information in recognition tasks. Vision Res 41: 2261–2271. [DOI] [PubMed] [Google Scholar]
- Grill‐Spector K,Knouf N,Kanwisher N ( 2004): The fusiform face area subserves face perception, not generic within‐category identification. Nat Neurosci 7: 555–562. [DOI] [PubMed] [Google Scholar]
- Haxby JV,Gobbini MI,Furey ML,Ishai A,Schouten JL,Pietrini P ( 2001): Distributed and overlapping representations of faces and objects in ventral temporal cortex. Science 293: 2425–2430. [DOI] [PubMed] [Google Scholar]
- Haxby JV,Hoffman EA,Gobbini MI ( 2000): The distributed human neural system for face perception. Trends Cogn Sci 4: 223–233. [DOI] [PubMed] [Google Scholar]
- Johnson MH ( 2005): Subcortical face processing. Nat Rev Neurosci 6: 766–774. [DOI] [PubMed] [Google Scholar]
- Kanwisher N,McDermott J,Chun MM ( 1997): The fusiform face area: A module in human extrastriate cortex specialized for face perception. J Neurosci 17: 4302–4311. [DOI] [PMC free article] [PubMed] [Google Scholar]
- Leopold DA,Bondar IV,Giese MA ( 2006): Norm‐based face encoding by single neurons in the monkey inferotemporal cortex. Nature 442: 572–575. [DOI] [PubMed] [Google Scholar]
- Levy I,Hasson U,Avidan G,Hendler T,Malach R ( 2001): Center‐periphery organization of human object areas. Nat Neurosci 4: 533–539. [DOI] [PubMed] [Google Scholar]
- Little AC,Jones BC ( 2003): Evidence against perceptual bias views for symmetry preferences in human faces. Proc Biol Sci 270: 1759–1763. [DOI] [PMC free article] [PubMed] [Google Scholar]
- Loffler G,Yourganov G,Wilkinson F,Wilson HR ( 2005): fMRI evidence for the neural representation of faces. Nat Neurosci 8: 1386–1390. [DOI] [PubMed] [Google Scholar]
- Lundqvist D,Flykt A,Öhman A ( 1998): The karolinska directed emotional faces. Stockholm, Sweden: Karolinska Institute. [Google Scholar]
- Macchi Cassia V,Turati C,Simion F ( 2004): Can a nonspecific bias toward top‐heavy patterns explain newborns' face preference? Psychol Sci 15: 379–383. [DOI] [PubMed] [Google Scholar]
- McKelvie SJ ( 1976): The role of eyes and mouth in the memory of a face. Am J Psychol 89: 311–323. [Google Scholar]
- Mealy L,Bridgestock R,Townsend G ( 1999): Symmetry and perceived facial attractiveness. J Pers Soc Psychol 76: 151–158. [DOI] [PubMed] [Google Scholar]
- Parish DH,Sperling G ( 1991): Object spatial frequencies, retinal spatial frequencies, noise, and the efficiency of letter discrimination. Vision Res 31(7/8): 1399–1415. [DOI] [PubMed] [Google Scholar]
- Rhodes G,Peters M,Lee K,Concetta Morrone M,Burr D ( 2005): Higher‐level mechanisms detect facial symmetry. Proc R Soc Lond B Biol Sci 272: 1379–1384. [DOI] [PMC free article] [PubMed] [Google Scholar]
- Rhodes G,Proffitt F,Grady JM,Sumich A ( 1998): Facial symmetry and the perception of beauty. Psychon Bull Rev 5: 659–669. [Google Scholar]
- Rhodes G,Zebrowitz LA,Clark A,Kalick SM,Hightower A,McKay R ( 2001): Do facial averageness and symmetry signal health? Evol Hum Behav 22: 31–46. [DOI] [PubMed] [Google Scholar]
- Rossion B,Caldara R,Seghier M,Schuller AM,Lazeyras F,Mayer E ( 2003). A network of occipito‐temporal face‐sensitive areas besides the right middle fusiform gyrus is necessary for normal face processing. Brain 126(Part 11): 2381–2395. [DOI] [PubMed] [Google Scholar]
- Rossion B,Gauthier I ( 2002): How does the brain process upright and inverted faces ? Behav Cogn Neurosci Rev 1: 62–74. [DOI] [PubMed] [Google Scholar]
- Rotshtein P,Henson RN,Treves A,Driver J,Dolan RJ ( 2005): Morphing Marilyn into Maggie dissociates physical and identity face representations in the brain. Nat Neurosci 8: 107–113. [DOI] [PubMed] [Google Scholar]
- Rotshtein P,Vuilleumier P,Winston J,Driver J,Dolan R ( 2007): Distinct and convergent visual processing of high and low spatial frequency information in faces. Cereb Cortex 17: 2713–2724. [DOI] [PMC free article] [PubMed] [Google Scholar]
- Sasaki Y,Vanduffel W,Knutsen T,Tyler C,Tootell R ( 2005): Symmetry activates extrastriate visual cortex in human and nonhuman primates. Proc Natl Acad Sci USA 102: 3159–3163. [DOI] [PMC free article] [PubMed] [Google Scholar]
- Saxe R,Brett M,Kanwisher N. 2006. Divide and conquer: A defense of functional localizers. Neuroimage 30(4): 1088–1096. [DOI] [PubMed] [Google Scholar]
- Talairach J,Tournoux P ( 1998): Co‐planar stereotaxic atlas of the human brain. Stuttgart: Thieme. [Google Scholar]
- Tanaka JW ( 2001): The entry point of face recognition: Evidence for face expertise. J Exp Psychol Gen 130: 534–543. [DOI] [PubMed] [Google Scholar]
- Troje NF,Bulthoff HH ( 1998): How is bilateral symmetry of human faces used for recognition of novel views? Vision Res 38: 79–89. [DOI] [PubMed] [Google Scholar]
- Turati C,Simion F,Milani I,Umilta C ( 2002): Newborns' preference for faces: What is crucial? Dev Psychol 38: 875–882. [PubMed] [Google Scholar]
- Tyler CW,Baseler HA,Kontsevich LL,Likova LT,Wade AR,Wandell BA ( 2005): Predominantly extra‐retinotopic cortical response to pattern symmetry. Neuroimage 24: 306–314. [DOI] [PubMed] [Google Scholar]
- Wilson HR,Wilkinson F ( 2002): Symmetry perception: A novel approach for biological shapes. Vision Res 42: 589–597. [DOI] [PubMed] [Google Scholar]
- Winer BJ,Brown DR,Michels KM. 1991. Statistical Principles in Experimental Design. New York: McGraw Hill. [Google Scholar]
- Woods RP,Mazziotta JC,Cherry SR ( 1993): MRI‐PET registration with automated algorithm. J Comput Assist Tomogr 17: 536–546. [DOI] [PubMed] [Google Scholar]
- Yarbus A ( 1967): Eye Movements and Vision. New York: Plenum. [Google Scholar]
- Yin RK ( 1969): Looking at upide‐down faces. J Exp Psych 81: 141–145. [Google Scholar]
- Zebrowitz LA,Rhodes G ( 2004): Sensitivity to ‘bad genes’ and the anomalous face overgeneralization effect: Cue validity, cue utilization, and accuracy in judging intelligence and health. J Nonverbal Behav 28: 167–185. [Google Scholar]