

Abstract
Williams syndrome (WS) is a neurodevelopmental condition caused by a hemizygous deletion of ∼26–28 genes on chromosome 7q11.23. WS is associated with a distinctive pattern of social cognition. Accordingly, neuroimaging studies show that WS is associated with structural alterations of key brain regions involved in social cognition during adulthood. However, very little is currently known regarding the neuroanatomical structure of social cognitive brain networks during childhood in WS. This study used diffusion tensor imaging to investigate the structural integrity of a specific set of white matter pathways (inferior fronto-occipital fasciculus [IFOF] and uncinate fasciculus [UF]) and associated brain regions [fusiform gyrus (FG), amygdala, hippocampus, medial orbitofrontal gyrus (MOG)] known to be involved in social cognition in children with WS and a typically developing (TD) control group. Children with WS exhibited higher fractional anisotropy (FA) and axial diffusivity values and lower radial diffusivity and apparent diffusion coefficient (ADC) values within the IFOF and UF, higher FA values within the FG, amygdala, and hippocampus and lower ADC values within the FG and MOG compared to controls. These findings provide evidence that the WS genetic deletion affects the development of key white matter pathways and brain regions important for social cognition.
Keywords: DTI, genetics, social cognition, Williams syndrome
Introduction
Williams syndrome (WS) is a neurodevelopmental condition caused by a specific and well-defined genetic deletion (∼26–28 genes on chromosome 7q 11.23) (Meyer-Lindenberg et al. 2006). WS is associated with a distinctive pattern of social-cognition and behavior that include deficits in emotion recognition (Plesa-Skwerer et al. 2006), an increased affinity toward processing faces (Riby and Hancock 2008; Riby et al. 2011), and lower social inhibition (Gosch and Pankau 1994; Doyle et al. 2004). Affected adults often present with aberrant structure of brain regions important for social-cognitive functioning (Jarvinen-Pasley et al. 2008; Martens et al. 2008). Although several studies have demonstrated structural alterations of key brain regions involved in social cognition in adults with WS, very little is known about brain structure during childhood in this condition. The current study used diffusion tensor imaging (DTI) to investigate the structural integrity of a network of key white matter pathways and brain regions integral to the development of social-cognitive functioning in children with and without WS.
Adults with WS exhibit abnormal structure of a network of white matter pathways and associated brain regions important for processing facial expressions and emotions. With respect to white matter tracts, adults with WS show increased fractional anisotropy (FA) within the left inferior fronto-occipital fasciculus (IFOF) (Arlinghaus et al. 2011), decreased FA within the right IFOF (Arlinghaus et al. 2011; Avery et al. 2012), and decreased FA within the uncinate fasciculus (UF) (Avery et al. 2012; Jabbi et al. 2012) compared to controls. The IFOF is a ventral associative bundle that connects the ventral occipital lobe and the orbitofrontal cortex (Catani et al. 2002; Catani and Thiebaut de Schotten 2008; Martino et al. 2010) and is involved in face and emotion processing (Thomas et al. 2008; Philippi et al. 2009). The UF connects the amygdala, hippocampus, and the medial orbitofrontal gyrus (MOG; Kier et al. 2004; Catani and Thiebaut de Schotten 2008; Colnat-Coulbois et al. 2010) and is also involved in face and emotion processing (Papagno et al. 2011; Xu and Potenza 2012). Although DTI studies have shown abnormal structural integrity of the IFOF (Arlinghaus et al. 2011) and UF (Avery et al. 2012) in adults with WS, the integrity of these pathways during childhood in WS is currently not known.
Many brain regions that the IFOF and the UF serve to connect exhibit neuroanatomical alterations in adults with WS. In particular, when compared to healthy controls, adults with WS exhibit disproportionately larger gray matter volume of the fusiform gyrus (FG; Reiss et al. 2004; Thompson et al. 2005), amygdala (Reiss et al. 2004; Martens et al. 2009; Capitao et al. 2011), and orbital frontal cortices (Reiss et al. 2004; Meda et al. 2012) and smaller gray matter volume of the hippocampus (Meda et al. 2012). These neuroanatomical findings in adults with WS raise important questions as to whether children with WS exhibit structural abnormalities in this same social cognitive brain network. Furthermore, though voxel- or volume-based anatomical studies have demonstrated atypical gross structure of the FG, amygdala, hippocampus, and orbital frontal cortices in WS, very little is known regarding alterations of microstructure within these key brain regions. Although DTI is more often used to explore white matter microstructure, recent DTI studies suggest that altered diffusivity in brain regions that include gray matter may be representative of abnormal cell density, cell loss, or orientation of associated axons (Blood et al. 2010; De Gennaro et al. 2011; Juranek et al. 2012; Oishi, Mielke et al. 2011).
This study was designed to investigate the structural integrity of the IFOF and UF pathways and the aforementioned set of associated brain regions during childhood in WS. We collected DTI data from children with WS and a typically developing (TD) control group. In order to assess the structural integrity of the IFOF and UF white matter tracts, we used a tract-based spatial statistics (TBSS) approach (Smith et al. 2006) and compared FA, radial diffusivity (RD), axial diffusivity (AD), and apparent diffusion coefficient (ADC) between groups. To assess the structural integrity of the FG, amygdala, hippocampus, and MOG, we used a standardized, atlas-based (DiffeoMap) approach (Faria et al. 2010) and compared FA and ADC between groups. Given that aberrant social behavior is observed very early in development in children with WS (Tomc et al. 1990; Klein-Tasman and Mervis 2003; Doyle et al. 2004), we predicted that a pediatric WS sample would exhibit abnormal anatomy within the IFOF (Arlinghaus et al. 2011), UF (Avery et al. 2012), FG (Golarai et al. 2010; Haas, Hoeft, et al. 2012), amygdala (Reiss et al. 2004; Martens et al. 2009; Capitao et al. 2011), hippocampus (Meyer-Lindenberg, Mervis et al. 2005), and MOG (Reiss et al. 2004; Meda et al. 2012).
Materials and Methods
Participants
A total of 36 children, 18 WS and 18 TD, participated in this study. A 7q 11.23 deletion was confirmed for all WS participants (11 females: mean age = 11.88 years, range = 6.38–17.97 years, SD = 4.17), and each participant exhibited the clinical features of the WS phenotype, including cognitive, behavioral, and physical profiles (Martens et al. 2008).
TD children were recruited locally (Palo Alto, CA, USA) and were financially compensated for their participation (14 females; mean age = 11.06 years, range = 6.64–17.89 years, SD = 2.92). All subjects were screened for a history of psychiatric or neurologic problems using the Child Behavior Checklist (Achenbach 1992). No participant had a contraindication for MRI and written informed consent and/or assent were obtained from each parent and participant. This study was approved by the Stanford University Administrative Panel on Human Subjects in Medical Research. There were no statically significant differences in age (t = 0.69, P = 0.50) or sex [χ2 (1, N = 36) = 1.18, P = 0.28] between groups.
Cognitive and Social-Cognitive Assessment
Each participant's intellectual functioning was assessed using the Wechsler Intelligence Scale for Children–Fourth Edition (Wechsler 2003). Social and emotional functioning was assessed using the Social Cognition subscale within the Social Responsiveness Scale (SRS; Constantino and Gruber 2005) and the Affect Recognition subscale within the Developmental Neuropsychological Assessment-II (NEPSY-II) (Korkman et al. 2007).
Image Acquisition
Participants were trained for MRI procedures using an in house MRI simulator. Following successful completion of an MRI practice protocol, diffusion tensor images were acquired using a 3T whole-body GE-Signa HDxt scanner (GE Medical Systems, Milwaukee, WI, USA) with a quadrature head coil. A diffusion-weighted sequence was based on a single-shot, spin-echo, echo-planar imaging sequence with diffusion sensitizing gradients applied on either side of the 180 refocusing pulse (Basser et al. 1994). Imaging parameters for the diffusion-weighted sequence were as follows: field of view (FOV) 24 cm; matrix size 128 × 128; time repetition (TR)/time echo (TE) 5910/70.3 ms; 44 axial-oblique slices; slice thickness 3.2 mm/no skip. Diffusion gradient duration was d = 32 ms and diffusion weighting was b = 850 s/mm2 and b = 0 as reference images. Diffusion was measured along 23 noncollinear directions and was repeated 6 times.
Diffusion-Weighted Scans Preprocessing
Diffusion-weighted images were corrected for eddy current distortions and head motion using an affine transformation as implemented by Automated Image Registration (Woods et al. 1998). All individual images were visually inspected to eliminate slices with motion artifacts. There were no statistically significant differences in the number of eliminated image slices between groups (WS: mean = 173.94, SD = 204.80; TD: mean = 101.94, SD = 139.70) (t = 1.23, P = 0.23). The remaining images were averaged and the pixel intensities of the multiple images were fitted to obtain each element of the symmetric diffusion tensor. Images, including FA, RD, AD, and ADC, were calculated using DTIStudio (http://www.mristudio.org/).
TBSS
TBSS was used to investigate the structure of the IFOF and UF. The TBSS analysis was initiated by aligning each subject's FA image into common space using nonlinear and linear registrations. Subsequently, FA images were averaged to produce a group mean FA image. A skeletonization algorithm was applied to the group mean FA image to define a group template of the lines of maximum FA. FA values for each subject were then projected onto the group template skeleton. The FA skeleton was thresholded to FA >0.25. The original registration parameters of the FA image were then applied to the RD, AD, and ADC images. FA, RD, AD, and ADC data were then projected onto the skeleton and were fed into voxelwise between-group statistics (P < 0.05) using ‘‘randomize’’ (v. 2.1 in FSL4.1), a permutation program used for inference (thresholding) on statistic maps when the null distribution is not known (Nichols and Holmes 2002). All analyses were corrected for multiple comparisons (familywise error) and used threshold-free cluster enhancement (Smith and Nichols 2009) with default parameters.
For TBSS, DTI metrics within the IFOF and UF were compared between groups (Fig. 1A,C). The IFOF and UF ROIs were selected from within the FSL software package (http://fsl.fmrib.ox.ac.uk/fsl/fslwiki/). Specifically, the ROIs were segmented based on the ICBM-DTI-81 white matter labels atlas and were delineated by a trained expert on a standard-space average of diffusion MRI tensor maps (Hua et al. 2008). No modifications were performed on the IFOF or UF ROIs. For each pathway, between-group comparisons were conducted on FA, RD, AD, and ADC, while age was entered as a covariate. In order to aid in the interpretation of between group differences in FA, subsequent between group analyses of RD, AD, and ADC were restricted to loci within the IFOF and UF where significant between group differences in FA were observed. FA is a measure representative of the degree of diffusion anisotropy within a voxel. Anisotropy within a given voxel is thought to be determined by fiber diameter and density, degree of myelination, extracellular diffusion, interaxonal spacing, and intravoxel fiber-tract coherence (Chanraud et al. 2010). For example, increased FA is typically associated with an increase in inner axon diameter (Sen and Basser 2005). RD represents the mean diffusivity perpendicular to the vector with the largest eigenvalue ([λ2 + λ3]/2), while AD is a measure of diffusivity of along the axis of the fiber (vector with the largest eigenvalue, λ1). Thus RD is thought to represent fiber integrity and myelination and AD is thought to reflect fiber coherence. Lastly, ADC is a measure representative of the overall rate of diffusion within a voxel. FA, RD, and AD metrics are associated with one another. For example, increased FA is often observed in association with either reduced RD or increased AD. Neurobiologically, increased FA, paired with reduced RD, may be representative of increased myelination or packing density (Sen and Basser 2005). While increased FA, paired with increased AD, may be representative of the structure of the axon itself (Song et al. 2002, 2003). There currently exist several different interpretations regarding how diffusion properties may be associated with specific neurobiological characteristics. Therefore, such interpretations must be considered cautiously.
Figure 1.
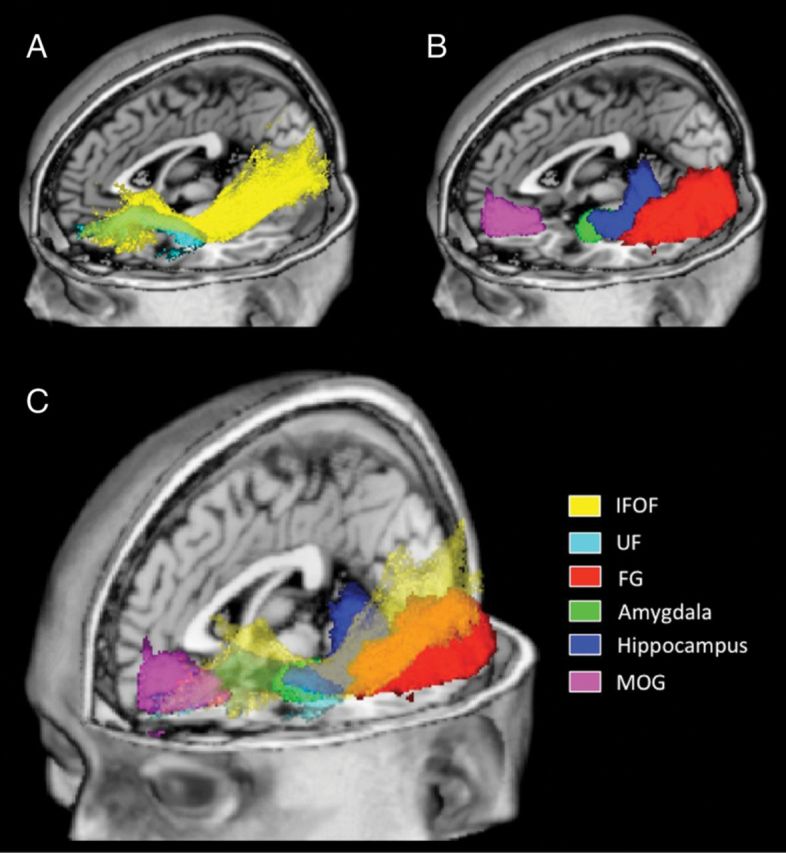
Schematic visualization of regions of interest (ROIs). ROIs are overlaid on a standardized T1 template (MRIcroN: ch2.nii.gz). Panel A displays white matter tract ROIs; inferior fronto-occipital fasciculus (IFOF) in yellow and the uncinate fasciculus (UF) in cyan. Panel B displays mixed tissue-type ROIs; fusiform gyrus (FG) in red, amygdala in green, hippocampus in blue, and medial orbitofrontal gyrus (MOG) in magenta. Panel C displays all ROIs with tracts (IFOF and UF) being displayed as partially transparent.
Atlas-Based Analysis
We also used an atlas-based approach to investigate structural alterations within the FG, amygdala, hippocampus, and MOG (Oishi et al. 2009; Faria et al. 2010). This approach utilizes the large deformation diffeomorphic metric mapping (LDDMM) as the normalization algorithm (Ceritoglu et al. 2009) and is well suited to match the shapes of anatomical regions within brains that have different shapes (Ceritoglu et al. 2009; Oishi et al. 2009; Faria et al. 2010). The measurements acquired as a result of LDDMM are in native space and thus reduce errors associated with image processing (Ceritoglu et al. 2009; Oishi et al. 2009; Faria et al. 2010). LDDMM produces highly accurate brain segmentations across participants of various ages (Faria et al. 2010) and clinical diagnoses (Oishi, Akhter et al. 2011) that also include WS (Faria et al. 2012).
In this study, we designated the FG, amygdala, hippocampus, and MOG as a priori regions of interest (ROIs) (Fig. 1B,C). ROIs were designated based on histological and DTI studies demonstrating brain regions that the IFOF and/or the UF serve to connect (Catani et al. 2002; Kier et al. 2004; Catani and Thiebaut de Schotten 2008) and studies demonstrating structural alterations of social-cognitive brain regions in adults with WS (Reiss et al. 2004; Meyer-Lindenberg, Mervis et al. 2005; Thompson et al. 2005; Martens et al. 2009). The atlas-based ROIs were selected from the JHU_MNI_single-subject atlas (Oishi et al. 2009) and were segmented using high-resolution MR images (based on the ICBM-152), acquired as part of the International Consortium for Brain Mapping project (Mazziotta et al. 1995, 2001; Thompson et al. 2000).
A 2-step image transformation was used to warp an atlas to individual native space. A skull-stripped ‘‘JHU_MNI_single-subject’’ atlas (Oishi et al. 2009) was used for the linear and nonlinear normalization of FA images. Dual-contrast LDDMM (Ceritoglu et al. 2009) was used for nonlinear normalization (single a/c ratio was 0.005). The inverse transformation matrices were then used to transfer the presegmented atlas (Oishi et al. 2009) to each subject's native space, thus enabling the automated segmentation of each ROI. The transformation matrix from the FA image was then applied to the original ADC image. Following transformations, all ROIs were visually inspected and locations were verified based on an anatomical atlas of the human brain (Mai et al. 1997). There was no threshold in terms of FA or ADC applied to any of the ROIs. The ROIs selected for atlas-based analyses are likely not composed exclusively of gray matter. The boundaries were not based on the gray-white matter boundary as defined in T1-weighted images.
For the atlas-based analysis, we compared diffusivity characteristics (i.e., FA and ADC) between groups. We selected FA and ADC as DTI metrics of interest based on evidence that FA and ADC may represent abnormal cell density, cell loss, or orientation of associated axons in brain regions comprised of mixed tissue types (Blood et al. 2010; De Gennaro et al. 2011; Juranek et al. 2012; Oishi, Mielke et al. 2011).
Statistical analyses of atlas-based ROIs were initiated by conducting a repeated measures ANCOVA with group (WS vs. TD) as the between subjects factor, ROIs (FG, amygdala, hippocampus, and MOG) as the within subjects factor, and age entered as a covariate. Our statistical analysis was designed to investigate microstructure within networks of brain regions associated with the IFOF and UF. The IFOF and UF connect brain regions within a single hemisphere. Therefore, each ANCOVA was performed on the left and right hemisphere set of ROIs independently. To reduce the likelihood of committing a Type 1 error for each ANCOVA analysis, a Bonferroni correction was adopted [0.05/2 (left and right side)] resulting in a statistical threshold of P = 0.025. Under the scenario that a significant effect of group (WS vs. TD) on ROI structure was observed (P < 0.025), the main effect of group on each ROI independently was then investigated using a statistical threshold of P < 0.05.
Lastly, we performed an exploratory analysis designed to investigate between group differences within other brain regions known to be functionally and/or structurally abnormal in WS including the superior parietal lobule (Eckert et al. 2005; Boddaert et al. 2006), insula (Cohen et al. 2010; Jabbi et al. 2012), and cingulate (Reiss et al. 2004; Campbell et al. 2009) (Supporting Materials and Methods section).
Behavioral Correlations
Within each group (WS and TD), post hoc, exploratory analyses designed to investigate the association between behavioral measures (full scale IQ, Social Cognition, and Affect Recognition) and diffusivity metrics were conducted. Regression analyses were restricted to diffusivity metrics (TBSS: voxel-by-voxel or atlas-based) found to be significantly different between groups (WS vs. TD) and were performed using SPSS software (Version 18), using a statistical threshold of P < 0.05. In addition, we performed a series of exploratory analyses designed to test for correlations between behavioral measures (full scale IQ, Social Cognition, and Affect Recognition) and all white matter pathways (TBSS), and behavioral measures and all ROIs (atlas-based analysis), using a statistical threshold of P < 0.05.
Results
Behavioral Measures
Means (M) and standard deviations (SD) for each behavioral measure are reported in Table 1. As expected, children with WS exhibited lower full scale IQ, compared to TD children (t = 12.73, P < 0.001). Compared to TD children, children with WS also scored higher on the Social Cognition subscale of the SRS (note: higher scores correspond to greater severity of problems) (t = 8.95, P < 0.001) and scored lower on the Affect Recognition subscale of the NEPSY-II (t = 2.86, P = 0.008).
Table 1.
Behavioral Measures
| TD |
WS |
|||||
|---|---|---|---|---|---|---|
| M | SD | M | SD | t | P | |
| Full scale IQ | 113.56 | 13.25 | 55.90 | 13.93 | 12.73 | <0.001 |
| SRS Social Cognition | 45.76 | 6.40 | 75.98 | 12.44 | 8.95 | <0.001 |
| NEPSY-II Affect Recognition | 10.50 | 1.90 | 7.77 | 3.19 | 2.86 | 0.008 |
Note: IQ, intelligence quotient; SRS, social responsiveness scale; NEPSY-II, developmental neuropsychological assessment-second edition.
TBSS: IFOF and UF
Results of the TBSS analysis are presented in Figure 2. All statistical analyses were conducted while age was entered as a covariate. Compared to controls, children with WS exhibited higher FA values within the right IFOF (blue areas) and bilateral UF (red areas) (Fig. 2A). Compared to controls, children with WS exhibited lower RD values within the right IFOF (yellow areas) and bilateral UF (green areas) (Fig. 2B). Furthermore, children with WS exhibited higher AD values within the right IFOF (blue areas) and bilateral UF (red areas) (Fig. 2C). One cluster within the left UF was observed to have lower AD values in WS compared to controls (Fig. 2C: green cluster, 2 left images). Lastly, compared to controls, children with WS exhibited lower ADC values within the right IFOF (yellow areas) and bilateral UF (green areas) (Fig. 2D). There were no statistically significant differences for WS < TD in FA, WS > TD in RD, or WS > TD in ADC within the bilateral IFOF or UF. The results of whole brain (all white matter pathways), between group comparisons are presented as Supplementary Table S1 and Fig. S1.
Figure 2.

Areas within the inferior fronto-occipital fasciculus (IFOF) and uncinate fasciculus (UF) that exhibit differences between Williams syndrome (WS) and typically developing (TD) controls in diffusion tensor imaging metrics as measured by tract-based spatial statistics (TBSS), with age entered as a covariate. Areas corresponding to significant differences in fractional anisotropy (A), radial diffusivity (B), axial diffusivity (C), and apparent diffusion coefficient (D) are overlaid on a standardized T1 template (Montreal Neurological Institute). Areas within the IFOF that were higher in WS when compared to TD are displayed in blue; areas within the IFOF that were higher in TD when compared to WS are displayed in yellow; areas within the UF that were higher in WS when compared to TD are displayed in red; areas within the UF that were higher in TD when compared to WS are displayed in green. L, left.
Atlas-Based Analysis
We performed a repeated measures ANCOVA for each DTI metric (FA and ADC) with group (WS vs. TD) as the between subjects factor and ROIs (FG, amygdala, hippocampus, and MOG) as the within subject factor, with age entered as a covariate. This analysis showed a significant effect of group on FA on the left [F1,33 = 11.41, P = 0.002] (Fig. 3A) and right [F1,33 = 13.43, P = 0.001] (Fig. 3B) set of ROIs. With regard to ADC, this analysis showed a significant effect of group on the right set of ROIs [F1,33 = 6.51, P = 0.016] (Fig. 3C), but no significant effect of group on the left set of ROIs [F1,33 = 2.01, P = 0.17].
Figure 3.
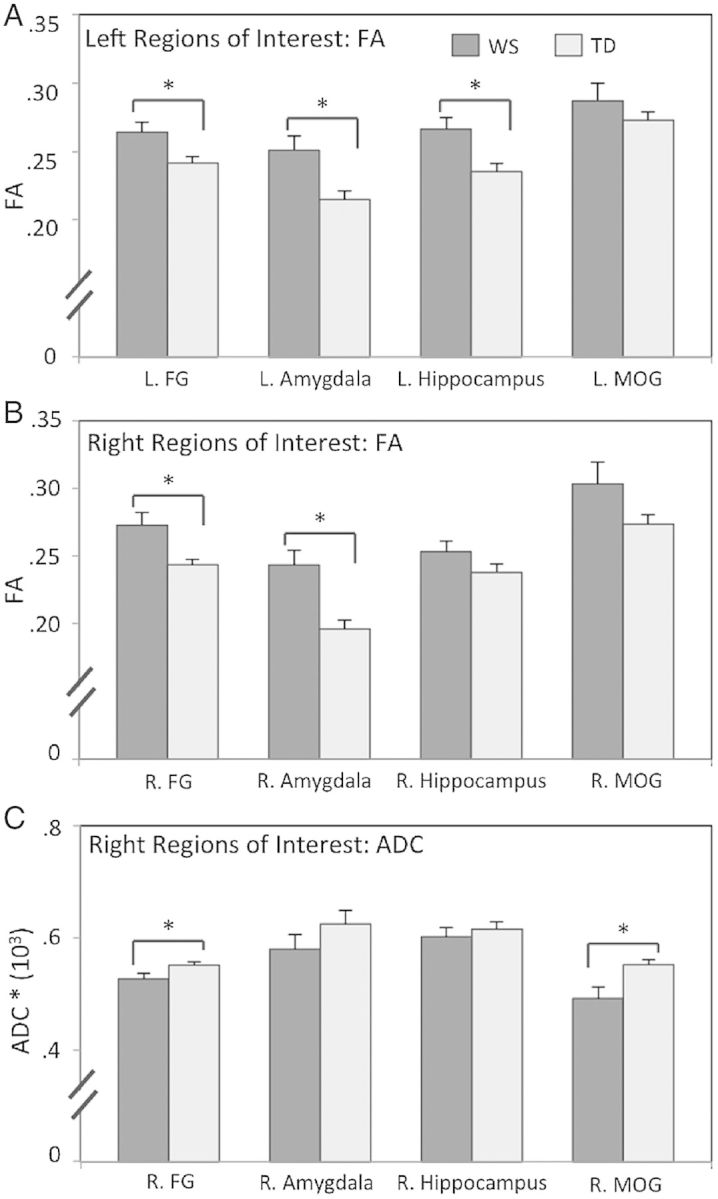
Bar graphs showing diffusion tensor imaging metrics for atlas-based regions of interest (ROIs). Data are presented from left (A) and right (B) hemisphere ROIs for fractional anisotropy (FA), and for the right hemisphere ROIs for apparent diffusion coefficient (ADC) (C) in WS and TD controls. FG, fusiform gyrus; MOG, medial orbitofrontal gyrus. *P < 0.05. Error bars represent standard error from the mean.
Based on the results of repeated measures ANCOVA analysis, we tested for main effects of group (WS vs. TD) on FA values within the left and right set of ROIs and on ADC values within the right set of ROIs. For FA values within the left (L) set of ROIs, children with WS showed higher values within the L. FG (t = 2.53, P = 0.016), L. amygdala (t = 2.95, P = 0.006), and L. hippocampus (t = 2.96, P = 0.005) compared to controls. No statistically significant differences for FA values were observed between groups within the L. MOG (t = 0.97, P = 0.34).
For FA values within the right (R) set of ROIs, children with WS showed higher values within the R. FG (t = 2.80, P = 0.008), R. amygdala (t = 3.79, P = 0.001), and a trend toward significance (P < 0.10) within the R. MOG (t = 1.75, P = 0.09). No statistically significant differences for FA values were observed between groups within the R. hippocampus (t = 1.50, P = 0.14).
For ADC values within the right (R) set of ROIs, children with WS showed lower ADC values within the R. FG (t = 2.16, P = 0.038) and R. MOG (t = 2.76, P = 0.009). No statistically significant differences for ADC values were observed between groups within the R. amygdala (t = 1.25, P = 0.22) or R. hippocampus (t = 0.65, P = 0.52).
Behavioral Correlations
We performed a post hoc, exploratory analysis designed to investigate within-group associations between behavioral measures (full scale IQ, Social Cognition, and Affect Recognition) and DTI metrics found to be significantly different between groups. No significant associations were observed for the IFOF or UF in either group. However, in WS we found a significant association between Social Cognition (SRS) and FA values within the R. FG in WS (t = 2.39, P = 0.029). Specifically, more difficulties in social cognition (i.e., higher SRS Social Cognition scores) were associated with higher FA values within the R. FG in WS (r = 0.51) (Fig. 4). The relationship between Social Cognition (SRS) and FA values within the R. FG in WS remained significant when age and IQ were entered as a covariates (R2 = 0.35, P = 0.016). We performed a Fischer r-to-z transformation and found that the association between Social Cognition (SRS) and FA values within the R. FG was significantly higher in WS (r = 0.51) when compared to TD controls (r = -0.10) (z = 1.8, P = 0.036, 1-tailed). The association between Social Cognition (SRS) and IQ was not significant either in WS (P = 0.70) or TD controls (P = 0.89).
Figure 4.

Association between social cognition and fractional anisotropy (FA) within the right (R) fusiform gyrus in children with WS. Individual differences in social cognition as measured by the Social Responsiveness Scale (SRS) (note: higher scores correspond to greater severity of problems) are plotted on the x-axis. Individual differences in FA within the R. fusiform gyrus are plotted on the y-axis.
No significant associations between behavioral measures (full scale IQ, Social Cognition, and Affect Recognition) and FA values within any other ROIs (L. FG, L. amygdala, L. hippocampus, or R. amygdala) were found in the WS or TD groups. In addition, no significant associations were observed between FA values within the R. FG and full scale IQ, Affect Recognition, or between behavioral measures and ADC values within any ROIs.
Lastly, the results of the exploratory whole brain analysis failed to show any statistical significant associations between DTI metrics within white matter pathways (TBSS) or ROIs (atlas-based analysis) and behavioral measures.
Discussion
Here we report on abnormal microstructure within a network of brain regions important for social-cognitive development in children with WS. As predicted, microstructural alterations were observed within the IFOF and UF white matter pathways and the FG, amygdala, hippocampus, and MOG. Although prior studies have investigated altered white matter structure in adults with WS (Hoeft et al. 2007; Marenco et al. 2007; Arlinghaus et al. 2011; Avery et al. 2012; Jabbi et al. 2012), no prior studies have demonstrated white matter alterations in children with this condition. This study advances our understanding of the social and neural phenotype of WS by providing evidence for early microstructural alterations within a social cognitive brain network during childhood in WS.
The results of the TBSS analysis showed that children with WS exhibit abnormal structural integrity within 2 white matter pathways known to be involved in social-cognition (IFOF and UF). Children with WS exhibited higher FA and AD values and lower RD and ADC values within the right IFOF compared to controls. Considering the DTI metrics together indicates that the higher FA values within the IFOF may be driven by both higher AD and lower RD. This pattern of altered diffusivity may represent an increase in diffusion parallel, and/or a reduction of diffusion that is perpendicular to the direction of axons. Thus, this pattern may be an indication of increased myelination or packing density, or changes in axonal structure within the IFOF (Song et al. 2003; Sen and Basser 2005).
The IFOF is an important pathway that connects brain regions within the ventral stream including the FG and orbitofrontal cortices (Catani et al. 2002; Catani and Thiebaut de Schotten 2008; Martino et al. 2010). Although there is considerable debate regarding the anatomical and functional distinction of the IFOF from other pathways such as the inferior longitudinal fasciculus (Schmahmann and Pandya 2007; Lee et al. 2008; Fusar-Poli et al. 2009), recent postmortem histological research indicates that the IFOF can be distinguished as a separate tract in humans (Martino et al. 2010). From a neurofunctional perspective, recent studies suggest that the IFOF is involved in both face (Thomas et al. 2008) and emotion processing (Philippi et al. 2009).
In terms of WS, affected adults show increased FA within the left inferior frontal occipital fasciculus (IFOF) (Arlinghaus et al. 2011) and decreased FA within the right IFOF (Arlinghaus et al. 2011; Avery et al. 2012). Additionally, adults with WS exhibit abnormal functional connectivity between brain regions that the IFOF serves to connect (ventral occipital lobe including the FG and orbitofrontal cortex) (Sarpal et al. 2008). The results of the current study build on prior research by showing that children with WS exhibit abnormal structural integrity, characterized by higher FA, AD, and lower RD and ADC when compared to controls, within the ventral processing stream.
The results of the TBSS analysis showed that children with WS exhibit higher FA and AD values and lower RD and ADC values within the bilateral UF as compared to controls. In addition, we also observed a cluster within the left UF that exhibited lower AD values in WS as compared to controls. As with the IFOF, this pattern of altered diffusivity may represent increased myelination or packing density, or changes in axonal structure within the UF. The UF serves to connect several brain regions within the medial temporal lobe, such as the amygdala and hippocampus, with the orbitofrontal cortex (Catani et al. 2002; Kier et al. 2004; Catani and Thiebaut de Schotten 2008; Peltier et al. 2010), and functions to relay information associated with face processing and emotion regulation (Lin et al. 2011; Papagno et al. 2011; Zhang, Leow et al. 2012; Xu and Potenza 2012). DTI studies have demonstrated altered diffusivity within the UF in adults with WS (Avery et al. 2012; Jabbi et al. 2012). However, these studies have shown lower FA values within the UF in adults with WS while we observed higher FA values within the UF in children with WS compared to controls. One explanation for this inconsistency between children and adults may be that WS is characterized by an atypical neurodevelopmental trajectory of white matter within the UF tract. During typical (i.e., non-WS) development of the UF, FA values increase, while RD values decrease with age (Eluvathingal et al. 2007). When combined with results from Avery et al. (2012), our findings suggest that in WS, FA values decrease and RD values increase during childhood within the UF. Preliminary support for this hypothesis comes from a series of correlational analyses with age (Supplementary Material). The results of these analyses demonstrate that within brain regions that the UF serves to connect (hippocampus and MOG), age is associated with lower FA values in WS and higher FA values in TD (Supporting Results section: Supplementary Fig. S2B). Clearly, studies that utilize longitudinal approaches are necessary to further investigate this intriguing potential dissociation.
The finding of both higher and lower AD values in WS within the left UF was not expected. A visual inspection of the cluster exhibiting lower AD values indicates that this cluster is relatively inferior to the cluster exhibiting higher AD values within the left UF. This finding suggests that white matter alterations in WS within the left UF may not be consistent within the entire UF pathway. Additional support for this hypothesis comes from a tract-based DTI study of the UF in adults with WS (Arlinghaus et al. 2011). Specifically, Arlinghaus et al. (2011) showed both lower and higher anisotropy within the left UF in WS as compared to controls.
We investigated the structural integrity of brain regions associated with the IFOF and UF involved in social-cognitive functioning (FG, amygdala, hippocampus, and MOG). Based on evidence that these regions are structurally aberrant in adults with WS (Reiss et al. 2004; Meyer-Lindenberg, Mervis et al. 2005; Thompson et al. 2005; Martens et al. 2009), and that, like adults, children with WS display abnormal social-cognitive functioning (Tomc et al. 1990; Klein-Tasman and Mervis 2003; Doyle et al. 2004), we hypothesized that we would observe microstructural alterations within these structures in children with WS. The results of the atlas-based analysis supported our hypothesis. Children with WS exhibited higher FA values within the L. and R. FG, L. and R. amygdala, and L. hippocampus and lower ADC values within R. FG and R. MOG compared to controls.
A pattern of altered diffusivity within areas comprised of both gray and white matter may be representative of several neurobiological characteristics. We found that several brain regions exhibited higher FA and reduced ADC in WS compared to controls. Increased FA in mixed tissue type regions to be representative of greater cell density or cohesion within axons projecting out of these regions (Blood et al. 2010; Hong et al. 2010). In terms of reduced ADC, it is currently unknown what underlying cell structure this may represent. In fact, many other clinical conditions, such as Alzheimer's disease and mild cognitive impairment are characterized by increased ADC within the hippocampus (Oishi, Mielke et al. 2011), cingulate, parahippocampal gyrus, and frontal lobes (Zhang, Zhang et al. 2011). Clearly, further research is necessary to elucidate how FA and ADC may represent underlying cell structure within mixed tissue-type brain regions.
We found that children with WS exhibit higher FA values within the left and right FG, and lower ADC values within the right FG compared to controls. WS is associated with gross structural alterations within the FG. For example, both Reiss et al. (2004) and Thompson et al. (2005) demonstrated that adults with WS exhibit larger gray matter of the FG relative to healthy controls. In addition, the results of a recent MRI study of children and adolescents (mean age 13.2 years) with WS indicated smaller gray matter volume within the left FG and larger gray matter volume within the right FG when compared to controls (Campbell et al. 2009). In terms of functional neuroanatomy, adults with WS exhibit a larger area within the FG (i.e., fusiform face area) responsive to facial expressions compared to controls (Golarai et al. 2010; O'Hearn et al. 2011). Lastly, we demonstrated that white matter fibers projecting through the FG exhibit higher FA in adults with WS when compared to age-matched and mentally age-matched controls (Haas, Hoeft, et al. 2012). Taken together, these findings indicate that higher FA and lower ADC within the FG in children and adults with WS may underlie distinctive patterns of face processing in this condition.
We also found that children with WS exhibit higher FA values within the bilateral amygdala relative to controls. The amygdala is involved in processing the salience of social and emotional cues within the environment (Phelps and LeDoux 2005). Adults with WS exhibit structural and functional alterations of the amygdala. For example, adults with WS exhibit a larger overall volume of the amygdala (adjusted for whole-brain volume) relative to controls (Reiss et al. 2004; Martens et al. 2009; Capitao et al. 2011). Additionally, we demonstrated that adults with WS exhibit regionally specific increased volume of cortical nucleus, lateral nucleus, and the central nucleus of the amygdala compared to controls (Haas, Sheau, et al. 2012). In terms of function, adults with WS exhibit lower amygdala response to fearful facial expressions (Meyer-Lindenberg, Hariri et al. 2005; Haas et al. 2009), greater response to nonsocial fear-related stimuli (Munoz et al. 2010; Thornton-Wells et al. 2011), and greater response to happy facial expressions (Haas et al. 2009) as compared to controls.
Interestingly, in a recent study in mice, Feyder et al. (2010) demonstrated that Clyn2 (one of the effected genes in WS) and Dlg4 are associated with larger headwidth of dendritic spines of neurons within the basolateral amygdala. In terms of DTI, there is some evidence that dendritic morphology may be associated with the DTI metrics collected in this study. For example, computational modeling (Jespersen et al. 2007) and combined histological/DTI (Huang et al. 2012) studies show a close correspondence between cytoarchitectural characteristics including dendritic morphology and FA and ADC. This interpretation however, should be taken with caution, as it is currently unclear how DTI metrics are associated with specific neurobiological characteristics, in vivo.
We observed that children with WS exhibit higher FA values within the hippocampus compared to controls. The hippocampus is structurally and functionally abnormal in adults with WS. For example, Sampaio et al. (2010) showed abnormal asymmetry of the hippocampal formation and Meda et al. (2012) showed smaller gray matter volume of the hippocampus in adults with WS compared to controls. In terms of function, Meyer-Lindenberg et al. (2005) showed that adults with WS exhibit lower resting blood flow and magnetic resonance spectroscopy measures of N-acetyl aspartate (considered a marker of synaptic activity) within the hippocampus compared to controls. Interestingly, the results of studies using knock out mice indicate abnormal neuronal architecture within the hippocampus in mouse models of WS (Osborne 2010) that include a lower number of granule cells, higher number of hilar mossy cells (Zhao et al. 2005) and altered dendritic spine morphology and synaptic function (Meng et al. 2002). Taken together, the increased FA values within the hippocampus in children with WS reported here may represent early alterations of neural architecture within the hippocampus and thus may be a neural substrate associated with atypical memory formation (Robinson et al. 2003), spatial navigation (Mandolesi et al. 2009), and social cognition (Tomc et al. 1990; Klein-Tasman and Mervis 2003; Doyle et al. 2004) in affected children.
Lastly, we observed that children with WS exhibit lower ADC values within the MOG. In terms of FA, one factor potentially contributing to the lack of a significant between-group difference is the fact that the orbitofrontal cortex is highly susceptible to signal loss and bias in anisotropy and ADC (Wilson et al. 2003). The orbitofrontal cortex maintains many reciprocal connections (via the UF) with limbic areas that include the amygdala and hippocampus (Bracht et al. 2009; Colnat-Coulbois et al. 2010). The orbitofrontal cortex is involved in social-cognitive processes that include sensory integration, subjective mood states, and reward processing (O'Doherty et al. 2001; Kringelbach and Rolls 2004). Adults with WS exhibit structural and functional abnormalities of the MOG (Reiss et al. 2004; Mimura et al. 2010; Meda et al. 2012). Adults with WS exhibit larger cortical thickness (Meda et al. 2012) and lower BOLD response to negative emotional faces (Mimura et al. 2010) within the MOG compared to controls. The lower ADC values within the MOG observed in this study may be a neural substrate associated with altered reward and emotion processing in children with WS (Triesch et al. 2006; Klein-Tasman et al. 2007; Foti et al. 2011).
In addition to the analysis of brain regions associated with the IFOF and UF pathways, we also performed a series of exploratory analyses of brain regions that have also been found to be structurally abnormal in adults with WS. The brain regions in these analyses included the superior parietal lobule (Eckert et al. 2005), insula (Cohen et al. 2010), and cingulate (Reiss et al. 2004) (see Supplementary Material). The results of these analyses did not reveal any statistically significant differences in either FA or ADC between the WS and TD groups. Clearly, further research using advanced structural approaches, such as VBM or cortical thickness analyses, are warranted to further elucidate early structural alterations within these other brain regions in WS.
We found that FA values within the IFOF, UF pathways and within the FG amygdala, hippocampus and MOG were increased in children with WS compared to controls. Although the specific neurobiological characteristics affecting FA are currently not completely understood, many studies have shown reduced FA to be associated with compromised structural integrity and/or decreased function (Kubicki et al. 2007; Assaf and Pasternak 2008; Wen et al. 2011). Conversely, there are also several studies that show increased FA values in clinical conditions such as autism (Cheng et al. 2010; Bode et al. 2011; Weinstein et al. 2011), bipolar disorder (Versace et al. 2008; Mahon et al. 2009), obsessive compulsive disorder (Li et al. 2011), attention deficit hyperactivity disorder (Li et al. 2010), conduct disorder (Sarkar et al. 2013), mild brain traumatic injury (Chu et al. 2010), and WS (Hoeft et al. 2007; Arlinghaus et al. 2011). Interestingly, many aspects of the social phenotypes associated with autism often mirror those typically associated with WS. The fact that both autism (Cheng et al. 2010) and WS (Arlinghaus et al. 2011) are associated with increased FA values within white matter pathways, that include the IFOF, suggests that there may be common neurobiological substrates underlying these conditions.
The observed increased FA values may be a neural correlate of several specific components of the WS social-cognitive phenotype during childhood (Haas and Reiss 2012). For example, behavioral research has shown that, compared to TD controls, children with WS are more motivated to approach strangers (Dodd et al. 2010) and exhibit greater amounts of extended, intense gaze toward the faces of others (Mervis et al. 2003). Conversely, WS is also associated with difficulties in several other aspects of social-cognition such as theory of mind (Porter et al. 2008; Santos and Deruelle 2009) and emotion recognition (Skwerer et al. 2006). In this study, we measured individual differences in social cognition by using the Social Cognition subscale of the SRS (Constantino and Gruber 2005). This subscale measures ones ability to interpret social cues (e.g., difficulty recognizing when others try to take advantage of them, or difficulty in understanding the meaning of people's tone and facial expressions). We found that children with WS exhibit more difficulties in social cognition (i.e., higher SRS Social Cognition subscale scores) and that within the WS group, greater FA values within the right FG are associated with more difficulties in social cognition. We did not observe significant associations between DTI metrics and any other SRS subscale, for any other ROI. Taken together, these findings provide preliminary support to the hypothesis that increased FA within the right FG reflects delayed (or deviant) social cognitive development in children with WS.
This study provides evidence that children with WS exhibit early-altered microstructure of a network of brain regions important for the development of social cognition. However, several methodological issues limit our ability to make firm conclusions regarding brain–behavior associations. First, we compared WS to a TD control group that was characterized by normal IQ. WS is most often associated with cognitive delays and significantly lower IQ scores that fall 1–3 standard deviations below norms (Martens et al. 2008). Thus, social and overall cognitive functions are unavoidably linked. However, to indirectly probe for associations between IQ and structural alterations in this study, we performed a series of correlation analyses between IQ and each DTI metric, within each group (WS and TD). The results of these analyses did not provide evidence in support of IQ being associated with structural alterations within any of the ROIs utilized in this study. Second, this study provides evidence of altered brain structure during an early age range, as compared to prior DTI studies in WS (Hoeft et al. 2007; Marenco et al. 2007; Arlinghaus et al. 2011; Avery et al. 2012), although Faria et al. (2012) investigated white matter alterations in WS participants across an age range that partially overlaps with those of this study (adolescents). Thus, the current findings provide support to the hypothesis that WS is associated with abnormalities in brain development during childhood (also see Supporting Results section: Supplementary Fig. S2B). However, the design of this study does not allow for a direct test of this hypothesis. In particular, future longitudinal studies that include multiple psychological and neuroimaging measures, collected at multiple time points, are necessary to directly test hypotheses related to the trajectory of brain development in WS (Johnson et al. 2002; Thomas et al. 2009; Karmiloff-Smith 2010). Lastly, the sample size within each group also limited our ability to draw conclusions regarding the effect of sex on network microstructure. We performed a series of analyses designed to compare each DTI metric (in white matter pathways and mixed tissue ROIs) between sexes within the WS and control groups. The results of these analyses, however, revealed no statistically significant differences in FA, RD, AD or ADC in any brain region. Future studies that include larger sample sizes may be better suited to investigate this issue.
This study is also limited by the DTI acquisition parameters. We collected DTI data along 23 noncollinear directions, while many recently developed DTI sequences are designed to measure diffusion along more directions (i.e., >30) (Jones 2004; Landman et al. 2007; Wang et al. 2012), which may reduce image biases and/or distortions. To reduce the likelihood that images associated with biases and/or distortions were included in each of our analyses, we carefully reviewed all of the acquired images. This study may have been improved if our DTI data were paired with high-resolution structural (T1-weighted) images. The inclusion of high resolution structural images would allow for specific analyses of volume and tissue type within white matter pathways and ROIs and allow for factors such as partial volume effects to be investigated with greater detail (Vos et al. 2011). We anticipate that future DTI studies in WS will benefit by collecting diffusion MR data using more advanced acquisition parameters and by acquiring complementary high-resolution anatomical neuroimaging data.
In conclusion, this study demonstrates structural alterations within a network of key brain regions involved in social cognition during childhood in WS. The observed altered brain structure may be an important neural substrate associated with the development of distinctive patterns of social behavior and emotion processing in individuals affected with this genetic condition.
Supplementary Material
Supplementary material can be found at: http://www.cercor.oxfordjournals.org/
Funding
This study was supported by T32 MH19908 and by a Child Health Research Program, Stanford University School of Medicine, Pediatric Research Fund Award.
Supplementary Material
Notes
Conflict of Interest: None declared.
References
- Achenbach T. Manual for the child behavior checklist/2–3 and 1992 profile. Burlington: University of Vermont, Department of Psychiatry; 1992. [Google Scholar]
- Arlinghaus LR, Thornton-Wells TA, Dykens EM, Anderson AW. Alterations in diffusion properties of white matter in Williams syndrome. Magn Reson Imaging. 2011;29:1165–1174. doi: 10.1016/j.mri.2011.07.012. [DOI] [PMC free article] [PubMed] [Google Scholar]
- Assaf Y, Pasternak O. Diffusion tensor imaging (DTI)-based white matter mapping in brain research: a review. J Mol Neurosci. 2008;34:51–61. doi: 10.1007/s12031-007-0029-0. [DOI] [PubMed] [Google Scholar]
- Avery SN, Thornton-Wells TA, Anderson AW, Blackford JU. White matter integrity deficits in prefrontal-amygdala pathways in Williams syndrome. Neuroimage. 2012;59:887–894. doi: 10.1016/j.neuroimage.2011.09.065. [DOI] [PMC free article] [PubMed] [Google Scholar]
- Basser PJ, Mattiello J, LeBihan D. MR diffusion tensor spectroscopy and imaging. Biophys J. 1994;66:259–267. doi: 10.1016/S0006-3495(94)80775-1. [DOI] [PMC free article] [PubMed] [Google Scholar]
- Blood AJ, Iosifescu DV, Makris N, Perlis RH, Kennedy DN, Dougherty DD, Kim BW, Lee MJ, Wu S, Lee S, et al. Microstructural abnormalities in subcortical reward circuitry of subjects with major depressive disorder. PLoS One. 2010;5:e13945. doi: 10.1371/journal.pone.0013945. [DOI] [PMC free article] [PubMed] [Google Scholar]
- Boddaert N, Mochel F, Meresse I, Seidenwurm D, Cachia A, Brunelle F, Lyonnet S, Zilbovicius M. Parieto-occipital grey matter abnormalities in children with Williams syndrome. Neuroimage. 2006;30:721–725. doi: 10.1016/j.neuroimage.2005.10.051. [DOI] [PubMed] [Google Scholar]
- Bode MK, Mattila ML, Kiviniemi V, Rahko J, Moilanen I, Ebeling H, Tervonen O, Nikkinen J. White matter in autism spectrum disorders—evidence of impaired fiber formation. Acta Radiol. 2011;52:1169–1174. doi: 10.1258/ar.2011.110197. [DOI] [PubMed] [Google Scholar]
- Bracht T, Tuscher O, Schnell S, Kreher B, Rusch N, Glauche V, Lieb K, Ebert D, Il'yasov KA, Hennig J, et al. Extraction of prefronto-amygdalar pathways by combining probability maps. Psychiatry Res. 2009;174:217–222. doi: 10.1016/j.pscychresns.2009.05.001. [DOI] [PubMed] [Google Scholar]
- Campbell LE, Daly E, Toal F, Stevens A, Azuma R, Karmiloff-Smith A, Murphy DG, Murphy KC. Brain structural differences associated with the behavioural phenotype in children with Williams syndrome. Brain Res. 2009;1258:96–107. doi: 10.1016/j.brainres.2008.11.101. [DOI] [PubMed] [Google Scholar]
- Capitao L, Sampaio A, Sampaio C, Vasconcelos C, Fernandez M, Garayzabal E, Shenton ME, Goncalves OF. MRI amygdala volume in Williams Syndrome. Res Dev Disabil. 2011;32:2767–2772. doi: 10.1016/j.ridd.2011.05.033. [DOI] [PubMed] [Google Scholar]
- Catani M, Howard RJ, Pajevic S, Jones DK. Virtual in vivo interactive dissection of white matter fasciculi in the human brain. Neuroimage. 2002;17:77–94. doi: 10.1006/nimg.2002.1136. [DOI] [PubMed] [Google Scholar]
- Catani M, Thiebaut de Schotten M. A diffusion tensor imaging tractography atlas for virtual in vivo dissections. Cortex. 2008;44:1105–1132. doi: 10.1016/j.cortex.2008.05.004. [DOI] [PubMed] [Google Scholar]
- Ceritoglu C, Oishi K, Li X, Chou MC, Younes L, Albert M, Lyketsos C, van Zijl PC, Miller MI, Mori S. Multi-contrast large deformation diffeomorphic metric mapping for diffusion tensor imaging. Neuroimage. 2009;47:618–627. doi: 10.1016/j.neuroimage.2009.04.057. [DOI] [PMC free article] [PubMed] [Google Scholar]
- Chanraud S, Zahr N, Sullivan EV, Pfefferbaum A. MR diffusion tensor imaging: a window into white matter integrity of the working brain. Neuropsychol Rev. 2010;20:209–225. doi: 10.1007/s11065-010-9129-7. [DOI] [PMC free article] [PubMed] [Google Scholar]
- Cheng Y, Chou KH, Chen IY, Fan YT, Decety J, Lin CP. Atypical development of white matter microstructure in adolescents with autism spectrum disorders. Neuroimage. 2010;50:873–882. doi: 10.1016/j.neuroimage.2010.01.011. [DOI] [PubMed] [Google Scholar]
- Chu Z, Wilde EA, Hunter JV, McCauley SR, Bigler ED, Troyanskaya M, Yallampalli R, Chia JM, Levin HS. Voxel-based analysis of diffusion tensor imaging in mild traumatic brain injury in adolescents. AJNR Am J Neuroradiol. 2010;31:340–346. doi: 10.3174/ajnr.A1806. [DOI] [PMC free article] [PubMed] [Google Scholar]
- Cohen JD, Mock JR, Nichols T, Zadina J, Corey DM, Lemen L, Bellugi U, Galaburda A, Reiss A, Foundas AL. Morphometry of human insular cortex and insular volume reduction in Williams syndrome. J Psychiatr Res. 2010;44:81–89. doi: 10.1016/j.jpsychires.2009.07.001. [DOI] [PMC free article] [PubMed] [Google Scholar]
- Colnat-Coulbois S, Mok K, Klein D, Penicaud S, Tanriverdi T, Olivier A. Tractography of the amygdala and hippocampus: anatomical study and application to selective amygdalohippocampectomy. J Neurosurg. 2010;113:1135–1143. doi: 10.3171/2010.3.JNS091832. [DOI] [PubMed] [Google Scholar]
- Constantino JN, Gruber CP. Social Responsiveness Scale (SRS) Los Angeles, CA: Western Psychological Services; 2005. [Google Scholar]
- De Gennaro L, Cipolli C, Cherubini A, Assogna F, Cacciari C, Marzano C, Curcio G, Ferrara M, Caltagirone C, Spalletta G. Amygdala and hippocampus volumetry and diffusivity in relation to dreaming. Hum Brain Mapp. 2011;32:1458–1470. doi: 10.1002/hbm.21120. [DOI] [PMC free article] [PubMed] [Google Scholar]
- Dodd HF, Porter MA, Peters GL, Rapee RM. Social approach in pre-school children with Williams syndrome: the role of the face. J Intellect Disabil Res. 2010;54:194–203. doi: 10.1111/j.1365-2788.2009.01241.x. [DOI] [PubMed] [Google Scholar]
- Doyle TF, Bellugi U, Korenberg JR, Graham J. “Everybody in the world is my friend” hypersociability in young children with Williams syndrome. Am J Med Genet A. 2004;124:263–273. doi: 10.1002/ajmg.a.20416. [DOI] [PubMed] [Google Scholar]
- Eckert MA, Hu D, Eliez S, Bellugi U, Galaburda A, Korenberg J, Mills D, Reiss AL. Evidence for superior parietal impairment in Williams syndrome. Neurology. 2005;64:152–153. doi: 10.1212/01.WNL.0000148598.63153.8A. [DOI] [PubMed] [Google Scholar]
- Eluvathingal TJ, Hasan KM, Kramer L, Fletcher JM, Ewing-Cobbs L. Quantitative diffusion tensor tractography of association and projection fibers in normally developing children and adolescents. Cereb Cortex. 2007;17:2760–2768. doi: 10.1093/cercor/bhm003. [DOI] [PMC free article] [PubMed] [Google Scholar]
- Faria AV, Landau B, O'Hearn KM, Li X, Jiang H, Oishi K, Zhang J, Mori S. Quantitative analysis of gray and white matter in Williams syndrome. Neuroreport. 2012;23:283–289. doi: 10.1097/WNR.0b013e3283505b62. [DOI] [PMC free article] [PubMed] [Google Scholar]
- Faria AV, Zhang J, Oishi K, Li X, Jiang H, Akhter K, Hermoye L, Lee SK, Hoon A, Stashinko E, et al. Atlas-based analysis of neurodevelopment from infancy to adulthood using diffusion tensor imaging and applications for automated abnormality detection. Neuroimage. 2010;52:415–428. doi: 10.1016/j.neuroimage.2010.04.238. [DOI] [PMC free article] [PubMed] [Google Scholar]
- Feyder M, Karlsson RM, Mathur P, Lyman M, Bock R, Momenan R, Munasinghe J, Scattoni ML, Ihne J, Camp M, et al. Association of mouse Dlg4 (PSD-95) gene deletion and human DLG4 gene variation with phenotypes relevant to autism spectrum disorders and Williams' syndrome. Am J Psychiatry. 2010;167:1508–1517. doi: 10.1176/appi.ajp.2010.10040484. [DOI] [PMC free article] [PubMed] [Google Scholar]
- Foti F, Petrosini L, Cutuli D, Menghini D, Chiarotti F, Vicari S, Mandolesi L. Explorative function in Williams syndrome analyzed through a large-scale task with multiple rewards. Res Dev Disabil. 2011;32:972–985. doi: 10.1016/j.ridd.2011.02.001. [DOI] [PubMed] [Google Scholar]
- Fusar-Poli P, Placentino A, Carletti F, Landi P, Allen P, Surguladze S, Benedetti F, Abbamonte M, Gasparotti R, Barale F, et al. Functional atlas of emotional faces processing: a voxel-based meta-analysis of 105 functional magnetic resonance imaging studies. J Psychiatry Neurosci. 2009;34:418–432. [PMC free article] [PubMed] [Google Scholar]
- Golarai G, Hong S, Haas BW, Galaburda AM, Mills DL, Bellugi U, Grill-Spector K, Reiss AL. The fusiform face area is enlarged in Williams syndrome. J Neurosci. 2010;30:6700–6712. doi: 10.1523/JNEUROSCI.4268-09.2010. [DOI] [PMC free article] [PubMed] [Google Scholar]
- Gosch A, Pankau R. Social-emotional and behavioral adjustment in children with Williams-Beuren syndrome. Am J Med Genet. 1994;53:335–339. doi: 10.1002/ajmg.1320530406. [DOI] [PubMed] [Google Scholar]
- Haas BW, Hoeft F, Barnea-Goraly N, Golarai G, Bellugi U, Reiss AL. Preliminary evidence of abnormal white matter related to the fusiform gyrus in Williams syndrome: a diffusion tensor imaging tractography study. Genes Brain Behav. 2012;11:62–68. doi: 10.1111/j.1601-183X.2011.00733.x. [DOI] [PMC free article] [PubMed] [Google Scholar]
- Haas BW, Mills D, Yam A, Hoeft F, Bellugi U, Reiss A. Genetic influences on sociability: heightened amygdala reactivity and event-related responses to positive social stimuli in Williams syndrome. J Neurosci. 2009;29:1132–1139. doi: 10.1523/JNEUROSCI.5324-08.2009. [DOI] [PMC free article] [PubMed] [Google Scholar]
- Haas BW, Reiss AL. Social brain development in williams syndrome: the current status and directions for future research. Front Psychol. 2012;3:186. doi: 10.3389/fpsyg.2012.00186. [DOI] [PMC free article] [PubMed] [Google Scholar]
- Haas BW, Sheau K, Kelley RG, Thompson AP, Reiss AL. Regionally specific increased volume of the amygdala in Williams syndrome: evidence from surface based modeling. Hum Brain Mapp. 2012 doi: 10.1002/hbm.22219. (In press) [DOI] [PMC free article] [PubMed] [Google Scholar]
- Hoeft F, Barnea-Goraly N, Haas BW, Golarai G, Ng D, Mills D, Korenberg J, Bellugi U, Galaburda A, Reiss AL. More is not always better: increased fractional anisotropy of superior longitudinal fasciculus associated with poor visuospatial abilities in Williams syndrome. J Neurosci. 2007;27:11960–11965. doi: 10.1523/JNEUROSCI.3591-07.2007. [DOI] [PMC free article] [PubMed] [Google Scholar]
- Hong YJ, Yoon B, Shim YS, Cho AH, Lim SC, Ahn KJ, Yang DW. Differences in microstructural alterations of the hippocampus in Alzheimer disease and idiopathic normal pressure hydrocephalus: a diffusion tensor imaging study. AJNR Am J Neuroradiol. 2010;31:1867–1872. doi: 10.3174/ajnr.A2207. [DOI] [PMC free article] [PubMed] [Google Scholar]
- Hua K, Zhang J, Wakana S, Jiang H, Li X, Reich DS, Calabresi PA, Pekar JJ, van Zijl PC, Mori S. Tract probability maps in stereotaxic spaces: analyses of white matter anatomy and tract-specific quantification. Neuroimage. 2008;39:336–347. doi: 10.1016/j.neuroimage.2007.07.053. [DOI] [PMC free article] [PubMed] [Google Scholar]
- Huang H, Jeon T, Sedmak G, Pletikos M, Vasung L, Xu X, Yarowsky P, Richards LJ, Kostovic I, Sestan N, et al. Coupling diffusion imaging with histological and gene expression analysis to examine the dynamics of cortical areas across the fetal period of human brain development. Cereb Cortex. 2012 doi: 10.1093/cercor/bhs241. (In press) [DOI] [PMC free article] [PubMed] [Google Scholar]
- Jabbi M, Kippenhan JS, Kohn P, Marenco S, Mervis CB, Morris CA, Meyer-Lindenberg A, Berman KF. The Williams syndrome chromosome 7q11.23 hemideletion confers hypersocial, anxious personality coupled with altered insula structure and function. Proc Natl Acad Sci USA. 2012;109:E860–866. doi: 10.1073/pnas.1114774109. [DOI] [PMC free article] [PubMed] [Google Scholar]
- Jarvinen-Pasley A, Bellugi U, Reilly J, Mills DL, Galaburda A, Reiss AL, Korenberg JR. Defining the social phenotype in Williams syndrome: a model for linking gene, the brain, and behavior. Dev Psychopathol. 2008;20:1–35. doi: 10.1017/S0954579408000011. [DOI] [PMC free article] [PubMed] [Google Scholar]
- Jespersen SN, Kroenke CD, Ostergaard L, Ackerman JJ, Yablonskiy DA. Modeling dendrite density from magnetic resonance diffusion measurements. Neuroimage. 2007;34:1473–1486. doi: 10.1016/j.neuroimage.2006.10.037. [DOI] [PubMed] [Google Scholar]
- Johnson MH, Halit H, Grice SJ, Karmiloff-Smith A. Neuroimaging of typical and atypical development: a perspective from multiple levels of analysis. Dev Psychopathol. 2002;14:521–536. doi: 10.1017/s0954579402003073. [DOI] [PubMed] [Google Scholar]
- Jones DK. The effect of gradient sampling schemes on measures derived from diffusion tensor MRI: a Monte Carlo study. Magn Reson Med. 2004;51:807–815. doi: 10.1002/mrm.20033. [DOI] [PubMed] [Google Scholar]
- Juranek J, Johnson CP, Prasad MR, Kramer LA, Saunders A, Filipek PA, Swank PR, Cox CS, Jr,, Ewing-Cobbs L. Mean diffusivity in the amygdala correlates with anxiety in pediatric TBI. Brain Imaging Behav. 2012;6:36–48. doi: 10.1007/s11682-011-9140-5. [DOI] [PMC free article] [PubMed] [Google Scholar]
- Karmiloff-Smith A. Neuroimaging of the developing brain: taking “developing” seriously. Hum Brain Mapp. 2010;31:934–941. doi: 10.1002/hbm.21074. [DOI] [PMC free article] [PubMed] [Google Scholar]
- Kier EL, Staib LH, Davis LM, Bronen RA. MR imaging of the temporal stem: anatomic dissection tractography of the uncinate fasciculus, inferior occipitofrontal fasciculus, and Meyer's loop of the optic radiation. AJNR. 2004;25:677–691. [PMC free article] [PubMed] [Google Scholar]
- Klein-Tasman BP, Mervis CB. Distinctive personality characteristics of 8-, 9-, and 10-year-olds with Williams syndrome. Dev Neuropsychol. 2003;23:269–290. doi: 10.1080/87565641.2003.9651895. [DOI] [PubMed] [Google Scholar]
- Klein-Tasman BP, Mervis CB, Lord C, Phillips KD. Socio-communicative deficits in young children with Williams syndrome: performance on the Autism Diagnostic Observation Schedule. Child Neuropsychol. 2007;13:444–467. doi: 10.1080/09297040601033680. [DOI] [PubMed] [Google Scholar]
- Korkman M, Kirk U, Kemp S. NEPSY II. San Antonio, TX: Pearson Publishing; 2007. [Google Scholar]
- Kringelbach ML, Rolls ET. The functional neuroanatomy of the human orbitofrontal cortex: evidence from neuroimaging and neuropsychology. Prog Neurobiol. 2004;72:341–372. doi: 10.1016/j.pneurobio.2004.03.006. [DOI] [PubMed] [Google Scholar]
- Kubicki M, McCarley R, Westin CF, Park HJ, Maier S, Kikinis R, Jolesz FA, Shenton ME. A review of diffusion tensor imaging studies in schizophrenia. J Psychiatr Res. 2007;41:15–30. doi: 10.1016/j.jpsychires.2005.05.005. [DOI] [PMC free article] [PubMed] [Google Scholar]
- Landman BA, Farrell JA, Jones CK, Smith SA, Prince JL, Mori S. Effects of diffusion weighting schemes on the reproducibility of DTI-derived fractional anisotropy, mean diffusivity, and principal eigenvector measurements at 1.5T. Neuroimage. 2007;36:1123–1138. doi: 10.1016/j.neuroimage.2007.02.056. [DOI] [PubMed] [Google Scholar]
- Lee KU, Khang HS, Kim KT, Kim YJ, Kweon YS, Shin YW, Kwon JS, Ho SH, Garfinkel SN, Chae JH, et al. Distinct processing of facial emotion of own-race versus other-race. Neuroreport. 2008;19:1021–1025. doi: 10.1097/WNR.0b013e3283052df2. [DOI] [PubMed] [Google Scholar]
- Li F, Huang X, Yang Y, Li B, Wu Q, Zhang T, Lui S, Kemp GJ, Gong Q. Microstructural brain abnormalities in patients with obsessive-compulsive disorder: diffusion-tensor MR imaging study at 3.0T. Radiology. 2011;260:216–223. doi: 10.1148/radiol.11101971. [DOI] [PubMed] [Google Scholar]
- Li Q, Sun J, Guo L, Zang Y, Feng Z, Huang X, Yang H, Lv Y, Huang M, Gong Q. Increased fractional anisotropy in white matter of the right frontal region in children with attention-deficit/hyperactivity disorder: a diffusion tensor imaging study. Neuro Endocrinol Lett. 2010;31:747–753. [PubMed] [Google Scholar]
- Lin F, Weng S, Xie B, Wu G, Lei H. Abnormal frontal cortex white matter connections in bipolar disorder: a DTI tractography study. J Affect Disord. 2011;131:299–306. doi: 10.1016/j.jad.2010.12.018. [DOI] [PubMed] [Google Scholar]
- Mahon K, Wu J, Malhotra AK, Burdick KE, DeRosse P, Ardekani BA, Szeszko PR. A voxel-based diffusion tensor imaging study of white matter in bipolar disorder. Neuropsychopharmacology. 2009;34:1590–1600. doi: 10.1038/npp.2008.216. [DOI] [PMC free article] [PubMed] [Google Scholar]
- Mai JK, Assheuer J, Paxinos G. Atlas of the Human Brain. San Diego, CA: Academic Press; 1997. [Google Scholar]
- Mandolesi L, Addona F, Foti F, Menghini D, Petrosini L, Vicari S. Spatial competences in Williams syndrome: a radial arm maze study. Int J Dev Neurosci. 2009;27:205–213. doi: 10.1016/j.ijdevneu.2009.01.004. [DOI] [PubMed] [Google Scholar]
- Marenco S, Siuta MA, Kippenhan JS, Grodofsky S, Chang WL, Kohn P, Mervis CB, Morris CA, Weinberger DR, Meyer-Lindenberg A, et al. Genetic contributions to white matter architecture revealed by diffusion tensor imaging in Williams syndrome. Proc Natl Acad Sci USA. 2007;104:15117–15122. doi: 10.1073/pnas.0704311104. [DOI] [PMC free article] [PubMed] [Google Scholar]
- Martens MA, Wilson SJ, Dudgeon P, Reutens DC. Approachability and the amygdala: insights from Williams syndrome. Neuropsychologia. 2009;47:2446–2453. doi: 10.1016/j.neuropsychologia.2009.04.017. [DOI] [PubMed] [Google Scholar]
- Martens MA, Wilson SJ, Reutens DC. Research Review: Williams syndrome: a critical review of the cognitive, behavioral, and neuroanatomical phenotype. J Child Psychol Psychiatry. 2008;49:576–608. doi: 10.1111/j.1469-7610.2008.01887.x. [DOI] [PubMed] [Google Scholar]
- Martino J, Brogna C, Robles SG, Vergani F, Duffau H. Anatomic dissection of the inferior fronto-occipital fasciculus revisited in the lights of brain stimulation data. Cortex. 2010;46:691–699. doi: 10.1016/j.cortex.2009.07.015. [DOI] [PubMed] [Google Scholar]
- Mazziotta J, Toga A, Evans A, Fox P, Lancaster J, Zilles K, Woods R, Paus T, Simpson G, Pike B, et al. A probabilistic atlas and reference system for the human brain: International Consortium for Brain Mapping (ICBM) Philos Trans R Soc Lond B Biol Sci. 2001;356:1293–1322. doi: 10.1098/rstb.2001.0915. [DOI] [PMC free article] [PubMed] [Google Scholar]
- Mazziotta JC, Toga AW, Evans A, Fox P, Lancaster J. A probabilistic atlas of the human brain: theory and rationale for its development. The International Consortium for Brain Mapping (ICBM) Neuroimage. 1995;2:89–101. doi: 10.1006/nimg.1995.1012. [DOI] [PubMed] [Google Scholar]
- Meda SA, Pryweller JR, Thornton-Wells TA. Regional brain differences in cortical thickness, surface area and subcortical volume in individuals with williams syndrome. PLoS One. 2012;7:e31913. doi: 10.1371/journal.pone.0031913. [DOI] [PMC free article] [PubMed] [Google Scholar]
- Meng Y, Zhang Y, Tregoubov V, Janus C, Cruz L, Jackson M, Lu WY, MacDonald JF, Wang JY, Falls DL, et al. Abnormal spine morphology and enhanced LTP in LIMK-1 knockout mice. Neuron. 2002;35:121–133. doi: 10.1016/s0896-6273(02)00758-4. [DOI] [PubMed] [Google Scholar]
- Mervis CB, Morris CA, Klein-Tasman BP, Bertrand J, Kwitny S, Appelbaum LG, Rice CE. Attentional characteristics of infants and toddlers with Williams syndrome during triadic interactions. Dev Neuropsychol. 2003;23:243–268. doi: 10.1080/87565641.2003.9651894. [DOI] [PubMed] [Google Scholar]
- Meyer-Lindenberg A, Hariri AR, Munoz KE, Mervis CB, Mattay VS, Morris CA, Berman KF. Neural correlates of genetically abnormal social cognition in Williams syndrome. Nat Neurosci. 2005;8:991–993. doi: 10.1038/nn1494. [DOI] [PubMed] [Google Scholar]
- Meyer-Lindenberg A, Mervis CB, Berman KF. Neural mechanisms in Williams syndrome: a unique window to genetic influences on cognition and behaviour. Nat Rev Neurosci. 2006;7:380–393. doi: 10.1038/nrn1906. [DOI] [PubMed] [Google Scholar]
- Meyer-Lindenberg A, Mervis CB, Sarpal D, Koch P, Steele S, Kohn P, Marenco S, Morris CA, Das S, Kippenhan S, et al. Functional, structural, and metabolic abnormalities of the hippocampal formation in Williams syndrome. J Clin Invest. 2005;115:1888–1895. doi: 10.1172/JCI24892. [DOI] [PMC free article] [PubMed] [Google Scholar]
- Mimura M, Hoeft F, Kato M, Kobayashi N, Sheau K, Piggot J, Mills D, Galaburda A, Korenberg JR, Bellugi U, et al. A preliminary study of orbitofrontal activation and hypersociability in Williams Syndrome. J Neurodev Disord. 2010;2:93–98. doi: 10.1007/s11689-009-9041-8. [DOI] [PMC free article] [PubMed] [Google Scholar]
- Munoz KE, Meyer-Lindenberg A, Hariri AR, Mervis CB, Mattay VS, Morris CA, Berman KF. Abnormalities in neural processing of emotional stimuli in Williams syndrome vary according to social vs. non-social content. Neuroimage. 2010;50:340–346. doi: 10.1016/j.neuroimage.2009.11.069. [DOI] [PMC free article] [PubMed] [Google Scholar]
- Nichols TE, Holmes AP. Nonparametric permutation tests for functional neuroimaging: a primer with examples. Hum Brain Mapp. 2002;15:1–25. doi: 10.1002/hbm.1058. [DOI] [PMC free article] [PubMed] [Google Scholar]
- O'Doherty J, Kringelbach ML, Rolls ET, Hornak J, Andrews C. Abstract reward and punishment representations in the human orbitofrontal cortex. Nat Neurosci. 2001;4:95–102. doi: 10.1038/82959. [DOI] [PubMed] [Google Scholar]
- O'Hearn K, Roth JK, Courtney SM, Luna B, Street W, Terwillinger R, Landau B. Object recognition in Williams syndrome: uneven ventral stream activation. Dev Sci. 2011;14:549–565. doi: 10.1111/j.1467-7687.2010.01002.x. [DOI] [PMC free article] [PubMed] [Google Scholar]
- Oishi K, Akhter K, Mielke M, Ceritoglu C, Zhang J, Jiang H, Li X, Younes L, Miller MI, van Zijl PC, et al. Multi-modal MRI analysis with disease-specific spatial filtering: initial testing to predict mild cognitive impairment patients who convert to Alzheimer's disease. Front Neurol. 2011;2:54. doi: 10.3389/fneur.2011.00054. [DOI] [PMC free article] [PubMed] [Google Scholar]
- Oishi K, Faria A, Jiang H, Li X, Akhter K, Zhang J, Hsu JT, Miller MI, van Zijl PC, Albert M, et al. Atlas-based whole brain white matter analysis using large deformation diffeomorphic metric mapping: application to normal elderly and Alzheimer's disease participants. Neuroimage. 2009;46:486–499. doi: 10.1016/j.neuroimage.2009.01.002. [DOI] [PMC free article] [PubMed] [Google Scholar]
- Oishi K, Mielke MM, Albert M, Lyketsos CG, Mori S. DTI analyses and clinical applications in Alzheimer's disease. J Alzheimers Dis. 2011;26(Suppl 3):287–296. doi: 10.3233/JAD-2011-0007. [DOI] [PMC free article] [PubMed] [Google Scholar]
- Osborne LR. Animal models of Williams syndrome. Am J Med Genet C Semin Med Genet. 2010;154C:209–219. doi: 10.1002/ajmg.c.30257. [DOI] [PMC free article] [PubMed] [Google Scholar]
- Papagno C, Miracapillo C, Casarotti A, Romero Lauro LJ, Castellano A, Falini A, Casaceli G, Fava E, Bello L. What is the role of the uncinate fasciculus? Surgical removal and proper name retrieval. Brain. 2011;134:405–414. doi: 10.1093/brain/awq283. [DOI] [PubMed] [Google Scholar]
- Peltier J, Verclytte S, Delmaire C, Pruvo JP, Godefroy O, Le Gars D. Microsurgical anatomy of the temporal stem: clinical relevance and correlations with diffusion tensor imaging fiber tracking. J Neurosurg. 2010;112:1033–1038. doi: 10.3171/2009.6.JNS08132. [DOI] [PubMed] [Google Scholar]
- Phelps EA, LeDoux JE. Contributions of the amygdala to emotion processing: from animal models to human behavior. Neuron. 2005;48:175–187. doi: 10.1016/j.neuron.2005.09.025. [DOI] [PubMed] [Google Scholar]
- Philippi CL, Mehta S, Grabowski T, Adolphs R, Rudrauf D. Damage to association fiber tracts impairs recognition of the facial expression of emotion. J Neurosci. 2009;29:15089–15099. doi: 10.1523/JNEUROSCI.0796-09.2009. [DOI] [PMC free article] [PubMed] [Google Scholar]
- Plesa-Skwerer D, Faja S, Schofield C, Verbalis A, Tager-Flusberg H. Perceiving facial and vocal expressions of emotion in individuals with Williams syndrome. Am J Ment Retard. 2006;111:15–26. doi: 10.1352/0895-8017(2006)111[15:PFAVEO]2.0.CO;2. [DOI] [PubMed] [Google Scholar]
- Porter MA, Coltheart M, Langdon R. Theory of mind in Williams syndrome assessed using a nonverbal task. J Autism Dev Disord. 2008;38:806–814. doi: 10.1007/s10803-007-0447-4. [DOI] [PubMed] [Google Scholar]
- Reiss AL, Eckert MA, Rose FE, Karchemskiy A, Kesler S, Chang M, Reynolds MF, Kwon H, Galaburda A. An experiment of nature: brain anatomy parallels cognition and behavior in Williams syndrome. J Neurosci. 2004;24:5009–5015. doi: 10.1523/JNEUROSCI.5272-03.2004. [DOI] [PMC free article] [PubMed] [Google Scholar]
- Riby DM, Hancock PJ. Viewing it differently: social scene perception in Williams syndrome and Autism. Neuropsychologia. 2008;46:2855–2860. doi: 10.1016/j.neuropsychologia.2008.05.003. [DOI] [PubMed] [Google Scholar]
- Riby DM, Jones N, Brown PH, Robinson LJ, Langton SR, Bruce V, Riby LM. Attention to faces in williams syndrome. J Autism Dev Disord. 2011;41:1228–1239. doi: 10.1007/s10803-010-1141-5. [DOI] [PubMed] [Google Scholar]
- Robinson BF, Mervis CB, Robinson BW. The roles of verbal short-term memory and working memory in the acquisition of grammar by children with Williams syndrome. Dev Neuropsychol. 2003;23:13–31. doi: 10.1080/87565641.2003.9651885. [DOI] [PubMed] [Google Scholar]
- Sampaio A, Sousa N, Fernandez M, Vasconcelos C, Shenton ME, Goncalves OF. Williams syndrome and memory: a neuroanatomic and cognitive approach. J Autism Dev Disord. 2010;40:870–877. doi: 10.1007/s10803-010-0940-z. [DOI] [PubMed] [Google Scholar]
- Santos A, Deruelle C. Verbal peaks and visual valleys in theory of mind ability in Williams syndrome. J Autism Dev Disord. 2009;39:651–659. doi: 10.1007/s10803-008-0669-0. [DOI] [PubMed] [Google Scholar]
- Sarkar S, Craig MC, Catani M, Dell'acqua F, Fahy T, Deeley Q, Murphy DG. Frontotemporal white-matter microstructural abnormalities in adolescents with conduct disorder: a diffusion tensor imaging study. Psychol Med. 2013;43:401–411. doi: 10.1017/S003329171200116X. [DOI] [PubMed] [Google Scholar]
- Sarpal D, Buchsbaum BR, Kohn PD, Kippenhan JS, Mervis CB, Morris CA, Meyer-Lindenberg A, Berman KF. A genetic model for understanding higher order visual processing: functional interactions of the ventral visual stream in Williams syndrome. Cereb Cortex. 2008;18:2402–2409. doi: 10.1093/cercor/bhn004. [DOI] [PMC free article] [PubMed] [Google Scholar]
- Schmahmann JD, Pandya DN. The complex history of the fronto-occipital fasciculus. J Hist Neurosci. 2007;16:362–377. doi: 10.1080/09647040600620468. [DOI] [PubMed] [Google Scholar]
- Sen PN, Basser PJ. A model for diffusion in white matter in the brain. Biophys J. 2005;89:2927–2938. doi: 10.1529/biophysj.105.063016. [DOI] [PMC free article] [PubMed] [Google Scholar]
- Skwerer DP, Verbalis A, Schofield C, Faja S, Tager-Flusberg H. Social-perceptual abilities in adolescents and adults with Williams syndrome. Cogn Neuropsychol. 2006;23:338–349. doi: 10.1080/02643290542000076. [DOI] [PubMed] [Google Scholar]
- Smith SM, Jenkinson M, Johansen-Berg H, Rueckert D, Nichols TE, Mackay CE, Watkins KE, Ciccarelli O, Cader MZ, Matthews PM, et al. Tract-based spatial statistics: voxelwise analysis of multi-subject diffusion data. Neuroimage. 2006;31:1487–1505. doi: 10.1016/j.neuroimage.2006.02.024. [DOI] [PubMed] [Google Scholar]
- Smith SM, Nichols TE. Threshold-free cluster enhancement: addressing problems of smoothing, threshold dependence and localisation in cluster inference. Neuroimage. 2009;44:83–98. doi: 10.1016/j.neuroimage.2008.03.061. [DOI] [PubMed] [Google Scholar]
- Song SK, Sun SW, Ju WK, Lin SJ, Cross AH, Neufeld AH. Diffusion tensor imaging detects and differentiates axon and myelin degeneration in mouse optic nerve after retinal ischemia. Neuroimage. 2003;20:1714–1722. doi: 10.1016/j.neuroimage.2003.07.005. [DOI] [PubMed] [Google Scholar]
- Song SK, Sun SW, Ramsbottom MJ, Chang C, Russell J, Cross AH. Dysmyelination revealed through MRI as increased radial (but unchanged axial) diffusion of water. Neuroimage. 2002;17:1429–1436. doi: 10.1006/nimg.2002.1267. [DOI] [PubMed] [Google Scholar]
- Thomas C, Moya L, Avidan G, Humphreys K, Jung KJ, Peterson MA, Behrmann M. Reduction in white matter connectivity, revealed by diffusion tensor imaging, may account for age-related changes in face perception. J Cogn Neurosci. 2008;20:268–284. doi: 10.1162/jocn.2008.20025. [DOI] [PMC free article] [PubMed] [Google Scholar]
- Thomas MS, Annaz D, Ansari D, Scerif G, Jarrold C, Karmiloff-Smith A. Using developmental trajectories to understand developmental disorders. J Speech Lang Hear Res. 2009;52:336–358. doi: 10.1044/1092-4388(2009/07-0144). [DOI] [PubMed] [Google Scholar]
- Thompson PM, Lee AD, Dutton RA, Geaga JA, Hayashi KM, Eckert MA, Bellugi U, Galaburda AM, Korenberg JR, Mills DL, et al. Abnormal cortical complexity and thickness profiles mapped in Williams syndrome. J Neurosci. 2005;25:4146–4158. doi: 10.1523/JNEUROSCI.0165-05.2005. [DOI] [PMC free article] [PubMed] [Google Scholar]
- Thompson PM, Woods RP, Mega MS, Toga AW. Mathematical/computational challenges in creating deformable and probabilistic atlases of the human brain. Hum Brain Mapp. 2000;9:81–92. doi: 10.1002/(SICI)1097-0193(200002)9:2<81::AID-HBM3>3.0.CO;2-8. [DOI] [PMC free article] [PubMed] [Google Scholar]
- Thornton-Wells TA, Avery SN, Blackford JU. Using novel control groups to dissect the amygdala's role in Williams syndrome. Dev Cogn Neurosci. 2011;1:295–304. doi: 10.1016/j.dcn.2011.03.003. [DOI] [PMC free article] [PubMed] [Google Scholar]
- Tomc SA, Williamson NK, Pauli RM. Temperament in Williams syndrome. Am J Med Genet. 1990;36:345–352. doi: 10.1002/ajmg.1320360321. [DOI] [PubMed] [Google Scholar]
- Triesch J, Teuscher C, Deak GO, Carlson E. Gaze following: why (not) learn it? Dev Sci. 2006;9:125–147. doi: 10.1111/j.1467-7687.2006.00470.x. [DOI] [PubMed] [Google Scholar]
- Versace A, Almeida JR, Hassel S, Walsh ND, Novelli M, Klein CR, Kupfer DJ, Phillips ML. Elevated left and reduced right orbitomedial prefrontal fractional anisotropy in adults with bipolar disorder revealed by tract-based spatial statistics. Arch Gen Psychiatry. 2008;65:1041–1052. doi: 10.1001/archpsyc.65.9.1041. [DOI] [PMC free article] [PubMed] [Google Scholar]
- Vos SB, Jones DK, Viergever MA, Leemans A. Partial volume effect as a hidden covariate in DTI analyses. Neuroimage. 2011;55:1566–1576. doi: 10.1016/j.neuroimage.2011.01.048. [DOI] [PubMed] [Google Scholar]
- Wang JY, Abdi H, Bakhadirov K, Diaz-Arrastia R, Devous MD., Sr. A comprehensive reliability assessment of quantitative diffusion tensor tractography. Neuroimage. 2012;60:1127–1138. doi: 10.1016/j.neuroimage.2011.12.062. [DOI] [PMC free article] [PubMed] [Google Scholar]
- Wechsler D. Wechsler Intelligence Scale for Children-Fourth Edition (WISC-IV) 4th ed. San Antonio: The Psychological Corporation; 2003. [Google Scholar]
- Weinstein M, Ben-Sira L, Levy Y, Zachor DA, Ben Itzhak E, Artzi M, Tarrasch R, Eksteine PM, Hendler T, Ben Bashat D. Abnormal white matter integrity in young children with autism. Hum Brain Mapp. 2011;32:534–543. doi: 10.1002/hbm.21042. [DOI] [PMC free article] [PubMed] [Google Scholar]
- Wen W, He Y, Sachdev P. Structural brain networks and neuropsychiatric disorders. Curr Opin Psychiatry. 2011;24:219–225. doi: 10.1097/YCO.0b013e32834591f8. [DOI] [PubMed] [Google Scholar]
- Wilson JL, Jenkinson M, Jezzard P. Protocol to determine the optimal intraoral passive shim for minimisation of susceptibility artifact in human inferior frontal cortex. Neuroimage. 2003;19:1802–1811. doi: 10.1016/s1053-8119(03)00225-8. [DOI] [PubMed] [Google Scholar]
- Woods RP, Grafton ST, Watson JDG, Sicotte NL, Mazziotta JC. Automated image registration: II. Intersubject validation of linear and nonlinear models. J Comput Assist Tomogr. 1998;22:153–165. doi: 10.1097/00004728-199801000-00028. [DOI] [PubMed] [Google Scholar]
- Xu J, Potenza MN. White matter integrity and five-factor personality measures in healthy adults. Neuroimage. 2012;59:800–807. doi: 10.1016/j.neuroimage.2011.07.040. [DOI] [PMC free article] [PubMed] [Google Scholar]
- Zhang A, Leow A, Ajilore O, Lamar M, Yang S, Joseph J, Medina J, Zhan L, Kumar A. Quantitative tract-specific measures of uncinate and cingulum in major depression using diffusion tensor imaging. Neuropsychopharmacology. 2012;37:959–967. doi: 10.1038/npp.2011.279. [DOI] [PMC free article] [PubMed] [Google Scholar]
- Zhang B, Zhang JG, Zhao H, Zhang X, Li M, Qian L, Wang K, Tian CS, Guo WH, Cao QY, et al. Evaluation of apparent diffusion coefficient mappings in amnestic mild cognitive impairment using an image analysis software brain search. Acta Radiol. 2011;52:1147–1154. doi: 10.1258/ar.2011.100430. [DOI] [PubMed] [Google Scholar]
- Zhao C, Aviles C, Abel RA, Almli CR, McQuillen P, Pleasure SJ. Hippocampal and visuospatial learning defects in mice with a deletion of frizzled 9: a gene in the Williams syndrome deletion interval. Development. 2005;132:2917–2927. doi: 10.1242/dev.01871. [DOI] [PubMed] [Google Scholar]
Associated Data
This section collects any data citations, data availability statements, or supplementary materials included in this article.